
Abstract
We focus on characterizing cell lines from young and aged-healthy and -AML (acute myeloid leukemia) cell lines, and our goal is to identify the key markers associated with the progression of AML. To characterize the age-related phenotypes in AML cell lines, we consider eigenCell analysis that effectively encapsulates the primary expression level patterns across the cell lines. However, earlier investigations utilizing eigenGenes and eigenCells analysis were based on linear combination of all features, leading to the disturbance from noise features. Moreover, the analysis based on a fully dense loading matrix makes it challenging to interpret the results of eigenCells analysis. In order to address these challenges, we develop a novel computational approach termed network-constrained eigenCells profile estimation, which employs a sparse learning strategy. The proposed method estimates eigenCell based on not only the lasso but also network constrained penalization. The use of the network-constrained penalization enables us to simultaneously select neighborhood genes. Furthermore, the hub genes and their regulator/target genes are easily selected as crucial markers for eigenCells estimation. That is, our method can incorporate insights from network biology into the process of sparse loading estimation. Through our methodology, we estimate sparse eigenCells profiles, where only critical markers exhibit expression levels. This allows us to identify the key markers associated with a specific phenotype. Monte Carlo simulations demonstrate the efficacy of our method in reconstructing the sparse structure of eigenCells profiles. We employed our approach to unveil the regulatory system of immunogenes in both young/aged-healthy and -AML cell lines. The markers we have identified for the age-related phenotype in both healthy and AML cell lines have garnered strong support from previous studies. Specifically, our findings, in conjunction with the existing literature, indicate that the activities within this subnetwork of CD79A could be pivotal in elucidating the mechanism driving AML progression, particularly noting the significant role played by the diminished activities in the CD79A subnetwork. We expect that the proposed method will be a useful tool for characterizing disease-related subsets of cell lines, encompassing phenotypes and clones.
INTRODUCTION
Acute myeloid leukemia (AML) is a fast-progressing cancer that can lead to rapid fatality if not promptly addressed, particularly affecting people of older age (Jayavelu et al., 2022; Zjablovskaja and Florian, 2019). The dysregulation of immune responses, including innate immune and inflammatory pathways, is strongly associated with the development of abnormalities in hematopoietic stem and progenitor cells, which play a crucial role in the pathogenesis of myelodysplastic syndrome (MDS) and AML (Putnam et al., 2023). Moreover, the immune surveillance mechanisms, which encompass the adaptive and innate immune systems, are inherently crafted to eradicate the development of AML (Taghiloo and Asgarian-Omran, 2021).
Single-cell technologies have considerably advanced, and single-cell RNA-seq widely used in various fields of research. To effectively analyze the single-cell dataset, various computational strategies have been developed and used. Many popular packages, such as, Seurat, Monocle, Scanpy, and orchestrating single-cell analysis, have been proposed for analysis of single-cell RNA-seq (Stuart et al., 2019; Wolf et al., 2018; Trapnell et al., 2014; Amezquita et al., 2020). Dohmen et al. (2022) developed a machine learning pipeline for distinguishing tumor cells from normal cells at the single-cell levels. Furthermore, supervised machine learning strategies, such as, logistic regression, support vector machines, random forests, neural networks, and light gradient boosting machine, have been widely used to classify cell types using single-cell RNA-seq datasets (Le et al., 2022).
In this study, we focus on the immunogene regulatory system in both healthy and AML cell lines because immune dysfunction is important for AML pathogenesis, and understanding of immunobiology of AML is critical for immunotherapy (Khaldoyanidi et al., 2021). Especially, we consider highlighting the unique characteristics specific to young and aged cell lines. To characterize disease-related phenotype, eigenGene and eigenCells analysis has been utilized for various purposes, including the characterization of disease-related phenotypes, gene expression clustering, marker identification, and pathways reconstruction (Mansfeldt et al., 2015; Singh et al., 2020; Alter and Golub, 2005). We employ eigenCells analysis to characterize cell lines of both young/aged-healthy and those with AML. Although the eigenGenes and eigenCells analysis has been widely used, the previous research has predominantly utilized a fully dense loading matrix in singular value decomposition (SVD). However, fully dense loadings may be affected by noise features, as the loading matrix is estimated by a linear combination of all features, which unavoidably includes elements of noise. In addition, the use of fully dense loadings estimated from all features can make it difficult to interpret the results of eigenCell analysis.
To address the issues, we adopt sparse loading estimation in accordance with sparse principal component analysis (sparse PCA) (Zou et al., 2006). Furthermore, we draw attention to a shortcoming in current machine learning methodologies, which are predominantly designed from computational and algorithmic perspectives. This can result in a lack of biologically meaningful interpretations. To ensure biologically reliable results in eigenCells analysis, we introduce a novel computational approach called network-constrained eigenCells profile estimation (nwEigenCELLs). This method incorporates knowledge from network biology, recognizing that genes connected within networks may share similar biological functions, and that hub genes, which are highly connected in the estimated gene network, play a crucial role in gene regulation and biological processes during the sparse eigenCell profile estimation procedure. With the proposed nwEigenCELLs method, we are able to simultaneously select linked genes. Additionally, hub genes and their regulator/target genes tend to have relatively large coefficients and/or are easily selected as crucial markers for eigenCells profile estimation. Consequently, we can interpret the results of eigenCells analysis by focusing on the sub-network (i.e., specific pathway) comprising hub genes, along with their target and regulator genes. It implies that our strategy produces biologically meaningful outcomes.
The effectiveness of our proposed method is illustrated through Monte Carlo simulations. The nwEigenCELLs method demonstrates remarkable performance in recovering the sparse structure of the loading matrix and producing stable results. We apply our strategy to the publicly accessible single-cell gene expression data (Triana et al., 2021) to uncover the immune system traits of young/aged-healthy and -AML cell lines. We use “3 healthy young and 3 healthy old bone marrow donors” and “15 leukemic bone marrow donors” datasets. The immunogenes annotated in the immune system process pathway of Gene Ontology term analysis are extracted. We then uncover eigenCell profiles of the immunogene for four phenotypes and their molecular interplays. The AML immune markers we’ve identified are supported by robust evidence as potential biomarkers for AML. Specifically, the loss of activities of the identified CD79 subnetwork, which includes CD79A, CD79B, CD20, IGHM, IGHD, and IGKC, are likely markers of AML progression. Furthermore, S100A family’s hubness is regarded as a characteristic feature of young cell lines. The results of our scRNA-seq analysis, combined with existing literature, suggest that the reduction in activities within the CD79A subnetwork may play a pivotal role in the progression of AML. Moreover, activators of this subnetwork may offer essential insights for AML prevention.
The remainder of this paper is organized as follows: The methods section introduces the proposed strategy, nwEiegenCELLs. We also introduce computation strategies for gene network estimation and regularization parameter selection in the methods section. Then, we show the results of simulation studies in the Monte Carlo simulations section. Finally, we describe the results of young/aged-healthy and -AML-specific immunogene regulatory system identification. The Discussion section offers the conclusions.
NETWORK-CONSTRAINED SINGULAR VALUE DECOMPOSITION
The expression matrix of p genes across n cell lines is represented as
We characterize a specific phenotype by the expression levels of eigenCells. This means that the characteristic of a group of cells is described by the eigenCells module,
The EC captures vital information regarding the expression profiles of n cell lines within a specific phenotype. That is, the eigenCells serve as a summary of the principal pattern of expression levels of cell lines, and thus can be considered as pivotal modules for characterizing the phenotype.
Although the SVD is a useful tool to determine the expression levels of eigenGenes and eigenCells that characterize the overall expression of a specific phenotype, previous studies have conducted eigen-Gene and -Cell analysis using the fully dense loading matrix
In order to address this issue, we consider the following sparse PCA to estimate sparse expression levels of eigenCells (Zou et al., 2006).
To attain more biologically reliable results in sparse eigenCells profile estimation, we develop a novel computational strategy that integrates the following knowledge of network biology into the process of sparse loading estimation.
Genes that are interconnected in the networks may share similar biological functions.
We encourage similarity in gene coefficients for linked genes when estimating the expression levels of eigenCells.
Hub genes, which are connected to a multitude of other genes, play a pivotal role in gene regulation and various biological processes (Yu et al., 2017).
In the estimation of the eigenCells profile, we regard hub genes as crucial markers and encourage that the hubgenes are easily selected.
The estimated gene network can be given as a weighted graph
We develop a novel machine learning approach, nwEigenCELLs, which integrates the network biology knowledge using network-constrained regularization (Sun et al., 2014),
The algorithm of nwEigenCELLs is given as follows:
The input and output of the algorithm are expression levels of all genes and expression levels of eigenCells, respectively.
Regularization Parameter Selection
Selecting the appropriate regularization parameters is a critical issue of sparse eigenCell analysis, as the outcomes of the proposed nwEigenCELLs heavily depend on the parameters λ1 and λ2. We employ the Bayesian Information Criterion presented in Guo et al. (2010) to choose the appropriate regularization parameters.
We employ Monte Carlo simulations to investigate the performance of the proposed nwEigenCELLs. The simulation scenarios are designed to be consistent with the benchmarks established in previous studies (Zou et al., 2006; Guo et al., 2010). We evaluate that the methods can identify crucial features in loading estimation, that is, true positive and true negative in sparse loading estimation.
Simulation 1
The n × p data matrix
The n × p data matrix
We set n = 20, and the simulations are replicated 500 times. In simulation study, we first compute covariance of
Simulation Results
Simulation Results
Median values of the first two loading vectors, where the values in parentheses is the median absolute deviation over 500 replications (
FSPCA, fused loading-based sparse PCA; PCA, principal component analysis; SPCA, ordinary sparse PCA.
Simulation Results
Median values of the first two loading vectors, where the values in parentheses is the median absolute deviation over 500 replications (
FSPCA, fused loading-based sparse PCA; PCA, principal component analysis; SPCA, ordinary sparse PCA.
We also consider the simulation situation with the number of features p = 50 (i.e., p > n).
The features
The features
The median values of the first two loading vectors for
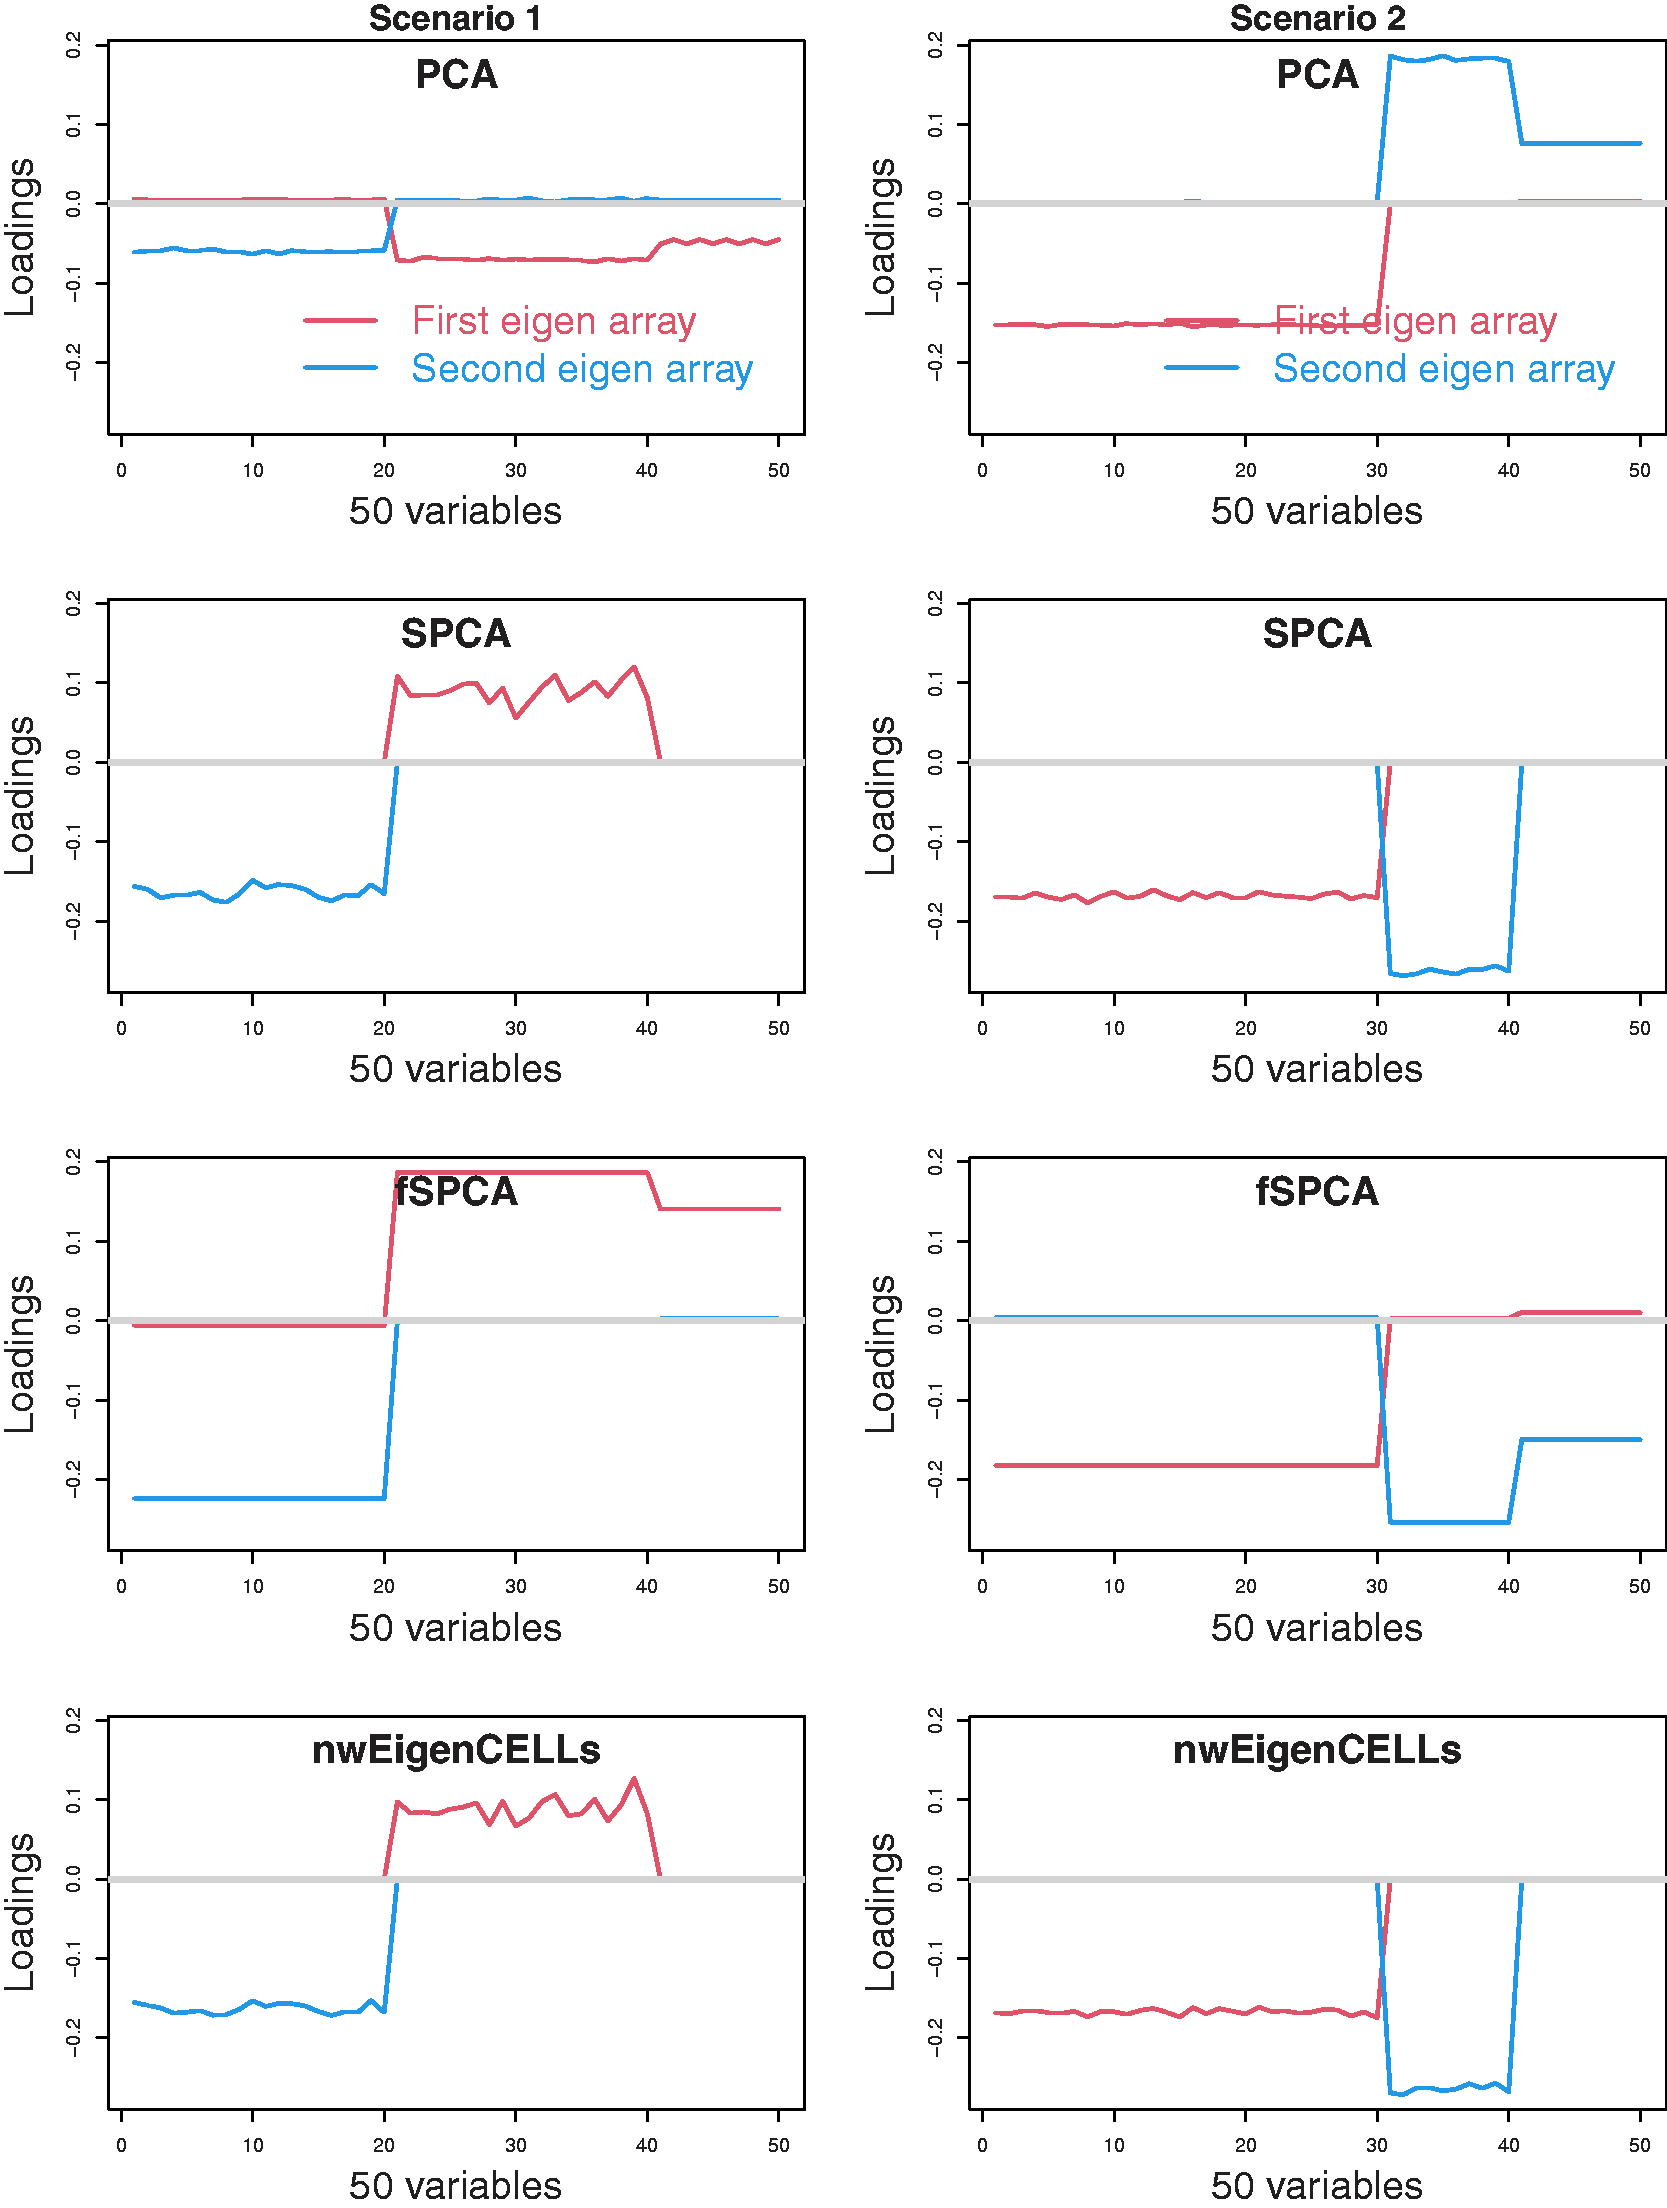
The median the first two loadings for
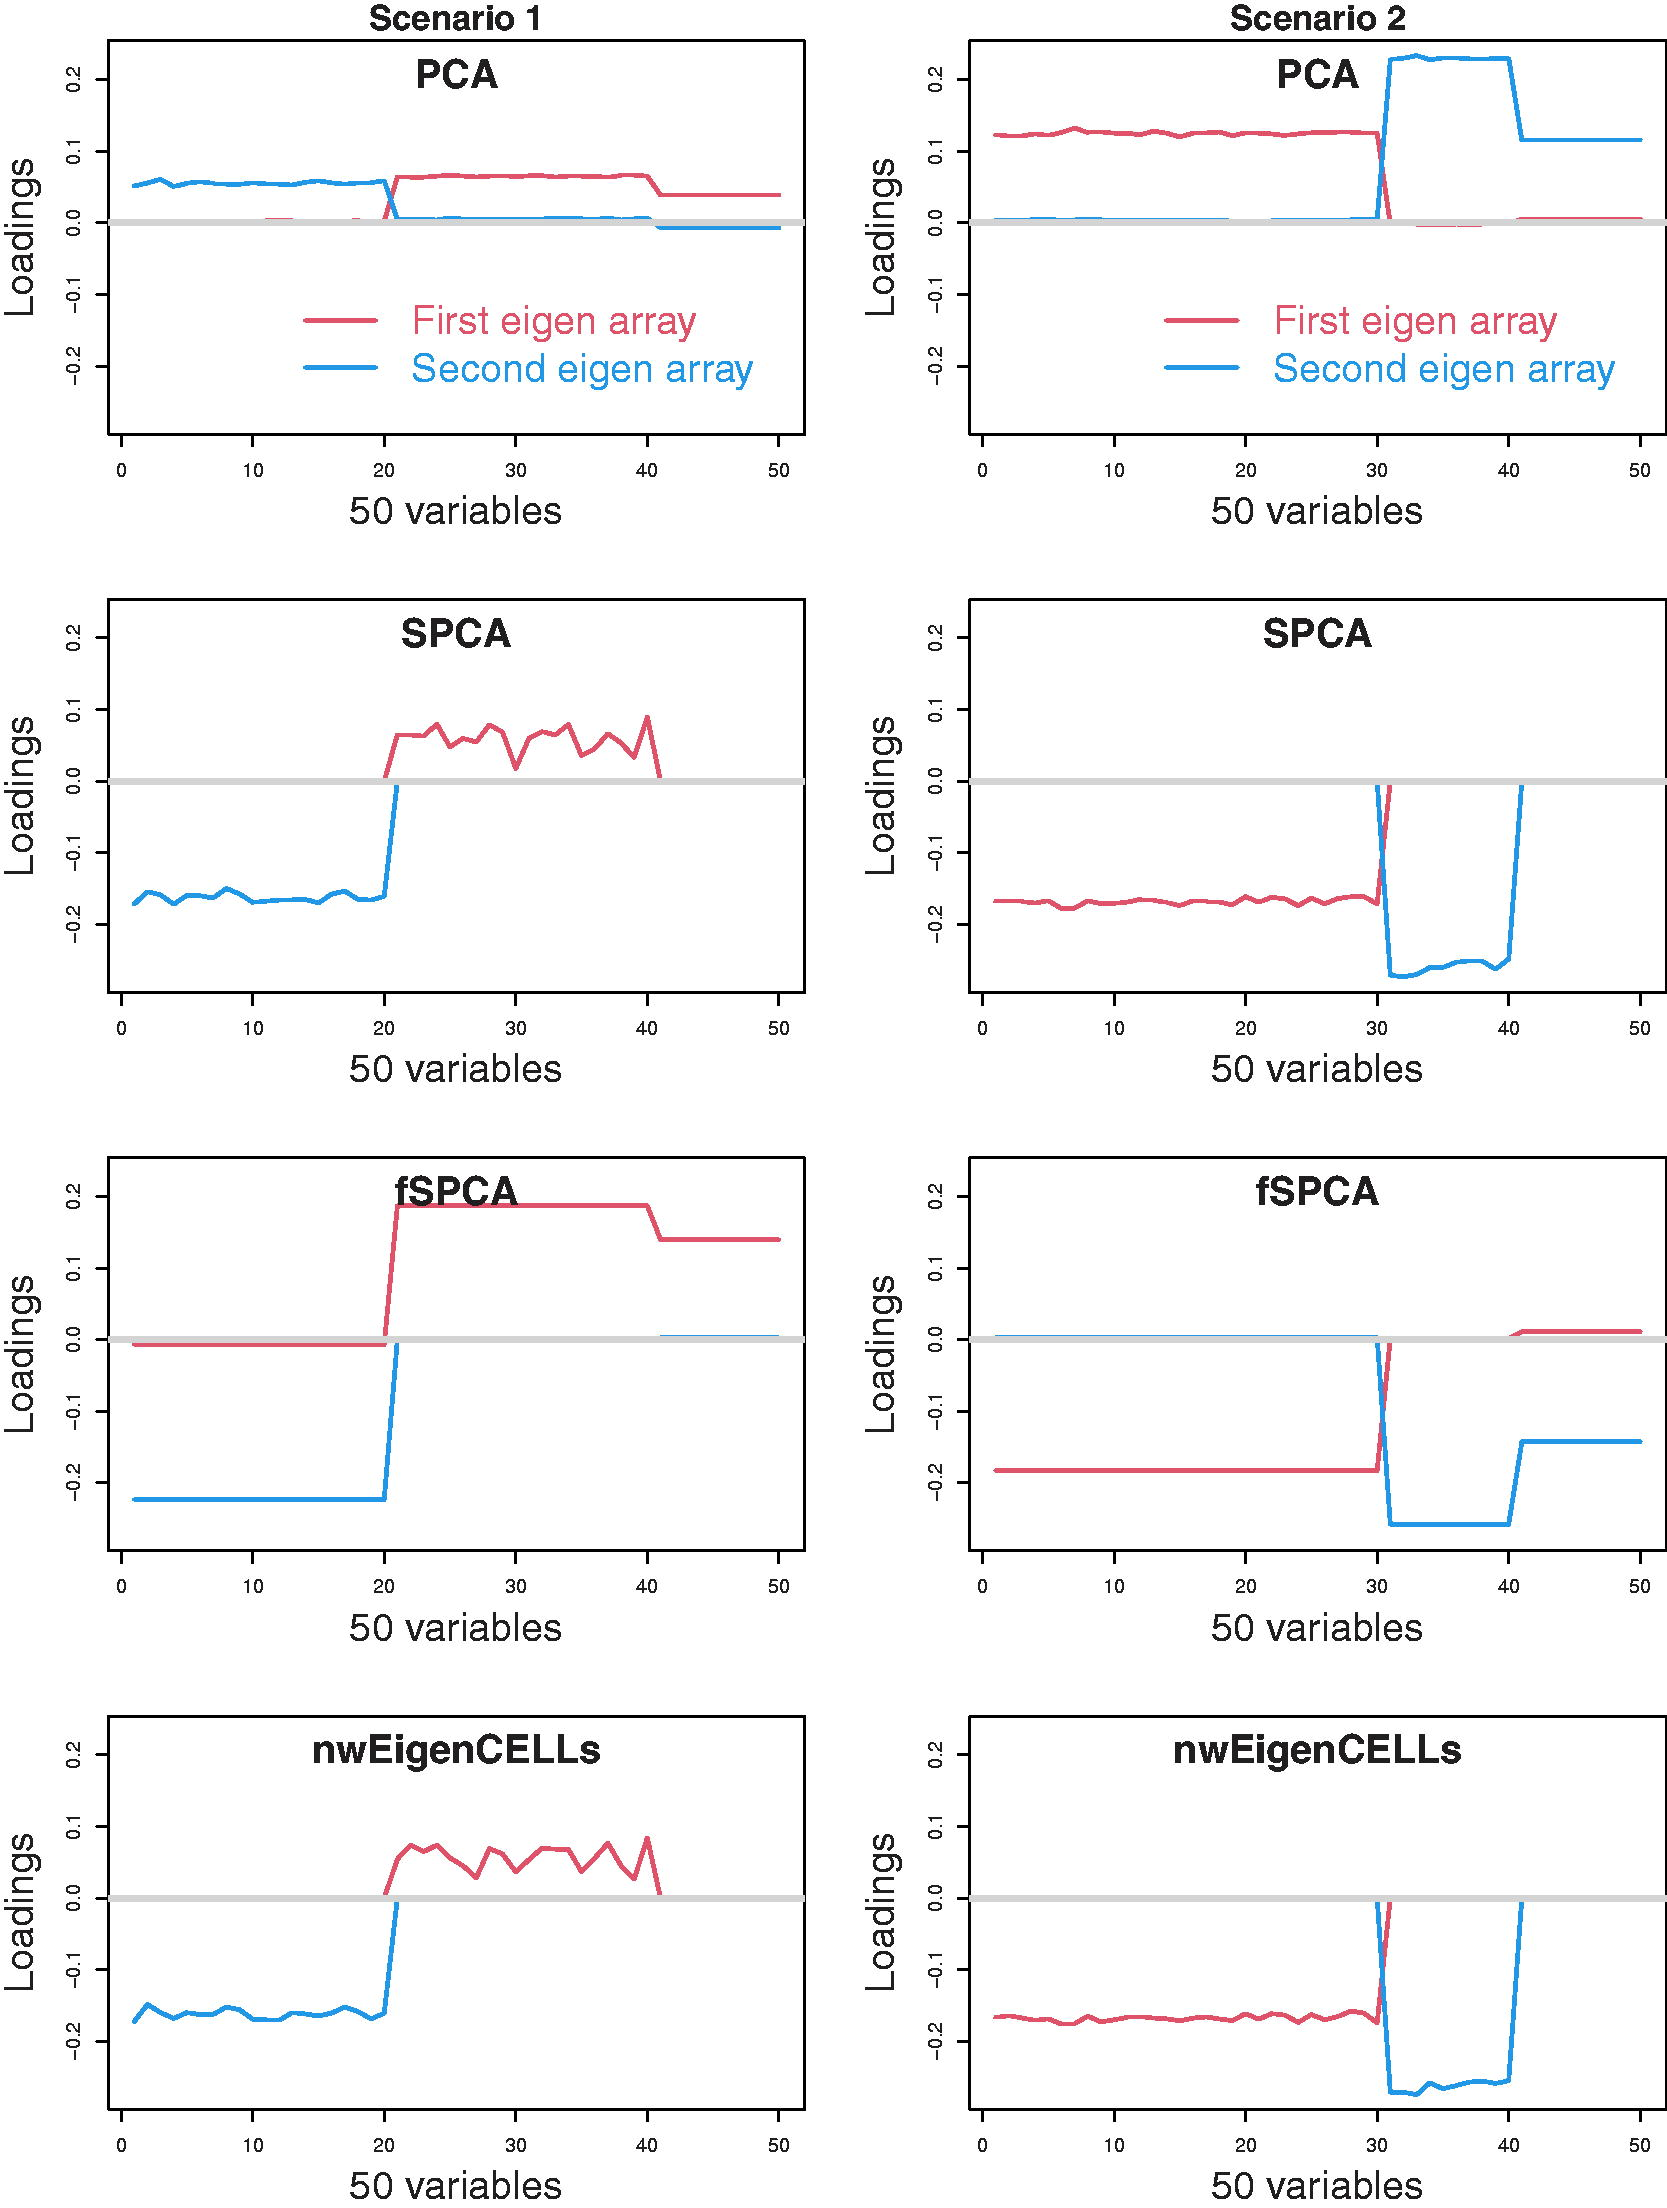
The median the first two loadings for
The simulation studies for p = 150 (i.e., p > n) are also conducted.
The features
The features
Figures 3 and 4 show the median values of the first two loading vectors for
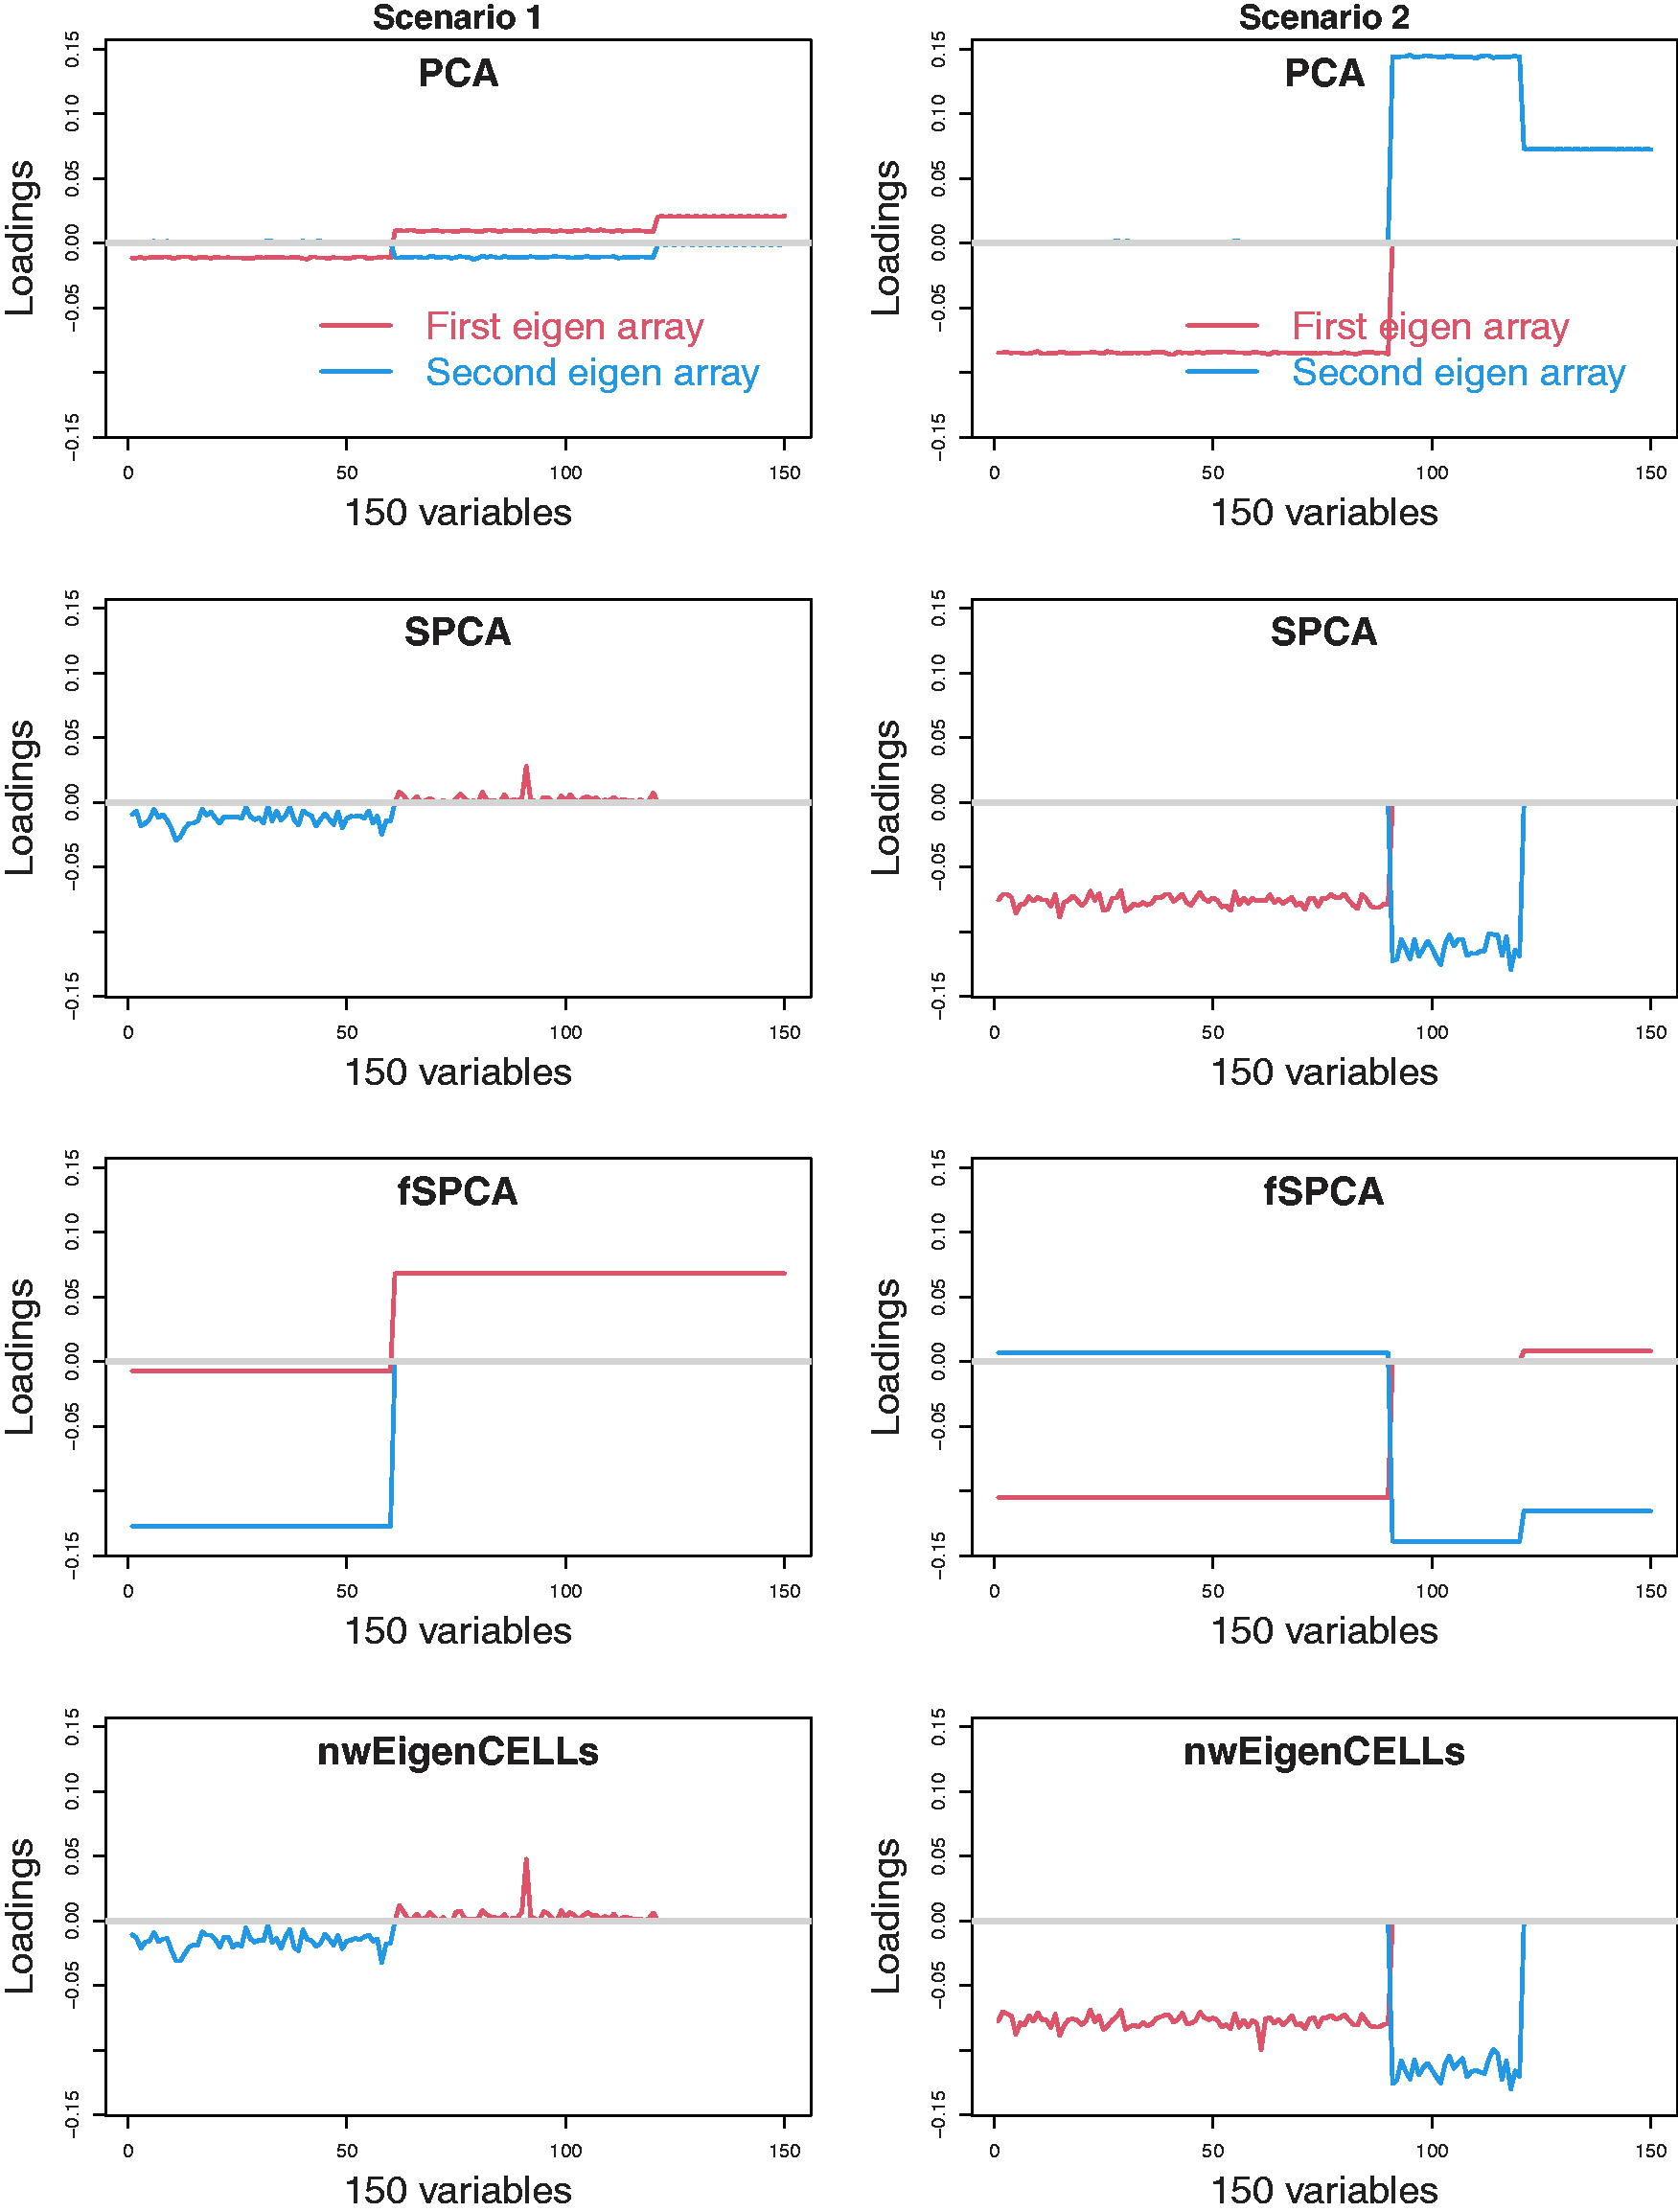
The median the first two loadings for
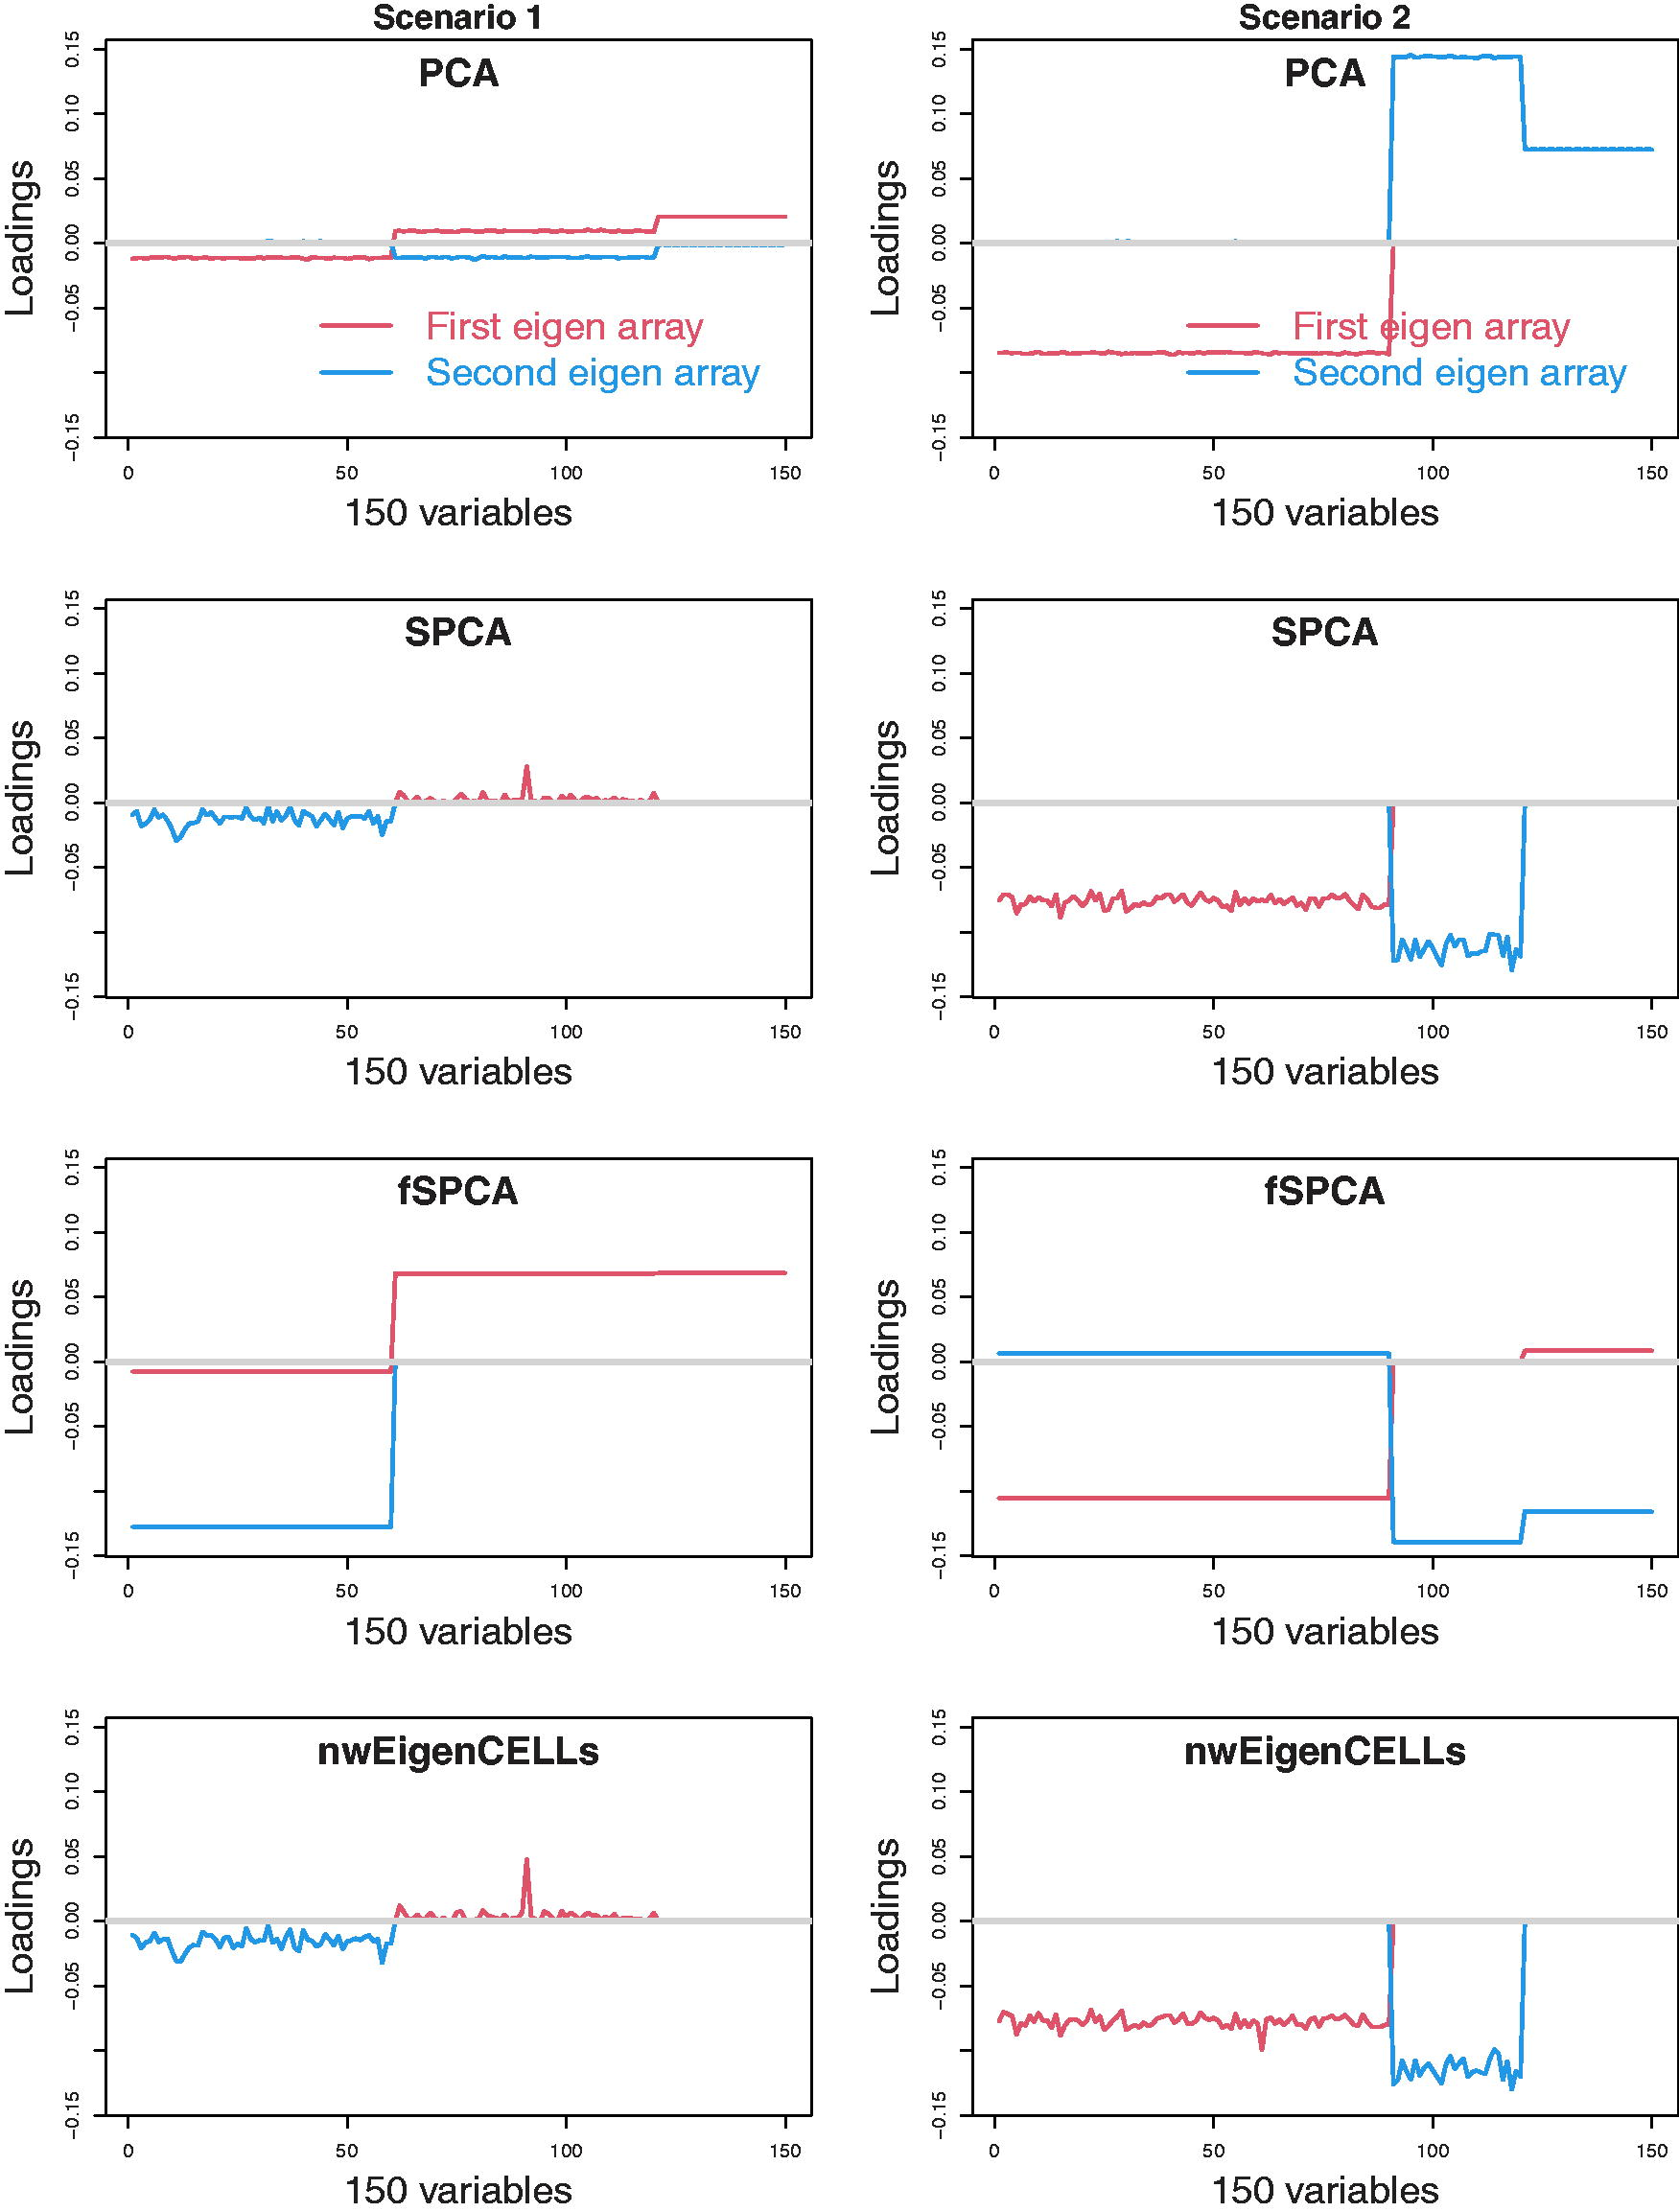
The median the first two loadings for
Table 3 shows the computational time required for network-constrained eigenCell profile estimation by the proposed nwEigenCELLS. The run time indicates the total time required to estimate network-constrained eigenCell profile via regularization parameters selection.
Running Timings for Network-Constrained eigenCell Profile Estimation via R 4.2.1
Unit: minute.
We focus on exploring the immunogene regulatory system in AML, with a special focus on age-specific gene regulation, particularly in young and aged cell lines. The proposed method was employed to uncover immunogene regulatory networks in the human bone marrow. We use a publicly available single-cell gene expression data that has been sourced from Triana (Triana et al., 2021). The main focus of our study is the investigation of immunogene interactions within young- and aged-healthy cell lines. Our analysis is based on a dataset that encompasses expression levels for 461 genes across 49,507 cell lines, sourced from “3 healthy young and 3 healthy old bone marrow donors”. We also consider age-specific immunogene regulatory systems in AML, where the networks are estimated by “15 leukemic bone marrow donors” dataset consisting of expression levels for 458 genes in 31586 cell lines. The distribution of cell line development stages is presented in Table 4.
Number of Cell Lines of the Datasets “3 Healthy Young and 3 Healthy Old Bone Marrow Donors” and “15 Leukemic Bone Marrow Donors”
Number of Cell Lines of the Datasets “3 Healthy Young and 3 Healthy Old Bone Marrow Donors” and “15 Leukemic Bone Marrow Donors”
AML, acute myeloid leukemia; BM, bone marrow.
In the dataset of “15 leukemic bone marrow donors”, we define cell lines with a development stage of
In order to estimate gene network, various computational strategies have been developed and used in the various research on gene network analysis, such as, gene networks from database, co-expression network based on correlation, non-linear regression model with bayesian network, gaussian graphical model with L1-type regularization, and the graphical lasso (Friedman et al., 2008). Our strategy can apply to gene networks estimated by various network estimation strategies. In this study, we consider linear regression framework to describe gene regulatory system. The estimation of the gene regulatory network is carried out within the context of a linear regression framework, where,
Because our method shows effective performance in accurately recovering the sparse structure of eigenCell profile and stable estimation results in simulation studies, we implement the proposed method on each group of cell lines, which includes young/aged-healthy as well as young/aged-AML cell lines. Following this, we identify the eigenCell profiles and crucial immnogenes for each of the four groups of cell lines. Table 5 shows the computational time required for network-constrained eigenCell profile estimation for uncovering crucial immunogene regulatory systems.
Running Timings Network-Constrained eigenCell Profile Estimation for Uncovering Crucial Immunogene Regulatory Systems via R 4.2.1
Unit: minute.
AML, acute myeloid leukemia.
We extract the regulatory systems of the crucial immnogenes. The immnogenes regulatory networks in both young/aged-healthy and young/aged-AML cell lines are given in Figure 5, where the edges with an absolute value of edge weight greater than 0.1, that is,
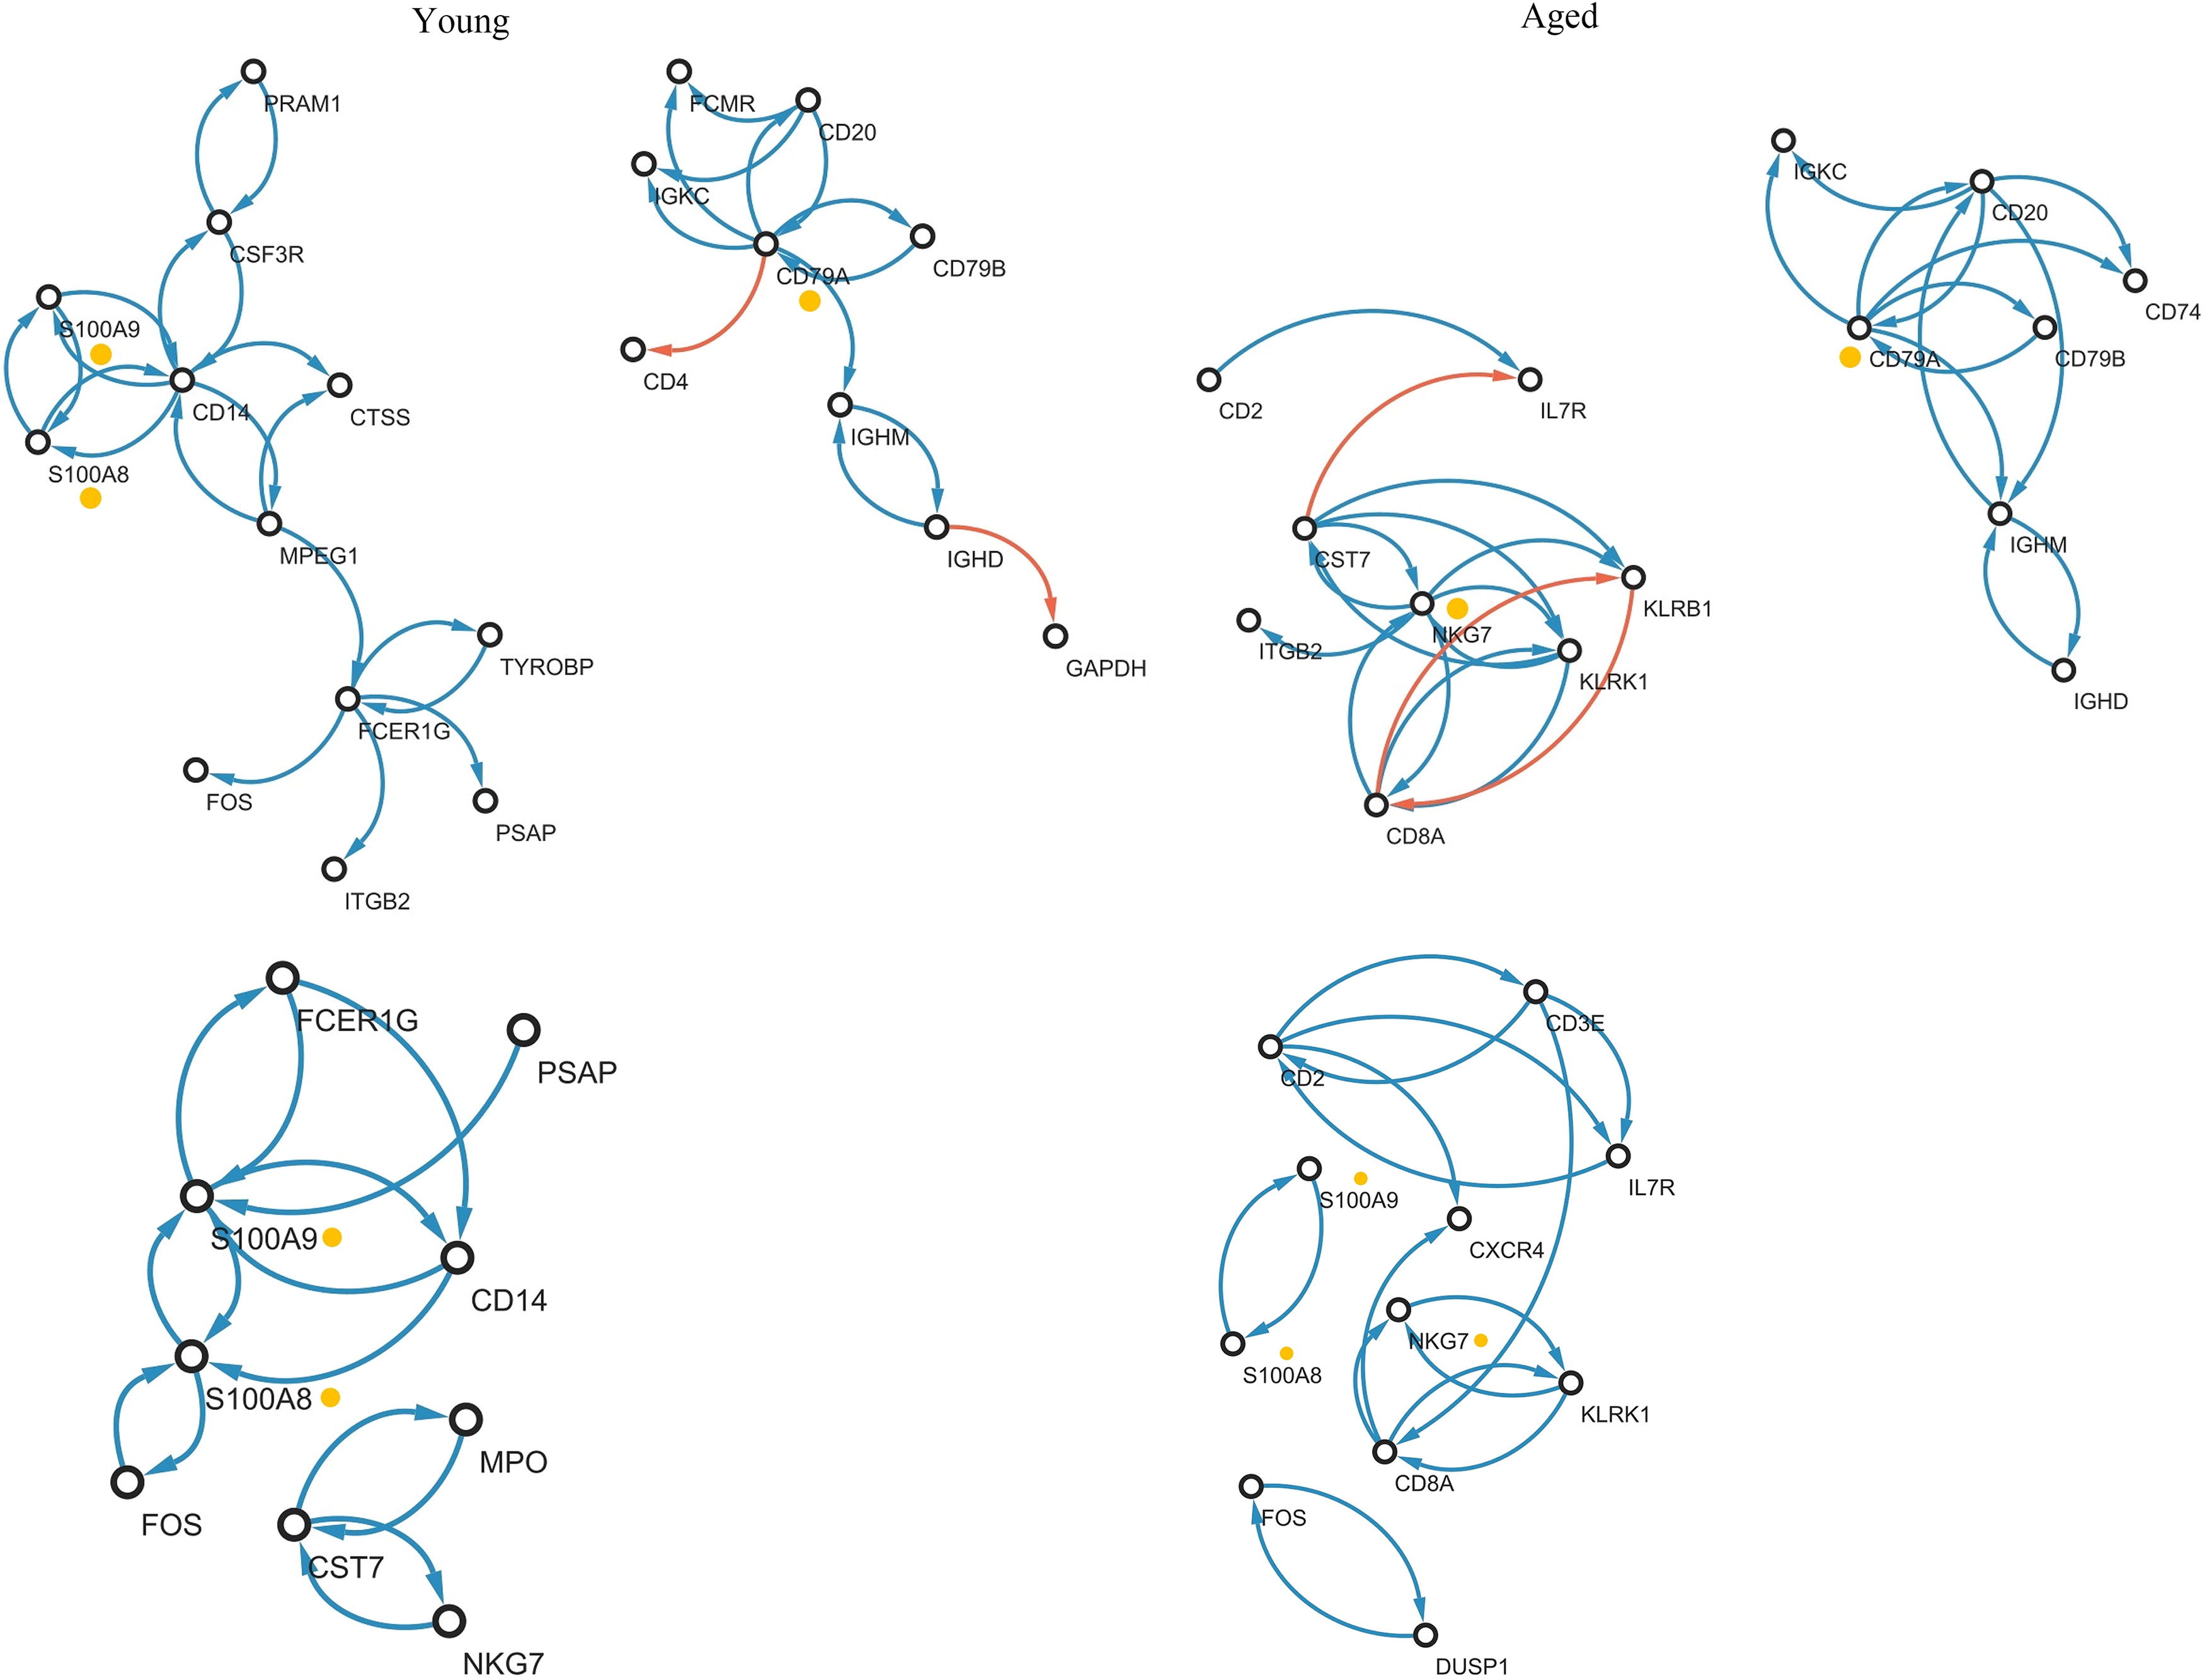
Immunogene regulatory network of bone marrow for healthy and AML, where color indicate sign of edges (i.e., red:− and blue:+), arrow indicates the regulator and target genes (i.e., regulator → target). The yollow marked genes are crucial markers that shows phenotype (Yong/Aged and Health/AML) -specific molecular interplays. AML, acute myeloid leukemia.
The identified markers and their corresponding references related to AML are presented in Table 6. The markers that have been identified exhibit compelling evidence as markers for AML, and their mechanisms in AML have been elucidated in previous studies.
The Identified Markers from Immunogene Regulatory Networks for Young/Old-Healthy and Young/Old-AML Cell Lines
The observed level of CD79A on myeloid cells is contingent on the specific antibody clone utilized, indicating that approximately 30%–45% of AML cases show positivity for CD79a (Luger et al., 2013). Paiva et al. (2018) revealed that anti-MPO, CD79A, and TdT serve as excellent cell markers for the diagnosis and classification of acute leukemias. The expression profile of CD13, CD33, and MPO, coupled with the absence of CD19, CD79A, CD3, and TdT, is indicative of a typical phenotype for AML. Specifically, this phenotype, characterized by the expression of CD13, CD33, CD34, CD117, and MPO, and the absence of CD19, CD7, CD3, CD79A, CD14, and CD64, signifies AML originating from early progenitors and excludes monocytoid or lymphoid proliferation (Wozniak and Szlezak, 2008). The study conducted by Zhang et al. (2018) revealed that CD79B is the most prominently upregulated gene in both MDS and AML, and they uncovered novel genes, such as RAG1, CD79B, VPREB1, and C18orf1, which had not been previously associated with MDS and AML.
Cd20
Bolouri et al. (2021) have suggested that bromodomain inhibitors and immune therapies targeting CD19, CD20, CD22, and CD79A could potentially be effective in treating infant AML.
Immunoglobulin Gene Family: IGHM, IGHD, IGKC
Through next-generation sequencing, Xia et al. (2022) demonstrated that dysregulation of immunoglobulin gene family members (IGHA, IGHD, IGHE, IGHG, IGHM, IGK, and IGL) occurs in AML. The study conducted by Qiu et al. (2021) showed an elevated mRNA level of IGHDs in AML patients and emphasized the significance of IGHDs as a marker for assessing the overall survival of AML patients. Yu et al. (2017) identified immune genes such as CCL5, CXCL9, CXCL13, CD80, CD21, CD8A, and IGKC as potent prognostic indicators for AML.
NKG7
Tang et al. (2023) reported a substantial increase in the expression of cytotoxicity-related genes, GZMB, NKG7, PRF1, CST7, CTSW, GNLY, GZMH, KIR3DL2, KIR2DL3, and KIR2DS4, in decitabine-or azacitidine-treated CD44v6 CAR-T cells. CD44v6 chimeric antigen receptor T (CD44v6 CAR-T) cells demonstrate significant anti-tumor activity and have been shown to be safe for use in AML. Six tumor cytotoxicity-related molecules (GZMA, GZMB, GZMH, IFNG, FASLG, and NKG7) originating from T cells demonstrated markedly higher levels in the bone marrow in comparison to the peripheral blood in cases of AML (Fujii et al., 2022).
S100A Family: S100A8, S100A9
In AML, a co-occurrence of venetoclax resistance was noted alongside the overexpression of S100A8 and S100A9, as well as TET2 mutations (P <0.05) (Karjalainen et al., 2019). Yang et al. (2020) demonstrated that the expression levels of S100A4, S100A6, S100A8, S100A9, S100A10, S100A12, and S100B were elevated in AML compared to normal blood samples. AML is characterized by high expression levels of S100A8 and S100A9, with S100A8 expression specifically associated with an unfavorable prognosis (Laouedj et al., 2017). The presence of S100A9 promotes differentiation of AML cells, while S100A8 counteracts the differentiation induced by S100A9, thereby preserving the immature phenotype of AML (Laouedj et al., 2017). Laouedj et al. (2017) revealed that treatment with recombinant S100A9 proteins led to increased maturation of AML cells, resulting in growth arrest and prolonged survival in an AML mouse model. It has been suggested that S100A8 and S100A9 play a regulatory role in myeloid differentiation in leukemia and may hold therapeutic potential, particularly in cases of myelomonocytic and monocytic AML (Laouedj et al., 2017).
Figure 6 illustrates the expression levels of the identified markers for healthy, aged, and young cell lines. CD79A, CD79B, CD20, IGHM, IGHD, and IGKC, which are markers specific to healthy cells, display notably heightened activities in both young- and aged-healthy cell lines. Conversely, in young- and aged-AML cell lines, their activities are notably reduced. The markers specific to young cells, S100A9 and S100A9.1, demonstrate higher expression levels in young cell lines compared to aged cell lines. In brief, the markers identified for each group of cell lines display elevated activities, encompassing both molecular interplays and expression levels within the cell lines. Through our results and in line with the literature (Wozniak and Szlezak, 2008), we suggest that the activities within the subnetwork containing CD79A, CD20, CD79B, IGKC, IGHM, and IGHD may yield crucial information for understanding the mechanism behind AML progression. The decrease in activities within the CD79A subnetwork may hold pivotal roles in the progression of AML, and activators of the subnetwork could provide crucial clues for preventing AML.
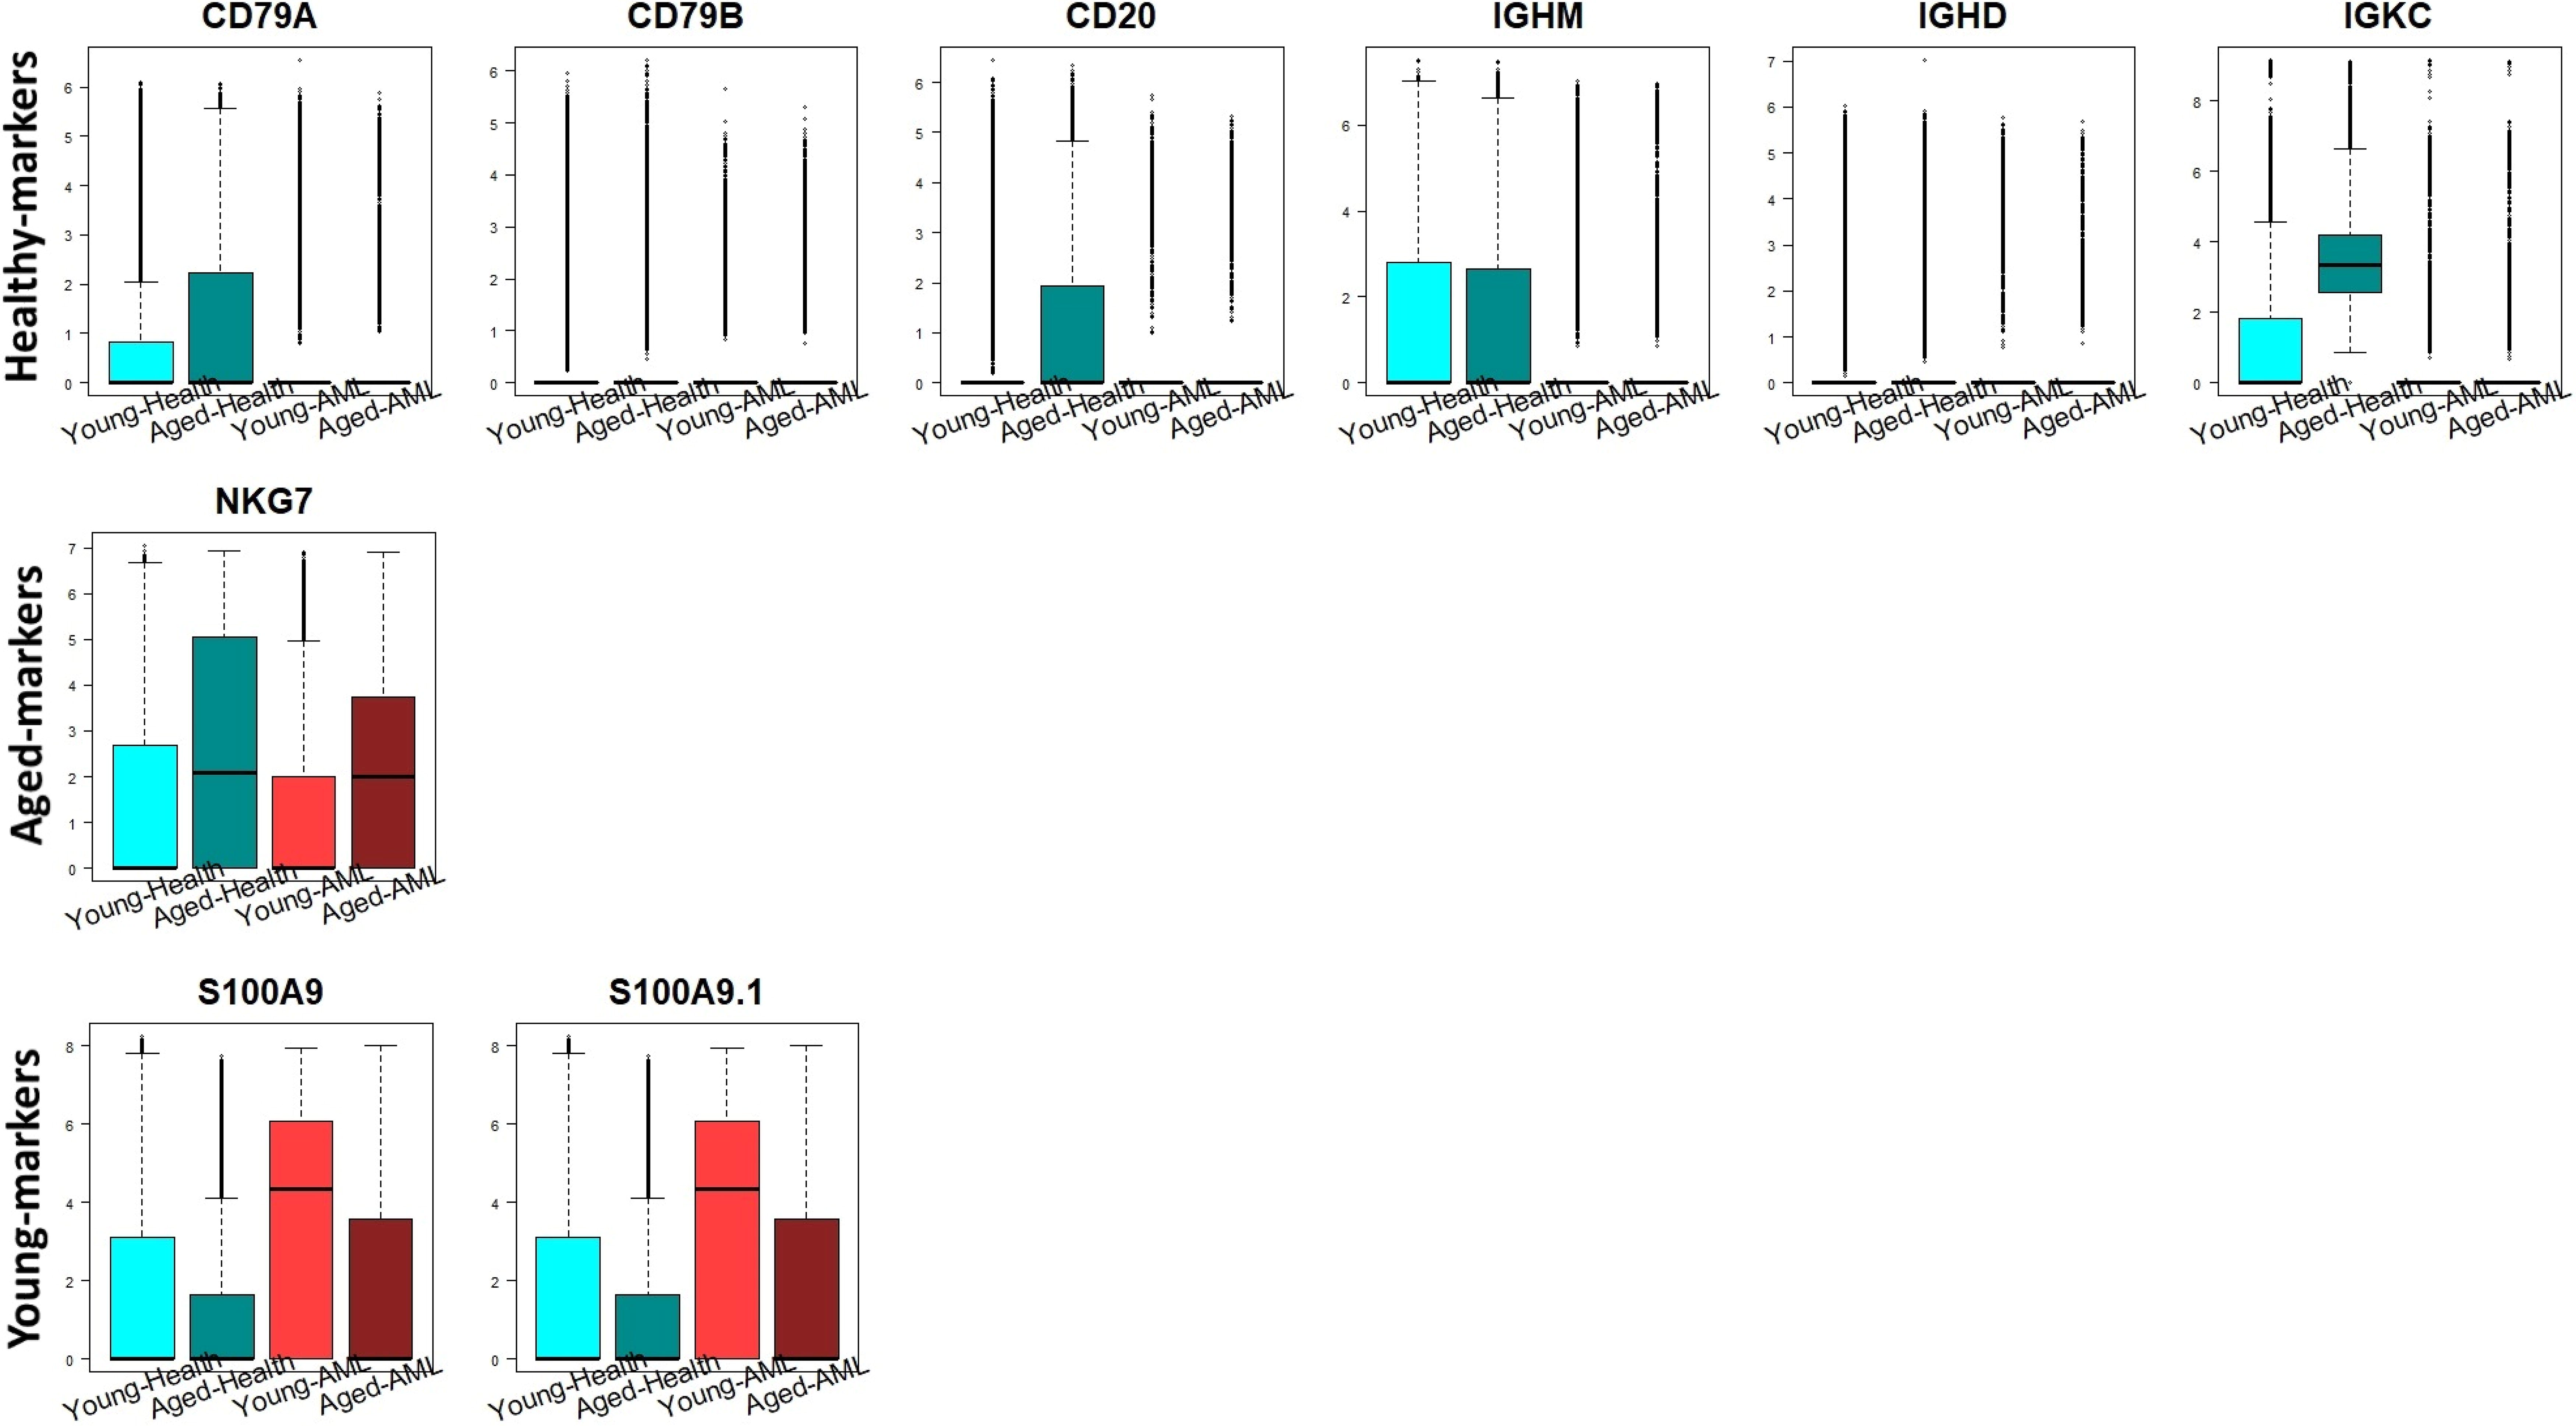
Expression levels of the identified dominant markers for Healthy, Aged and Young cell lines in the four phenotypes, cell lines of Yong-health (color: cyan), Aged-Healthy (color: dark cyan), Young-AML (color: red) and Aged-AML (color: dark red). AML, acute myeloid leukemia.
This study presents a novel computational approach for eigenCell analysis. In order to effectively estimate eigenCell profiles and determine the dominant markers for a specific phenotype, we have introduced a sparse learning approach. This approach estimates the expression levels of eigenCells using only the critical markers; that is, the eigenCells estimation is based only on the genes having non-zero loadings. Additionally, we have integrated insights from network biology into the sparse eigenCell profile estimation process. This ensures that our method yields biologically reliable results and interpretations.
Monte Carlo simulations have illustrated that the proposed method exhibits exceptional performance in accurately recovering the sparse structure of eigenCell profiles (i.e., estimating the sparse loading matrix within singular value decomposition). Our method is employed to unveil essential immune markers and their regulatory systems in immunogens in young/aged-healthy and -AML cell lines. Although not the immunogenes-focused but all genes-based analysis lead to a compressive understanding of the mechanism of AML, identification of crucial immunogenes and their molecular interplay is one of goal of our study, because immune dysfunction plays a crucial role in the pathogenesis of AML. We estimate immnunogenes regulatory networks for young- and aged-healthy cell lines and young- and aged-AML cell lines. We apply the developed strategy to identify essential immune markers and their interplays in the four regions of cell lines. The subnetwork of CD79A, encompassing CD20, CD79B, IGKC, IGHM, and IGHD, is identified as immune markers exclusive to healthy cells, while the S100A family is uncovered as markers specific to young cells. The findings from our study suggest that the activities within the subnetwork may be crucial in uncovering the mechanism underlying AML progression, particularly noting the significant role played by the diminished activities in the CD79A subnetwork. Therefore, it can also be proposed that activators of the subnetwork may hold crucial clues for preventing AML.
As shown in Tables 2 and 4, the running time of the nwEigenCELLs heavily rely on the number of genes. The computational complexity is one of the limitations of our method. Furthermore, incorrectly estimated network may lead to a false result in the eigenCell profile estimation, even though incorporating knowledge of network biology (i.e., network constraint penalty) can provide biologically reliable results. That is, the gene regulatory network estimation is also crucial issue to implement our method, and the use of biological knowledge-based gene networks (e.g., protein–protein interaction) can be considered for the network-constrained eigenCell profile estimation.
The gene networks of four phenotypes, young/aged-healthy and young/aged-AML, are estimated by cell lines of each phenotype; that is, there are differences in group sample sizes. It leads to bias the output toward seeing differences and comparing molecular interplays between phenotypes. Thus, interpreting the networks needs to be handled with great care, and we consider comparing networks of phenotypes with different group sample sizes as one of the future works of our study.
Although our strategy uncovered immunogene interplays in young/aged-healthy and young/aged-AML cell lines, and the crucial marker identification was validated via literature, there are probably potentially unidentified crucial genes. Future work can involve analysis of the well-known markers and uncover molecular interplays of the markers in our results.
Footnotes
ACKNOWLEDGMENT
This research used the computational resources of the Super Computer System, Human Genome Center, Institute of Medical Science, University of Tokyo.
AUTHORS’ CONTRIBUTIONS
H.P. developed the method, performed the analysis, and drafted the article. S.M. supervised the work. All authors have read and approved the final version of the article.
AUTHOR DISCLOSURE STATEMENT
The authors declare they have no conflicting financial interests.
FUNDING INFORMATION
This work was supported by the Sungshin Women’s University Research Grant of 2024 (Grant Recipient: Heewon Park). The work of Heewon Park was supported by NRF (RS-2023–00276559). This research was also supported by AMED under Grant Number 23tk0124003h0001, 24tk0124003h0002 and JSPS KAKENHI Grant Number JP24H00009, JP22H03692.