
Abstract
Abstract
A focus on results and impact should be at the heart of every project's approach to research and dissemination. This article discusses the potential of Google Analytics (GA:
Introduction
The recently completed CyberTraining project (funded by the EU Lifelong Learning Programme: [Project No.142237-LLP-1-2008-1-DE-LEONARDO-LMP]
The manual includes background information on cyberbullying, its nature and extent in Europe, current projects, initiatives and approaches tackling the cyberbullying problem, best practice Europe-wide, as well as practical guidance and resources for trainers working with the target groups of: (a) pupils, (b) parents, and (c) teachers, schools, and other professionals. The manual concludes with a comprehensive compilation of references, links, and other resources for trainers. The manual was published online in Autumn 2010 in the user-friendly format of an eBook and is available in English, Spanish, French, German, Portuguese, and Bulgarian versions (see also Mora-Merchan and Jäger 11 for a presentation of key reports from the project partner countries as well as country reports from Central and Eastern Europe, the Mediterranean countries, Scandinavia, Australasia, and the United States).
Effective project dissemination and measuring project impact
A project is only as useful as the scope and impact of its dissemination. Researchers and practitioners focus predominantly on traditional routes of dissemination, such as conference presentations, peer-reviewed journal articles, monographs, book chapters, and static Web content. However, in a climate of evidence-informed practice, commissioners of research and intervention/prevention programs are seeking a more robust analysis of dissemination activity—one that does not simply follow the traditional top-down approach. Rather, what is increasingly required is an approach that allows analysis of impact and usability by end-users. Considering that much research output and the content of intervention/prevention programs are made available via the Internet and Web 2.0 technologies, it is incumbent upon researchers and practitioners to understand how and where the information is being accessed. For example, while most governments have online information regarding bully/victim prevention and helpful resources, the online monitoring of Web-traffic pertaining to those materials would give an early indication of hot regional activity, thus enabling the easy identification of geographical areas that could benefit from rapid communication and dissemination of information (e.g., alert schools in that area to be increasingly vigilant and resources available).
One such tool, Google Analytics (GA) is well positioned to serve those who seek such intelligence. GA (
Aim of the current study
The central aim of the present study was to explore the potential of GA as an effective resource for measuring the impact of academic and practitioner research output. Specifically, the study explored the functionality of GA as a complimentary resource in measuring the impact of the CyberTraining Project by identifying when users were interacting with online resources, while also identifying the origins of all access.
Method
One more of most sophisticated aspects of GA V2 is the new immersive data interaction model. The V2 User Interface is completely customizable, ranging from digital dashboards (see Fig. 1 below) to overview reports and presentation of the data. Presented in Figure 1 below and in the graphs and statistics that follow are examples of the reports that we used, including site usage/visits, page views, bounce rates, average time on site, and the percentage of new visits.
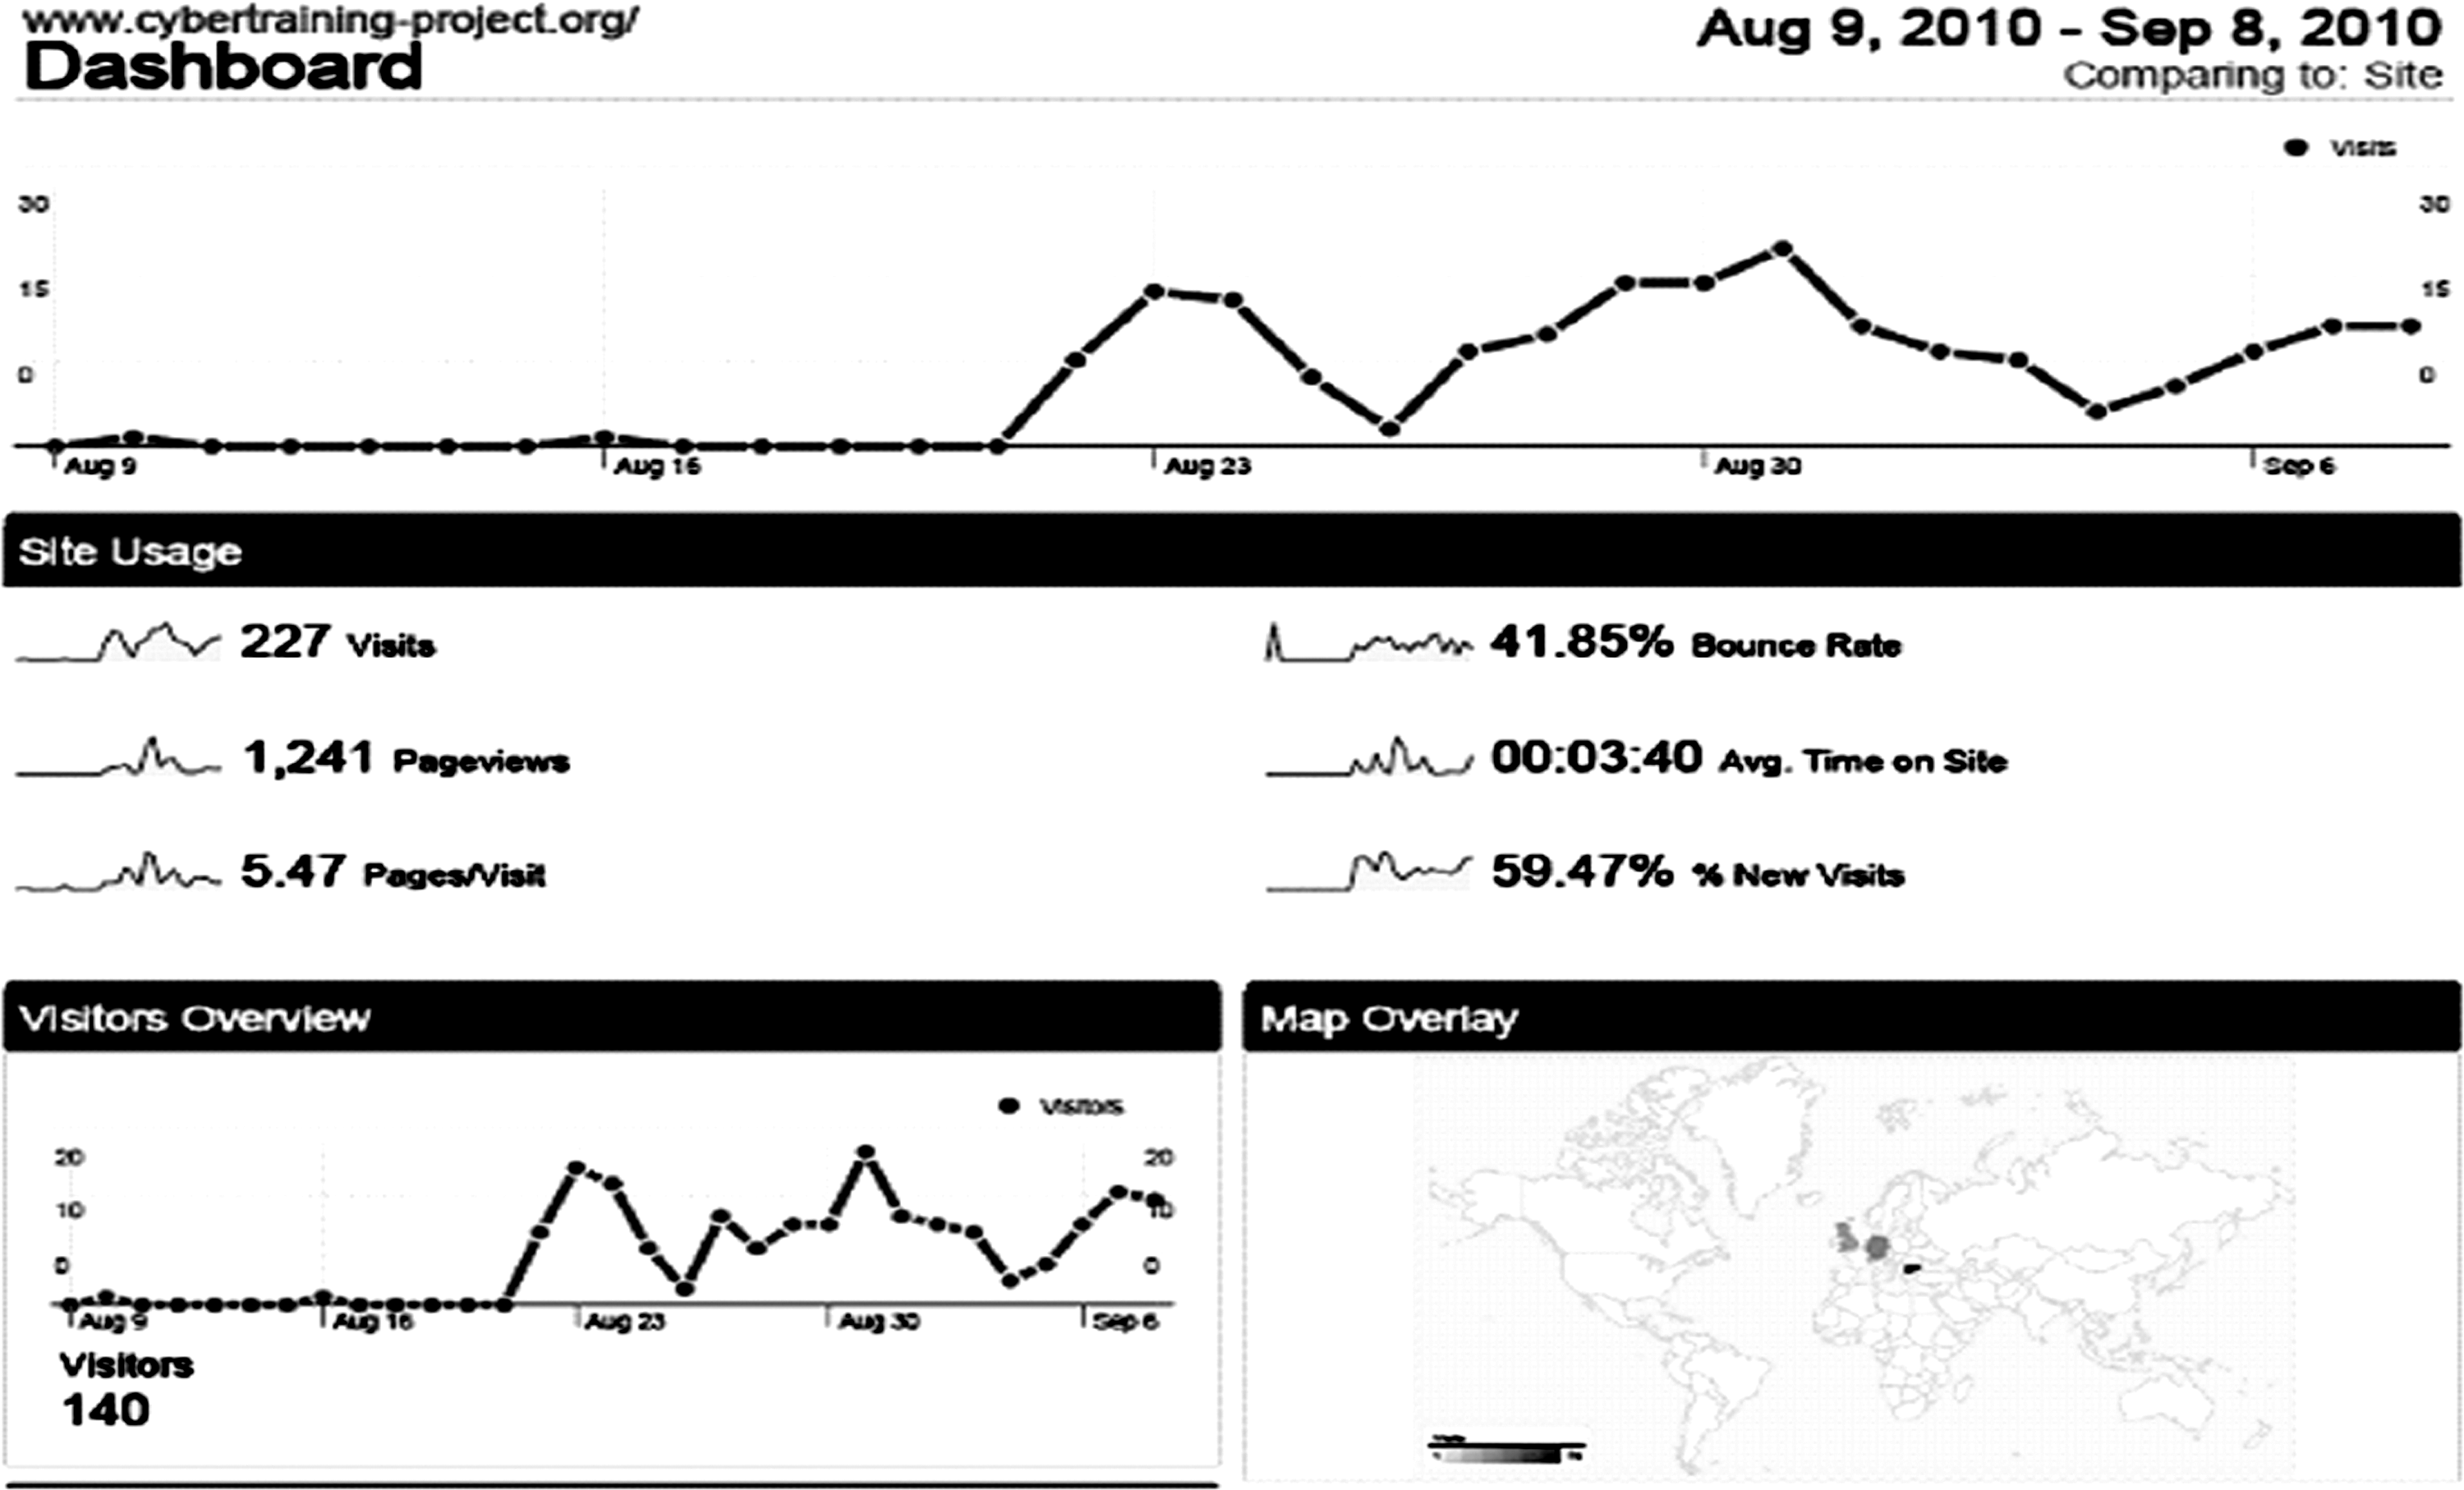
Sample dashboard with three sections. First section contains a line graph representing Site Usage statistics. Third section representing the Map Overlay and third section representing a Visitors Overview.
Chronologically, Figure 1 presents the usability data on a monthly basis (also available on a daily and weekly basis). This unique facility allows for comparison of data from different date ranges—for example, before, during, and after dissemination of the project.
Presented in Figure 2 below is further data intelligence, specifically focused on an overview of site visits. This data provides specific information on usability, such as user loyalty, which includes variables such as the number of visits, unique visitors to the site, and the average time spent on the site by each visit.
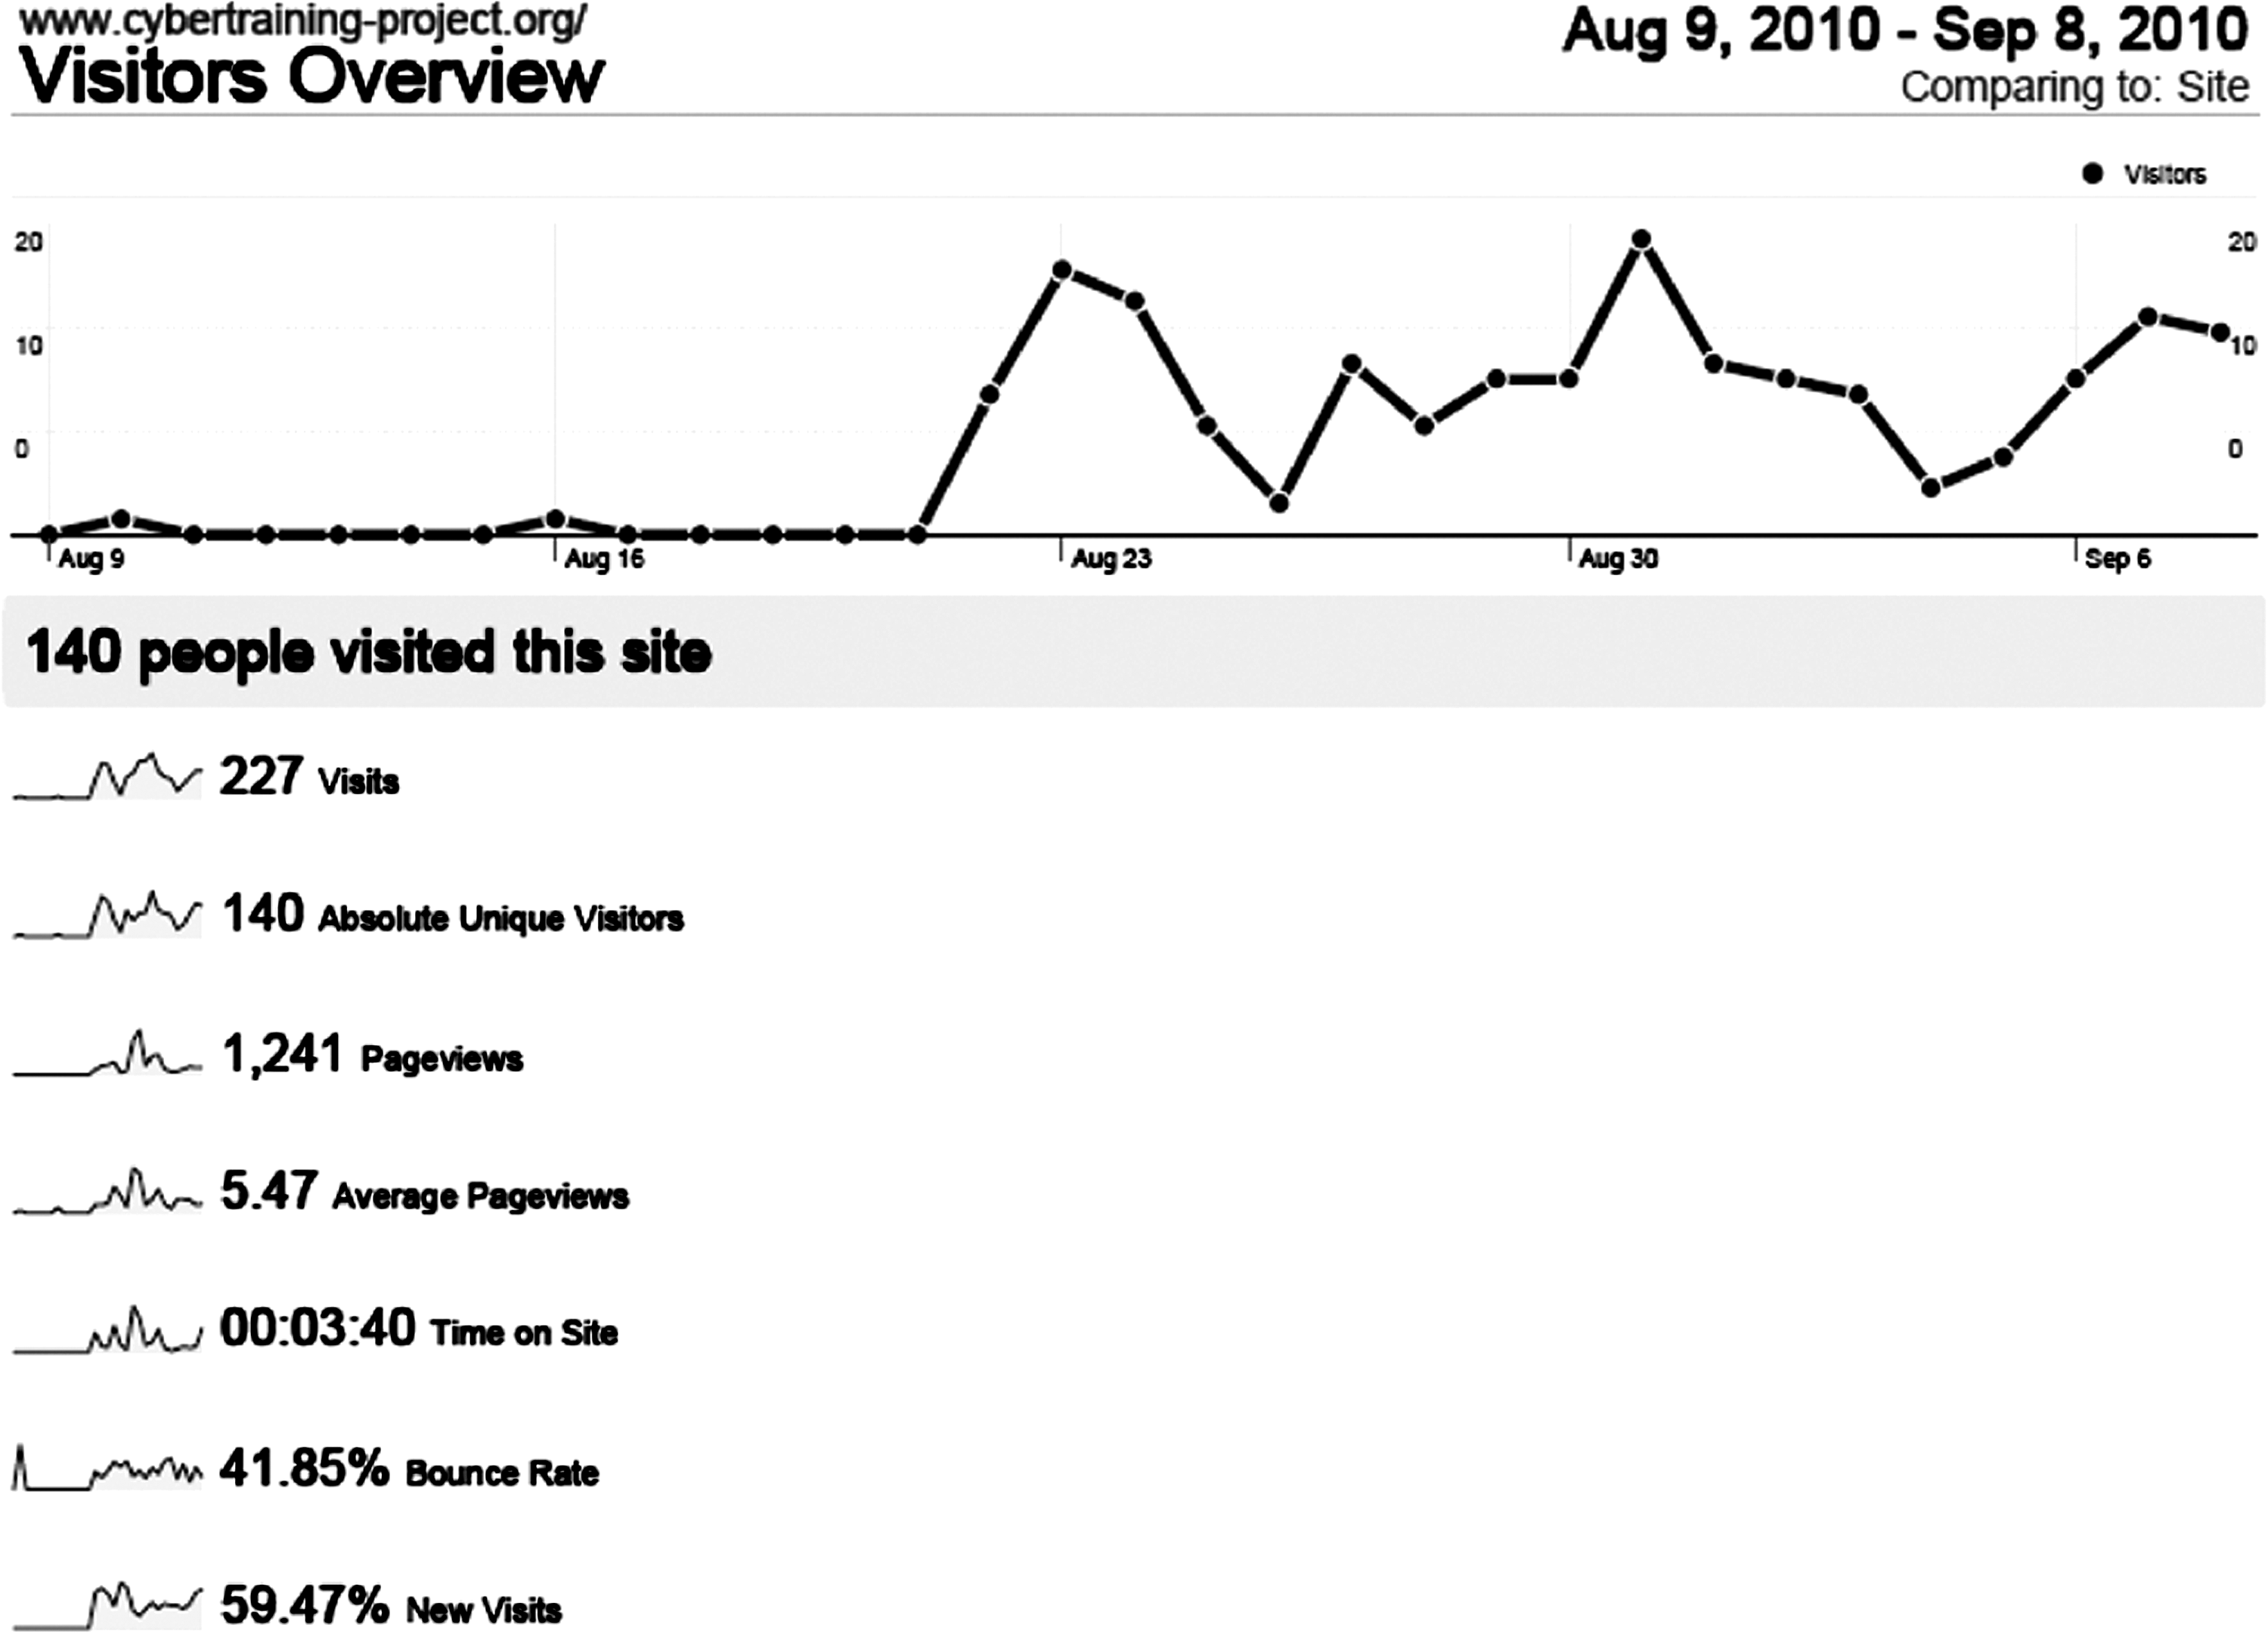
Visitors Overview. A line graph representing salient information with regard to visitors to the site, including Page Visits, New Visits (percent), Average Time on Site, Absolute Unique Visits, Average Page Views, Time on Site, Bounce Rate.
Figure 3 below provides added insight into the source of all traffic, in terms of direct traffic, referring sites, and search engines.
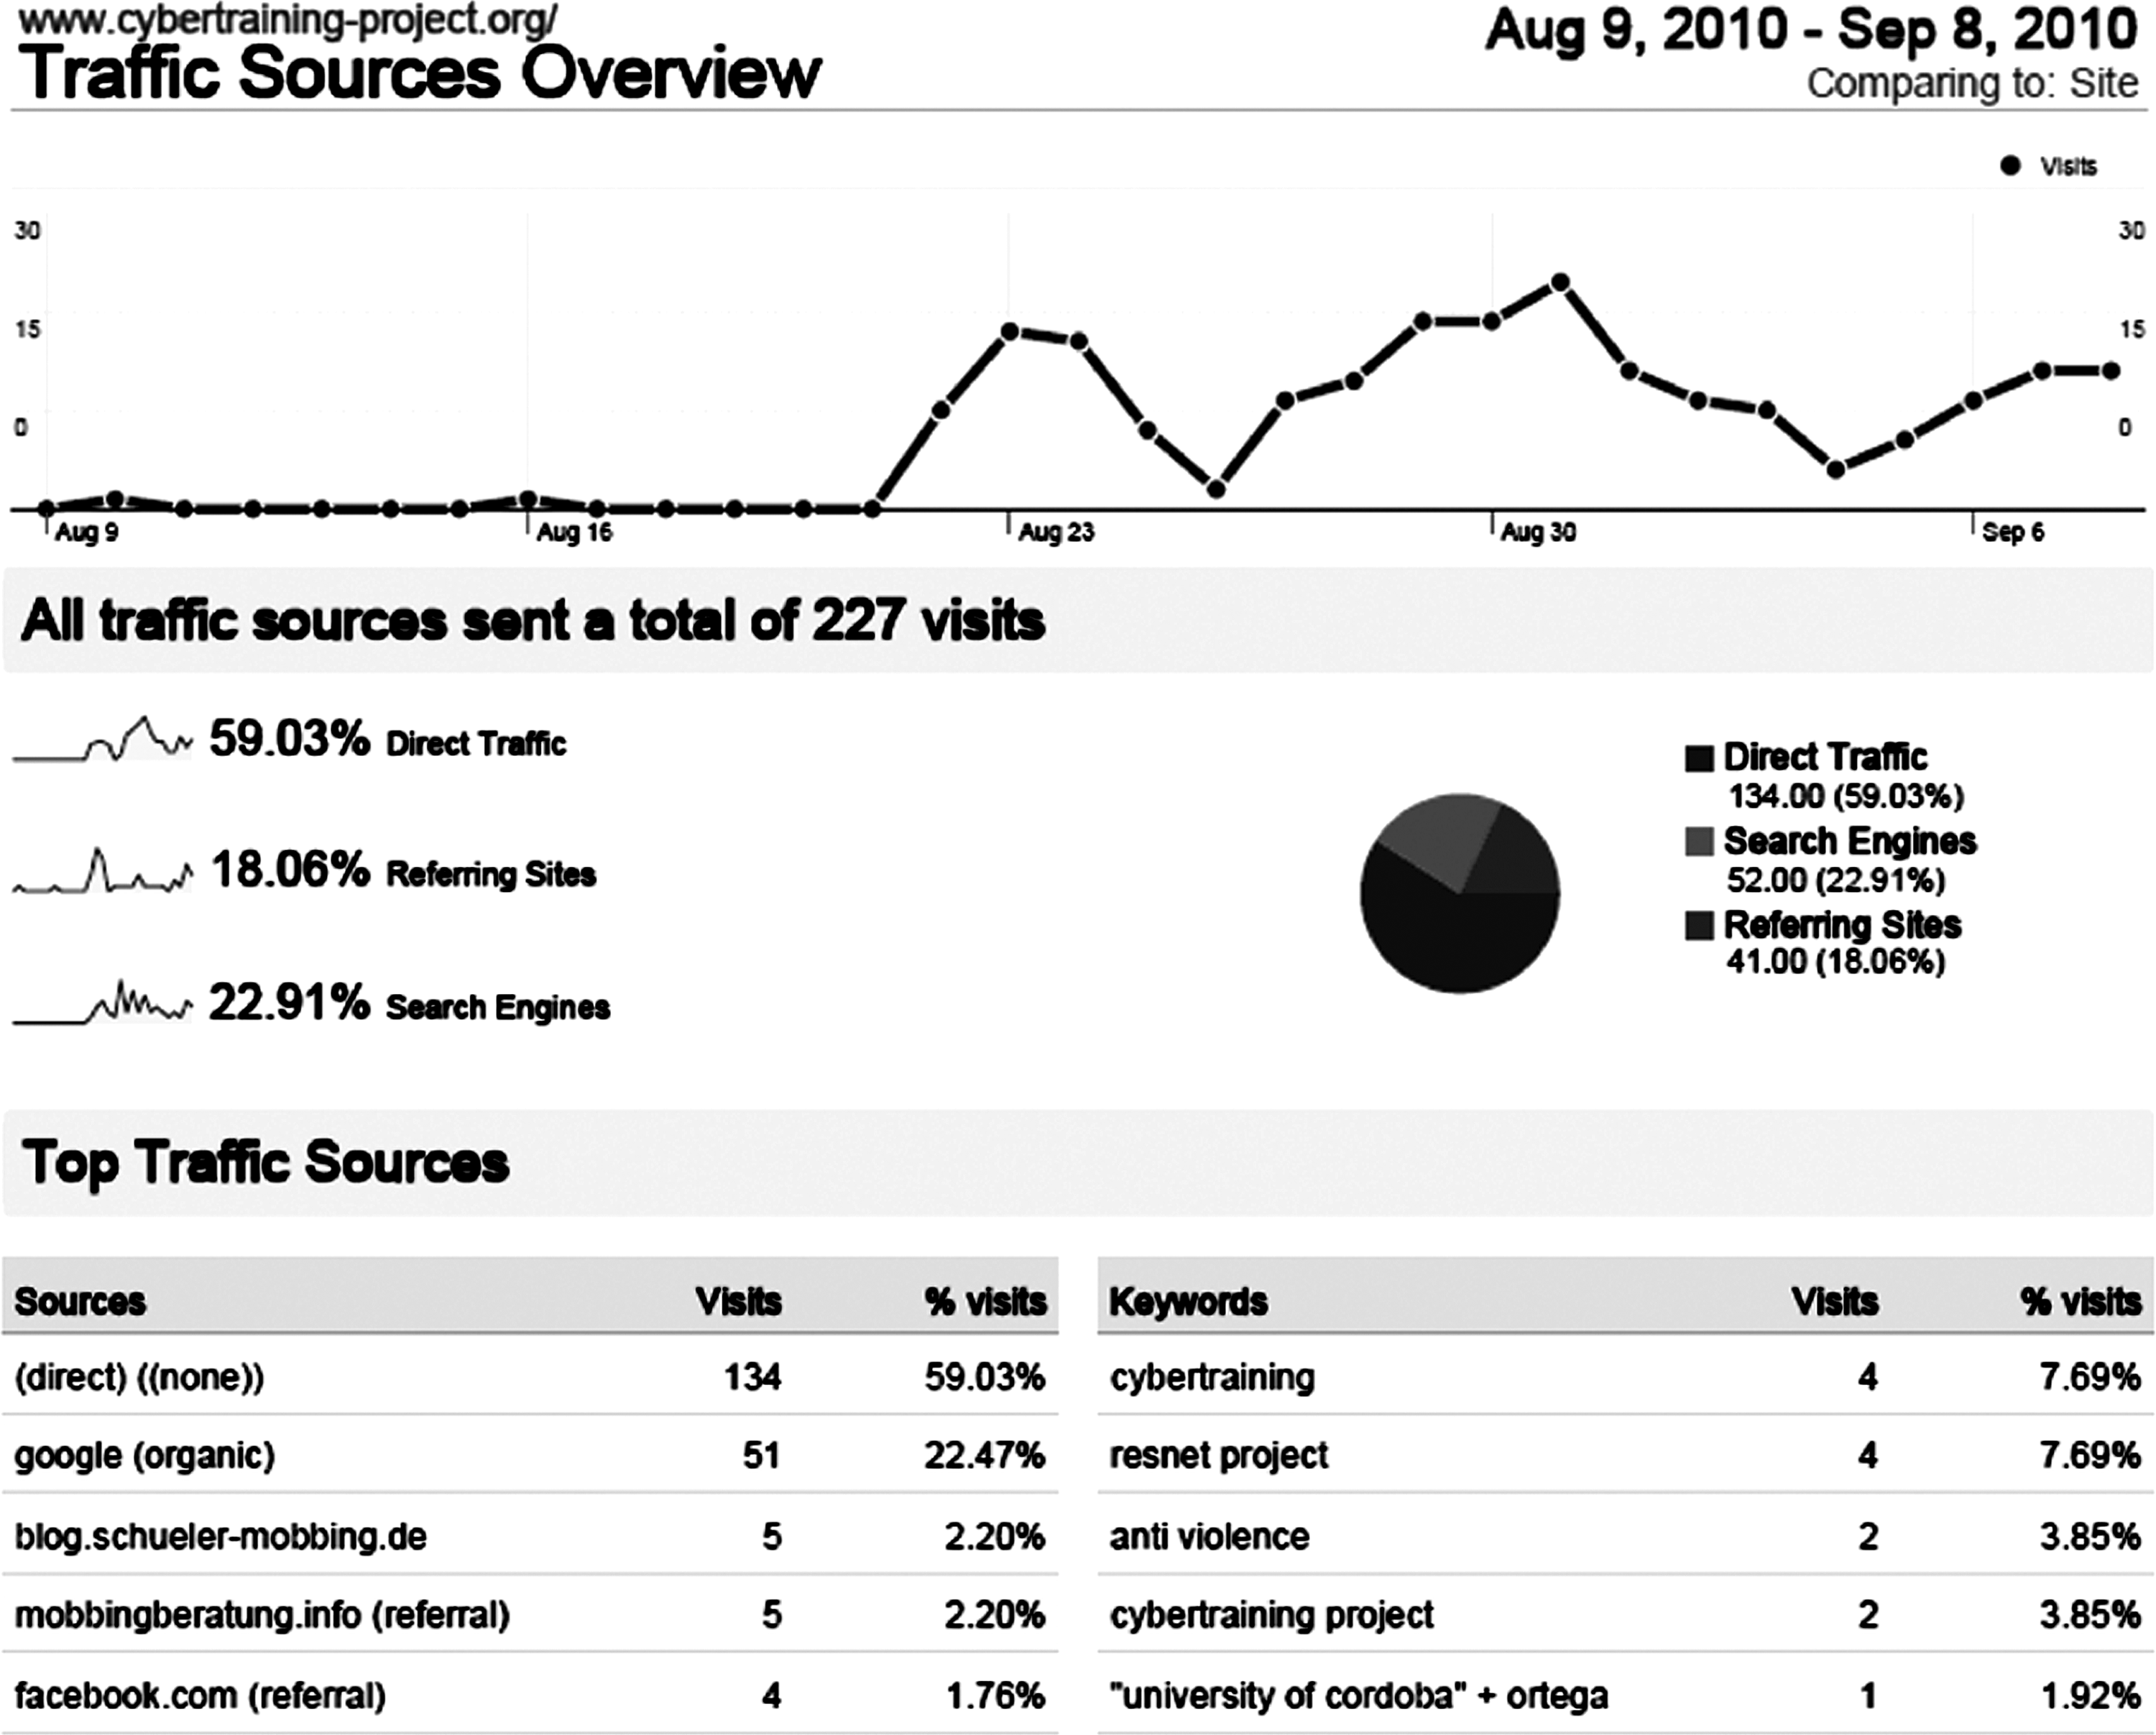
Traffic Sources Overview. A line graph representing the source of visits, including Direct Traffic (percent), Referring Sites, and Search Engine Access.
Presented in Figure 4 below is further data intelligence that illustrates clearly the sources of all access that is related to the overall visits to the site.
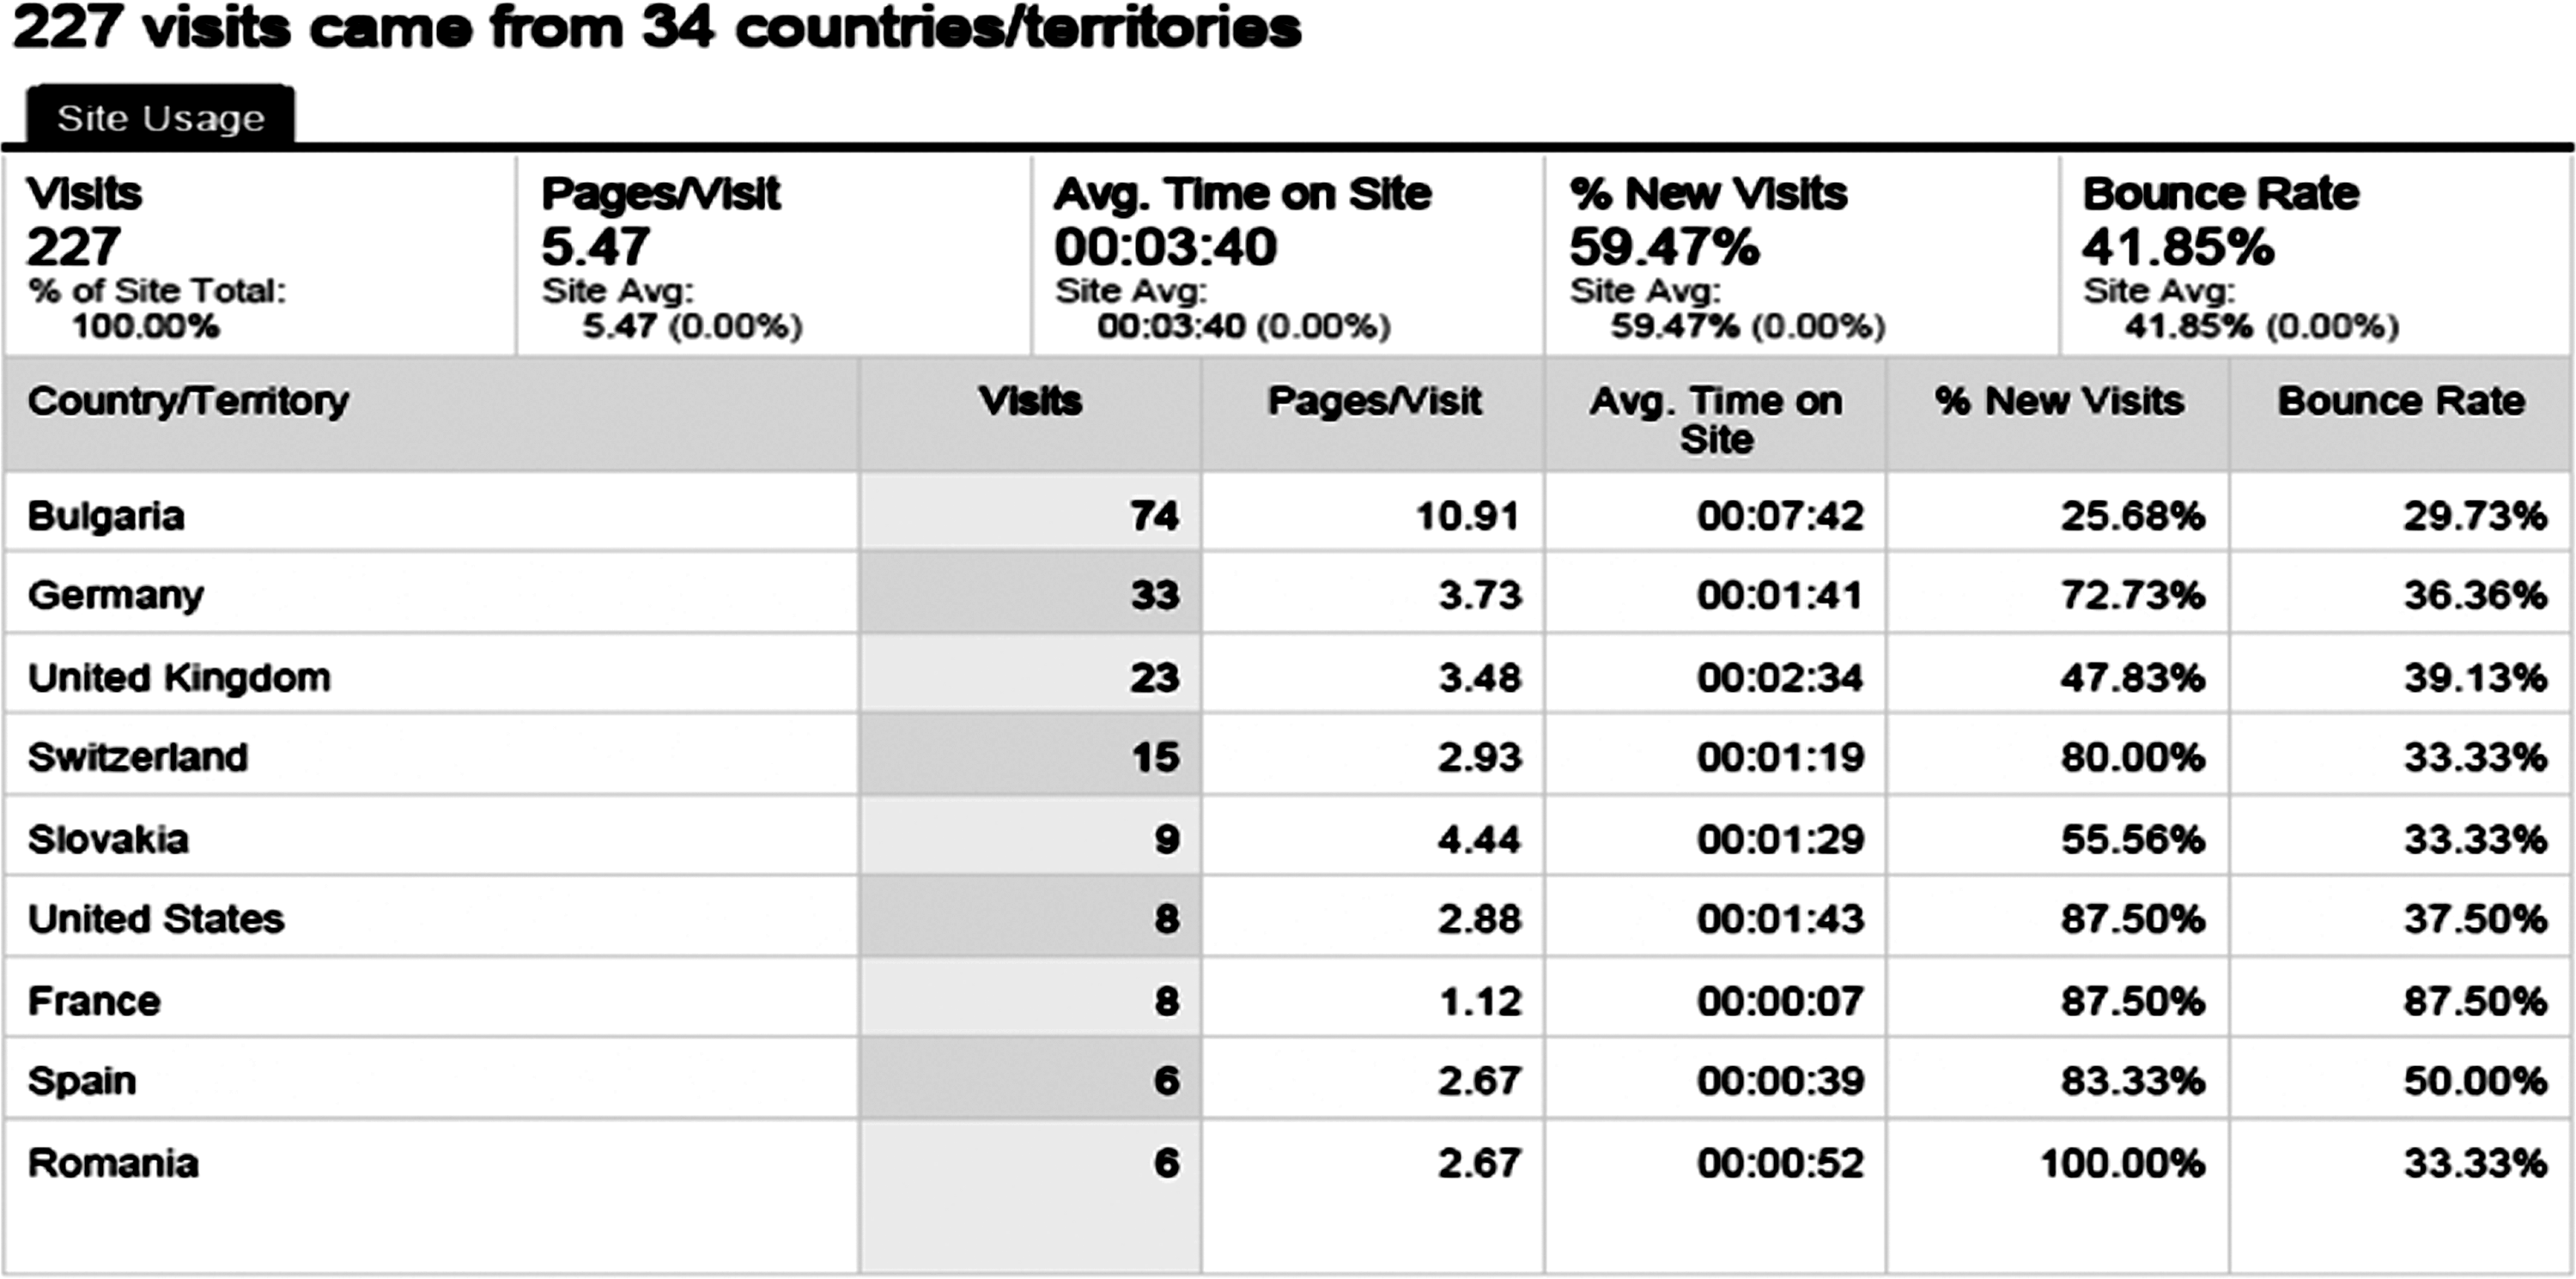
Statistics representing the geographical origins of access to the site with associated variables, such as Page Visits, New Visits (percent), Average Time On Site, Absolute Unique Visits, Average Page Views, Time On Site, Bounce Rate.
Results
Table 1 below represents sequential data points across four distinct time frames: (a) 1 month predissemination, (b) dissemination, (c) 1 month postdissemination, and (d) 3–5-month follow-up. Variables monitored included: Visits, Pages Visited, New Visits (percent), Average Time on Site, Absolute Unique Visits, Direct Traffic (percent), Referred Traffic (percent), Search Engines, Primary Sources, Secondary Sources, Top Four Countries, and Top Content.
Interpretation
During the predissemination phase, 59.67 percent of the 227 visitors to the site during the specified time period were new users. The average time on site was 00:03:40. Usefully, direct traffic (someone entering the specific URL as opposed to using a search engine) to the site was 37.62 percent compared to 18.06 percent for referred access. Over one-fifth (22.47 percent) of the referred traffic came through Google's search engine. An average of 5.67 pages was visited during each visit. In a descending order, the top access countries to the site were (a) Bulgaria (the Web developers), (b) Germany (project management), (c) the United Kingdom, and (d) Switzerland. It would be expected that these figures should increase as information about the CyberTraining Website is disseminated across multinational channels.
During the dissemination phase, 568 people visited the site, an increase of 341. Two-thirds (66.90 percent) of users were new to the site. On average, 2.68 pages were accessed during each visit, with the average time on site reduced to 00:02:17. Direct traffic to the site was 59.03 percent, with 24.12 percent being referred access. In a descending order, the top access countries to the site were (a) Germany, (b) Italy, (c) United States, and (d) Slovakia. As mentioned above, one would expect in the future that users would spend more time on the site as a result of additional content.
During the postdissemination phase, 630 people had visited the site during the specified time period— an increase of 62. Nearly three-quarters of users (71.75 percent) were new to the site. On average, 2.88 pages were accessed during each visit, with the average time on site being 00:03:12. Direct traffic to the site was 41.75 percent with 22.86 percent being referred access. In a descending order, the top access countries to the site were (a) Germany, (b) United States, (c) the United Kingdom, and (d) Bulgaria. Again with the addition of new material and the uploading of the complete training manual, one would expect more new users and increased time on site/increased number of pages accessed.
At follow-up, 1,975 people had visited the site during the specified time period—61.37 percent of users being new to the site. On average, 2.48 pages were accessed during each visit. The average time on site was 00:02:53. Direct traffic to the site was 43.29 percent, with 33.92 percent being referred access.
Discussion
The aim of the research was to ascertain the efficacy of GA as an effective resource for measuring the impact of the CyberTraining project. As part of the project's dissemination strategy, the eBook was uploaded to the project Website in each of the partner country languages. A focused campaign of project dissemination via traditional academic means (e.g., conference presentations, book) promoted the project outside of the partner countries. As noted, such traditional approaches to project dissemination are one-way. With an increasing focus on evidence-informed results, the focus here on using GA to further understand the uptake of the project training manual was positive—especially considering that many of the project team are involved in another EU-funded project that builds upon the results of this project (CyberTraining-4-Parents [CT4P]: Project number: 510162-LLP-1-2010-1-DE-GRUNDTVIG-GMP). Similar large-scale multipartner projects in the area (e.g., COST Action IS0801:
In essence, GA has demonstrated its worth in assessing the early impact of the CyberTraining project and has allowed for the project team to further understand how best to optimize the product (i.e., the Website and the eBook) for ease of access and navigation by unique and referred users. Direct access was, on average 45 percent, representing informed users. Considering that the content of the eBook was determined by a robust research process, this finding was heartening. Indeed, this figure may also account for informed users who learnt about the project through the traditional means of dissemination also employed. On average, 30 percent of new users accessed the Website and eBook via Google's search engine—a finding useful for further Web optimization. Such work should evidence an increase in site traffic from uninformed users and the general public—a key market for the content of the eBook. In a similar vein, with referred access rates of between 20 percent and 25 percent from other Websites, link-building is an issue that the project team should now also consider. There may also be some potential in developing social networking marketing campaigns (e.g., Facebook).
Such information proves valuable in the iterative development and dissemination of the project and has, directly, informed the planning of the new CT4P project. In terms of cybersafety, advice for parents 14 is that: “if you don't understand it, you can't teach it!” The results here from GA further this: if you can't find it, you can't use it!
Footnotes
Author Disclosure Statement
No competing financial interests exist.