
Abstract
Capsule Summary
Some patients with atopic dermatitis show delayed response to tralokinumab treatment by 1 year. Female sex, absence of prior systemic therapy, and lower baseline thymus and activation-regulated chemokine and LDH may predict delayed response to tralokinumab, defined as achievement of investigator’s global assessment 0/1 at week 48 but not at or before week 24.
INTRODUCTION
Atopic dermatitis (AD) is a chronic inflammatory skin disease characterized by recurrent eczema, skin barrier dysfunction, intense pruritus, and type 2-skewed inflammation.1B2 -12 Interleukin (IL)-13 is recognized as a key cytokine causing inflammation, pruritus, and skin barrier disruption in AD.13B14 -19 Recently, biological agents that target IL-13 have emerged as promising treatment options for patients with moderate-to-severe AD who do not achieve adequate control by conventional therapies.
Tralokinumab, a fully human monoclonal anti-IL-13 antibody, is approved for moderate-to-severe AD.20-22 Various clinical trials and real-world data have shown consistent effectiveness and tolerability of tralokinumab at early (weeks 12–16) and mid-term (around week 24) of treatment.23B24 -31 However, some patients do not sufficiently respond to this agent at early or mid-term but show delayed response around 1 year of treatment, whereas there still exist patients that do not sufficiently respond to tralokinumab even at 1 year. Thus, it is important to predict the delayed responders to tralokinumab in order to help decide the treatment strategy, continuation or switch to other therapies or poor responders at mid-term (around week 24) of tralokinumab treatment. We have previously reported background factors that may predict week 12 or week 24 responders to tralokinumab, defined as patients who achieve investigator’s global assessment (IGA) 0/1 at week 12 or those at week 24 but not at or before week 12, 32 respectively. However, predictive factors are unknown for delayed responders to tralokinumab who achieve IGA 0/1 at week 48 but not at or before week 24.
The aim of this study is to identify patients’ baseline features which may predict week 48 delayed responders to tralokinumab in a real-world practice for AD.
METHODS
Study Design
We conducted a prospective study at Nippon Medical School Chiba Hokusoh Hospital from October 2023 to February 2025. We targeted Japanese patients diagnosed with moderate-to-severe AD based on “Japanese guidelines for atopic dermatitis 2021.” 33 After comprehensive discussion with physicians, each patient chose tralokinumab among available systemic therapies. Tralokinumab was administered subcutaneously at 600 mg initially, followed by 300 mg every 2 weeks. All patients were simultaneously treated topically with moderate-to-strong corticosteroids twice daily. This study was conducted in accordance with the principles of the Declaration of Helsinki (2004) and was approved by the institutional review boards of Nippon Medical School and Nippon Medical School Chiba Hokusoh Hospital.
Data Collection
We recorded the baseline characteristics of patients, including age, body mass index (BMI), sex, duration of AD, and histories of allergic conjunctivitis, allergic rhinitis, and bronchial asthma. We also collected data on prior systemic therapies, such as lebrikizumab, dupilumab, nemolizumab, abrocitinib, baricitinib, upadacitinib, cyclosporine A, and corticosteroids.
Clinical and laboratory assessments included IGA, eczema area and severity index (EASI), peak pruritic-numerical rating scale (PP-NRS), thymus and activation-regulated chemokine (TARC), immunoglobulin E (IgE), LDH, and total eosinophil count (TEC). In addition, eosinophil-to-lymphocyte ratio, neutrophil-to-lymphocyte ratio, monocyte-to-lymphocyte ratio (MLR), and platelet-to-lymphocyte ratio (PLR) were calculated. We also evaluated systemic inflammation markers such as C-reactive protein (CRP), systemic immune-inflammation index (SII), and systemic inflammation response index (SIRI). SII was calculated as platelet count × neutrophil count/lymphocyte count, and SIRI was calculated as neutrophil count × monocyte count/lymphocyte count.34B35 -41
Inclusion and Exclusion Criteria
All patients in this study received tralokinumab for at least 48 weeks. We included patients aged ≥15 years having moderate-to-severe AD, defined by total EASI ≥16 or head and neck EASI ≥2.4. All patients had inadequate responses to topical treatment alone or were deemed unsuitable for topical treatment alone. Since this study was not a clinical trial, we did not set a strict washout period when switching from other systemic therapies to tralokinumab, and the time-point of switching was defined as week 0 (baseline). We excluded data of patients who resumed tralokinumab after discontinuation. We excluded patients who received q4W dosing of tralokinumab to unify the treatment conditions. Other exclusion criteria are malignancy, severe cardiovascular diseases including stroke, heart failure, and myocardial infarction, active infections including tuberculosis, known hypersensitivity to tralokinumab or its components, and women who were pregnant or breastfeeding.
Definition of Week 48 Delayed Responders and Poor Responders
At weeks 4, 12, 16, 24, 36, and 48, we evaluated whether each patient achieved IGA 0 (clear skin) or 1 (almost clear skin), with ≥2-point decrease from baseline (IGA 0/1). We defined week 48 delayed responders as patients who achieved IGA 0/1 at week 48, but not at or before week 24, and defined week 48 poor responders as those who did not achieve IGA 0/1 throughout 48 weeks. We then compared the baseline laboratory and clinical indices and other background factors between week 48 delayed responders and poor responders. In our previous study, we identified the baseline features of early (week 12) responders or mid-term (week 24) responders to tralokinumab, defined as IGA 0/1 achievers at week 12 or those at week 24 but not at or before week 12, respectively. 32 Thus, the present study is the extension of that previous study.
Statistical Analysis
Variables with normal distribution were expressed as mean ± standard deviation, and variables with nonparametric distribution were expressed as median (interquartile range [IQR]). We used Fisher’s exact test to assess the significance of differences in frequency distributions. We used the Mann–Whitney U test to evaluate differences between 2 groups for nonparametric variables, and regarded P < 0.05 as statistically significant. Differences in clinical or laboratory indexes at individual time-points of treatment were assessed using Friedman’s test for variables with nonparametric distribution. Post hoc analysis was performed using Bonferroni correction.
We performed receiver operating characteristic (ROC) curve analysis to assess the ability of each variable to distinguish week 48 delayed responders from poor responders. We used the area under the curve (AUC) as a measure of predictive power. All statistical analyses were performed using Easy R (Jichi Medical University Saitama Medical Center, Saitama, Japan).
RESULTS
Baseline Characteristics of Enrolled Patients
In total, 71 patients with AD were enrolled (Table 1). Forty-nine patients (69.0%) were male. Patients’ age was median 47.0 (IQR 32.5–58.0) years, and BMI was median 21.5 (IQR 20.4–24.6) kg/m2. The disease duration was median 36 (IQR 25–45) years. Systemic therapy was administered to 31 patients (43.7%) before tralokinumab treatment.
Baseline Characteristics of Patients with Atopic Dermatitis Treated with Tralokinumab for 48 Weeks (n = 71)
Data provided as median (interquartile range).
Data provided as mean ± standard deviation.
EASI, eczema area and severity index; ELR, eosinophil-to-lymphocyte ratio; IGA, investigator’s global assessment; MLR, monocyte-to-lymphocyte ratio; NLR, neutrophil-to-lymphocyte ratio; PLR, platelet-to-lymphocyte ratio; PP-NRS, peak pruritus numerical rating scale; SII, systemic immuno-inflammatory index; SIRI, systemic inflammatory response index; TARC, thymus and activation-regulated chemokine; TEC, total eosinophil count.
Transition of the Achievement Rates of IGA 0/1
We examined the transition of achievement rates of IGA 0/1 for the 71 patients through 48 weeks of tralokinumab treatment (Fig. 1). The rate increased at week 12 (21.4%) and stabilized at week 16, then further increased at week 24 (44.3%) and stabilized at week 36, and then further increased at week 48 (60.6%). The trend of transition indicates the presence of 3 phases of responders: week 12 early responders, week 24 mid-term responders without response at or before week 12, and week 48 delayed responders without response at or before week 24.
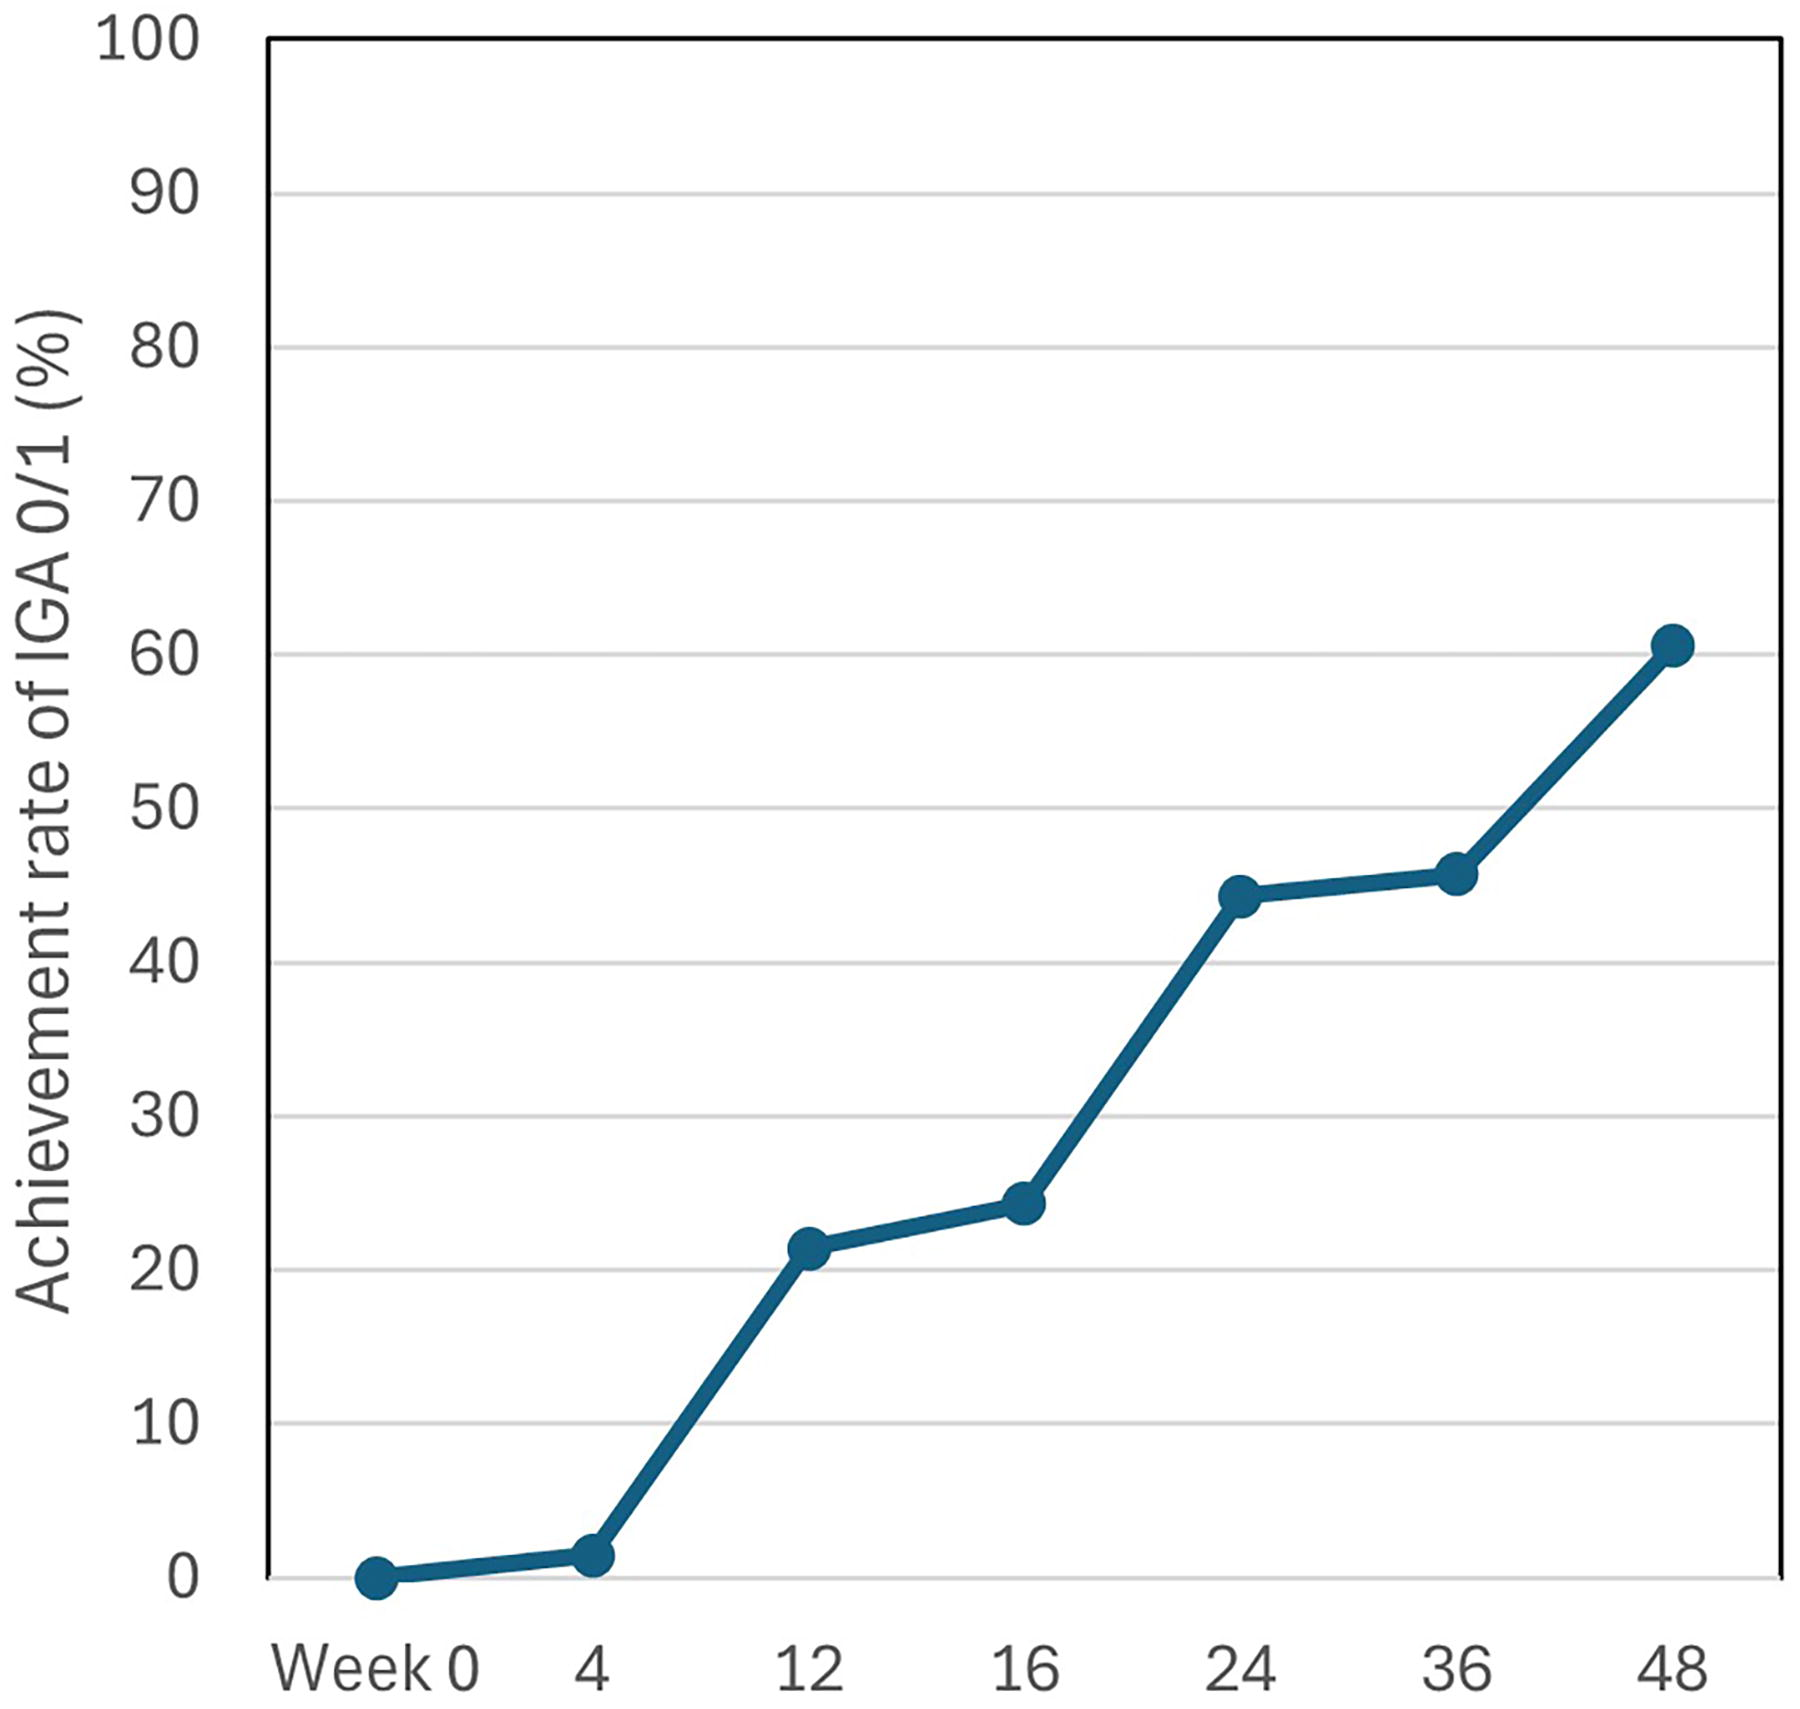
The transition of achievement rates of investigator’s global assessment (IGA) 0/1 during treatment with tralokinumab for patients with atopic dermatitis (n = 71). Achievement rates of IGA 0/1 were shown at baseline (week 0) and weeks 4, 12, 16, 24, 36, and 48.
Comparison of Baseline Features Between Week 48 Delayed Responders and Poor Responders
Among all 71 patients with AD, 13 or 27 patients were evaluated as week 48 delayed responders or poor responders, respectively. The background factors and baseline values of clinical and laboratory indexes were compared between the 2 groups (Table 2). The proportion of male sex in delayed responders (38.5%) was significantly lower compared with poor responders (88.9%). The proportion of prior systemic therapy in delayed responders (23.1%) was significantly lower compared with poor responders (74.1%).
Comparison of Baseline Features Between Week 48 Delayed Responders Versus Poor Responders to Tralokinumab Treatment for Atopic Dermatitis
Data provided as the median (interquartile range).
Data provided as the mean ± standard deviation.
P < 0.05, **P < 0.01 by Fisher’s exact test or Mann–Whitney U test.
EASI, eczema area and severity index; ELR, eosinophil-to-lymphocyte ratio; IGA, investigator’s global assessment; MLR, monocyte-to-lymphocyte ratio; NLR, neutrophil-to-lymphocyte ratio; PLR, platelet-to-lymphocyte ratio; PP-NRS, peak pruritus numerical rating scale; SII, systemic immuno-inflammatory index; SIRI, systemic inflammatory response index; TARC, thymus and activation-regulated chemokine; TEC, total eosinophil count.
Baseline TARC value in delayed responders (median [IQR] 546 [397–1650] pg/mL) was significantly lower compared with poor responders (median [IQR] 2727 [1146–9129] pg/mL). Baseline LDH value in delayed responders (median [IQR] 206 [192–282] IU/mL) was significantly lower compared with poor responders (median [IQR] 248 [224–318] IU/mL).
ROC Curve Analysis for Predicting Delayed Responders
ROC curve analysis was performed to assess the predictive abilities of baseline TARC or LDH to distinguish week 48 delayed responders from poor responders (Fig. 2). The AUC of baseline TARC was 0.834 (95% confidential interval [CI]: 0.705–0.963), with specificity of 92.3% and sensitivity of 61.5% at a cut‐off value of 546 pg/mL. The AUC of baseline LDH was 0.706 (95% CI: 0.515–0.896), with specificity of 96.2% and sensitivity of 46.2% at a cutoff value of 198 IU/mL. Based on the AUC values, the predictive ability of TARC appeared higher than that of LDH.
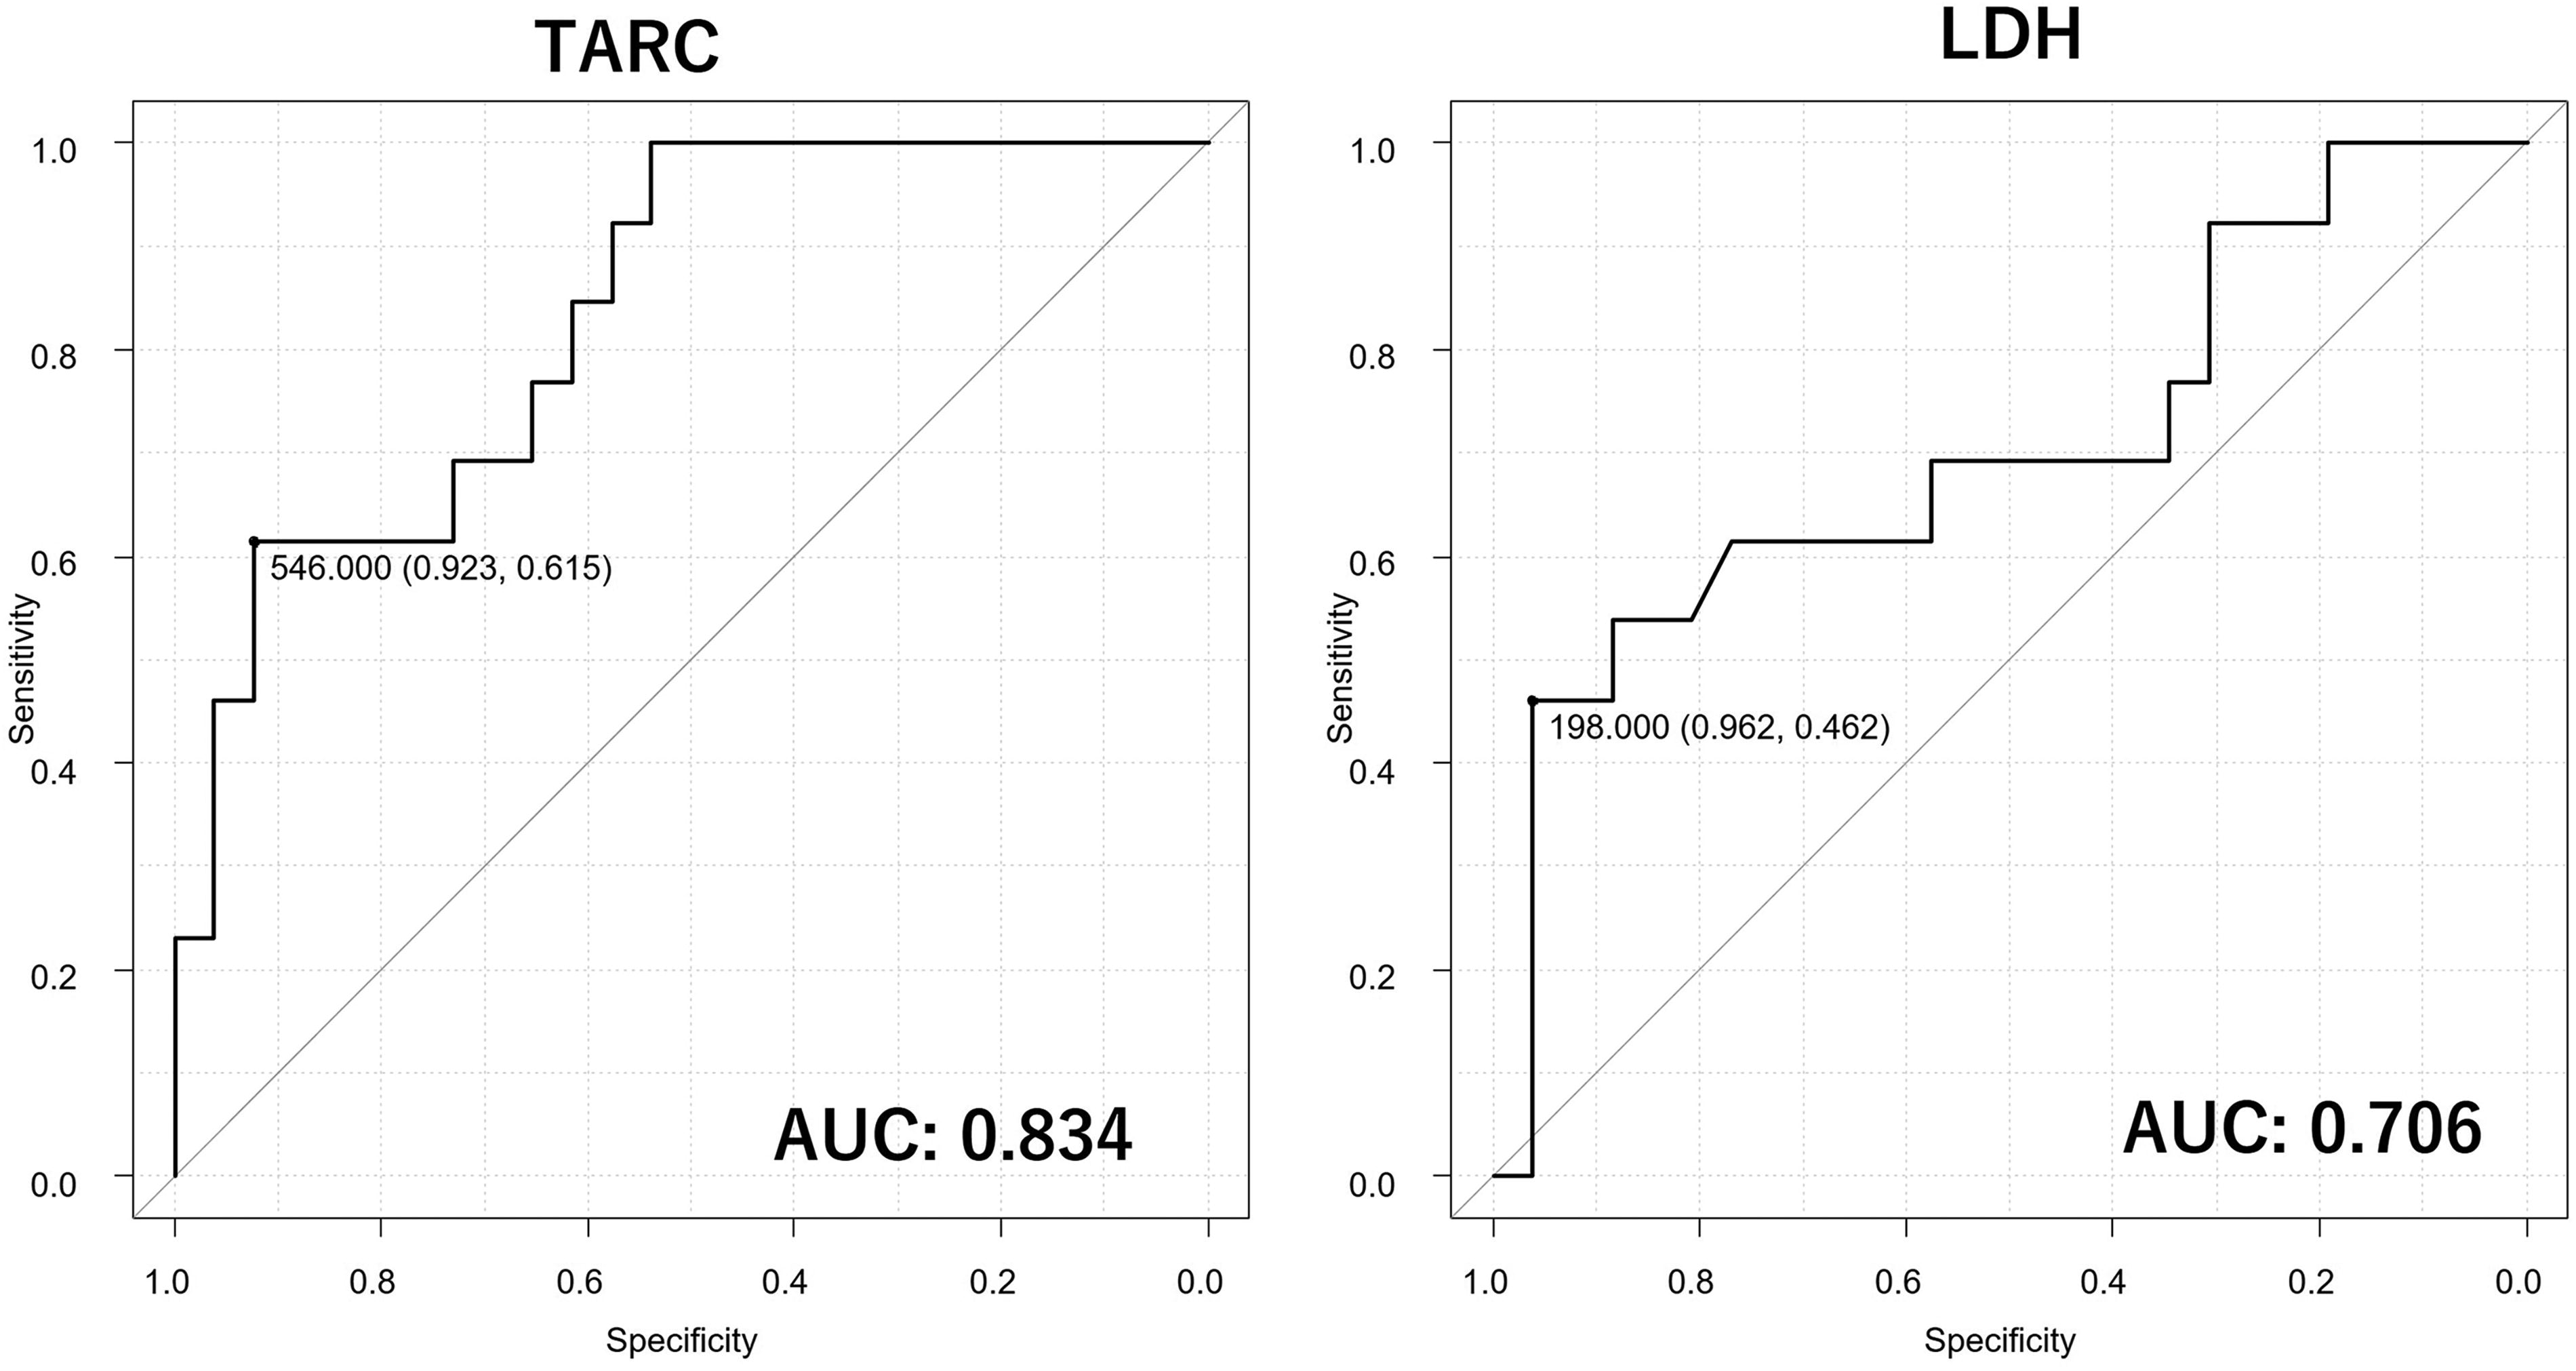
Receiver operating characteristic curves evaluating the predictive abilities of baseline values of thymus and activation‐regulated chemokine (TARC) or LDH to distinguish week 48 delayed responders from poor responders to tralokinumab treatment for atopic dermatitis. The area under the curve (AUC) of baseline TARC was 0.834 (95% confidential interval [CI]: 0.705–0.963), with specificity of 92.3% and sensitivity of 61.5% at a cutoff value of 546 pg/mL. The AUC of baseline LDH was 0.706 (95% CI: 0.515–0.896), with specificity of 96.2% and sensitivity of 46.2% at a cutoff value of 198 IU/mL.
Transition of EASI and PP‐NRS in Delayed Responders Compared with Poor Responders Throughout 48 Weeks of Tralokinumab Treatment
The transition of clinical indexes during the 48‐week treatment period was compared between delayed responders versus poor responders (Fig. 3). Although EASI scores continued to decrease through 48 weeks in both groups, the amount of decrease until week 48 was larger in delayed responders, and EASI at week 48 in delayed responders (median 0.56) was much lower compared with poor responders (median 5.75).
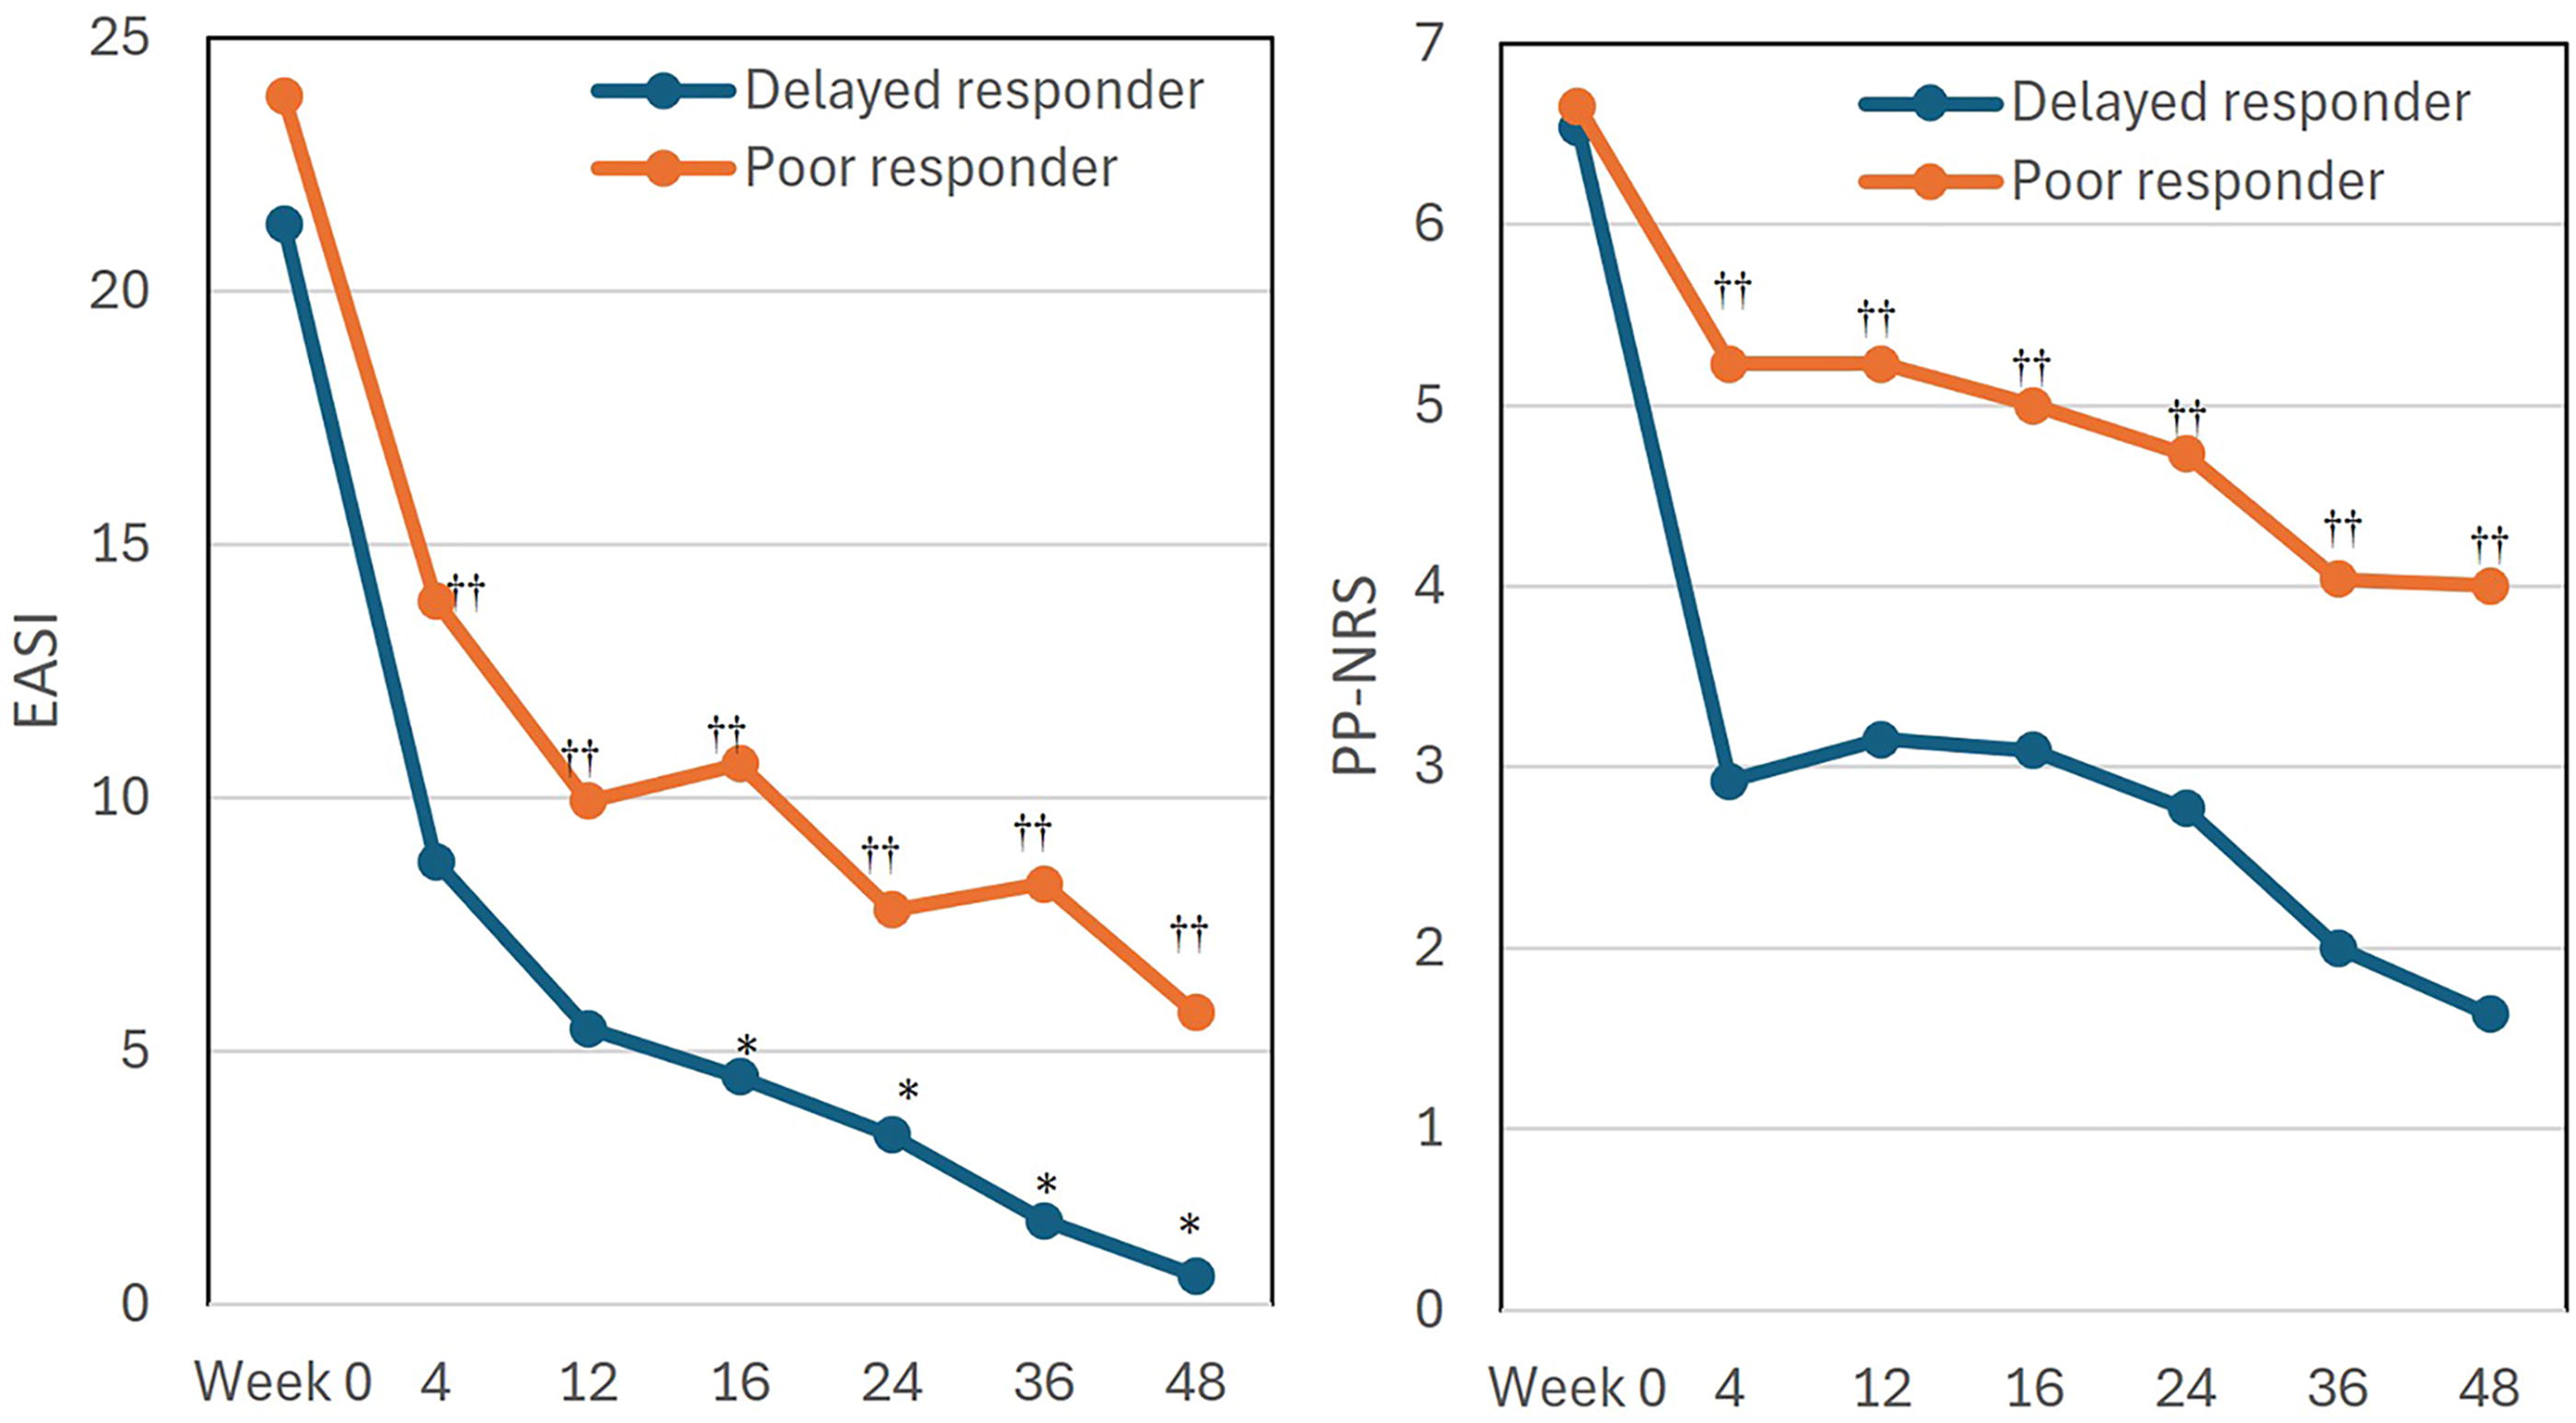
The transition of clinical indexes during treatment with tralokinumab in week 48 delayed responders (n = 13) and poor responders (n = 27). Values of eczema area and severity index (EASI) and peak pruritus numerical rating scale (PP-NRS) are shown as medians for delayed responders (blue line) and poor responders (orange line) at baseline (week 0) and weeks 4, 12, 16, 24, 36, and 48. *P < 0.05 versus week 0 in delayed responders; ††P < 0.01 versus values of week 0 in poor responders, by Friedman’s test with Bonferroni’s correction.
Delayed responders exhibited a rapid decrease of PP‐NRS at week 4, with further decrease until week 48, while poor responders demonstrated smaller amount of PP‐NRS decrease compared with delayed responders, indicating insufficient improvement of pruritus. PP-NRS at week 48 in the delayed responders (median 1.64) was much lower compared with poor responders (median 4). The absence of statistically significant differences from baseline in PP-NRS of delayed responders may possibly be due to the small number of cases.
Transition of IgE, TARC, LDH, and TEC in Delayed Responders Compared with Poor Responders Throughout 48 Weeks of Tralokinumab Treatment
The transition of laboratory indexes during the 48‐week treatment period was compared between delayed responders versus poor responders (Fig. 4). Baseline IgE level in poor responders appeared higher compared with delayed responders. IgE value in poor responders robustly decreased, while that in delayed responders fluctuated and did not significantly decrease through 48 weeks. Similarly, baseline TARC level in poor responders was higher compared with delayed responders. TARC value in poor responders robustly decreased, while that in delayed responders was mostly stable through 48 weeks. Baseline LDH in poor responders was higher compared with delayed responders. The LDH level in poor responders continued to decrease moderately but significantly until week 48, while that in delayed responders was mostly stable. Baseline TEC level in poor responders appeared higher compared with delayed responders. The TEC level in poor responders increased and peaked at week 12; thereafter, it fluctuated slightly and decreased at week 48, though without statistically significance. Similar trend of TEC level was observed in delayed responders.
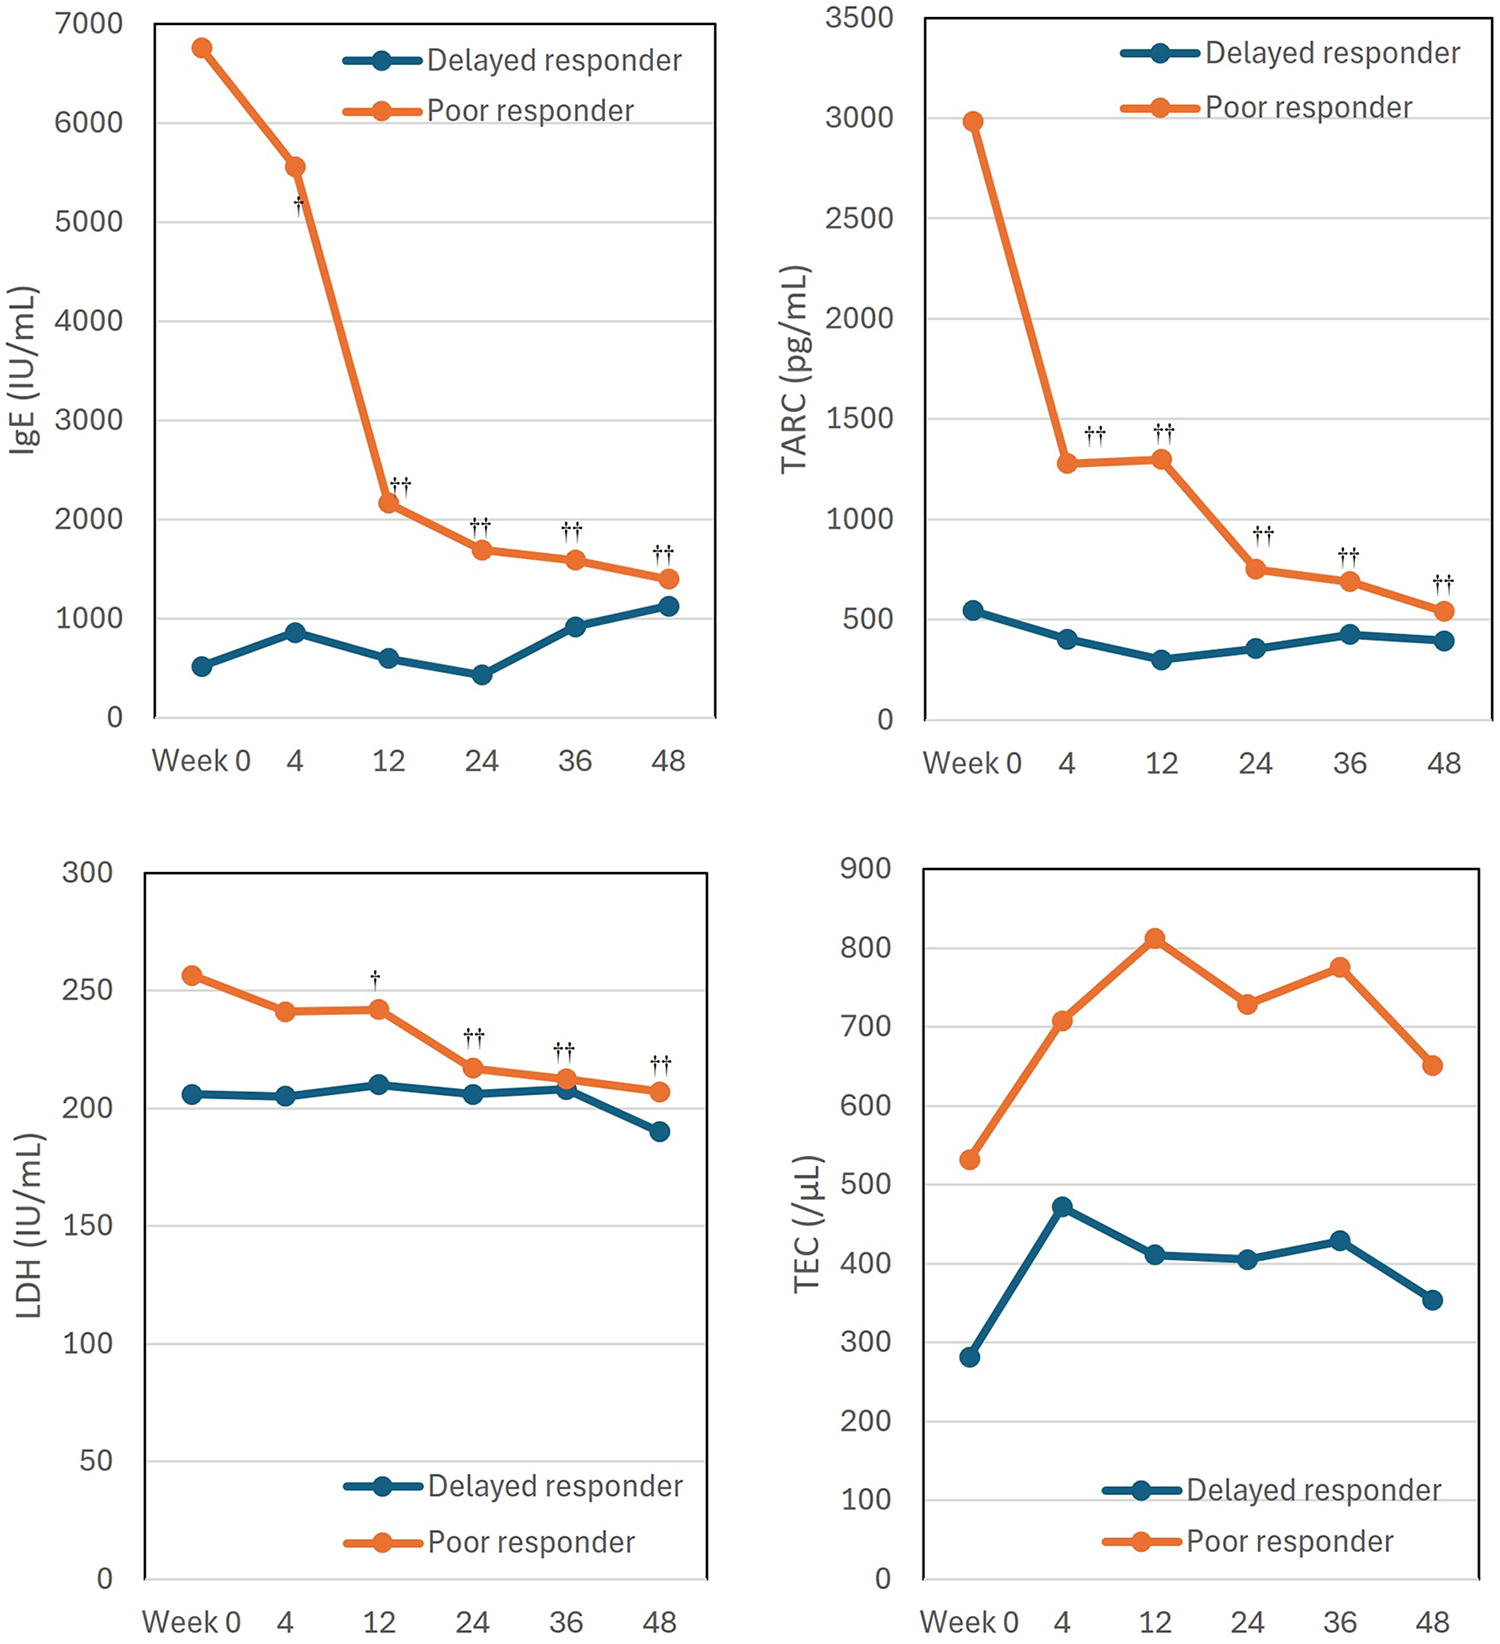
The transition of laboratory indexes during treatment with tralokinumab in week 48 delayed responders (n = 13) and poor responders (n = 27). Values of IgE, thymus and activation-regulated chemokine (TARC), LDH, and total eosinophil count (TEC) are shown as medians for week 48 delayed responders (blue line) and week 48 poor responders (orange line) at baseline (week 0) and weeks 4, 12, 16, 24, 36, and 48. †P < 0.05, ††P < 0.01 versus values of week 0 in poor responders, by Friedman’s test with Bonferroni’s correction.
DISCUSSION
In this study, the transition of achievement rates of IGA 0/1 indicates that there are 3 phase-dependent responders to tralokinumab: early (week 12), mid-term (week 24), and delayed (week 48) responders. The possible predictive factors for early and mid-term responders were identified in our previous study; absence of prior systemic therapy, female sex, younger age, shorter duration of AD, lower BMI, and MLR may predict early responders, while absence of prior systemic therapy, lower IgE, TARC, PLR, and CRP may predict mid-term responders. 32 In this study, we focused on week 48 delayed responders. The delayed responders to tralokinumab had lower proportions of males and prior systemic therapy, and lower baseline values of TARC and LDH, compared with poor responders. The results indicate that female sex, absence of prior systemic therapy, and lower TARC and LDH may predict delayed responders to tralokinumab.
First, the lower proportion of prior systemic therapy, in other words, a higher proportion of systemic therapy-naïve patients, was the characteristic of delayed responders in this study and was common to early and mid-term responders in our previous study. 32 The findings indicate that systemic therapy-naïve patients may be more likely to achieve clear or almost clear skin compared with systemic therapy-experienced patients irrespective of the phase of tralokinumab treatment. We also found that achievement rates of EASI 75, EASI 90, and IGA 0/1 at week 24 of tralokinumab treatment in systemic therapy-naïve patients were higher than those in systemic therapy-experienced patients. 42 These results may be possible because systemic therapy-experienced patients may include potentially treatment-resistant population, generating resistance to tralokinumab treatment.
Lower proportion of males, in other words, higher proportion of females in the delayed responders in this study, was similarly seen in week 12 responders to tralokinumab in our previous study. 32 Relatedly, a systematic review and meta-analysis showed that female sex was associated with EASI 75 at 12–16 weeks of anti-IL‐4 receptor alpha antibody dupilumab treatment, 43 indicating that female patients with AD may be more responsive to IL‐13 inhibitors than male patients. Such possible sex-dependent responsiveness may be related to sex chromosomes or hormones.44–45 Further studies using cohorts of a larger size and various ethnicities should scrutinize the reproducibility of our results.
Lower baseline TARC level in delayed responders compared with poor responders in this study was similarly seen in week 24 responders to tralokinumab in our previous study. 32 Since IL‐13 promotes TARC production in dendritic cells,46–47 patients with lower TARC levels may have lower abundance of IL-13 signals, indicating a higher susceptibility to anti-IL-13 antibody tralokinumab.
Baseline LDH level in delayed responders was lower compared with poor responders. Similarly, a previous real-world study reported higher baseline LDH level in week 12 poor responders (IGA >2) compared with responders to tralokinumab. 48 Relatedly, real‐world study showed a negative correlation between baseline LDH and achievement of EASI ≤7 at week 16 of dupilumab treatment. 49 Since the source of serum LDH in patients with AD is at least partly epidermal keratinocytes or immune cells damaged by skin inflammation, 50 patients with lower LDH may indicate lower levels of skin inflammation, and may be more susceptible to the tralokinumab-mediated inhibition of skin inflammation.
When transitions of laboratory indexes were compared between delayed responders and poor responders, IgE and TARC robustly and LDH moderately continued to decrease throughout 48 weeks in poor responders, while no significant changes were observed in delayed responders. The absence of significant changes of these laboratory indexes in delayed responders may at least partially reflect lower baseline levels of these indexes, indicating no room for reduction. However, as Figure 4 suggests, the baseline values of these biomarkers seem more important than their dynamic changes for predicting long-term effectiveness. Even though poor responders exhibit some decrease in IgE, TARC, or LDH, a high baseline level may still correlate with less favorable outcomes. Therefore, we should evaluate both baseline levels and subsequent changes when interpreting these biomarkers in clinical practice. On the contrary, TEC increased from week 4 to week 36 both in poor responders and delayed responders, though without statistical significance. The transient increase of TEC during tralokinumab treatment is also reported previously 51 and may be related to the suppression on IL-13-induced expression of eosinophil-attracting chemokines or adhesion molecules by tralokinumab, and the resultant decrease of tissue infiltration of eosinophils and their retention in blood. 52 The transition of TEC should further be followed up for a longer duration, such as 2 years of tralokinumab treatment.
In this study, delayed responders showed a rapid decrease of PP‐NRS by week 4 of tralokinumab treatment, whereas poor responders showed a slower and partial decrease of PP-NRS through 48 weeks. Relatedly, we found that PP‐NRS ≤1 at week 2 of upadacitinib 15 mg treatment predicted EASI 100 at weeks 12 and 24. 53 Therefore, it is possible that early improvement of PP-NRS may predict delayed responders to tralokinumab, and this possibility should be investigated by further studies.
Our present results indicate that female and systemic therapy-naïve patients who do not achieve IGA 0/1 at week 24 but with low basal TARC (<546 pg/mL) or LDH (<198 IU/mL) may better continue the tralokinumab treatment, expecting delayed response at week 48, rather than switching to the other systemic therapy. Especially, predictive ability of TARC appears higher than that of LDH based on AUC values. Further studies using larger cohorts should establish the more correct cutoff values of TARC or LDH to predict delayed response to tralokinumab.
There are several limitations in this study. First, it was conducted at a single center with a small sample size. Second, only Japanese patients were included. Third, the potency or amount of topical therapy might influence the efficacy of tralokinumab. Fourth, some poor responders experienced seasonal flares or poor adherence to topical treatment, which might affect their response. Fifth, medications used for comorbid conditions in patients might influence the values of clinical or laboratory indices. Last, some patients with poor response at week 24 were switched to other systemic therapies due to the patients’ wishes, which reduced the number of participants.
CONCLUSION
Female sex, absence of prior systemic therapy, and lower baseline values of TARC and LDH may predict the week 48 delayed response to tralokinumab in patients with AD.