
Abstract
Background:
Glycemic variability is suggested to be a predictor for the risk of complications of diabetes. A multitude of parameters to express glycemic variability have been described, but no gold standard exists. The easy measurable parameter SD has been shown to be strongly related to other parameters in a group of patients with mostly well-controlled type 1 and type 2 diabetes mellitus (T1DM and T2DM, respectively). Glycemic variability is higher in T1DM compared with T2DM in mixed populations with different treatments, but studies in patients on intensive insulin treatment are lacking. Therefore in this study we investigate different parameters of glycemic variability and differences between T1DM and T2DM in inadequately controlled patients on intensive insulin treatment.
Methods:
In this cross-sectional, observational study we describe glycemic variability, measured as SD, coefficient of variation, continuous overall net glycemic action, and mean of daily differences in a cohort of inadequately controlled T1DM (n = 166) and T2DM (n = 58) patients on intensive insulin treatment.
Results:
SD of 48 h (SDtotal) was highly correlated to all other measured parameters of glycemic variability (r = 0.66–0.88). All parameters of glycemic variability were significantly higher in T1DM compared to T2DM (P < 0.001), although hemoglobin A1c and mean glucose were comparable and treatment regimen was the same. In the cohort of T2DM patients but not T1DM, a longer duration of insulin therapy was associated with higher glycemic variability.
Conclusions:
SDtotal is a conveniently measurable parameter to express glycemic variability in patients with inadequate control with intensive insulin therapy. Patients with T1DM and long-lasting T2DM have the highest glycemic variability.
Introduction
Glycemic variability can be calculated from data obtained by continuous glucose monitoring (CGM). A multitude of parameters to express glycemic variability have been described, but no gold standard exists. The easy measurable parameter SD has been shown to be strongly related to other parameters of glycemic variability in a group of patients with mostly well-controlled T1DM and T2DM. 5
Glycemic variability is higher in T1DM compared with T2DM in mixed populations with different treatments, 6,7 but studies in patients on intensive insulin treatment are lacking.
The aims of the present study were to investigate whether SD was correlated to other parameters of glycemic variability in inadequately controlled patients on intensive insulin treatment. Furthermore, our aim was to investigate whether glycemic variability is higher in T1DM versus T2DM, as well as the relation between glycemic variability and different factors in both T1DM and T2DM.
Subjects and Methods
Patients
Data (CGM, clinical, and laboratory data) from all patients receiving offline CGM (CGMS® System Gold™, Medtronic MiniMed, Northridge, CA) from November 2003 until July 2009 were used. CGM was ordered by the treating physician because of inadequate glycemic control (variable glucose values, hypoglycemia episodes, inadequate hemoglobin A1c [HbA1c], or other reasons). Usually a combination of different reasons was present to order CGM for inadequate control. If patients received CGM multiple times in this period, only the first recording was used. The first two fully recorded days were used for analysis, and patients with more than two missing values were excluded. Among a total of 329 patients who received CGM, 39 recordings were incomplete and therefore excluded. The 290 remaining data were from patients with T1DM (n = 174), T2DM (n = 65), secondary diabetes due to cystic fibrosis (n = 27), and other types of diabetes (prednisone-induced [n = 5], latent autoimmune diabetes in adults [n = 7], post-pancreatic surgery [n = 2], and not specified [n = 10]). For this study we included patients with T1DM (n = 166) or patients with T2DM (n = 58) on intensive insulin therapy (insulin pump [continuous subcutaneous insulin infusion] or multiple daily injections). Clinical data, (age, sex, body mass index [BMI], HbA1c, type of therapy, duration of disease, and duration of insulin treatment) were retrieved from medical records.
Analysis of continuous glucose measurements
Data from CGM were recorded for approximately 72 h. Data from the first two fully recorded days (from 00:00 day 1 until 24:00 day 2) were used. SD for both days was calculated. SD was subdivided into SDtotal (SD of 48 h), SDday1, and SDday2. Mean and percentage coefficient of variation (%CV) were calculated for both days separately. Furthermore, the mean %CV of these two days was calculated. Continuous overall net glycemic action (CONGA) and mean of daily differences (MODD) were calculated as described earlier by McDonnell et al. 8 CONGA1, CONGA2, and CONGA4 were calculated (SD of the differences between an observation and another observation 1, 2, or 4 h before, respectively). CONGA1–4 values for both days were calculated separately, and the mean CONGA for both days was also calculated.
Statistical analysis
Results are presented as mean and SD values. Correlations between parameters of glycemic variability are expressed as Pearson's correlations coefficient. A Student's t test was used to compare between any two groups. Difference in variability between T1DM and T2DM were adjusted for different factors (age, sex, BMI, HbA1c, type of therapy, duration of disease, and duration of insulin therapy), using linear regression. Level of significance was set at P < 0.05. Linear regression models (univariate and multivariate) were used to investigate relations between glycemic variability and different factors (as mentioned above). Because T1DM and T2DM are different diseases, we analyzed these groups separately. The relation of each factor with glycemic variability was investigated separately in univariate models, and subsequently all factors with a P value of < 0.10 were investigated in the multivariate model.
Results
For the group of T1DM or T2DM baseline characteristics are given in Table 1. Age and BMI are significantly higher in T2DM, duration of diabetes and the duration of insulin therapy are significantly longer in T1DM, but HbA1c was comparable in both groups. In T1DM more patients were receiving insulin pump therapy. Hypoglycemia, measured by CGMS Gold (glucose <3.9 mmol/L), occurred more frequently in T1DM, whereas measured hyperglycemia (glucose >10.0 mmol/L) was comparable in both groups (Table 1).
Data are mean (SD) or percentage values.
P < 0.01.
BMI, body mass index; HbA1c, hemoglobin A1c; T1DM, type 1 diabetes mellitus; T2DM, type 2 diabetes mellitus.
SDtotal was highly correlated (P < 0.001) with all other parameters on both days and with the MODD. Data shown in Table 2 are from mean values of 2 days from all parameters and MODD. CONGA1, CONGA2, and CONGA4 correlated with each other on the same day, as well as between days individually.
Pearson's correlation coefficient R is given for parameters of glycemic control. Mean values are those for days 1 and 2.
Correlation is significant at the level P < 0.01.
CONGA1, CONGA2, and CONGA4, continuous overall net glycemic action (between an observation and another observation 1, 2, or 4 h before, respectively); %CV, percentage coefficient of variation; MODD, mean of daily differences; SDtotal, SD of a 48-h period.
Parameters of glycemic variability were compared between T1DM and T2DM. SDtotal, MODD, %CV, CONGA1, CONGA2, and CONGA4 (mean of 2 days) were all significantly higher in T1DM compared to T2DM (P < 0.001), whereas the mean glucose and HbA1c were comparable (Table 3). When adjusted for age, BMI, sex, HbA1c, type of therapy, and duration of disease or insulin use, these results were comparable.
Data are mean (SD) values.
CONGA1, CONGA2, and CONGA4, continuous overall net glycemic action (between an observation and another observation 1, 2, or 4 h before, respectively); %CV, percentage coefficient of variation; HbA1c, hemoglobin A1c; MODD, mean of daily differences; NS, not significant; SDtotal, SD of a 48-h period; T1DM, type 1 diabetes mellitus; T2DM, type 2 diabetes mellitus.
In a univariate linear regression model for glycemic variability in T1DM only HbA1c and type of therapy (pump vs. MDI) were related to glycemic variability, whereas age, BMI, and duration of disease or duration of insulin therapy were not (Table 4). In a multivariate model, both factors were independently related to variability, but HbA1c was the strongest factor.
Relations are expressed as β (P value).
Correlation is significant at the 0.05 level.
Correlation is significant at the 0.01 level.
BMI, body mass index; HbA1c, hemoglobin A1c; T1DM, type 1 diabetes mellitus; T2DM, type 2 diabetes mellitus.
In a univariate linear regression model for glycemic variability in T2DM, only duration of insulin therapy was related to glycemic variability, whereas age, BMI, HbA1c, type of therapy, and duration of disease were not related to glycemic variability, although for HbA1c a trend was shown. In a multivariate model, including both duration of insulin and HbA1c, both factors were independently related to variability, although duration of insulin therapy was the strongest factor.
In T2DM, every year of insulin use raises the SDtotal by 0.044, so when a patient uses 10 years of insulin the SDtotal could rise 0.44. The difference in mean SDtotal between T1DM and T2DM is 0.924. One can therefore calculate that only after 21 years of insulin treatment mean SDtotal in T2DM will be similar to the mean SDtotal in T1DM.
Data provided are for glycemic variability, as measured by SDtotal. However, using other parameters of glycemic variability similar results were obtained (data not shown).
Figure 1 shows a scatterplot for the relation between duration of insulin therapy and SDtotal. As can be seen from the horizontal line in Figure 1, SDtotal in T1DM does not change at all with duration of insulin therapy (this is in concordance with the β from Table 4, which approaches zero [0.005]). As can be concluded from Figure 1, in T2DM SDtotal rises with a longer duration of insulin therapy (which is also in concordance with results in Table 4). The difference in interception point of the two lines can be explained by the fact that Figure 1 shows a univariate analysis of the relation of SDtotal with duration of insulin therapy, whereas Table 4 considers a multivariate analysis, taking into account the effect of HbA1c.
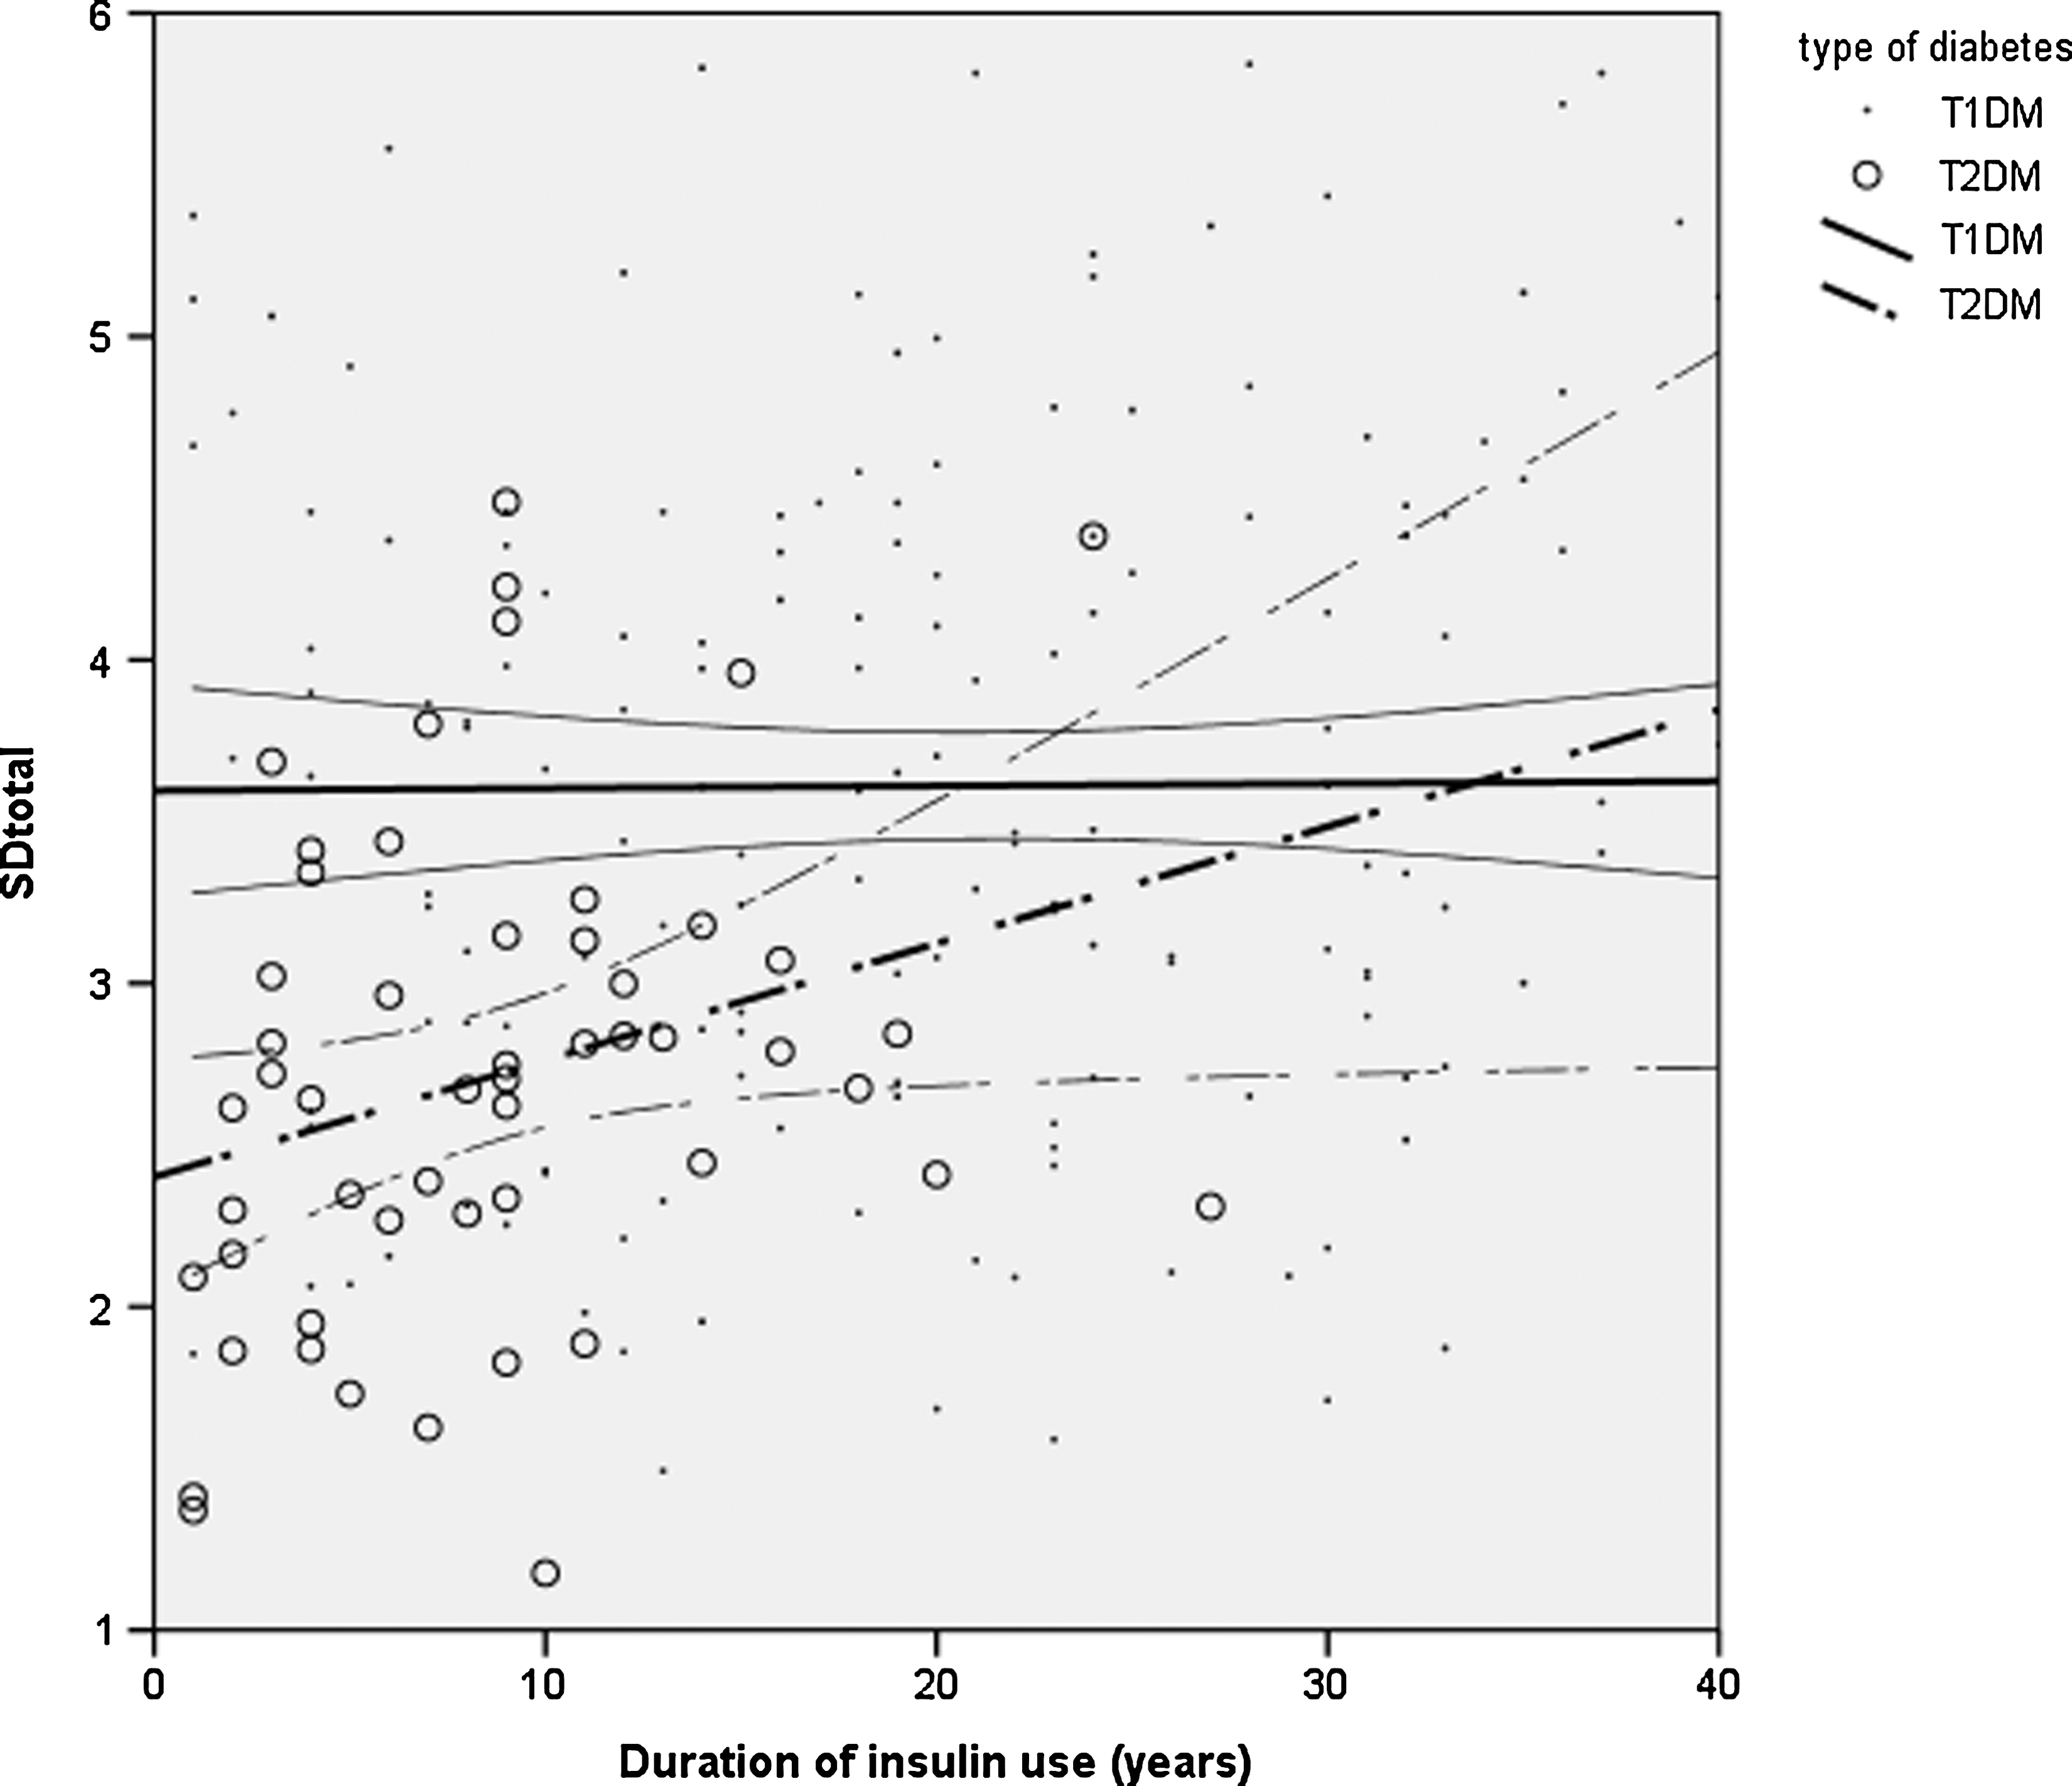
Scattergram with superimposed regression lines (and 95% confidence interval) showing the relation of glycemic variability (SD over a 48-h period [SDtotal]) with duration of insulin therapy in type 1 and type 2 diabetes (T1DM and T2DM, respectively).
Discussion
This study shows higher glycemic variability in T1DM patients compared to T2DM patients, whereas mean glucose concentration, HbA1c levels, and treatment regimens were similar. In T2DM but not T1DM patients, a longer duration of insulin therapy was related to higher glycemic variability. Finally, SDtotal in inadequately controlled T1DM and T2DM was highly correlated with other parameters of glycemic control and can be used as an easily accessible measure of variability.
More than 20 parameters have been described to measure glycemic variability, but no gold standard exists. 5 Although mean amplitude of glucose excursions is the oldest parameter to measure glycemic variability, it is open to several interpretations. 9 Rodbard 5 described a strong correlation between SDtotal and other parameters of glycemic variability in a mixed patient population, with mostly adequate control. Our findings in inadequately controlled patients are in concordance with this study, and correlations were comparable in strength. 5,10 Because data during the first few hours could be unreliable, these are not included in the calculations. A fixed amount of data (48 h) per patient is used to calculate SDtotal.
Higher glycemic variability in T1DM versus T2DM has been described previously. One study showed higher variability (measured as SD) in T1DM versus T2DM, but information on treatment or HbA1c was lacking. 6 Another study also found a higher variability (measured as mean amplitude of glucose excursions) in T1DM versus T2DM, although treatment of T1DM (all intensive insulin) was different from treatment in T2DM (mix of oral agents/nonintensive/intensive insulin treatment). 7 In our study, similar differences in variability cannot be explained by differences in treatment or HbA1c because both groups were receiving intensive insulin treatment and had similar HbA1c concentrations, but it is more likely to be caused by the type of diabetes per se.
Interestingly, duration of insulin therapy was related to glycemic variability in T2DM but not in T1DM. This could be explained by a quick progression of disease in T1DM. With progressive disease, β-cell mass and endogenous insulin decrease. This is followed by α-cell dysfunction, which leads to inappropriate hyperglucagonemia after meals. In T1DM this process occurs quickly, leaving little residual endogenous insulin secretion in a very short time. In T2DM, progression of disease occurs much slower, and endogenous insulin secretion will slowly decrease over many years, which may explain the relationship between the duration of insulin use and the variability in T2DM. Despite this, no relation was found between duration of disease and variability. This may be explained by the fact that, in contrast to the start of insulin, the start of T2DM is difficult to pinpoint because a variable silent period can be present before detection.
The suggested relation between β-cell loss (duration of insulin therapy) and variability in T2DM is in concordance with other studies. One study showed that glycemic variability was related to postprandial β-cell dysfunction in T2DM patients on oral agents or diet. 11 Another study also found a relation between insulin duration and variability. 12
Because glycemic variability is suggested to be a risk factor for complications, pharmacological agents influencing variability could be of interest in the future. Glucagon-like peptide-1 analogs as well as dipeptidyl peptidase-4 inhibitors have already been shown to decrease glucose variability. 13,14 Because glycemic variability is higher in T1DM and increases with duration of insulin use in T2DM, these agents might be of specific interest in these patient groups.
This study has some limitations. Although all patients who received CGM in a particular period in our center were included in this study, CGM was performed for clinical reasons and not at random. So results can only be extrapolated to patients in daily clinical practice who need CGM. Furthermore, although all patients attended our clinic and all patients received standard care, food intake and insulin regimens were not specifically standardized on the days patients wore the CGM device.
In conclusion, SDtotal is a convenient parameter for the expression of glycemic variability in patients with inadequate control with intensive insulin therapy. Patients with T1DM and long-lasting T2DM have the highest glycemic variability. In T2DM, but not T1DM longer duration of insulin use is associated with increased glycemic variability.
Footnotes
Author Disclosure Statement
No competing financial interests exist.