
Abstract
Background:
In the interest of preserving residual insulin secretory capacity present at the time of diagnosis with type 1 diabetes (T1D), we compared the efficacy of starting insulin pump therapy at diagnosis with standard multiple daily insulin injections (MDIs).
Methods:
We conducted a prospective, randomized, pilot trial comparing MDI therapy with continuous subcutaneous insulin therapy (pump therapy) in 24 patients, 8–18 years old, with newly diagnosed T1D. Subjects were evaluated at enrollment and 1, 3, 6, 9, and 12 months after initial diagnosis of T1D. Preservation of insulin secretion, measured by mixed-meal–stimulated C-peptide secretion, was compared after 6 and 12 months of treatment. Between-group differences in glycosylated hemoglobin (HbA1c), continuous glucose sensor data, insulin utilization, anthropometric measures, and patient satisfaction with therapy were also compared at multiple time points.
Results:
Initiation of pump therapy within 1 month of diagnosis resulted in consistently higher mixed-meal tolerance test–stimulated C-peptide values at all time points, although these differences were not statistically significant. Nonetheless, improved glycemic control was observed in insulin pump-treated subjects (more time spent with normoglycemia, better mean HbA1c), and pump-treated subjects reported comparatively greater satisfaction with route of treatment administration.
Conclusions:
Initiation of insulin pump therapy at diagnosis improved glycemic control, was well tolerated, and contributed to improved patient satisfaction with treatment. This study also suggests that earlier use of pump therapy might help to preserve residual β-cell function, although a larger clinical trial would be required to confirm this.
Introduction
Therefore, we hypothesized that initiation of CSII at the time of diagnosis would improve glycemic control and conserve endogenous insulin secretion beyond that achieved with standard MDI therapy and would be well tolerated by the patient. A pilot study was conducted to test this hypothesis.
Subjects and Methods
Participants and protocol
Children and adolescents newly diagnosed with T1D, 8–18 years old, were recruited from clinics at Arkansas Children's Hospital, Little Rock. Approval was obtained from the Institutional Review Board of the University of Arkansas for Medical Sciences, Little Rock, and parental consent along with subject assent (for those 8–17 years old) or subject consent (for those 18 years old) was obtained from all participants. Inclusion criteria included (1) medical diagnosis of T1D, confirmed at Arkansas Children's Hospital, including the presence of at least one pancreatic autoantibody (ICA512 or GAD65), (2) serum bicarbonate level of ≥15 mmol/L at the time of presentation, and (3) enrollment within 4 weeks of the date of diagnosis of T1D. Exclusion criteria included (1) moderate or severe diabetic ketoacidosis at the time of diagnosis (bicarbonate level of ≤14 mmol/L), (2) type 2 diabetes mellitus, (3) history of other chronic systemic inflammatory or autoimmune disease or malignancy, (4) pregnancy, or (5) participation in another research protocol or use of another investigational agent for the treatment of newly diagnosed T1D.
This pilot study was conducted as a prospective, randomized trial with two treatment arms. Eligible subjects were randomly assigned using Breeze/STAT® software (GRG Associates, Indianapolis, IN) to receive therapy with either MDI of insulin (Group 1; MDI) or with CSII (Group 2; Pump).
All subjects received initial instruction, in accordance with American Diabetes Association guidelines 10 for home diabetes management, as per the standard new-onset T1D education protocol at Arkansas Children's Hospital. The goals of therapy included (1) home blood glucose testing six or more times per day, (2) target blood glucose ranges of 70–170 mg/dL for ages 8–12 years and 70–150 mg/dL for ages 13–18 years, and (3) use of the hypoglycemia treatment protocol for blood glucose levels of <70 mg/dL. Insulin dose adjustments were made by study personnel, either at study visits or by biweekly telephone contact. All study subjects used a OneTouch® Ultra® blood glucose meter (LifeScan, Inc., Milpitas, CA).
Participants were evaluated at the time of enrollment and again at routine outpatient visits at 1, 3, 6, 9, and 12 months after initial diagnosis of T1D. A fasting 10-mL venous blood sample was obtained at each time point for the measurement of fasting blood glucose and glycosylated hemoglobin (HbA1c) (all visits) and pancreatic autoantibodies (ICA512 and GAD65 [performed by Esoterix, Inc, Calabasas Hills, CA] at baseline and 12-month visit). At the 6- and 12-month visits participants were asked to complete a patient satisfaction questionnaire and obtain a 72-h interval recording of continuous glucose monitor sensor data (using the model MMT-7102 CGMS, Medtronic Minimed®, Northridge, CA). To assess pancreatic β-cell function, a mixed-meal tolerance test (MMTT) was also completed at the 6- and 12-month visits. 11 The MMTT was conducted following an 8–12-h overnight fast. For subjects in Group 1, bedtime Lantus® (Sanofi-Aventis, Bridgewater, NJ) or NPH insulin was administered, but morning insulin doses were withheld prior to MMTT. For subjects in Group 2, the insulin pump infusion was suspended 1 h prior to starting the MMTT. A venous blood sample for glucose and C-peptide was obtained 5 min before administration of a 6 mL/kg quantity of Boost® (Mead-Johnson, Evansville, IN) consumed over a 10-min period; blood samples for glucose and C-peptide were then obtained at 30, 60, 90, and 120 min after Boost ingestion. Random, pre-therapy C-peptide values were obtained at the time of initial diagnosis, as part of routine clinical care, and were assayed by ARUP Laboratories (Salt Lake City, UT). C-peptide measurements during MMTT as well as all other laboratory parameters were assayed through the Arkansas Children's Hospital clinical laboratory.
Individual details of insulin use, total daily doses, and the basal and bolus components of therapy were assessed at each visit from continuously recorded patient diaries (Group 1) or patient diaries along with insulin pump download confirmation (Group 2). Insulin doses used in the 4 days preceding each visit were recorded and averaged. Hence, the baseline insulin dose for subjects in Group 2, similar to those in Group 1, was the prepump 4-day average injected insulin dose.
For those subjects in Group 2, insulin pumps (pump model IR 1250) and insulin pump supplies (1 year) were provided free of charge by Animas Corp. (West Chester, PA). Subjects in Group 1 were offered the option to transition to CSII therapy at the conclusion of the study, to receive an equivalent year of free supplies.
Statistical methods
A basic exploratory analysis of all the variables considered for analysis, checking for outliers and underlying distributional assumptions, was completed; normality assumptions for continuous measures were tested using the Anderson–Darling test. Baseline demographic and anthropometric variables (age, gender, race, height, weight, and body mass index [BMI]) were tested for homogeneity across the two groups. Continuous measures for height, weight, and BMI at baseline were compared using a two-sided two-sample t test, and categorical variables such as race and gender were compared using Fisher's Exact test.
Primary outcome measure
Preservation of insulin secretion over time as measured by intermittent meal-stimulated C-peptide testing (via MMTT) was compared for the two groups after 6 and 12 months of treatment. C-peptide levels measured at baseline and 30, 60, 90, and 120 min were compared using a one-sided (H1: μMDI<μPump) two-sample t test and Wilcoxon Rank Sum (WRS) test at both the 6- and 12-month visits. Total area under the curve (AUC) for C-peptide and glucose was computed using the trapezoidal rule and compared between the two groups at the 6- and 12-month visits. 12 AUC was estimated using both SAS version 9.2 (SAS Institute, Cary, NC) and Stata version 11.2 (Stata Corp., College Station, TX) as a verification of the calculations. Because C-peptide measures were available at multiple time points for each subject at both 6 and 12 months, linear mixed-effects models were also used to test for any significant effects accounting for the repeated measures per subject. A first-order autoregressive structure was assumed for the correlation structure of the repeated measures between subjects. The analysis was done at both 6 and 12 months to assess the effects of treatment group, time, and group-over-time interaction. The change in C-peptide AUC between the 6- and 12-month visits was also tested using a one-sided t test and WRS test (H1: μMDI>μPump). Finally, effect size and the sample size per group required to detect the effect size difference were estimated for the primary outcome measure at each time point assuming a one-sided t test with 80% power and a conventional Type I error rate of 5%, to provide a comparison with the empiric power calculation completed as part of our initial study design.
Secondary outcome measures
Average glucose as measured by the CGMS obtained over a 72-h period was compared for the two groups using a one-sided t test (H1: μMDI>μPump). Percentage of time spent in hyperglycemia (>180 mg/dL), hypoglycemia (<70 mg/dL), or target glucose range (70–180 mg/dL) during CGMS was estimated using a one-sided Wald test (out of normal range H1: πMDI>πPump) assuming a beta regression model for the percentage of time. Several statistics characterizing glycemic variation were also estimated from CGMS data. Mean of daily differences and continuous overall net glycemic action were estimated using previously detailed methods, 13 with continuous overall net glycemic action calculated at 1, 2, 3, 4, and 24 h. The mean amplitude of glycemic excursions (MAGE) was calculated as the absolute difference between local maximum “upstrokes” and local minimum “downstrokes” identified by visual inspection of each CGMS report. MAGE was also approximated as 2.45×the total glucose SD observed by the CGMS. 13 A one-sided t test and WRS tested the hypothesis that better glycemic control would be seen in the Pump group than the MDI group. Agreement between observed and approximated MAGE was estimated using the concordance correlation coefficient (CCC), 14 which characterizes perfect agreement as a 45° line.
Differences in HbA1c, fasting fingerstick glucose, and fasting venous plasma glucose measures at each time point were compared for the two groups using a one-sided t test and a WRS test. Changes in height, weight, and BMI measures from baseline to 6 and 12 months were compared using a paired t test and WRS test.
Insulin dose-adjusted HbA1c (IDAA1C) values were calculated for the baseline and 6- and 12-month visits, using the methods of Mortensen et al., 15 as HbA1c (%)+(4×total daily insulin dose [in units] per weight [in kg]). Differences in IDAA1C between groups were tested using the one-sided t test and WRS test under the hypothesis that better glycemic control and subsequently lower IDAA1C would be seen in Group 2 (H1: μMDI>μPump). Pearson correlations between IDAA1C and the peak stimulated C-peptide value, as well as the C-peptide AUC, were also examined.
Participant satisfaction with the assigned treatment was assessed by self-report questionnaire at the 6- and 12-month visits (Table 1). The questions were scored on a 7-point Likert scale, with 1=total agreement and 7=total disagreement. Differences between groups on the satisfaction responses were examined using Fisher's Exact test. Homogeneity of responses across categories was assessed using the Mantel–Haenszel test assuming the MDI group responses as the reference. The results of the Mantel–Haenszel test were only interpreted if the Fisher's Exact test was significant because of the small frequency of responses available.
Values in bold type are significantly different between groups.
CI, confidence interval, OR, odds ratio.
Recognizing that this study was intended as a pilot investigation of the primary hypothesis, one-sided tests in favor of a beneficial effect of CSII over MDI were assumed for all two-group statistical tests, assuming a Type I error rate of 0.05.
Results
Of the 104 age-appropriate patients with T1D who were screened between April 2005 and February 2009, 64 patients declined to participate, and 16 did not meet inclusion or exclusion criteria. A total of 24 participants (12 in each group) were enrolled in the study. One subject in each group withdrew from further participation after initial randomization, possibly because of dissatisfaction with the assigned mode of treatment. Of the remaining 22 subjects, three withdrew before the final 12-month study visit; of these, one completed the 9-month visit (Group 1), one completed the 6-month visit (Group 2), and one completed the 1-month visit (Group 1). Comprehensive data for all study visits were available for 19 subjects. Comprehensive data through the 6-month study visit were available for 21 subjects.
For the subjects in Group 1 (MDI), initial insulin therapy consisted of bedtime insulin glargine (Lantus) with mealtime insulin aspart (Novolog®, Novo Nordisk Pharmaceuticals Inc., Princeton, NJ) for seven subjects versus twice-daily NPH insulin with mealtime insulin aspart (Novolog) for five subjects. Four of these five subjects were transitioned to glargine/aspart therapy at some point between the 6- and 12-month visit. Eleven of 12 subjects in Group 2 used insulin aspart in the pump; one subject used insulin lispro (Humalog®, Eli Lilly and Co., Indianapolis, IN) in the pump.
No statistically significant differences between the two groups were found for the demographic or anthropometric variables of age, gender, race, height, weight, or BMI at baseline (Table 2). For subjects in Group 1, the average duration of T1D prior to study enrollment was 15±10 days, whereas for subjects in Group 2, the average duration of T1D prior to enrollment was 24±8 days, and that to initiation of pump therapy was 25±9 days. Differences from baseline for height, weight, and BMI measured at 6 and 12 months were not significantly different between the two groups (MDI vs. Pump, change from baseline at 12 months: height, +4.72 vs. +4.95 cm, P=0.7; weight, +7.81 vs. +9.21 kg, P=0.6; BMI, +2.11 vs. +2.75 kg/m2, P=0.4), suggesting that assigned therapy did not lead to excessive weight or BMI gain in either group or to inadequate insulin usage and weight loss in either group.
Summaries are reported as mean (SD) value or number (%) as indicated.
BMI, body mass index; MDI, multiple daily injections.
C-peptide values at the time of diagnosis were not significantly different between the two groups (Table 2). C-peptide values obtained during MMTT at both 6 and 12 months of study are shown in Figure 1. In general, neither C-peptide nor C-peptide:glucose measures were statistically significantly greater in the Pump group than the MDI group using either the t test or the WRS test. Total AUC for the Pump group was also not significantly higher than the total AUC for the MDI group (Pump vs. MDI at 6 months, 316.4 vs. 202.7 ng/mL/h, P=0.14). Estimating the differences between groups using a repeated-measures mixed model also failed to detect a significant difference between treatment groups. Finally, the change in C-peptide AUC (6-month AUC minus 12-month AUC) over time did not significantly differ between groups. However, the actual effect sizes observed in this study were less than those anticipated by initial power calculations, leading to an underestimation of the required sample per group needed to determine a statistically significant result (approximately 50 subjects per group vs. 12–15 subjects per group). Despite this limitation, the mean 60-min C-peptide value at 6 months (Fig. 1A) was observed to be higher in Group 2 (Pump) compared with Group 1 (MDI) (3.1±2.2 vs. 1.8±1.4 ng/dL, P=0.10), suggesting that a statistical difference may have been found with a slightly larger sample size. In addition, C-peptide and C-peptide:glucose values in Group 2 (Pump) were higher, on average, at all time points than those in Group 1 (MDI). Also, in Group 2, an increase from baseline C-peptide level to the 6-month, time 0, C-peptide level was observed (0.73±0.75 to 1.37±1.46 ng/mL).
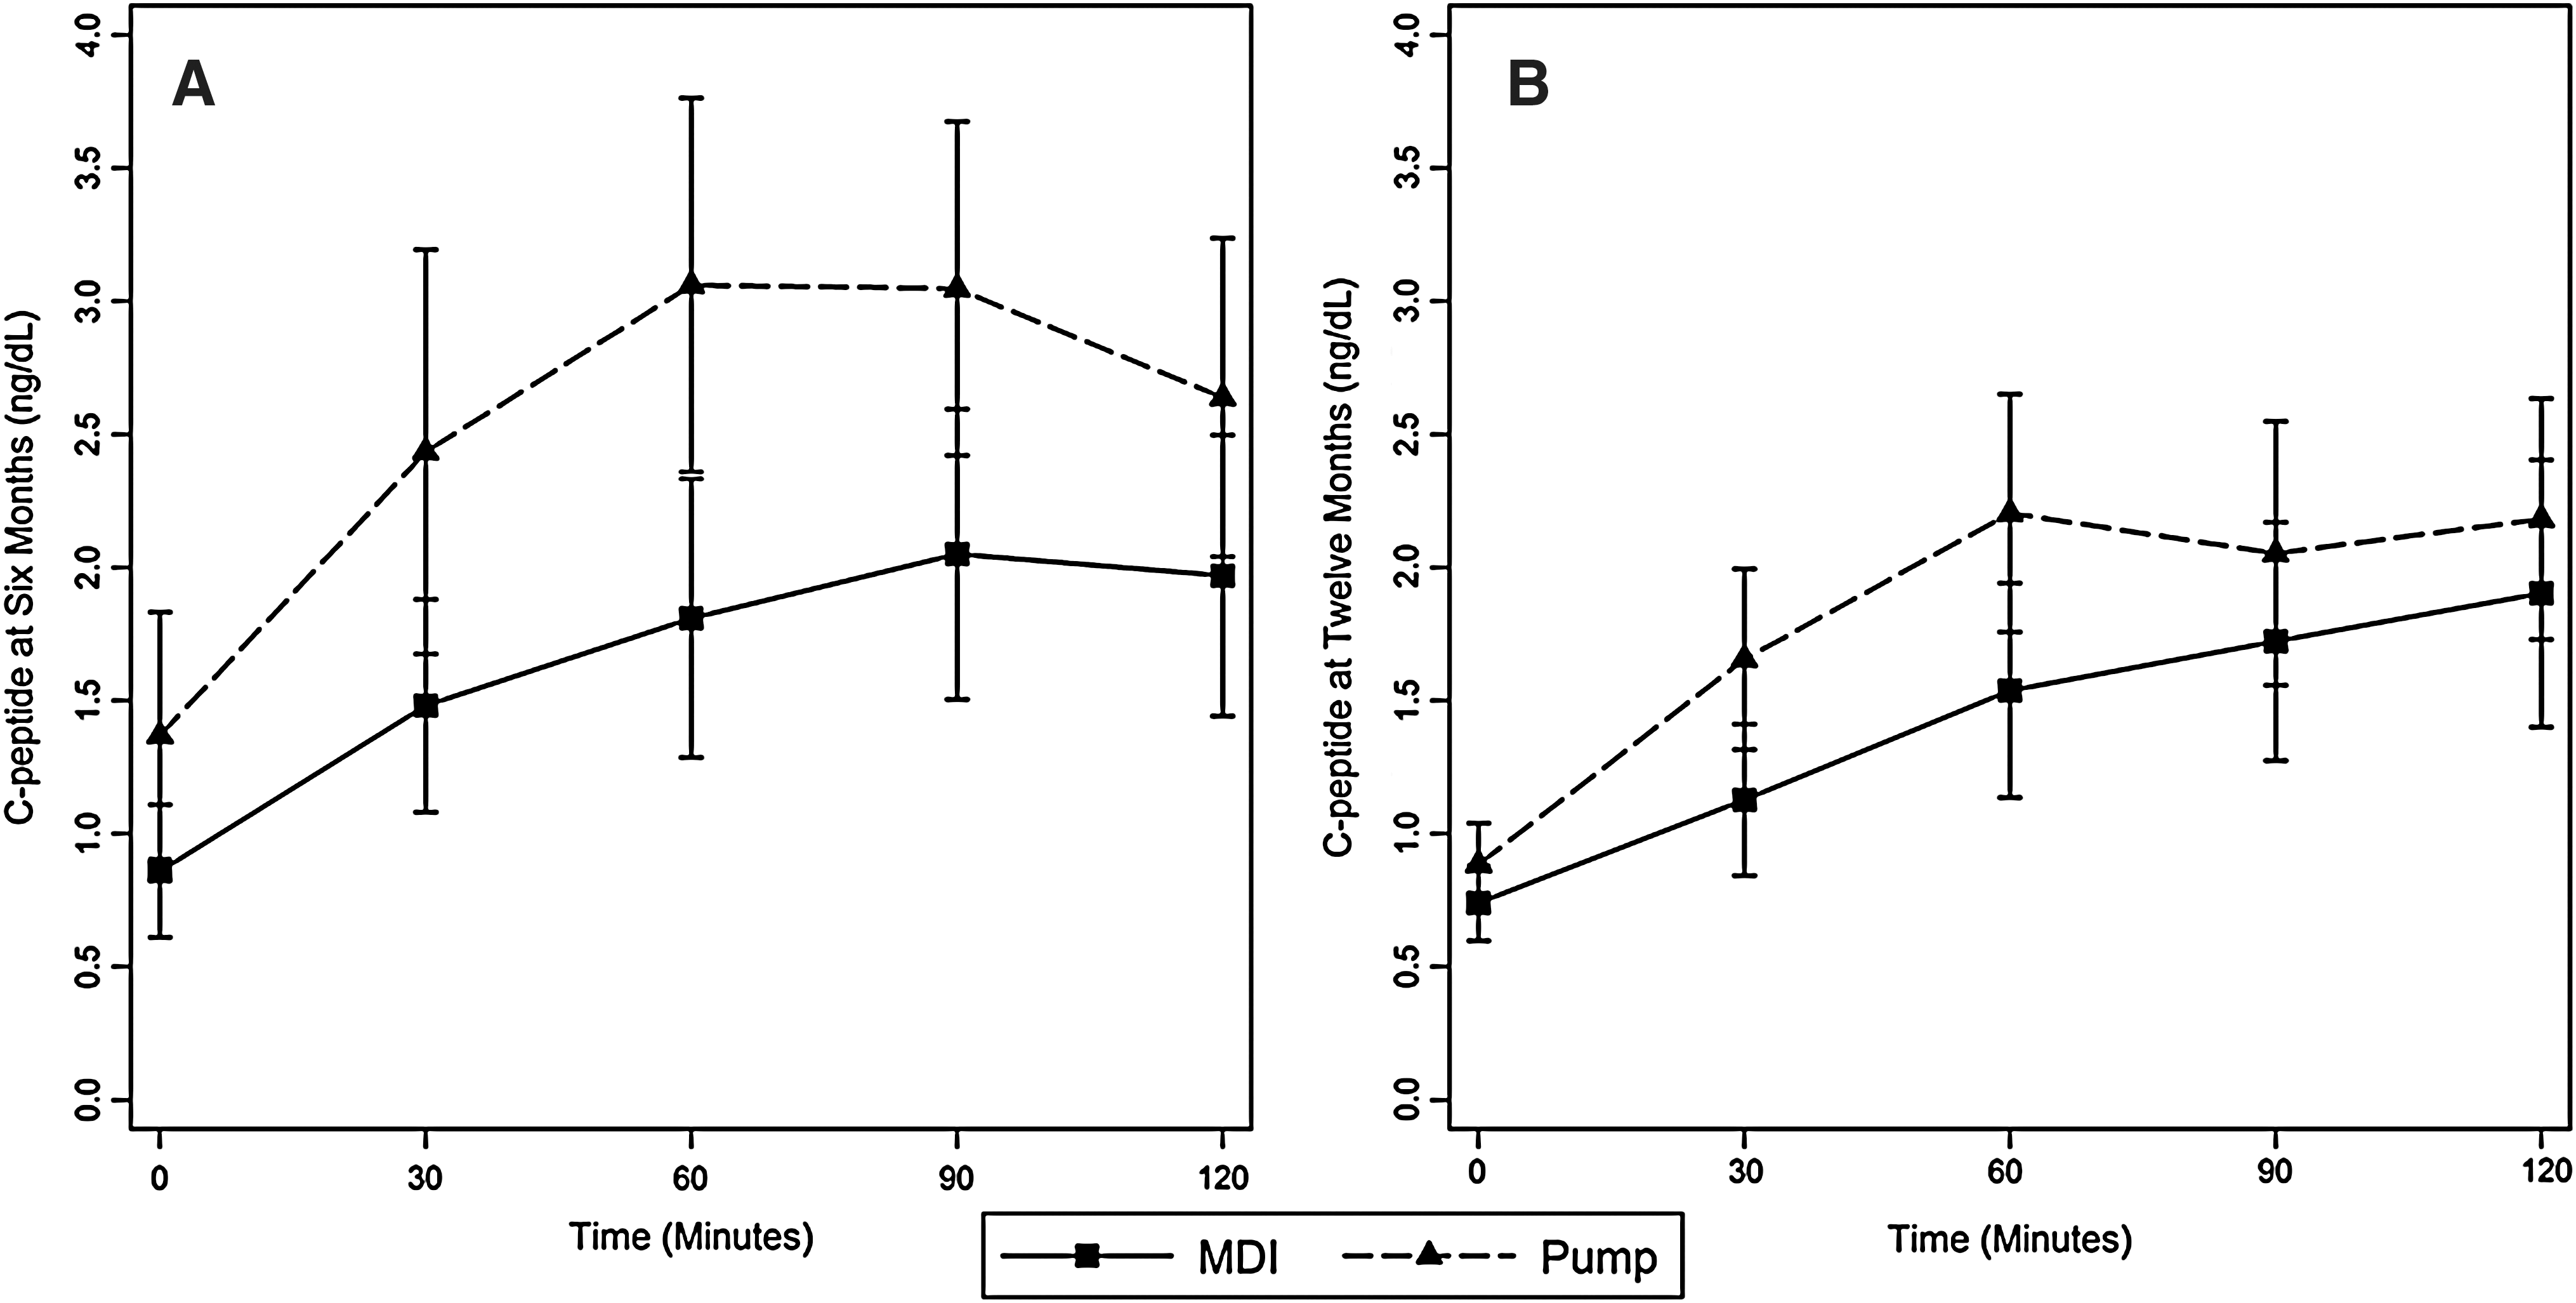
Mixed-meal tolerance test results, shown as C-peptide values, measured at (
Differences between groups for CGMS average glucose, compared at 6 and 12 months, as well as the duration of time spent in the normoglycemia, hypoglycemia, or hyperglycemia range, as monitored by the CGMS, are summarized in Table 3. Average daily glucose as measured by the CGMS sensor scores was not significantly different between the two groups at either 6 or 12 months (Table 3). However, a one-sided t test of the duration of normal glucose maintenance at 6 months showed a significantly longer duration in the Pump group compared with the MDI group (47.3 h vs. 33.6 h, P=0.05); this difference was not maintained at 12 months. Comparing percentage of time spent in normal glucose maintenance using a one-sided Wald test from a beta regression model, the percentage of total CGMS observed time to be within normal glucose limits was significantly higher for the Pump group compared with the MDI group (73.1% vs. 52.9%, P=0.03; Table 3). Furthermore, the percentage of time spent in hyperglycemia was significantly less in the Pump group compared with the MDI group (21.1% vs. 36.0%, P=0.04). Again, these differences failed to be maintained at 12 months. None of the glycemic variability parameters (mean of daily differences, continuous overall net glycemic action, and MAGE) differed statistically between the treatment groups (only MAGE is shown in Table 3). Of note is that almost perfect agreement between the observed and approximated MAGE was estimated at 6 months (CCC6 months=0.94; 95% confidence interval 0.85, 0.97), and moderate agreement was estimated at 12 months (CCC12 months=0.77; 95% confidence interval 0.57, 0.88).
Values in bold type are significantly different between groups.
CGMS, insulin pump system from Medtronic Minimed; HbA1c, glycosylated hemoglobin; IDAA1C, insulin dose-adjusted HbA1c; MAGE, magnitude of amplitude of glycemic excursions; MDI, multiple daily injections.
A comparison of other secondary outcome measures is also shown in Table 3. HbA1c values were lower in Group 2 (Pump) subjects at 6 months, but this difference was not maintained at 12 months. Average insulin utilization (in units/kg/day) was also significantly lower in the Pump group compared with the MDI group at baseline and 1 and 6 months. Moreover, a significant difference in IDAA1C was present between the groups at 6 months (Table 3) but not at 12 months, although the average IDAA1C in the Pump group was always lower than that in the MDI group. Six-month IDAA1C was also negatively correlated with peak MMTT C-peptide (R=−0.70, P=0.002) and C-peptide AUC (R=−0.63, P=0.007), indicating that as overall IDAA1C increased, overall C-peptide decreased. This correlation was also seen at 12 months; IDAA1C was negatively correlated with peak MMTT C-peptide (R=−0.59, P=0.01) and C-peptide AUC (R=−0.59, P=0.01).
An average of 2.4±0.9 (6 months) and 3.0±0.9 (12 months) different basal rates were used by subjects in Group 2; nevertheless, no statistically significant differences were noted in the ratio of basal insulin component to bolus insulin component between groups at either 6 or 12 months. No subject in either group experienced an episode of diabetic ketoacidosis or life-threatening hypoglycemia, characterized by loss of consciousness or seizure, during the 12-month study period. None of the autoantibody measures was significantly different between the two groups at either baseline or 12 months.
Participant satisfaction was significantly different between the treatment groups for various aspects of the assigned treatment (Fig. 2 and Table 1). Participants' overall satisfaction with the treatment efficacy did not differ between groups at either the 6- or 12-month assessment. However, satisfaction with the route of treatment administration did differ. Those questions differing significantly (using P<0.05) between groups are summarized in Figure 2. Participants assigned to receive insulin pump therapy reported greater convenience (Q12), ease (Q4, Q16, and Q11), and flexibility of treatment (Q13 and Q19), leading to increased satisfaction in the form of treatment used, with 2.7 times the odds at 12 months (Q8: odds ratio=2.74, 95% confidence interval 1.41, 5.29, P=0.001). Internal validity of the questionnaire indicated good agreement beyond chance for similarly worded questions (Q4 and Q16; P<0.001) and poor agreement beyond chance for inversely worded questions (Q10 and Q17; P<0.001).
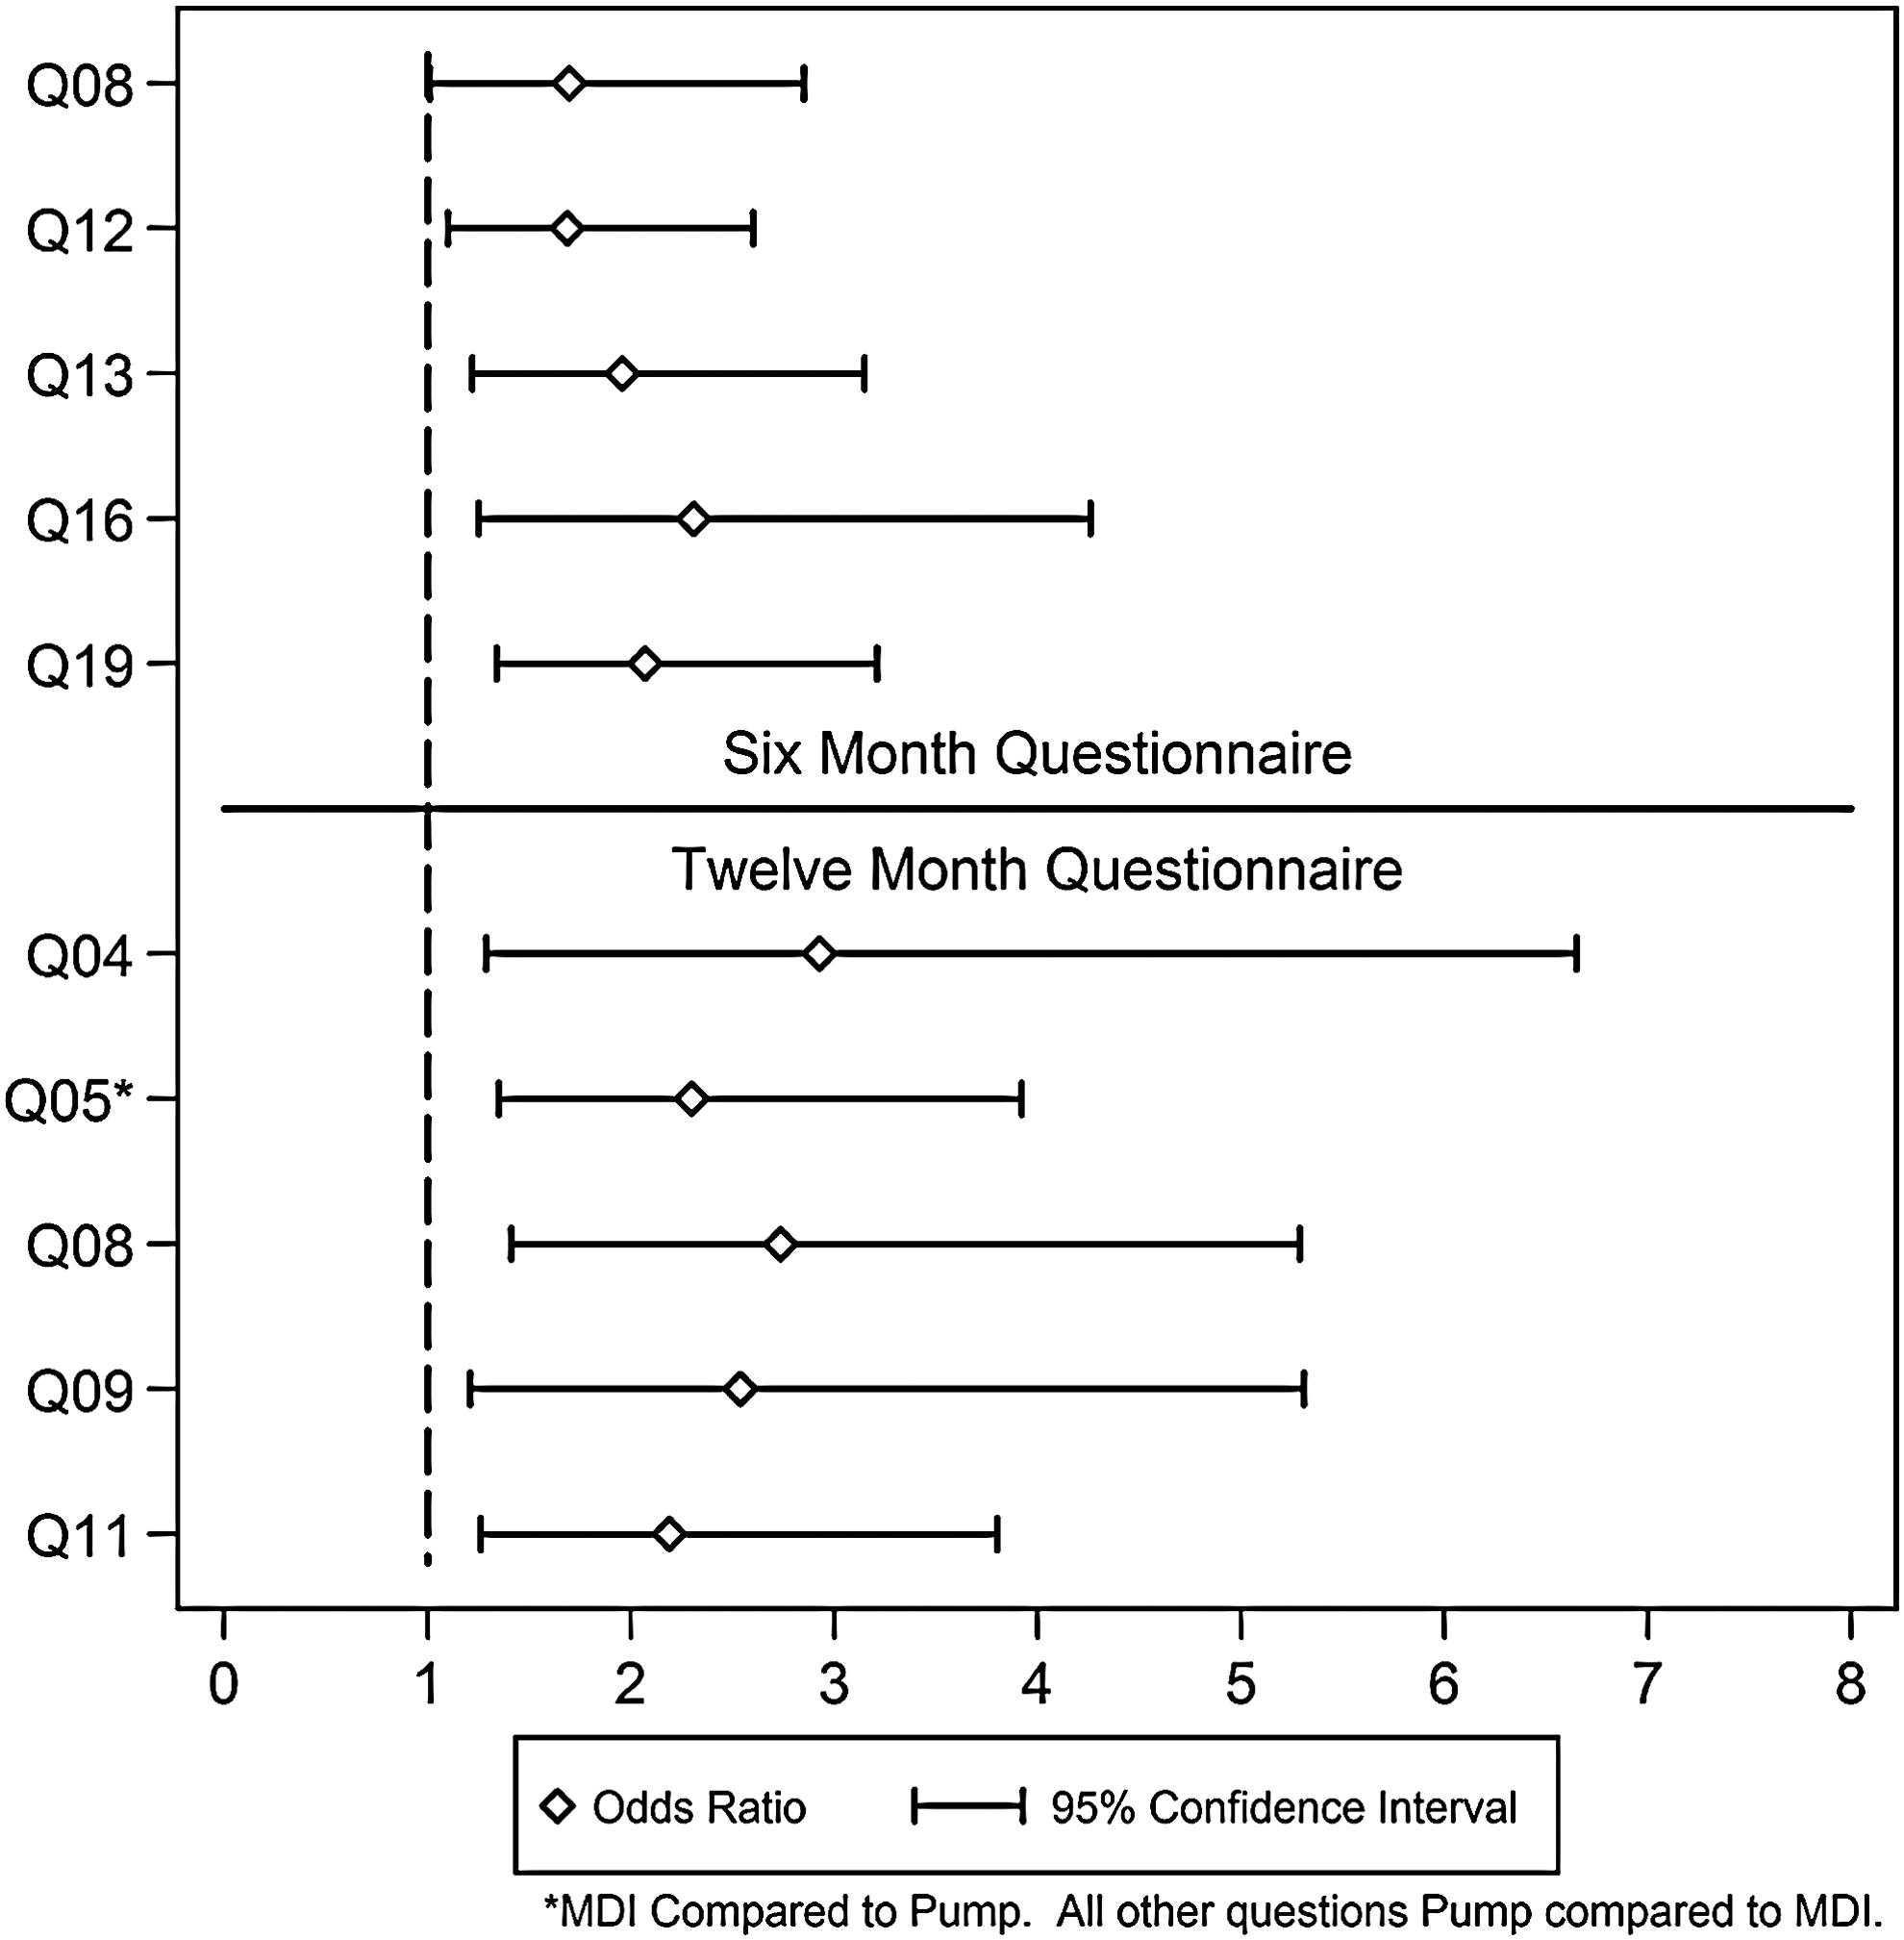
Odds ratios and 95% confidence intervals for participant satisfaction responses between groups at 6 and 12 months. Those questions differing significantly between groups (using P<0.05) are shown. *For Question 5 (12-month assessment), the between-group difference for the multiple daily injections (MDI) group used as the reference group compared with the Pump group is shown. For all other questions, differences are shown in reference to the MDI group. Individual question content and complete survey data are presented in Table 1.
Discussion
In pediatrics, the use of CSII for insulin replacement has been shown to improve metabolic control, 9,16,17 reduce the incidence of hypoglycemia, 17,18 and improve quality of life 18,19 compared with MDI therapy for T1D. For caregivers of preschool patients with T1D, a greater increase in treatment satisfaction has also been reported with insulin pump treatment. 20
Herein, we have demonstrated that initiation of insulin pump therapy within 1 month of diagnosis resulted in consistently higher MMTT-stimulated C-peptide values, although these differences were not statistically significant. Improved glycemic control, assessed by CGMS, was also observed in pump-treated subjects, as evidenced by more time spent in the normoglycemia range and less time spent in the hyperglycemia range. Additionally, patients tolerated the early start of pump therapy well. Specifically, they reported greater satisfaction with route of treatment administration. Also, insulin usage in pump-treated patients was less at 1 and 6 months, and there were no adverse effects of pump treatment on body weight or BMI.
To date, only a few trials have examined the efficacy of CSII in persons who are newly diagnosed with T1D. 9,21 –23 In a study by Ramchandani et al., 21 28 T1D patients (mean age, 12.1 years) were started on CSII within 1 month of diagnosis; MMTT-stimulated C-peptide values did not statistically change from baseline over the first year of diagnosis, and CSII therapy was well tolerated by the participants. However, this study did not include an MDI comparison group, precluding the determination of whether CSII itself contributed to preservation of endogenous insulin secretion. A study by Pozzilli et al. 23 did directly compare CSII with intensive subcutaneous insulin therapy (using NPH+regular insulin); however, patients in this trial were also treated with nicotinamide and were older (mean age, 18.4 years; age range, 12–35 years). These authors reported increases in C-peptide levels in both groups over a 2-year observation period, presumably in response to nicotinamide; C-peptide levels in the CSII group were slightly, although not significantly, higher than in those receiving injections. Kordonouri et al. 22 compared sensor-augmented pump therapy with conventional blood glucose meter–adjusted pump therapy, started within 4 weeks of diagnosis in 160 children with T1D. HbA1c values were comparable, but higher C-peptide concentrations and decreased glycemic variability were reported with sensor-augmented pump therapy compared with conventional pump therapy, perhaps suggesting that the decrease in glycemic excursion may impart some β-cell protection. 22 Our findings are consistent with those studies showing possible preservation of insulin secretion and improvements in glycemic control with CSII treatment; such improvements, however, were not accompanied by a decrease in glycemic excursion, at least in this pilot study.
This study was intended as a pilot study; consequently, the study cohort was small. However, post hoc analysis demonstrated that the study design was weakened by an underestimation of the sample size per group needed to determine a statistically significant result for our primary outcome measure. As such, although MMTT results suggested a trend toward improved endogenous insulin secretion in pump-treated subjects, these findings could not be statistically confirmed. The study design also did not specify a minimum C-peptide criterion at entry; instead, patients presenting with severe diabetic ketoacidosis were eliminated, as one mechanism to minimize enrollment of subjects with very low C-peptide levels. It is possible, therefore, that better outcomes might be evident in subjects with better β-cell function at diagnosis. Again, this pilot study was not large enough to answer this question. Finally, it is possibly that initiating therapy earlier after diagnosis than 25±9 days (i.e., ≤7 days) might have improved our outcomes.
In summary, initiation of insulin pump therapy at the time of diagnosis in pediatric patients with T1D improved glycemic control, was well tolerated, and contributed to improved patient satisfaction with mode of therapy. These pilot data also suggest that early use of insulin pump therapy might help to preserve residual β-cell function. A larger trial, however, would be needed to provide definitive information. Because several immunomodulating agents are currently under investigation in patients with newly diagnosed T1D with the hopes of inducing a sustained preservation of pancreatic β-cell function, 24 –26 consideration could be given to combining insulin pump therapy at the time of diagnosis with these pharmaceutical interventions.
Footnotes
Acknowledgments
This work was supported by grants from the Children's University Medical Group Fund of the Arkansas Children's Hospital Research Institute to K.M.T. and from the Arkansas Biosciences Institute to J.L.F. The authors appreciate the willingness of Animas Corporation to provide Animas model 1250 insulin pump study devices to participants. The authors are also grateful to the study subjects and their families for participation in this research.
Author Disclosure Statement
All authors have no commercial associations or conflicts of interest to disclose.