
Abstract
Background:
This study investigated the incidence of β-cell dysfunction and the clinical and biochemical factors affecting that in patients with type 2 diabetes having more than 3 years of follow-up.
Subjects and Methods:
β-Cell dysfunction was assessed by measuring changes in the fasting serum C-peptide concentrations. Patients were classified into two groups: cases showing a decreased (Group D) or an unchanged or increased (Group I) C-peptide concentration from the baseline.
Results:
Of the 504 patients included in this study, 259 (51%) showed decreased C-peptide concentrations, of whom 20% showed a decrease of ≥50%. Most patients, however, had a final C-peptide concentration of ≥1 ng/mL, with only 18 (4%) individuals having a level <0.6 ng/mL. Patients in Group D had a longer duration of diabetes, higher initial hemoglobin A1c concentration, and longer treatment durations with sulfonylurea and insulin compared with Group I. After adjusting for diabetes duration and C-peptide follow-up period, the duration of sulfonylurea treatment was found to be the only factor independently associated with decreases in the C-peptide concentration.
Conclusions:
Although β-cell function deteriorates over time in patients with type 2 diabetes, these cases mainly have fasting serum C-peptide concentrations of ≥1 ng/mL. A longer treatment duration with sulfonylurea is associated with a more rapid decline in the C-peptide concentration.
Introduction
Results from the United Kingdom Prospective Diabetes Study show that glycemic control progressively worsens over time, a deterioration that can be attributed to a progressive loss in β-cell function. Within 9 years of a diagnosis of DM, approximately 75% of patients will require additional medications to achieve a normal target hemoglobin A1c (HbA1c) concentration. 3 Moreover, β-cell function, as measured by homeostasis model assessment (HOMA), has been found to decrease by 25% within 5 years of a DM diagnosis. 4 These findings highlight the importance of evaluating β-cell function before treating patients with type 2 DM or when the patient's blood glucose level is not well controlled.
C-peptide is a by-product protein that is released from pancreatic β-cells along with insulin in equimolar quantities. Measuring the levels of C-peptide can provide physicians with information concerning the viable β-cell mass. 5 The pancreas in patients with type 1 DM cannot produce insulin, and the C-peptide levels in these individuals are lower than 0.48 ng/mL. In contrast, the C-peptide levels in patients with type 2 DM are normal (normal range, 0.48–3.3 ng/mL) or higher than normal. Measuring C-peptide in patients with type 2 DM can help determine how much of their own natural insulin is still being produced. Although the C-peptide level can be affected by the glucose level to some degree, it does not have a first-pass effect on the liver 6,7 and maintains constant peripheral clearance at various plasma concentrations. 8 Therefore, measurements of fasting serum C-peptide concentrations are most commonly used in the clinic to quantify endogenous insulin secretion with validity. 9 In addition, considering the characteristics of Asian patients with type 2 DM, in whom secretory β-cell dysfunction is a major contributing factor to the development and aggravation of hyperglycemia, 10,11 we used the fasting serum C-peptide concentration as a marker of β-cell function in this population.
Determining the factors that affect β-cell dysfunction is crucial in evaluating and understanding the mechanism underlying β-cell dysfunction in patients with type 2 DM. Previous studies have shown that several factors, including patient age, body mass index, DM duration, blood glucose level, HbA1c, and treatment with sulfonylurea, are associated with declining β-cell function. 12 –20 These earlier reports, however, were cross-sectional studies, 12 –14 assessed relatively small numbers of patients, 15 –17 younger patients, 18 or patients with a short-term follow-up period (<1 month), 19 or did not evaluate possible whole factors. 20
In our current study, therefore, we extensively investigated the clinical and biochemical factors that have a long-term (>3-year) deleterious effect on β-cell function, as measured by the reduced fasting serum C-peptide concentration over time, in relatively large numbers of general patients with type 2 DM.
Subjects and Methods
Subjects
The study population was selected from 3,250 patients with type 2 DM who visited the outpatient clinic of the Asan Medical Center (Seoul, Korea) between August 2009 and March 2010. Patients were eligible if their initial C-peptide concentration was >0.6 ng/mL and if this concentration had been measured more than twice with an interval of at least 2 years. Individuals diagnosed with type 1 DM (based on a history of diabetic ketoacidosis, positivity for islet cell antibody, or an initial C-peptide concentration <0.6 ng/mL), severe liver (aspartate and alanine aminotransferase levels >100 IU/L) or renal (creatinine>1.5 mg/dL) dysfunction, or known malignant, infectious, or chronic inflammatory disease were excluded. A final cohort of 504 patients was enrolled in this study (Fig. 1).
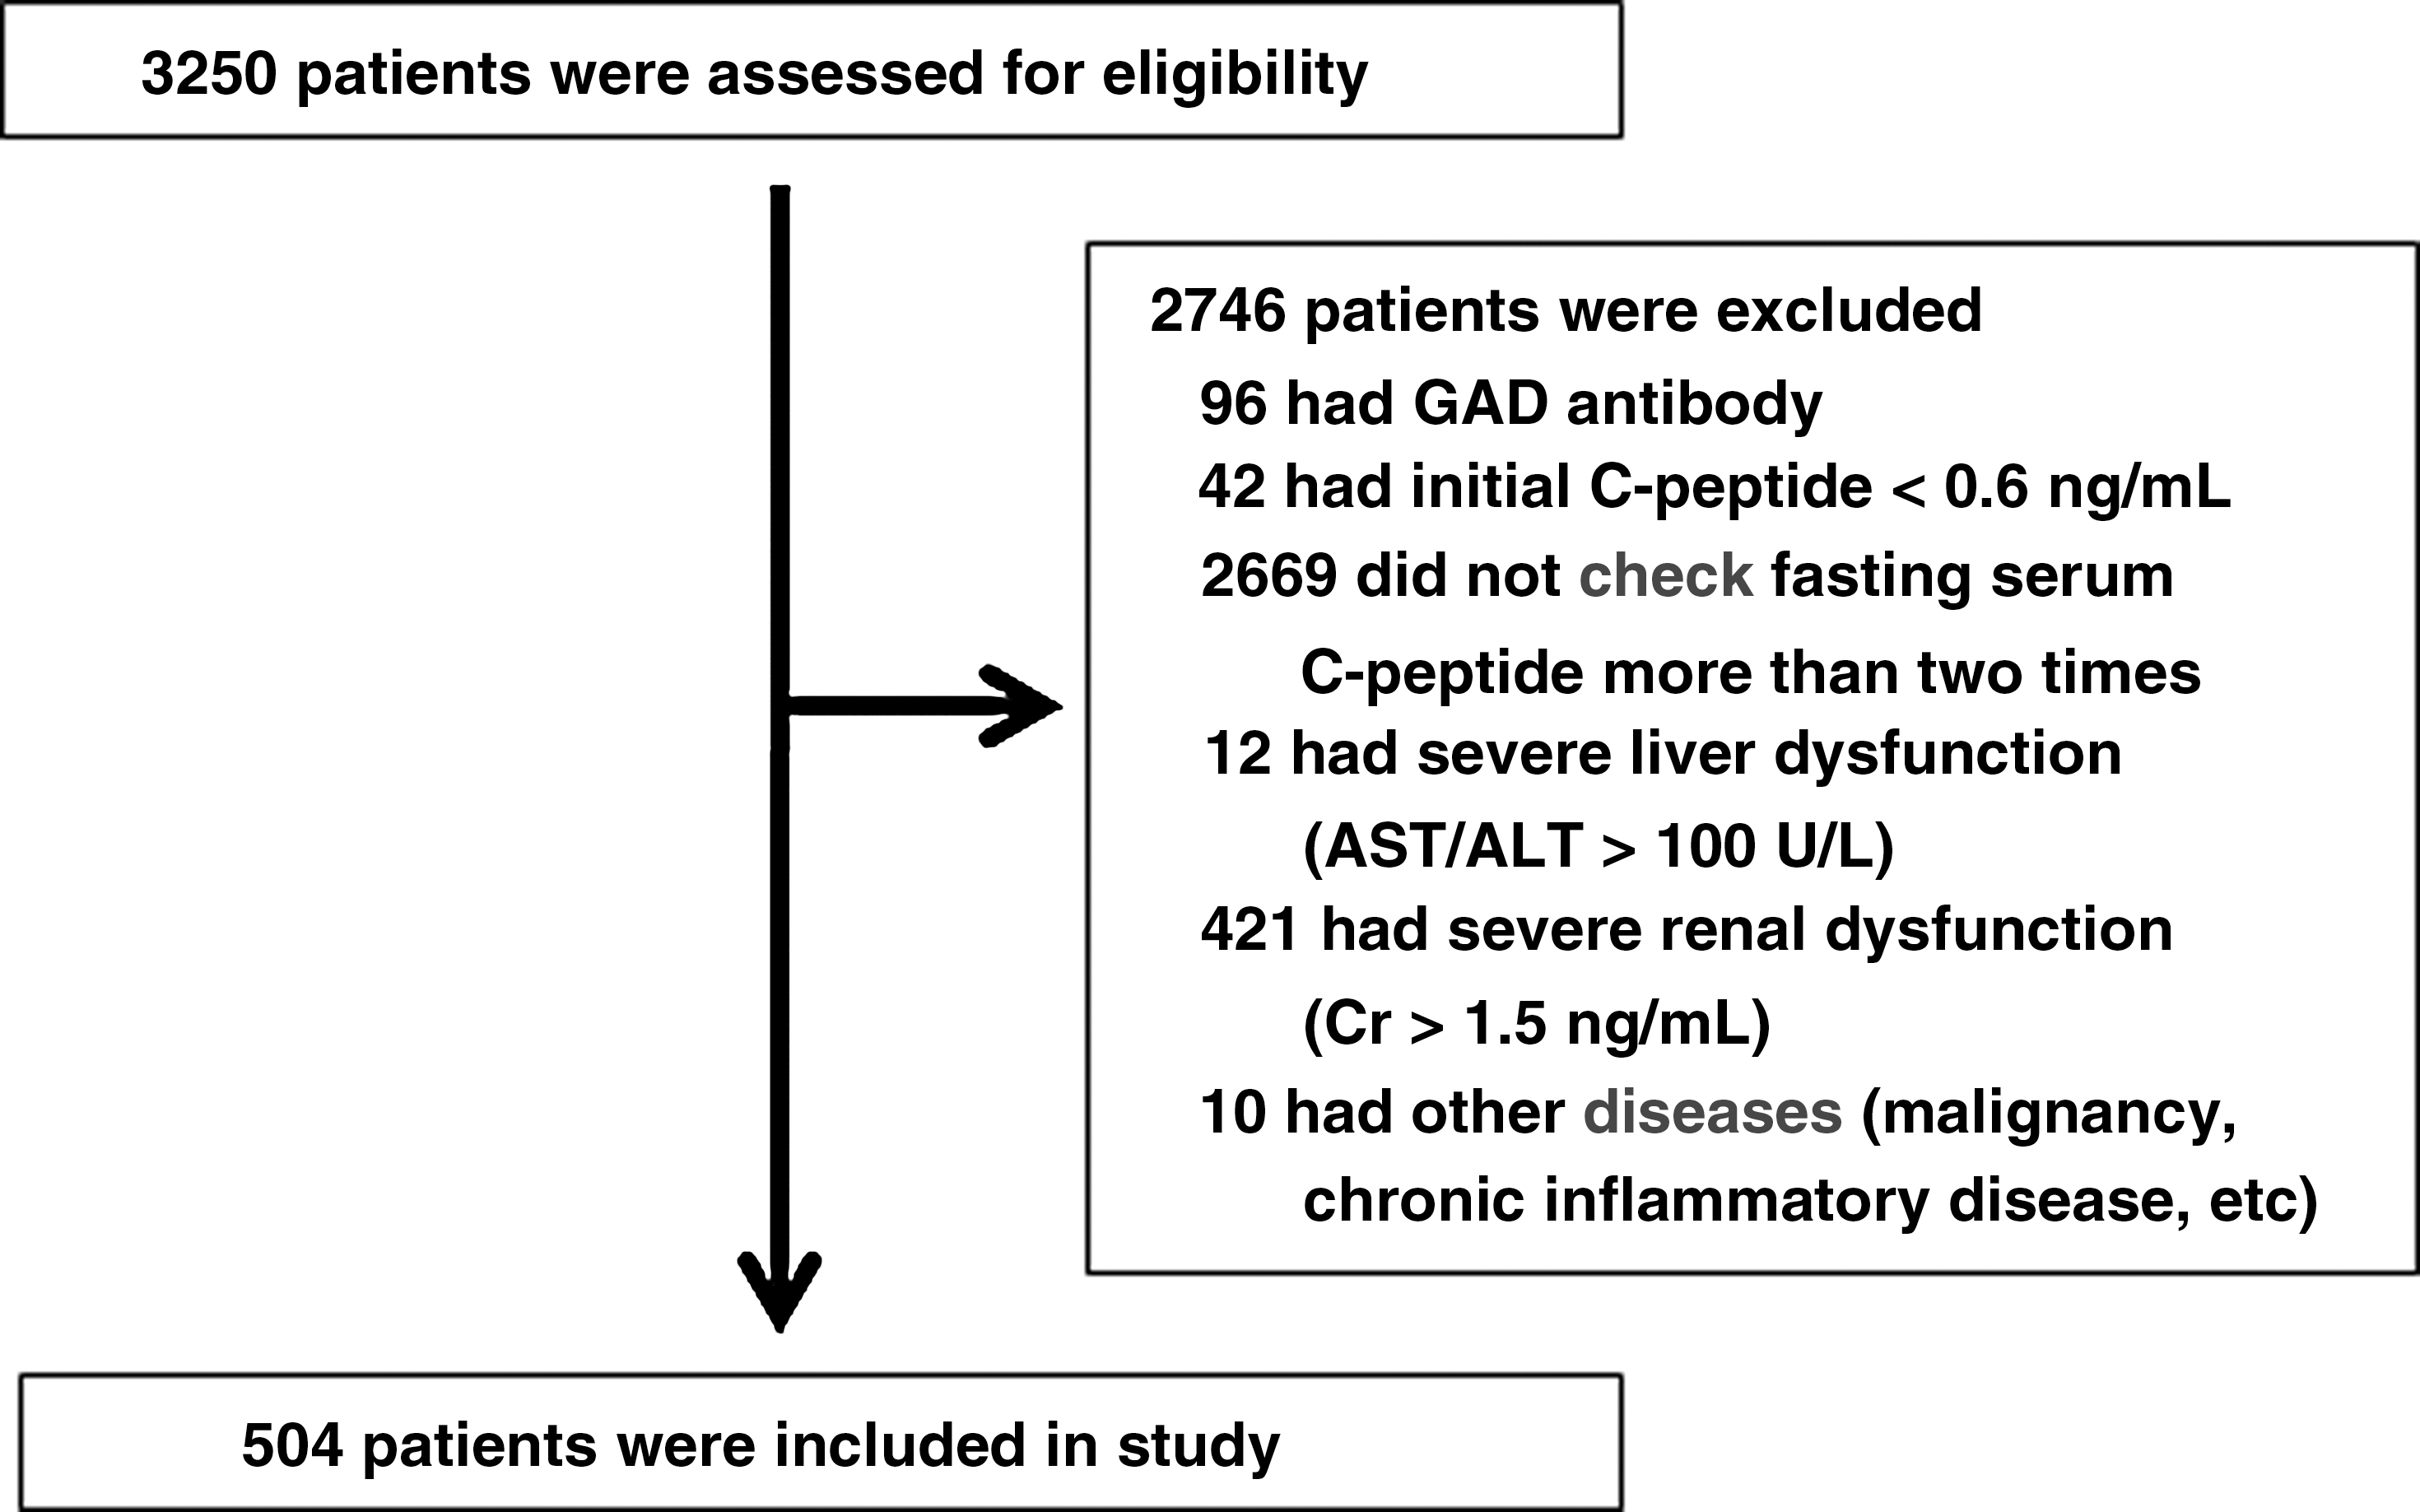
Flow chart of the study participants. AST/ALT, aspartate aminotransferase/alanine aminotransferase; Cr, creatinine; GAD, glutamic acid decarboxylase.
Measurement of β-cell function
β-Cell dysfunction was determined by measuring the fasting serum C-peptide concentration using a commercial radioimmunoassay kit (TFB, Tokyo, Japan), with a normal range of 0.48–3.3 ng/mL. Serum C-peptide concentrations in each patient were measured at their first visit to our clinic for newly diagnosed DM or at transfer from another clinic for referrals. Subsequently, the C-peptide concentration was measured every 2–3 years, when the blood glucose level was not well controlled, and/or when medications were changed. Because the initial metabolic state (e.g., poor glycemic control and other concomitant illness) could cause inappropriately high C-peptide levels and because initial treatment (e.g., sulfonylurea) can transiently improve β-cell function and cause fluctuations in the C-peptide levels within the first few months, 4 we used baseline data after stabilization of glucose and medication for the initial C-peptide concentration.
In addition, based on the facts that the fasting serum C-peptide concentration could be affected by glucose levels to some degree and that a decreased C-peptide concentration could be the natural insulin secretory response to improved blood glucose levels, a method to quantify insulin resistance and β-cell function that reflects fasting glucose level was needed. Although a clamp is useful for intensive physiological studies, a simpler tool such as HOMA may be more appropriate for use in large epidemiologic studies. The HOMA is a method traditionally used to quantify insulin resistance (HOMA-IR) and β-cell function (HOMA-%β) using fasting serum glucose and insulin levels. However, because fasting serum insulin was not measured regularly with fasting serum C-peptide and because patients taking exogenous insulin were included in our study cohort, we applied the HOMA2 model, which accounts for variations in hepatic and peripheral glucose resistance and used C-peptide instead of insulin to evaluate β-cell function and insulin resistance.
21
This model is available at
Study design
The medical records of the 504 patients included for analysis were retrospectively reviewed. Patients were classified into two groups: those with a decreased C-peptide concentration (Group D) and those with an increased or unchanged C-peptide concentration (Group I), relative to the baseline. The local ethics committee approved this retrospective review protocol.
Assessment of clinical and biochemical factors
Demographic and clinical factors obtained from patients' medical records included age, sex, body mass index, smoking status (pack-years), DM duration, C-peptide follow-up period, and systolic and diastolic blood pressures. Biochemical data included most recent measurements of fasting plasma glucose, postprandial glucose, triglyceride, high-density lipoprotein cholesterol, and low-density lipoprotein cholesterol concentrations. Medications for hypertension and hyperlipidemia were used for the optimal control of blood pressure and cholesterol levels, respectively. HbA1c, high-sensitivity C-reactive protein, homocysteine, and ceruloplasmin were measured during the same patient visits in which the C-peptide measurements were made. The duration of treatment with each oral hypoglycemic agent and insulin was defined as the time period in which each medication was used during the C-peptide follow-up period and was calculated in years. To decrease differences in treatment choices in relation to glucose control and medication preferences, all patients were followed up by the same physician. Medications were added, changed, or discontinued to obtain a favorable blood glucose level in each patient.
Chronic complications of DM were evaluated at the time of initial visit and every year thereafter. Diabetic retinopathy was diagnosed by an experienced ophthalmologist, and diabetic neuropathy was evaluated by nerve conduction velocity, neurometer, or vibration sensory threshold test. Diabetic nephropathy was defined as the presence of microalbuminuria or overt proteinuria, except in patients with severe renal dysfunction (creatinine of >1.5 mg/dL or end-stage renal disease on dialysis). Macrovascular complications included coronary heart disease (angina pectoris, myocardial infarction, a history of coronary artery bypass surgery, percutaneous coronary angioplasty, or electrocardiographic changes indicative of ischemia), cerebrovascular disease (stroke or transient ischemic attack), and peripheral arterial disease (ischemic wound or ankle–brachial index abnormalities).
Statistical analysis
Data are expressed as mean±SD values. Student's t tests and one-way analyses of variance were used to compare two and three groups, respectively, and χ 2 tests were used to compare nominal scales. Because the dependent variables were ordinal, a cumulative logit model was used for sequential comparisons between groups. Univariate analysis was performed to evaluate the clinical and biochemical factors affecting C-peptide decline. Multivariate analysis was then performed using logistic regression analyses to determine the odds ratios (ORs) for C-peptide decline after adjusting for confounding variables. All statistical analyses were performed using SPSS version 17.0 for Windows (SPSS Inc., Chicago, IL), and a P value of<0.05 was considered statistically significant.
Results
Clinical and biochemical factors that affect β-cell dysfunction
The clinical and biochemical characteristics of the study population are listed in Table 1. Age, sex, body mass index, and smoking status did not differ between patients in Groups D and I. The two groups also had comparable systolic blood pressure, diastolic blood pressure, fasting blood glucose, postprandial glucose, triglyceride, high-density lipoprotein cholesterol, low-density lipoprotein cholesterol, high-sensitivity C-reactive protein, and homocysteine and ceruloplasmin concentrations, as well as comparable rates of microvascular and macrovascular complications. The mean DM duration was 12.3 years (range, 2–43 years), and the mean C-peptide follow-up period of the patients was 6.2 years (range, 2–14 years). Patients in Group D showed a significantly longer DM duration and C-peptide follow-up periods than the patients in Group I (P<0.01, respectively). The initial HbA1c concentration was significantly higher, and the lengths of time on sulfonylurea and insulin treatments were significantly longer in Group D patients (P<0.05 each). These findings indicate that a more severe form of disease at onset and longer exposure to sulfonylurea or insulin are associated with more aggressive β-cell dysfunction.
Data are mean±SD values, mean (range), or number (%) as indicated. P<0.05 was considered statistically significant.
BMI, body mass index; DM, diabetes mellitus; F, female; FPG, fasting plasma glucose; HbA1c, hemoglobin A1c; HDL, high-density lipoprotein; hsCRP, high-sensitivity C-reactive protein; LDL, low-density lipoprotein; M, male; NS, not significant; PP2, plasma glucose 2 h after the meal.
Factors related to β-cell dysfunction after subclassification
A flow chart depicting the subclassification of the study subjects is shown in Figure 2. Because the reference range of C-peptide concentrations was very narrow, small differences in these levels between follow-up periods may not represent major changes in β-cell function. Therefore, subjects were reclassified based on the percentage C-peptide decline or absolute final concentration.
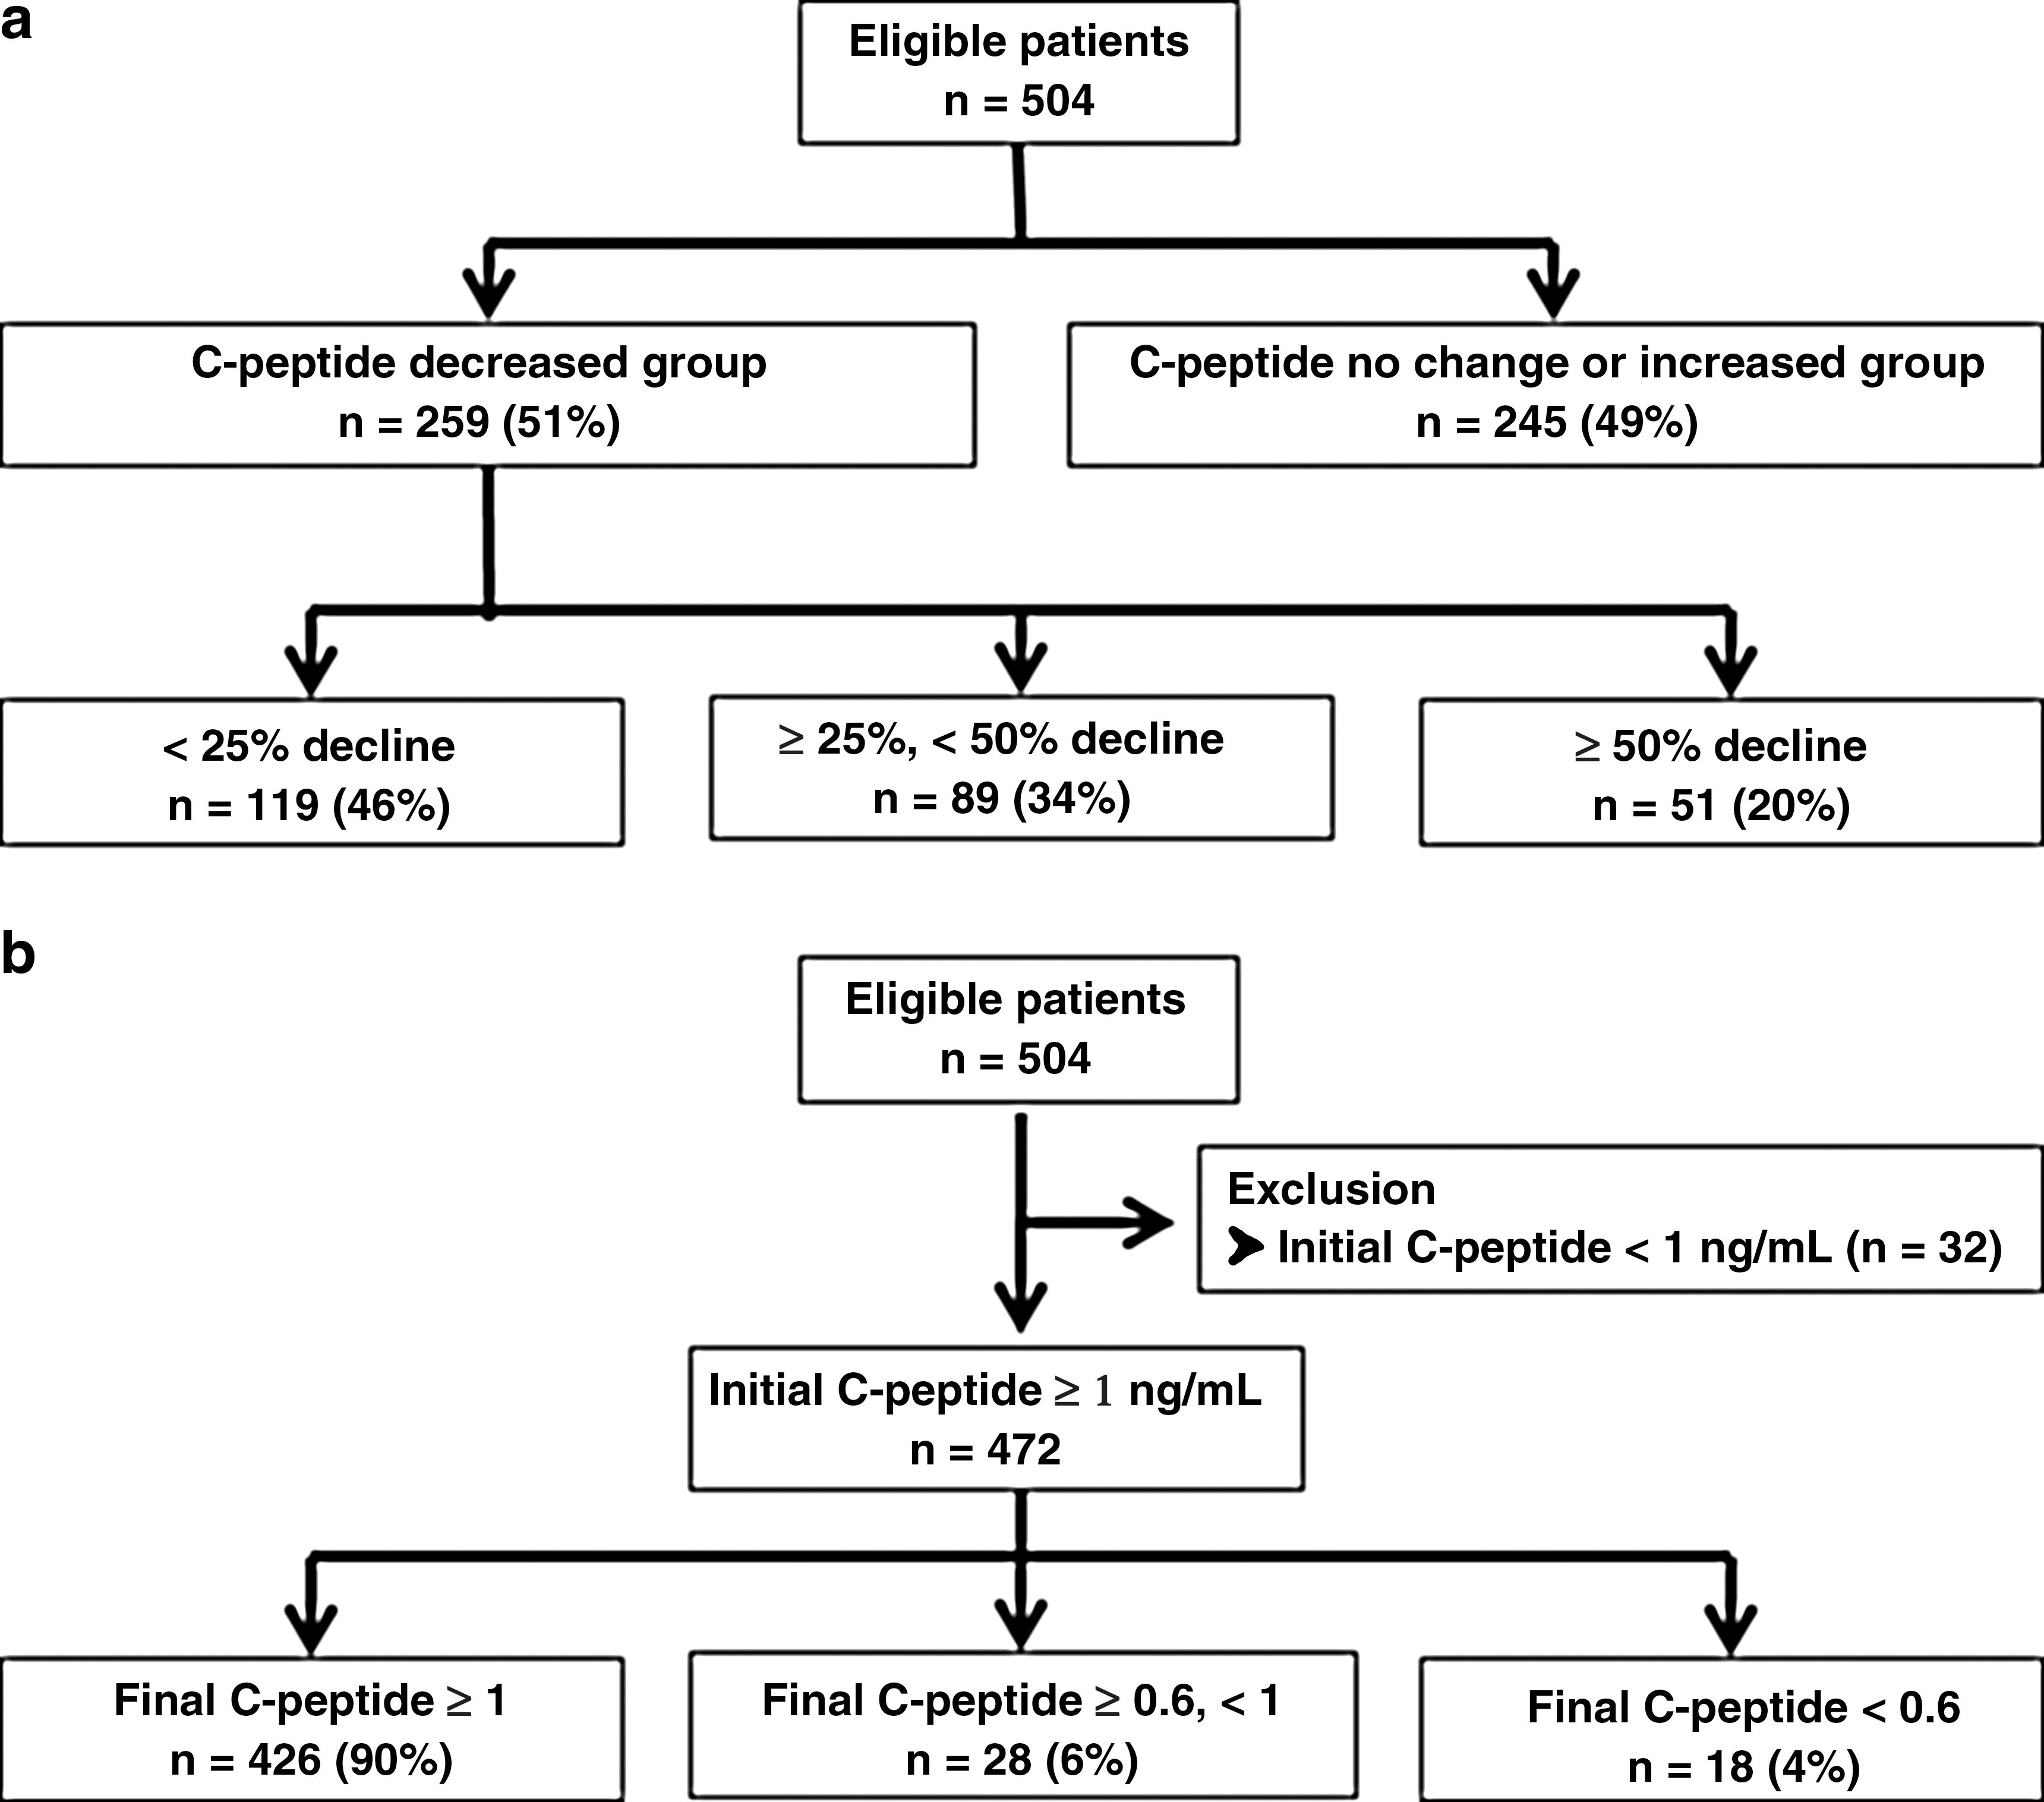
Flow chart showing subject classification. Subjects were reclassified based on
Of the 259 patients in Group D, 20% showed a ≥50% decrease in their C-peptide concentration (Fig. 2a). When the final absolute C-peptide concentration in these patients was evaluated, we found that most (90%) patients with declining C-peptide levels maintained concentrations of ≥1 ng/mL, with only 4% of patients showing a decline to <0.6 ng/mL (Fig. 2b). These findings suggest that although β-cell function deteriorates over time, most patients maintain their β-cell function to some degree.
Within these subclassifications, we analyzed factors that correlated with C-peptide decline using a cumulative logit model to enable progressive comparisons. In the percentage decline model, the risk of a ≥50% C-peptide reduction was significantly associated with a longer DM, longer C-peptide follow-up, and longer treatment duration with both sulfonylurea and insulin, by 4.7%, 11.8%, 7.2%, and 28.7% per year, respectively. Moreover, higher initial HbA1c concentrations significantly increased the risk of C-peptide decline by 8.9% (Table 2A, univariate analysis). However, after adjusting for other confounding factors, the durations of sulfonylurea (OR 1.064; 95% confidence interval [CI] 1.012–1.118) and insulin (OR 1.324; 95% CI 1.206–1.454) use were the only independent factors found to be predictive of a C-peptide percentage reduction (Table 2A, multivariate analysis).
Multivariate analysis was performed using the backward elimination method with statistically significant (P<0.05) or borderline significant (P<0.10) factors in univariate analysis as independent variables.
BMI, body mass index; CI, confidence interval; DM, diabetes mellitus; HbA1c, hemoglobin A1c; SU, sulfonylurea; TZD, thiazolidinediones.
The associations between various risk factors and the final absolute C-peptide concentration are listed in Table 2B. In this model, the risk of C-peptide reduction to <0.6 ng/mL was significantly associated with a longer duration of DM, longer C-peptide follow-up, and longer duration of treatment with insulin, by 6.5%, 10%, and 43% per year, respectively. In addition, the higher body mass index and the longer treatment duration of thiazolidinediones reduced the risk of C-peptide decline by 21% per kg/m2 and 15% per year, respectively (Table 2B, univariate analysis). After adjusting for confounding factors, only the duration of insulin therapy (OR 1.672; 95% CI 1.452–1.925) was found to be an independent determinant of the absolute C-peptide concentration <0.6 ng/mL (Table 2B, multivariate analysis).
Our data thus show that the duration of sulfonylurea treatment is a significant independent predictor of C-peptide reduction only in the percentage decline model, suggesting that if the duration of sulfonylurea treatment is longer, the C-peptide levels could decrease to ≥50% from baseline, but not to <0.6 ng/mL.
Factors related to β-cell dysfunction during the same period
Consistent with our present findings, previous studies have also shown an association between a longer duration of DM and gradual worsening of glucose control due to a progressive decrease in β-cell function. 12 –14,18 –20 Hence, to exclude this as a confounding effect, we evaluated the changes in the C-peptide concentration after adjusting for DM duration and C-peptide follow-up period. Although we had already adjusted for these factors in our multivariable analysis, we tried to further control for this effect by selecting patients with the same C-peptide follow-up periods.
To this end, we selected 83 patients who were first assayed for their fasting plasma C-peptide concentration in 2002 or 2003 and last assayed in 2009 or 2010. During the 8-year follow-up period, 32 (39%) patients showed a C-peptide decline, and 51 (61%) showed no change or an increase in their C-peptide levels (Table 3, univariate analysis). DM duration was nearly equal in these two groups, as were other clinical and biochemical characteristics. Only the duration of sulfonylurea use during the C-peptide follow-up period differed significantly between the two groups, with 6.2 years in patients with reduced C-peptide concentration and 4.9 years in patients with unchanged or increased C-peptide concentration, but the total duration of sulfonylurea use in each patient was not significantly different between groups.
Data are mean±SD values, mean (range) or number. P<0.05 was considered statistically significant. Multivariate analysis was performed using the backward elimination method with statistically significant (P<0.05) or borderline significant (P<0.20) factors in univariate analysis as independent variables.
BMI, body mass index; DM, diabetes mellitus; F, female; FPG, fasting plasma glucose; HbA1c, hemoglobin A1c; HDL, high-density lipoprotein; LDL, low-density lipoprotein; M, male; NS, not significant; PP2, plasma glucose 2 h after the meal; SU, sulfonylurea.
When these two groups were analyzed by multivariate analysis using a significance level of 20%, only the duration of sulfonylurea treatment remained significant, with an OR of 1.230 (95% CI, 1.007–1.502) (Table 3, multivariate analysis). The duration of sulfonylurea treatment based on C-peptide percentage decline is shown in Figure 3. The durations were 4.9, 5.7, and 6.9 years, respectively (P value<0.05).
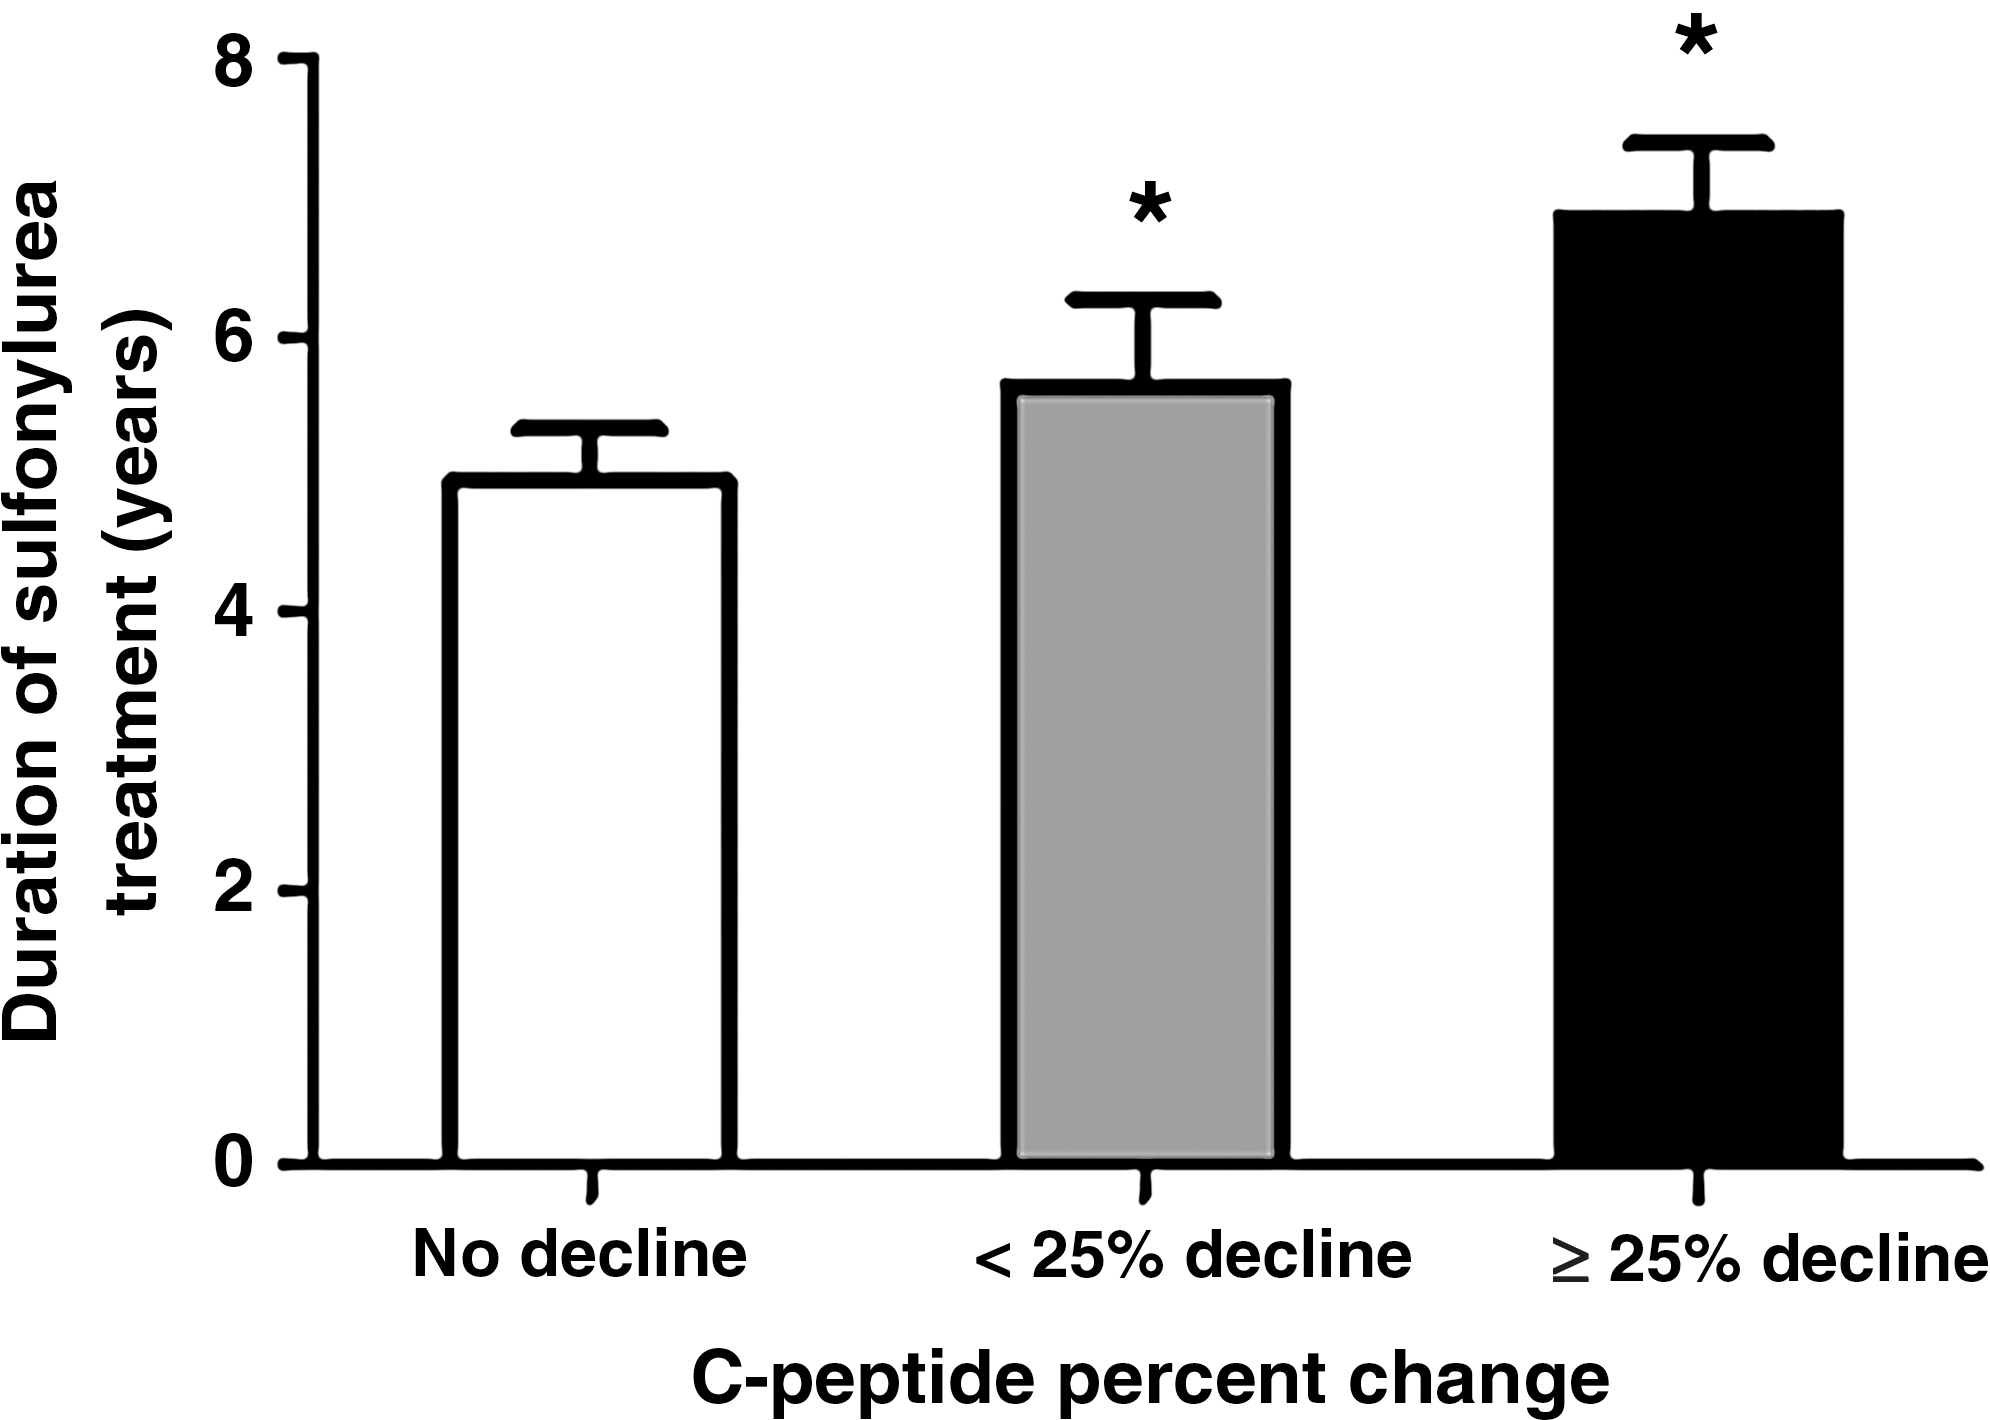
Duration of sulfonylurea treatment according to percentage decline in the C-peptide concentration. The durations were 4.9±0.4 years in the No decline group (n=51), 5.7±0.6 years in the <25% decline group (n=17), and 6.9±0.5 years in the ≥25% decline group (n=15). Data are mean±SEM values. *P<0.05 versus No decline.
Relationship between fasting serum C-peptide concentration and HOMA-%β in a HOMA2 model
In the HOMA2 model, HOMA-%β values (Table 4) decreased in Group D and increased in Group I compared with the baseline values (P<0.05). This suggested that the fasting serum C-peptide concentration adequately reflects β-cell function. HOMA-IR values were not changed significantly in either group.
Data are mean±SD values. Homeostasis model assessment (HOMA) of β-cell function (HOMA-%β) and insulin resistance (HOMA-IR) was calculated using the HOMA2 model. P<0.05 was considered statistically significant.
FPG, fasting plasma glucose; HbA1c, hemoglobin A1c; NS, not significant.
Discussion
The present study reports three important findings for Korean patients with type 2 DM. First, although β-cell function deteriorated over time in these cases, most patients maintained a fasting serum C-peptide concentration of ≥1 ng/mL. Second, the duration of DM, C-peptide follow-up duration, initial HbA1c, and the use of sulfonylurea or insulin could have an effect on β-cell function. Third, a longer duration of sulfonylurea treatment had the most powerful effect on the deterioration of β-cell function after adjusting for other factors.
Previous studies have evaluated β-cell dysfunction by measuring changes in the HOMA-%β, by assessing the number of medications added over time, or by defining the oral hypoglycemic agent failure. 3,4,25,26 However, measuring β-cell secretion with fasting or stimulated serum C-peptide concentration has been also widely used in many studies. 12 –20 We also tried to evaluate β-cell function by measuring changes in the fasting serum C-peptide concentration over time and, surprisingly, found that it remained relatively preserved.
It has been well documented in previous reports that β-cell responsiveness or secretion decreases with increasing DM duration. 12 –14,18 –20 Although these earlier studies differed in their design, patient cohorts, and follow-up periods from our present report, a longer DM duration significantly associated with β-cell dysfunction is consistent with our present findings. In addition, these deteriorations are facilitated by poor metabolic control or by the extent of obesity 18,20 and are affected by old age, higher basal C-peptide concentration, and high-sensitivity C-reactive protein levels and by higher brachial–ankle pulse wave velocities. 19 However, metabolic control and inflammatory markers such as high-sensitivity C-reactive protein, homocysteine, and ceruloplasmin were not found to be associated with long-term β-cell dysfunction in our current analyses.
Although the longer duration of insulin use was an independent determinant of C-peptide decline (Table 2, multivariate analysis), this may be the result of, rather than cause of, β-cell dysfunction. As β-cell function decreases, more insulin may be required to maintain normal glucose levels. This hypothesis is supported by studies showing that insulin treatment increases the C-peptide concentration. 15,27,28 As sulfonylurea is recommended as a second-line therapy, 29 one can also speculate that use of sulfonylurea is associated with the duration of diabetes and insulin secretory dysfunction. In our present study, however, most of the patients used sulfonylurea from the beginning, and the number of patients receiving this medication is not significantly different between our two study groups, in contrast to insulin.
Decreased insulin secretion after a long duration of DM may be due to a phenomenon termed “β-cell exhaustion.” 4,30 Sulfonylurea may have negative effects on β-cell preservation by overstimulating the β-cells. Indeed, a previous study comparing the beneficial effects of insulin and sulfonylurea on insulin secretion has shown that the parameters for β-cell function were better preserved in insulin-treated patients. 15 The authors of this earlier report also showed in 4-year and 6-year follow-up studies that this advantage persisted. However, these studies were limited by the small number (n=34) of patients diagnosed with type 2 DM at 0–2 years before inclusion. 16,17 Moreover, sulfonylurea has been found to induce β-cell apoptosis in cultured human islets, which may be of clinical importance because the concentrations of sulfonylurea in these experiments were within the range encountered in the plasma of treated patients. 31 However, the United Kingdom Prospective Diabetes Study has documented that a deterioration of insulin secretion occurs irrespective of the type of medication (metformin, sulfonylurea, or insulin) or diet alone. 3,4 It has demonstrated that neither sulfonylurea nor metformin therapy appears to have a major effect on underlying β-cell function and that a deterioration in glucose control in sulfonylurea-treated patients was more likely due to the underlying progressive decrease in β-cell function. In addition, recent studies assessing β-cell function by measuring the postprandial C-peptide/glucose ratio have shown that sulfonylurea treatment is not associated with a pronounced decline in β-cell function, 32 and an in vivo study has reported that sulfonylurea did not have further deleterious effects on the degree of apoptosis or endoplasmic reticulum stress in INS-1 cells under glucolipotoxic conditions. 33 Although controversy continues over the findings of such reports, we have found in our current analyses that the duration of sulfonylurea treatment had a significant deleterious effect on β-cell function after adjusting for other factors. This result supports the hypothesis that long-term use of sulfonylurea may overstimulate β-cells, resulting in β-cell dysfunction. Therefore, reducing the use of sulfonylurea may be appropriate for the preservation of β-cell function in patients with type 2 DM.
In addition, DM patients should be treated with medications that improve, or at least not decrease, β-cell function. An early use of metformin and thiazolidinediones may delay β-cell dysfunction. 34 –40 Our present data show that an increased use of thiazolidinediones reduces the risk of C-peptide decline to <0.6 ng/mL by 15% per year (Table 2B). Also, exenatide treatment was previously found to improve β-cell function, as measured by combined euglycemic hyperinsulinemic and hyperglycemic clamps. 41,42 However, because exenatide has not been used extensively in our clinics for several years, the duration of exenatide treatment was not analyzed in our current study.
In terms of the retrospective study design we used herein, there are both strengths and limitations to this approach that should be complemented by further investigation. Although randomized clinical trials have more statistical significance and reliance on data, retrospective observational design in everyday practice setting is likely to allow for a broader subject population to be enrolled and to enable an investigation of the efficacy and optimal regimens associated with glucose-lowering agents in real clinical practice. Our current study also has several notable advantages, including an analysis of factors that could affect C-peptide changes over a long-term follow-up period (14 years), and included a relatively large number of patients (504 cases). In addition, we evaluated β-cell function by measuring the fasting serum C-peptide concentrations, which have been shown to correlate well with endogenous insulin secretion. However, our study also has several limitations that are noteworthy. First, because the study population consisted of a cohort of patients cared for by one doctor in a single center, our results may have been affected by selection bias. Also, preferences related to glucose control and the use of particular medications could have impacted on the results. Nonetheless, our study design conferred a high degree of consistency regarding laboratory data, the evaluation of patients, and choice of medication, which was based on previously established guidelines. 29 Second, to evaluate the effect of each medication on C-peptide changes, these levels should be assayed before and after the commencement of each therapy, and individual rates of decline should be calculated and analyzed. However, this possibility was limited by our observational study design. Third, for a more complete understanding of the mechanisms underlying β-cell function, it would be useful to evaluate stimulated C-peptide using an oral glucose tolerance test or the mixed-meal test. Also, we did not consider other medications that could affect β-cell function, such as angiotensin converting enzyme inhibitor and angiotensin receptor blockers. 43,44
In conclusion, we have evaluated the clinical and biochemical factors that affect C-peptide changes during a long-term follow-up period in a unique way. It is surprising that only 50% of patients showed a C-peptide decline, with most maintaining C-peptide concentrations at ≥1 ng/mL. Although the longer duration of DM, longer C-peptide follow-up duration, higher initial HbA1c, and the longer duration of sulfonylurea or insulin use have been associated with a reduction in C-peptide concentration, we found in our current study that the duration of sulfonylurea treatment was the only factor associated with β-cell dysfunction. Additional longitudinal and prospective studies will be required to confirm these results.
Footnotes
Author Disclosure Statement
No competing financial interests exist.