
Abstract
Background:
Several clinical studies have shown that low blood glucose (BG) levels affect electroencephalogram (EEG) rhythms through the quantification of traditional indicators based on linear spectral analysis. Nonlinear measures used in the last decades to characterize the EEG in several physiopathological conditions have never been assessed in hypoglycemia. The present study investigates if properties of the EEG signal measured by nonlinear entropy-based algorithms are altered in a significant manner when a state of hypoglycemia is entered.
Subjects and Methods:
EEG was acquired from 19 patients with type 1 diabetes during a hyperinsulinemic–euglycemic–hypoglycemic clamp experiment. In parallel, BG was frequently monitored by the standard YSI glucose and lactate analyzer and used to identify two 1-h intervals corresponding to euglycemia and hypoglycemia, respectively. In each subject, the P3-C3 EEG derivation in the two glycemic intervals was assessed using the multiscale entropy (MSE) approach, obtaining measures of sample entropy (SampEn) at various temporal scales. The comparison of how signal irregularity measured by SampEn varies as the temporal scale increases in the two glycemic states provides information on how EEG complexity is affected by hypoglycemia.
Results:
For both glycemic states, the MSE analysis showed that SampEn increases at small time scales and then monotonically decreases as the time scale becomes larger. Comparing the two conditions, SampEn was higher in hypoglycemia only at medium time scales.
Conclusions:
A decrease in the complexity of EEG occurs when a state of hypoglycemia is entered, because of a degradation of the EEG long-range temporal correlations. Thanks to its ability to assess nonlinear dynamics of the EEG signal, the MSE approach seems to be a useful tool to complement information brought by standard linear indicators and provide new insights on how hypoglycemia affects brain functioning.
Introduction
G
The first works dealing with the investigation of HRECs date back to the 1950s, 1,2 and, since then, several studies have proved that low blood glucose (BG) levels affect EEG rhythms. In particular, a power increase in the low-frequency EEG bands has been associated with hypoglycemia, 3 –5 suggesting the development of specific algorithms for the detection and prediction of severe hypoglycemic events from the analysis of EEG time-series. 2,6 Moreover, because HRECs appeared distinguishable from the baseline EEG during both daytime and sleep, 7,8 the possibility of using the brain as a biosensor to detect hypoglycemia in real time from suitable processing of EEG recordings has been also recently proposed. 8,9
EEG signal processing techniques used in the literature to study HRECs are typically based on linear spectral analysis and investigate possible hypoglycemia-related variations of the EEG power spectral density in the conventional delta (1–4 Hz), theta (4–8 Hz), alpha (8–13 Hz), and beta (13–20 Hz) bands. 1 –5,7 –11 In the last decades, however, different pathological and impaired consciousness conditions have been demonstrated to alter not only the spectral content of the EEG signal, but also its irregularity and complexity features. 12 –16 Intuitively, the irregularity of a signal is a measure of its randomness/unpredictability, 17 whereas the complexity is a concept related to the “structural richness” of the system generating the signal and its capability to adapt and function in an ever-changing environment. 18 Several nonlinear signal processing techniques can be used to quantify the irregularity and complexity of physiological time-series under different conditions. Until now, however, none of them has been considered for the assessment of HRECs.
The aim of this work is to test the hypothesis that HRECs can be quantified in terms of signal irregularity and complexity by using nonlinear signal processing techniques. The database consists of EEG time-series acquired in eu- and hypoglycemia from 19 subjects with type 1 diabetes (T1D) during a hyperinsulinemic–euglycemic–hypoglycemic clamp experiment. Data were assessed using the multiscale entropy (MSE) approach, a nonlinear technique introduced by Costa et al. 19 that quantifies the complexity of a signal using the popular sample entropy (SampEn) algorithm 20 to measure its irregularity at various temporal scales.
Subjects and Methods
Database
Data were collected at Nordsjællands Hospital, Hillerød, Denmark, from 19 T1D subjects exposed to a hyperinsulinemic–euglycemic–hypoglycemic clamp. Insulin (Actrapid®; Novo Nordisk, Bagsværd, Denmark) was administered intravenously with an infusion rate of 1 mU/kg/min. Target BG levels were obtained by a variable infusion of glucose (200 mg/mL). The objective was to examine the participants during a 1-h period of euglycemia (90–110 mg/dL) and a subsequent 1-h period of hypoglycemia (41 mg/dL). During the execution of the experiment, BG concentration and EEG were simultaneously monitored; BG was frequently determined by a laboratory analyzer (YSI 2300 glucose and lactate analyzer; Yellow Springs Instrument Co., Yellow Springs, OH), whereas 19 EEG recordings were collected from subjects with eyes open for on average 7.5 (±1.3) h using standard cap electrodes placed on the scalp according to the 10/20 international system. A digital EEG recorder (Easy II; Cadwell Laboratories, Kennewick, WA) was used to acquire the EEG time-series that were analogically low-pass-filtered at 70 Hz to avoid aliasing and then sampled at 200 Hz. The dynamic range of the EEG was±4,620 μV with an amplitude resolution of 0.14 μV. The internal noise level in the analog data acquisition system was estimated to be 1.3 μV root mean square.
The study was approved by the local ethical committee and registered at clinicaltrials.gov with identifier number NCT01337362. The data in the present article are baseline data from that study, in which the effect of recurrent hypoglycemia on the EEG was assessed. The analysis herein considered was developed on the P3-C3 EEG derivation, because the EEG acquired from this scalp position has been shown to be highly affected by hypoglycemic events. 4,9
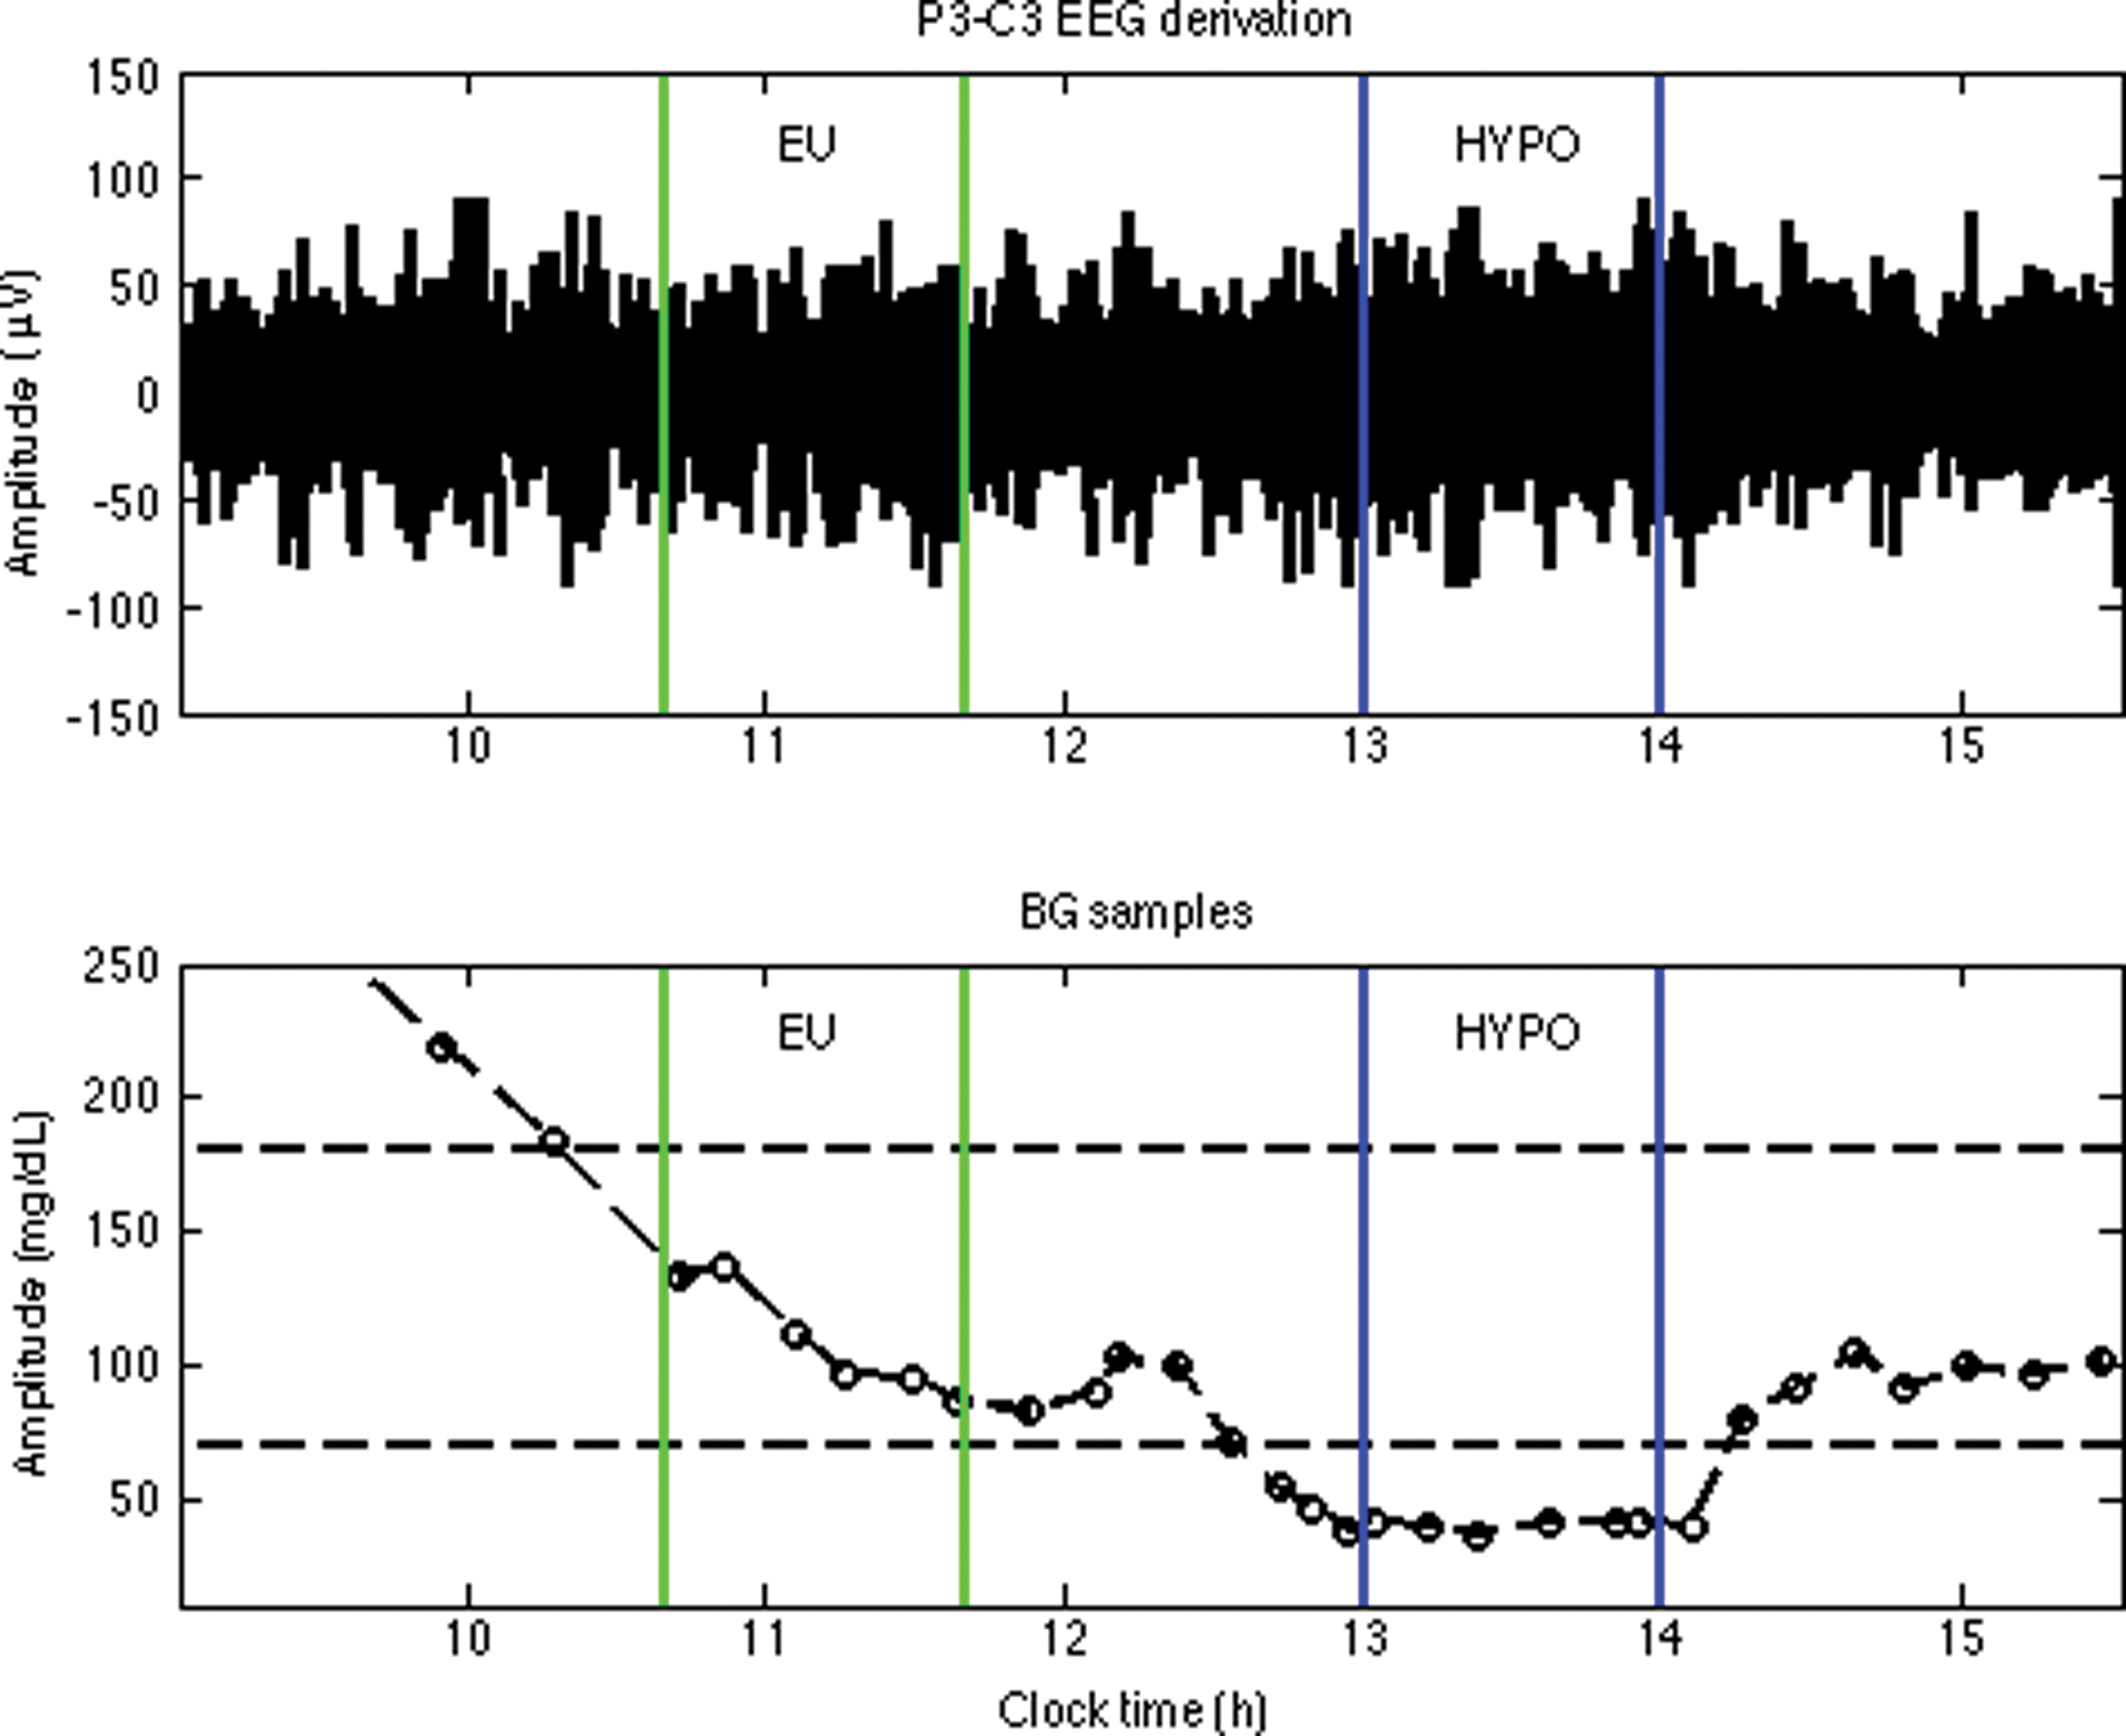
In Figure 1, an example of data, acquired from the representative subject number 6, is provided. Specifically, Figure 1, top panel, shows the P3-C3 EEG signal, whereas Figure 1, bottom panel, shows the BG samples (open bullets) collected in parallel. In Figure 2, a zoom of two 5-s epochs extracted in eu- and hypoglycemia, respectively, is represented.
(
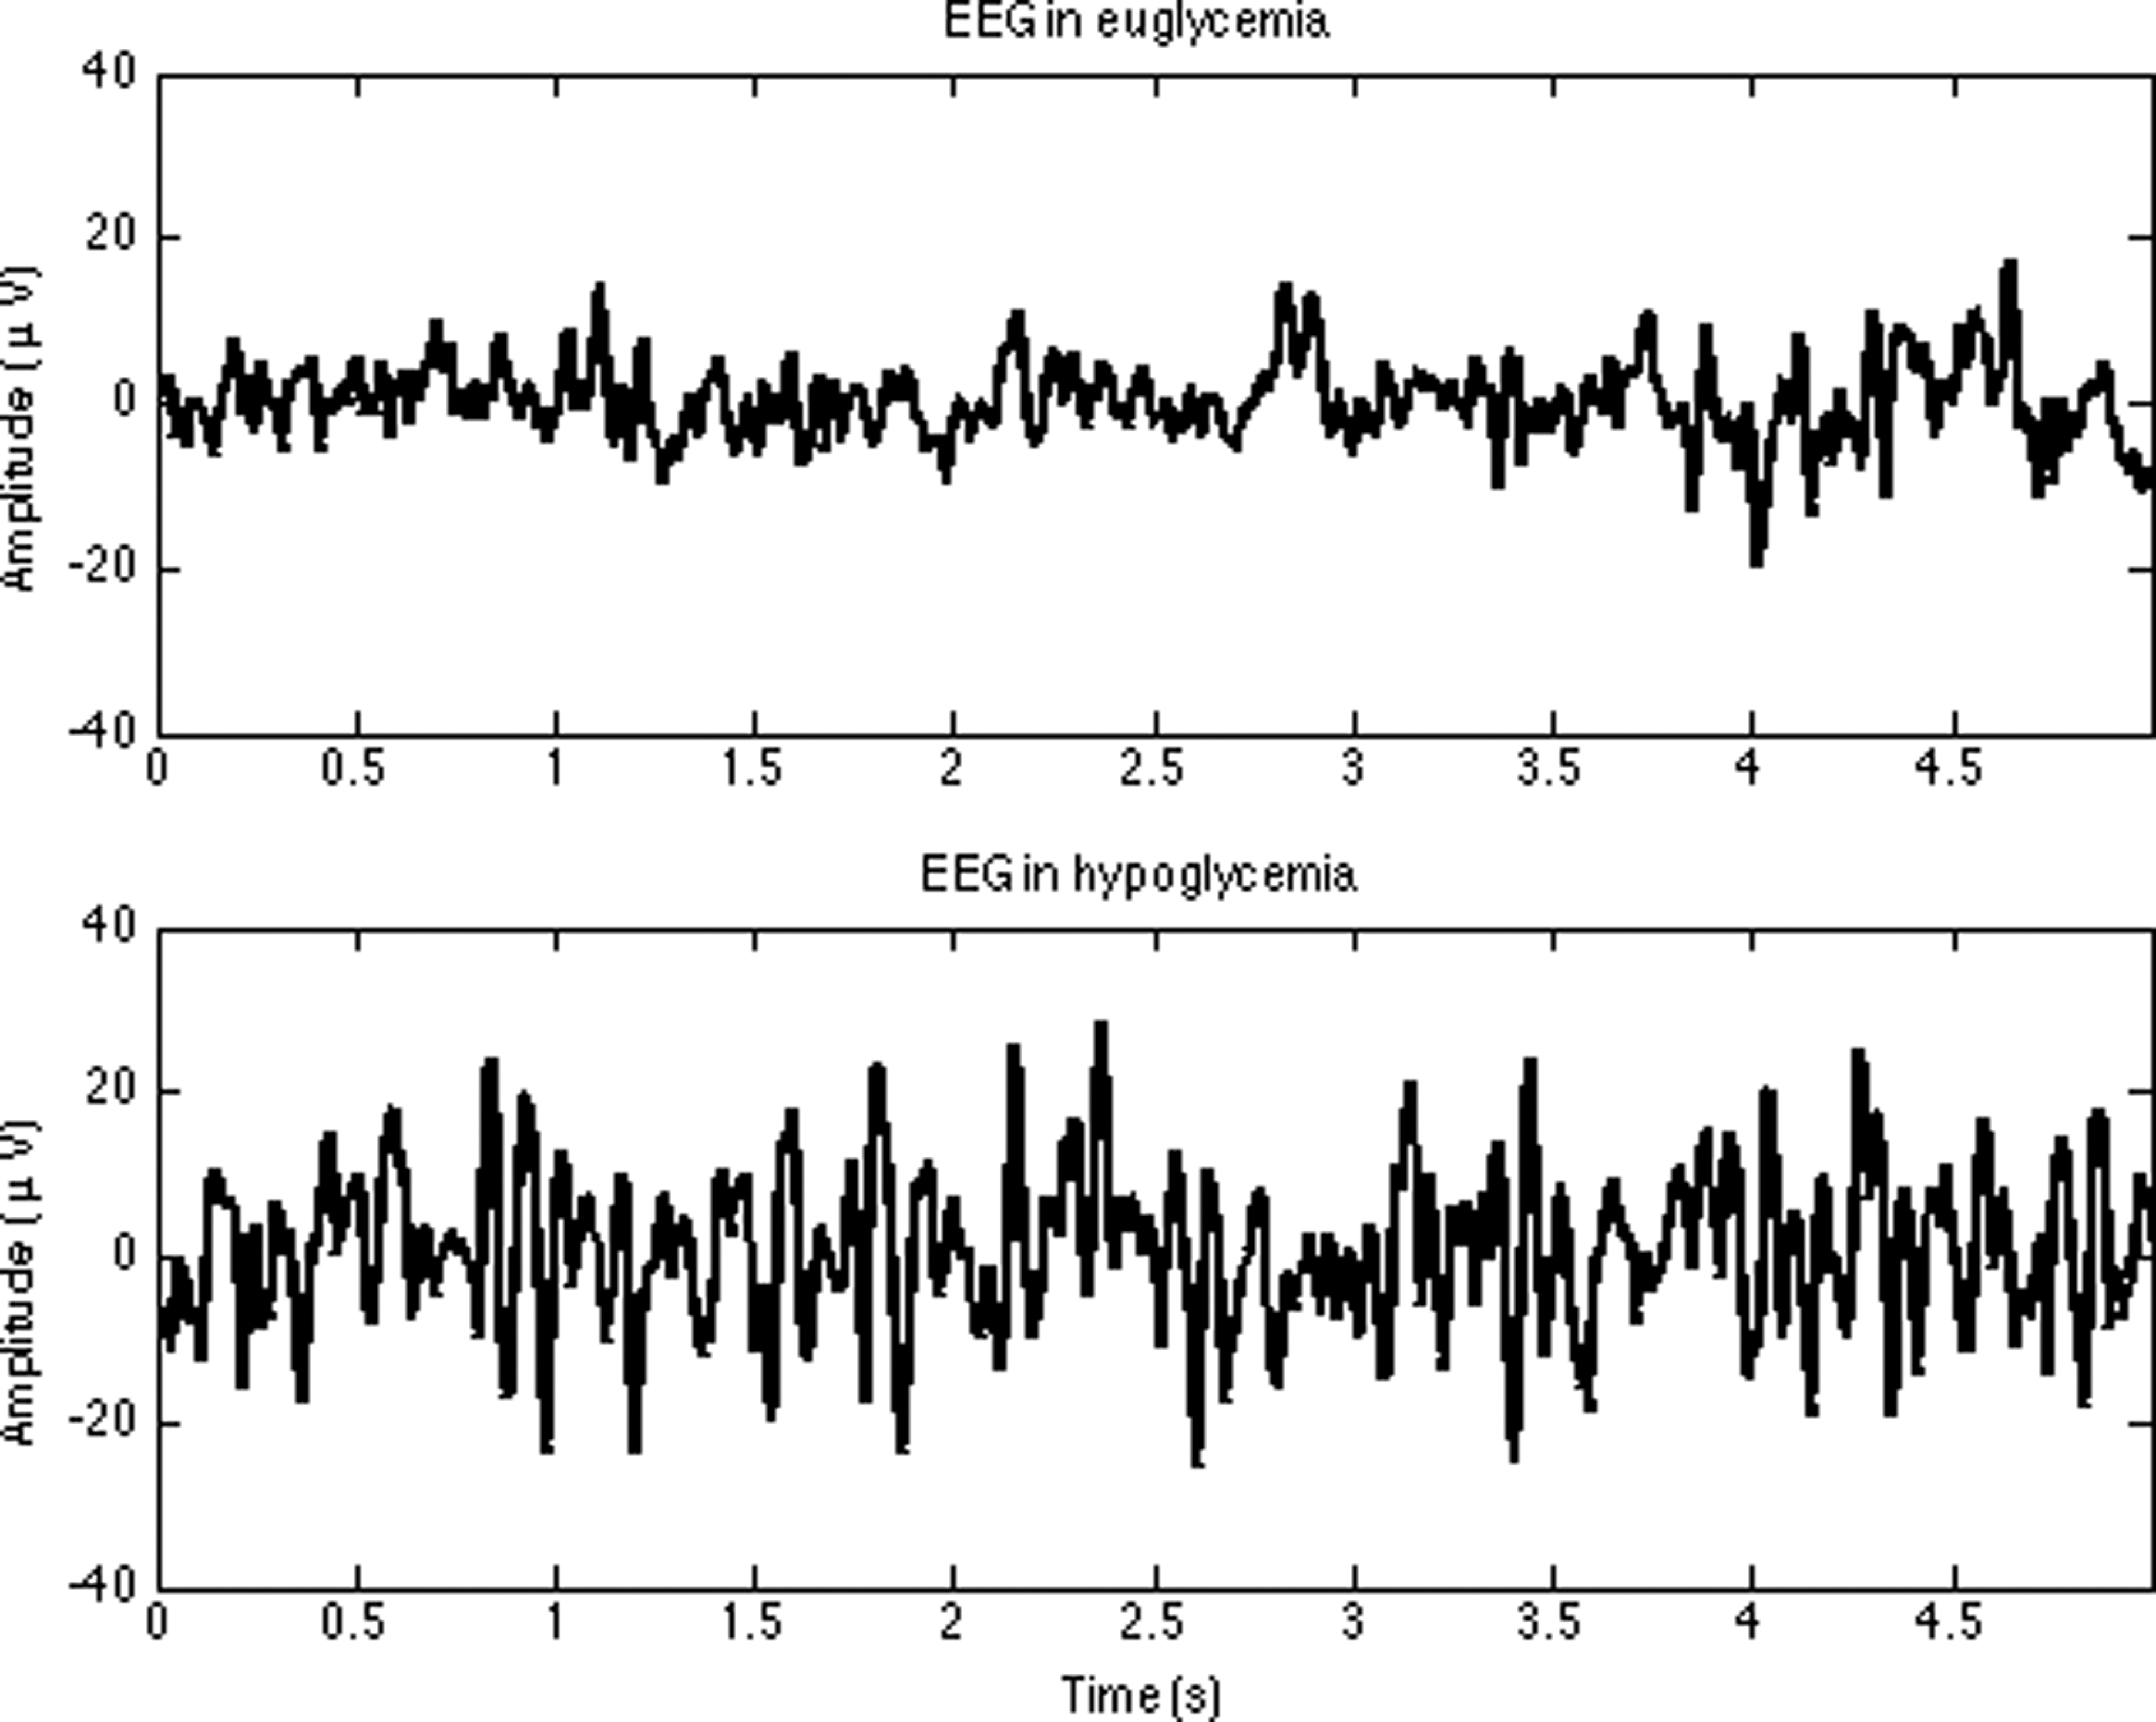
Examples of 5-s electroencephalogram (EEG) epochs extracted from the P3-C3 derivation in
Detection of glycemic intervals
For each subject, two 1-h intervals, corresponding to eu- and hypoglycemic condition, respectively, were identified from the BG time-series by visual inspection, detecting when the glycemic thresholds at 70 and 180 mg/dL were crossed by a smoothing spline approximation of the samples. 21
Figure 1 shows the selected intervals in the representative subject number 6 (labeled to facilitate reading) and, in the bottom panel, the glycemic thresholds at 70 and 180 mg/dL (dashed horizontal lines) used to determine them. The smoothing spline defined to facilitate the interval detection is also represented (dashed line with open bullets in Fig. 1, bottom panel).
MSE analysis
Irregularity and complexity of a signal
Popular entropy-based measures—namely, approximate entropy (ApEn) and SampEn—have been proposed in the last decades for the quantification of the irregularity (lack of orderliness) of a signal. ApEn, defined by Pincus, 22 and SampEn, later introduced by Richman and Moorman 20 to overcome some ApEn limitations, have been vigorously used to study biological signals, 23,24 with several applications to endocrine–metabolic, 25 heart rate, 26 EEG, 27,28 vocal, 29 and hemodynamic 30 time-series. The mathematical formulations to obtain them are slightly different, but, given an N-dimensional time-series, both algorithms result in a non-negative number related to the logarithmic likelihood that two m-dimensional patterns of the signal that are similar, within a certain tolerance r, remain similar at the next incremental comparison. 17 Lower values of ApEn and SampEn imply higher regularity, or persistence, in a time-series, whereas large values imply substantial fluctuation. 31
Because these traditional entropy measures quantify the irregularity of a signal, they are maximized by completely random time-series and minimized by regular and periodic patterns. On the ground of the definition provided by Tononi et al., 32 thus, it is not proper to interpret them as indicators of signal complexity, because complexity measures have to satisfy the requirement of attaining small values not only for totally predictable signals, but also for completely random time-series, that are highly irregular but not structurally complex and admit, at a global level, very simple descriptions. To overcome this limitation of entropy indicators, in 2002, Costa et al. 19 introduced the MSE analysis, an approach that allows quantifying the actual complexity of a signal by investigating how its irregularity features, measured by SampEn, vary when they are assessed at multiple temporal scales. In detail, the MSE technique consists of a coarse-graining procedure used to obtain averaged, down-sampled versions of the original signal on a grid of scales τ where the smallest, unitary, entry corresponds to the original signal sampling period; then, the entropy of all the coarse-grained time-series is calculated using the SampEn algorithm, and the overall complexity of the original signal is assessed from the evaluation of how SampEn varies with the temporal scale τ. For a detailed mathematical description of MSE and SampEn, we refer the reader to the quoted references and to our Appendix.
Setting of parameters for the MSE analysis implementation
The implementation of the MSE approach on a time-series of length N requires previously fixing the values of parameters m, r, and τ. For the specification of pattern length m and tolerance r in the SampEn computation, guidelines provided by Pincus and Goldberger 17 and Pincus 23 with regard to ApEn can be followed. Specifically, they recommended to choose m such that N is at least 10 m (and preferably at least 30 m ) and r ranging from 0.1 to 0.25 times the sample SD of the analyzed time-series. 17,23 Recently, however, it has been shown that for some signals characterized by fast dynamics (e.g., neuronal signals), it would be more advisable to use the r value that maximizes ApEn. 33 As far as τ is concerned, Costa et al. 18,19 usually used temporal scales from 1 to 20, but it is possible to extend the scale if the sampling rate is sufficiently high.
In our study, the 1-h EEG segments acquired in eu- and hypoglycemia were divided into 60 epochs lasting 1 min. Each epoch was made up of N=12,000 samples, and its irregularity was assessed at 40 different temporal scales (τ from 1 to 40), so that the shortest analyzed time-series was made up of 300 samples. SampEn was calculated using a template length m ranging from 1 to 4 and a tolerance r ranging from 0.05 to 0.5 times the sample SD of the analyzed EEG epoch (a 0.05 increase of r was considered). For each parameterization, the 60 MSE profiles calculated within each 1-h glycemic interval were averaged to obtain, for each subject, two MSE profiles characterizing the complexity of EEG in eu- and hypoglycemia, respectively.
Results
Results from the MSE analysis appeared similar for all the considered (m, r) couples and are summarized in Figure 3 for the representative pair m=2, r=0.3. In detail, Figure 3 shows the mean±SD of SampEn within the population plotted against the temporal scale τ, with the green line with round markers referring to euglycemia and the blue line with square markers to hypoglycemia (color graphics are available online at
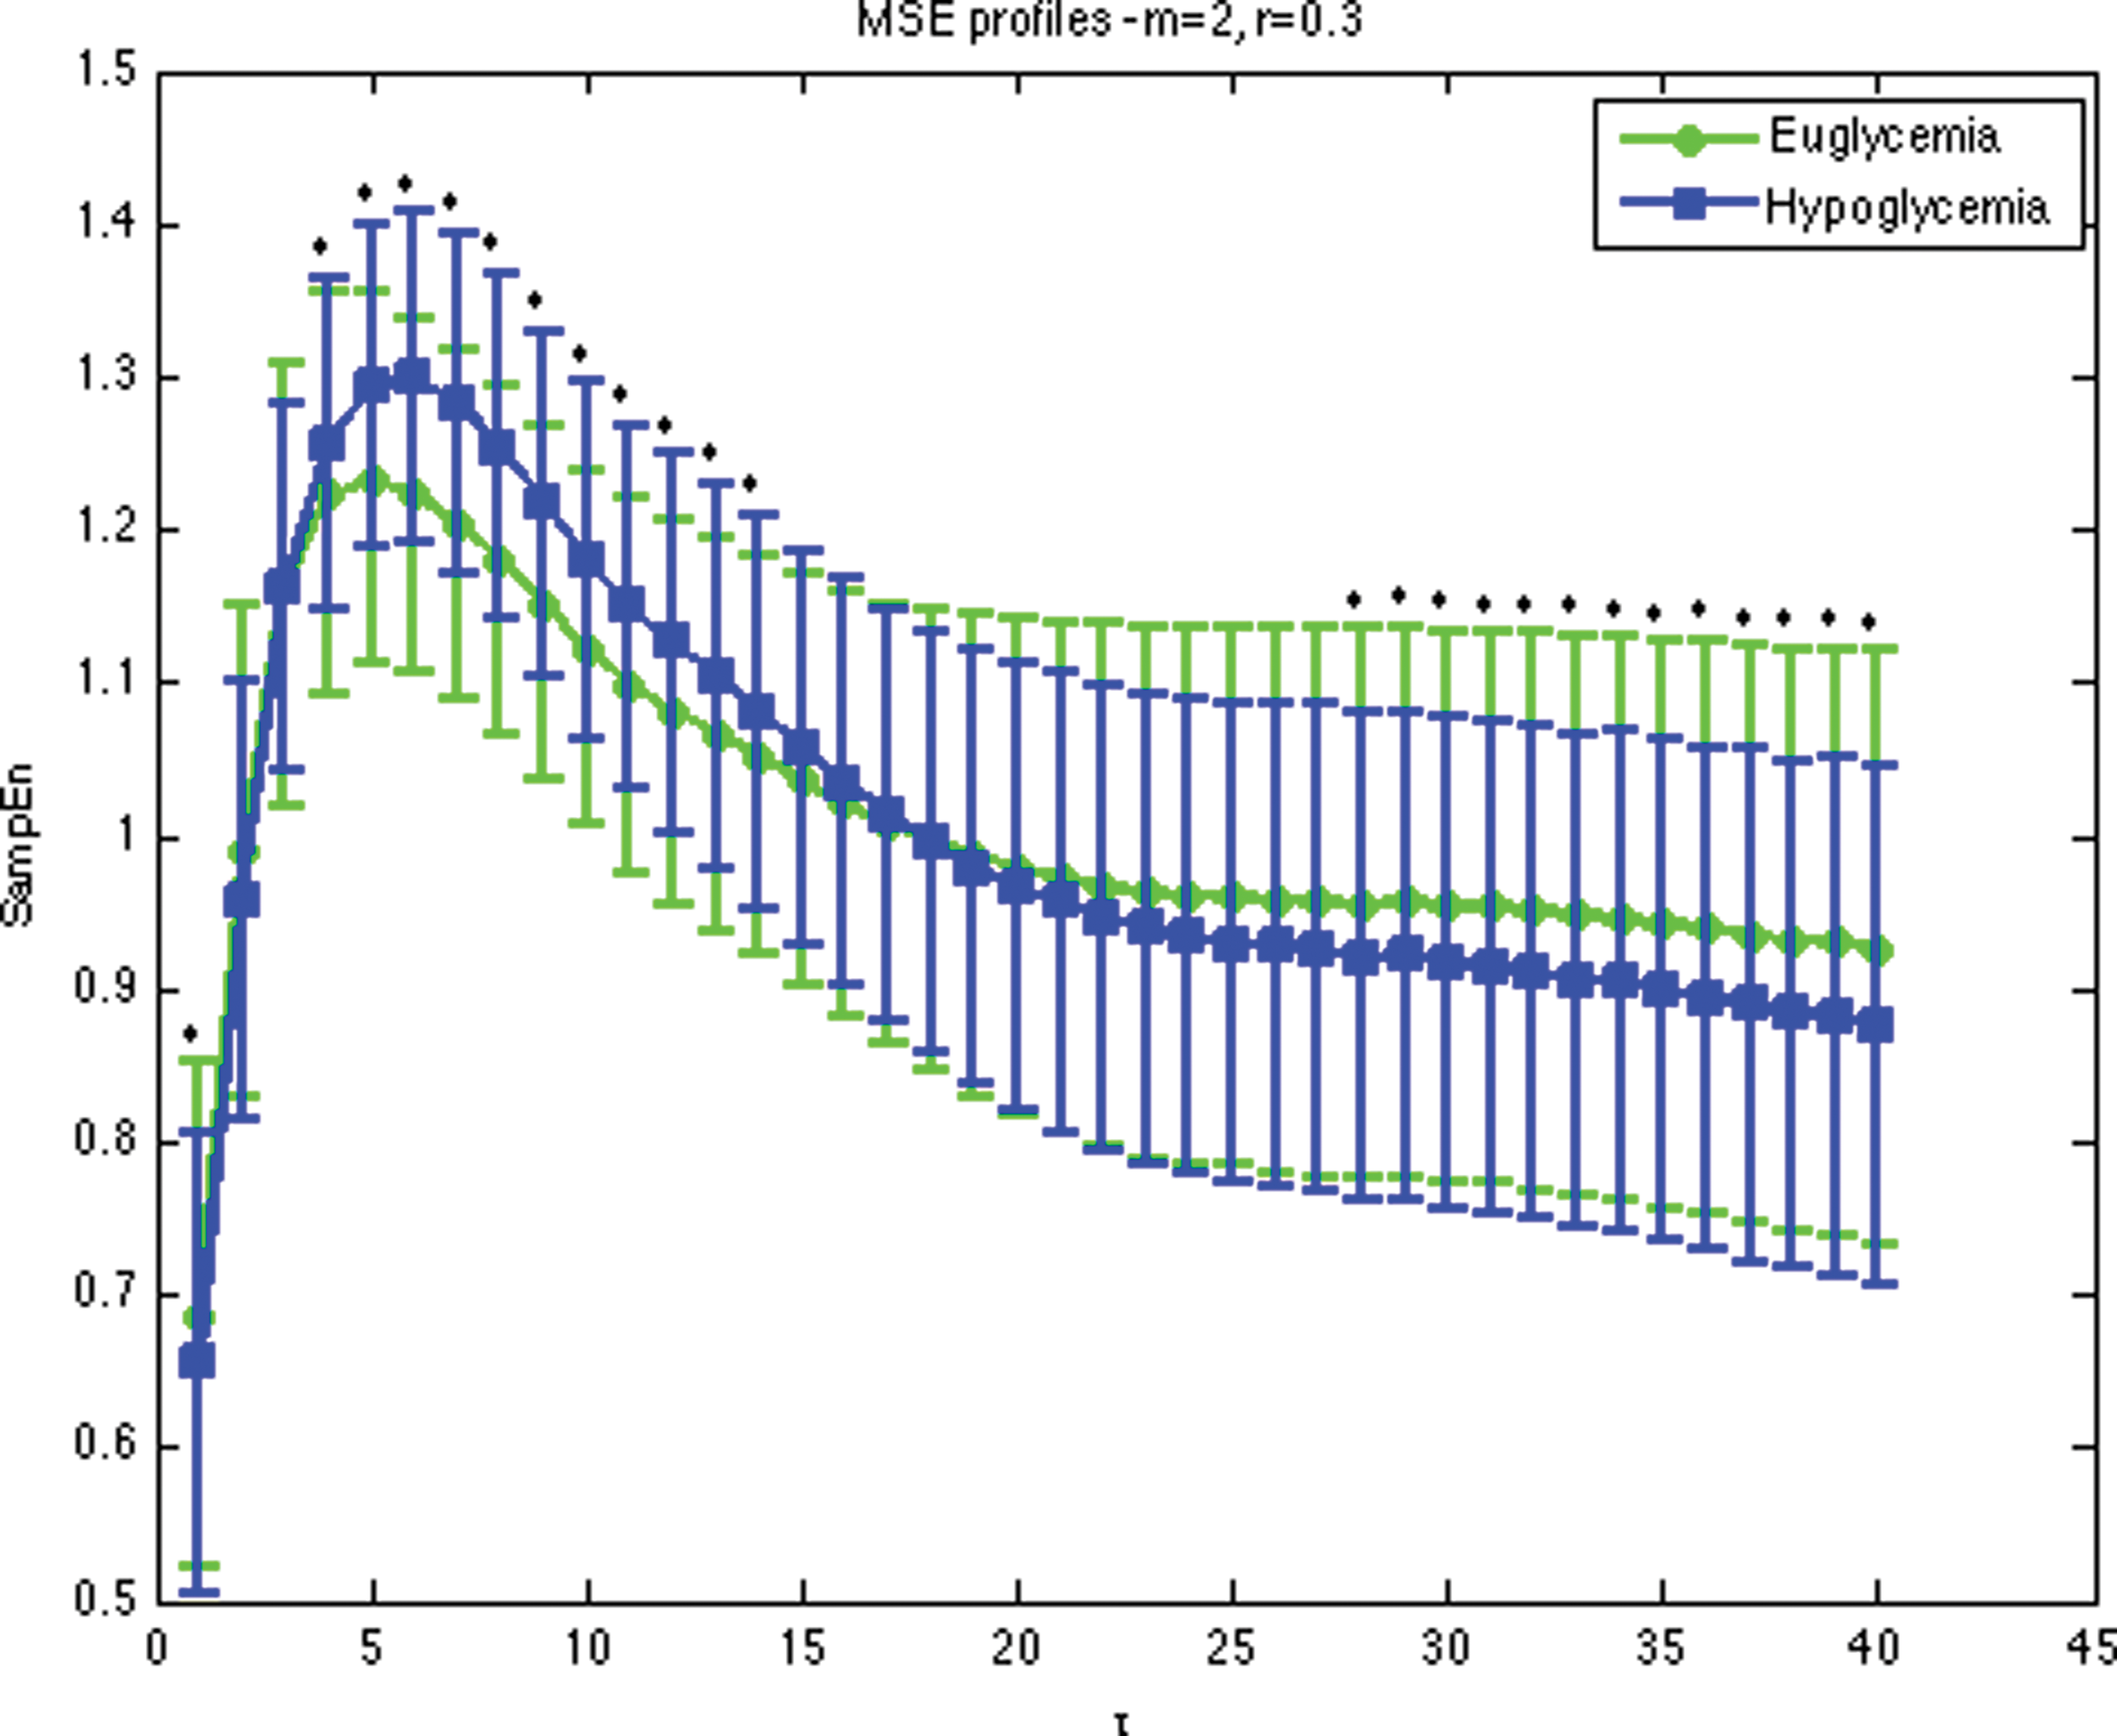
Multiscale entropy (MSE) profiles obtained within the population for electroencephalography in euglycemia (green line with solid circles) and hypoglycemia (blue line with solid squares) with m=2 and r=0.3 (color graphics are available online at
Looking at Figure 3 and considering both glycemic states, it can be observed that two main zones having different slopes characterize the MSE profiles. In particular, SampEn increases at small time scales (τ from 1 to 5) and monotonically decreases as the time scale becomes larger (τ from 5 to 40), with a slope steeper at medium temporal scales (τ from 5 to 20) than at the largest ones (τ from 20 to 40). The initial increase in the entropy values could be related to the fact that the coarse-graining procedure initially produces an effective decorrelation of a signal with a finite correlation time. 34 However, as the analyzed temporal scale increases, the number of averaged samples increases as well, and erratic fluctuations of the signal are attenuated, inducing a progressive entropy decrease.
Comparing the MSE profiles obtained for euglycemia (green with round markers) and hypoglycemia (blue with square markers) (color graphics are available online at
Discussion and Conclusions
Hypoglycemia causes a progressive impairment of cognitive functions, and thus its occurrence is likely to affect EEG time-series in a quantitatively significant manner. So far, HRECs have been assessed in the literature by using indicators tracing back to linear spectral analysis in the canonical EEG bands. However, because many studies have shown an alteration of EEG complexity in physiopathological and impaired consciousness conditions, 12 –16 several nonlinear indicators of signal complexity available in the literature could complement the characterization of HRECs. In this article, the MSE approach, a nonlinear technique used for the quantification of signal complexity, was considered for the assessment of HRECs. In particular, data collected during an induced hypoglycemia experiment performed in 19 T1D volunteers, with simultaneous EEG acquisition and BG measurement, showed that MSE computed from the P3-C3 EEG derivation highlights a statistically significant decrease in the complexity of EEG when hypoglycemia is approached, related to a degradation of the long-range temporal correlations of the signal at low BG levels. Hence, the present study suggests that hypoglycemia not only results in an increase of the power of low-frequency EEG waves, as already shown previously, 1 –5,7 –11 but also in a decrease of EEG complexity, related to the progressive loss of cognitive functions and altered cerebral activity. Thanks to its ability to quantify the complexity of a signal, the MSE approach seems to be a useful tool to assess HRECs, bringing complementary information and new insights with respect to classical linear spectral metrics. Moreover, from a clinical point of view, the findings of this study strengthen the potentiality of using the body's reaction to the glucose level, rather than only the glucose itself, to provide more reliable hypoglycemia warning in subjects with diabetes. 8,9
The major limitation of the present work concerns the limited number of available subjects. Thus, further developments in the short term will have to include the extension of the dataset by additional T1D and control subjects. Also, future work will include an assessment of the possibility of using MSE within a classifier aiming at revealing the actual glycemic state, the evaluation of complexity from EEG derivations other than P3-C3, the assessment of how other nonlinear indicators (e.g., Lempel–Ziv complexity, correlation dimension, mutual information, and cross-SampEn between pairs of EEG channels) can help in HREC investigation, and the definition of other potentially useful measures in the time–frequency domain. 35 Finally, by considering parallel EEG and continuous glucose monitoring recordings, the possible correlation between EEG parameters and glucose variability indices, such as static and dynamic risks, 36 could also be investigated. In the longer term, future developments of this research may lead to the incorporation of new methods into the device recently proposed by Juhl et al. 8 and Elsborg et al. 9 to detect hypoglycemic events in real time by processing EEG signals measured by subcutaneous electrodes. In the future, such a device may become a useful additional input to the online numerical algorithms proposed in the literature, to render commercial CGM sensors “smarter.” 37
Footnotes
Acknowledgments
The authors are grateful to the anonymous reviewers for the constructive criticism that led to improvement of the quality of the presentation and the interpretation of the results.
Author Disclosure Statement
J.D.-H., L.S.R., and C.B.J. are employees of Hypo-Safe. C.F., G.S., A.-S.S., A.G., and C.C. declare no competing financial interests exist.