
Abstract
Introduction:
Glucagon-like peptide-1 receptor agonists (GLP-1 RAs) are a new class of drugs used in the treatment of type 2 diabetes mellitus (T2DM). Gastrointestinal (GI) adverse events (AEs) are the most frequently reported treatment-related AEs for GLP-1 RAs. We aim to evaluate the effect of GLP-1 RAs on the incidence of GI AEs of T2DM.
Materials and Methods:
The overview of the GI events of GLP-1 RAs has been performed on relevant publications through the literature search, such as MEDLINE, EMBASE, Cochrane Library, and
Results:
Taspoglutide 30 mg once weekly (TAS30QW) and lixisenatide 30 μg twice daily (LIX30BID) were ranked the top two drugs in terms of GI AEs versus placebo. The odds ratios of nausea and vomiting for TAS30QW were 11.8 (95% confidence interval [CI], 2.89, 46.9) and 51.7 (95% CI, 7.07, 415), respectively, and that of diarrhea was 4.93 (95% CI, 1.75, 14.7) for LIX30BID.
Conclusions:
Our study found all GLP-1 RA dose regimens significantly increased the incidence of GI AEs, compared with placebo or conventional treatment. The occurrence of GI AEs was different with diverse dose regimens of GLP-1 RAs. TAS30QW had the maximum probability to occur nausea and vomiting, whereas LIX30BID had the maximum probability to cause development of diarrhea versus other treatments.
Introduction
A
The most frequently reported treatment-related AE about GLP-1 RAs was gastrointestinal (GI) disorders, mainly nausea, vomiting, and diarrhea. Some research has shown that the GI AEs associated with GLP-1 RAs are dose dependent and decline over time. 8 However, it is unclear about the incidence of GI AEs induced by different GLP-1 RAs. Therefore, we collected all randomized controlled trials (RCTs) that have compared GLP-1 RAs with placebo or traditional antidiabetes agents. Pairwise random effect meta-analyses were performed to compare the impact on GI AEs of any two different doses of GLP-1 RAs and of placebo or traditional antidiabetes agents in T2DM. An additional network meta-analysis was used to assess the totality of RCT evidence to date simultaneously, in order to answer research questions in the absence of direct evidence, to improve the precision of estimates by combining direct and indirect evidence, to rank treatments, and to evaluate the impact of certain components of GLP-1 RAs on GI AEs.
Materials and Methods
Search strategy
In consultation with a medical librarian, we established a search strategy for the following three databases (from inception to October 31, 2013): Medline, EMBASE, and the Cochrane Library. The following search strategy (Ovid) was adapted for use with the other databases: 1, exp glucagon-like peptides/; 2, (glucagon like peptide* or GLP-1).tw.; 3, (exenatide or liraglutide or albiglutide or taspoglutide or lixisenatide or LY2189265).tw.; 4, randomized controlled trial.pt.; 5, (randomized or randomised).tw.; and 6, (1 or 2 or 3) and (4 or 5).
We also searched
Data extraction and quality evaluation
The data extraction was based on RCTs involving GI AEs of GLP-1 RAs. The traditional therapies were thiazolidinediones (TZDs), insulin, sulfonylureas (SU), metformin (Met), and sitagliptin. A standardized prepiloted form including population characteristics (age, T2DM course, baseline hemoglobin A1c) and GI AEs, such as nausea, vomiting, and diarrhea, was assessed. Quality of studies was assessed according to the JADAD scale 13 : adequate method for randomization, appropriate blinding procedures, and detailed report of withdrawals.
Clinical doses of GLP-1 RAs
The standard EX regimen starts with 5 μg twice daily and then increases to 10 μg twice daily after a month. The dose of LIR is suggested to start with 0.6 mg once daily and then increases to 1.2 mg or 1.8 mg once daily. For new GLP-1 RAs, we only included doses that are likely to be used in routine care. We excluded trials or arms using nonstandard doses, which mainly came from dose-range studies (Table 1).
Data analysis
We calculated the odds ratio (OR) and appropriate 95% confidence intervals (CIs) for all relevant GI AE outcomes according to the number of events reported in the original studies. For the outcome with a zero event in one treatment of a trial, we applied the Haldane method and added 0.5 to each cell. 14 We pooled summary estimate using the DerSimonian–Laird random effects method, 15 which recognizes and anchors studies as a sample of all potential studies.
In order to evaluate the relative effectiveness of each GLP-1 on GI AEs, a random-effects network meta-analysis within a Bayesian framework 16,17 was assessed, and the results were summarized using OR and their CIs. To estimate inconsistency, we calculated the difference between indirect and direct estimates. 18 Inconsistency was defined as disagreement between direct and indirect evidence with a 95% CI excluding 0. We estimated the posterior densities for unknown parameters using the Markov Chain Monte Carlo procedure for each model. Each chain used 50,000 iterations with a burn-in of 20,000. To check whether a model's overall fit is satisfactory, we consider an absolute measure of fit and the posterior mean of the residual deviance (the deviance for the fitted model minus the deviance for the saturated model). We expect that each data point should contribute about 1 to the posterior mean deviance so that it can be compared with the number of data points for the purpose of checking the model fit. 19 The probability for each GLP-1 RAs (most harmful regimen, second most harmful regimen) is shown graphically with rankograms and surface under the cumulative ranking curve (SUCRA). 20 Analysis were conducted using STATA version 10.0 (pairwise random effect meta-analysis), R 2.13.1 (estimation of inconsistency), and WinBUGS 1.4.3 (network meta-analysis, SUCRA calculation, and model fit) software.
Results
Study characteristics
The flowchart of the literature search is shown in Figure 1. The range of publication year was 2002–2014. Data were available on 25,911 participants. The average age of included participants was 56.04 years (SD 1.98 years), with a range from 51.9 to 61.0 years. The mean duration of studies was 29.94 weeks (SD 31.48 weeks), with a range from 4 to 234 weeks. The mean diabetes duration was 7.23 years (SD 2.71 years), with a range from 1.3 to 13.9 years. The mean pretreatment hemoglobin A1c level was 8.14% (SD 0.42%), with a range from 7.2% to 9.3% (Supplementary Table S1; Supplementary Data are available online at
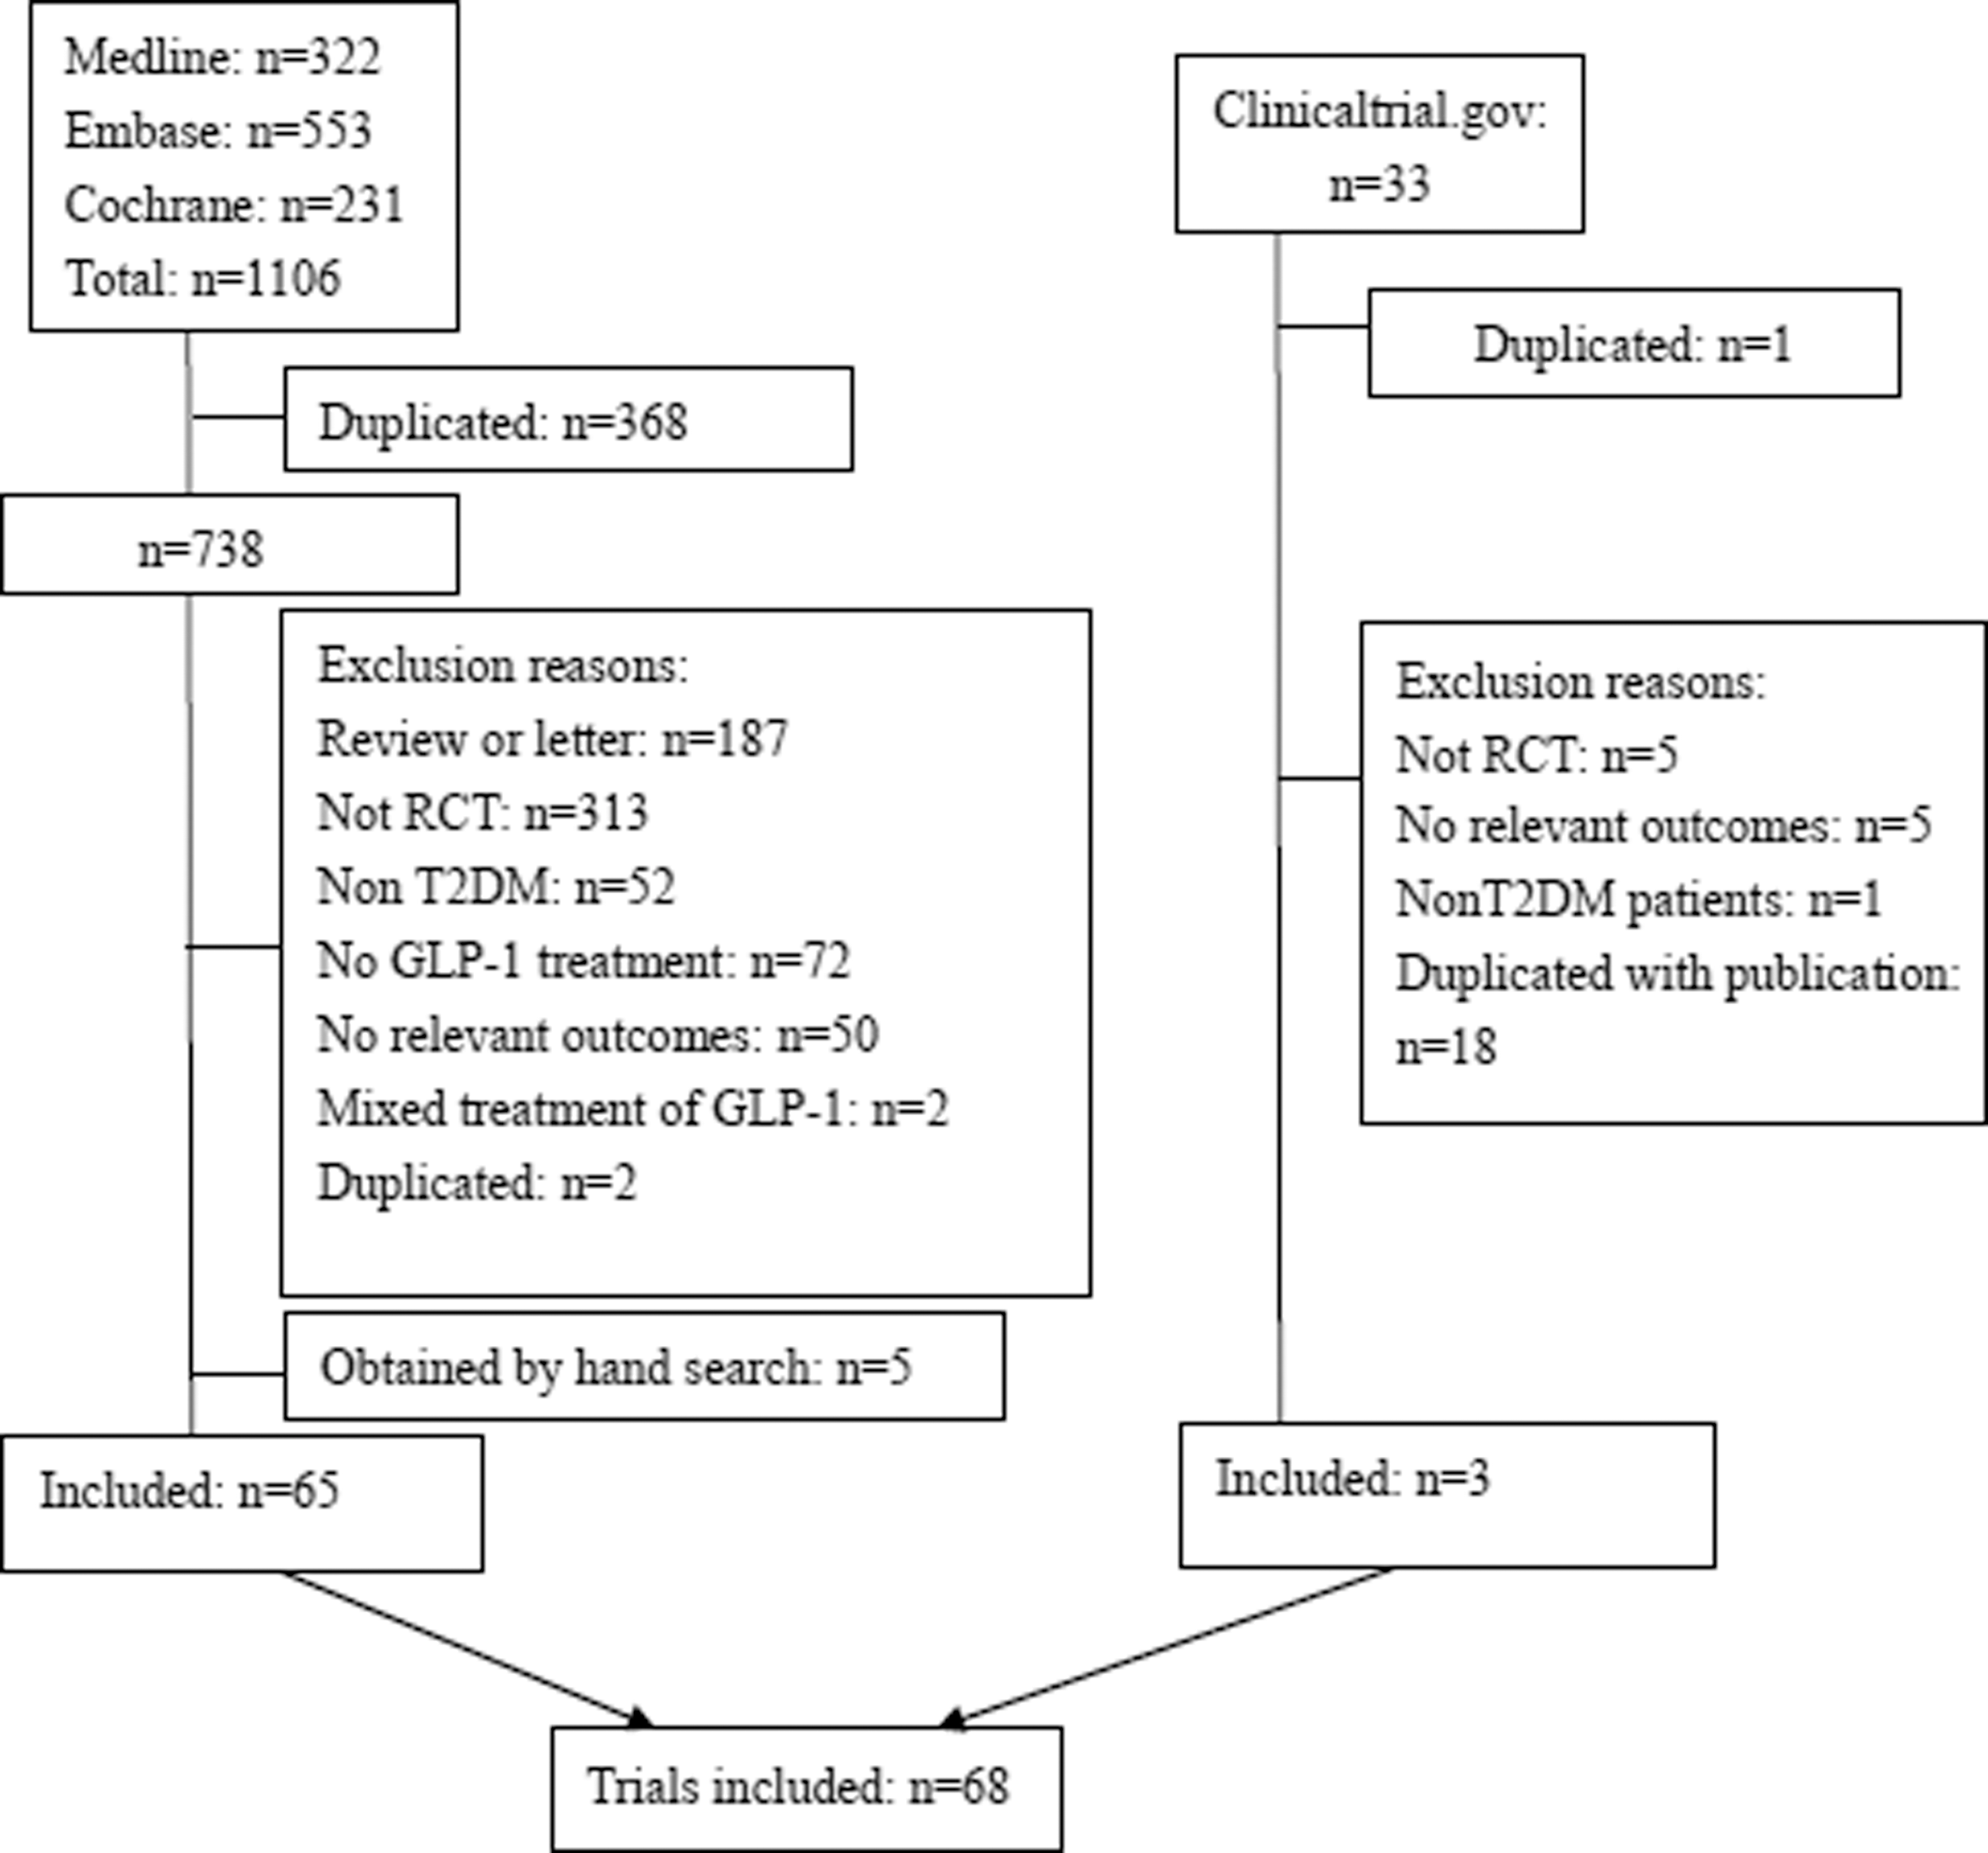
Flow diagram of the included studies. GLP-1, glucagon-like peptide-1; RCT, randomized controlled trial; T2DM, type 2 diabetes mellitus.
Evidence network and methodological quality
Twenty-six treatments were analyzed, including 20 dose regimens of GLP-1 RAs (Albi30Q2W, Albi30QW, Albi50Q2W, Albi50QM, EX10BID, EX2QW, EX5BID, LIR0.6QD, LIR1.2QD, LIR1.8QD, LIX20BID, LIX20QD, LIX30BID, LIX30QD, LY0.5/1.0QW, LY1.0/1.0QW, LY1.0/2.0QW, TAS20Q2W, TAS20QW, and TAS30QW), five kinds of traditional antidiabetes agents (TZD, insulin, SU, Met, and sitagliptin), and placebo. The geometric distribution is only displayed for nausea (Fig. 2). Forty-seven trials were two-arm studies, and 21 were multiple-arm studies (Supplementary Table S1). Overall, 25,911 patients contributed to nausea analysis (including 26 treatments, 168 arms), 25,503 patients contributed to vomiting analysis (including 26 treatments, 168 arms), and 23,689 patients contributed to diarrhea analysis (including 26 treatments, 150 arms), respectively. The overall quality of studies was rated according to the JADAD scale. The proportion of appropriate description of randomization, allocation concealment, blinding, and dropout were 83.82%, 58.82%, 61.76%, and 89.71%, respectively. Additionally, 91.18% trials used intention-to-treat analysis (Supplementary Table S2).
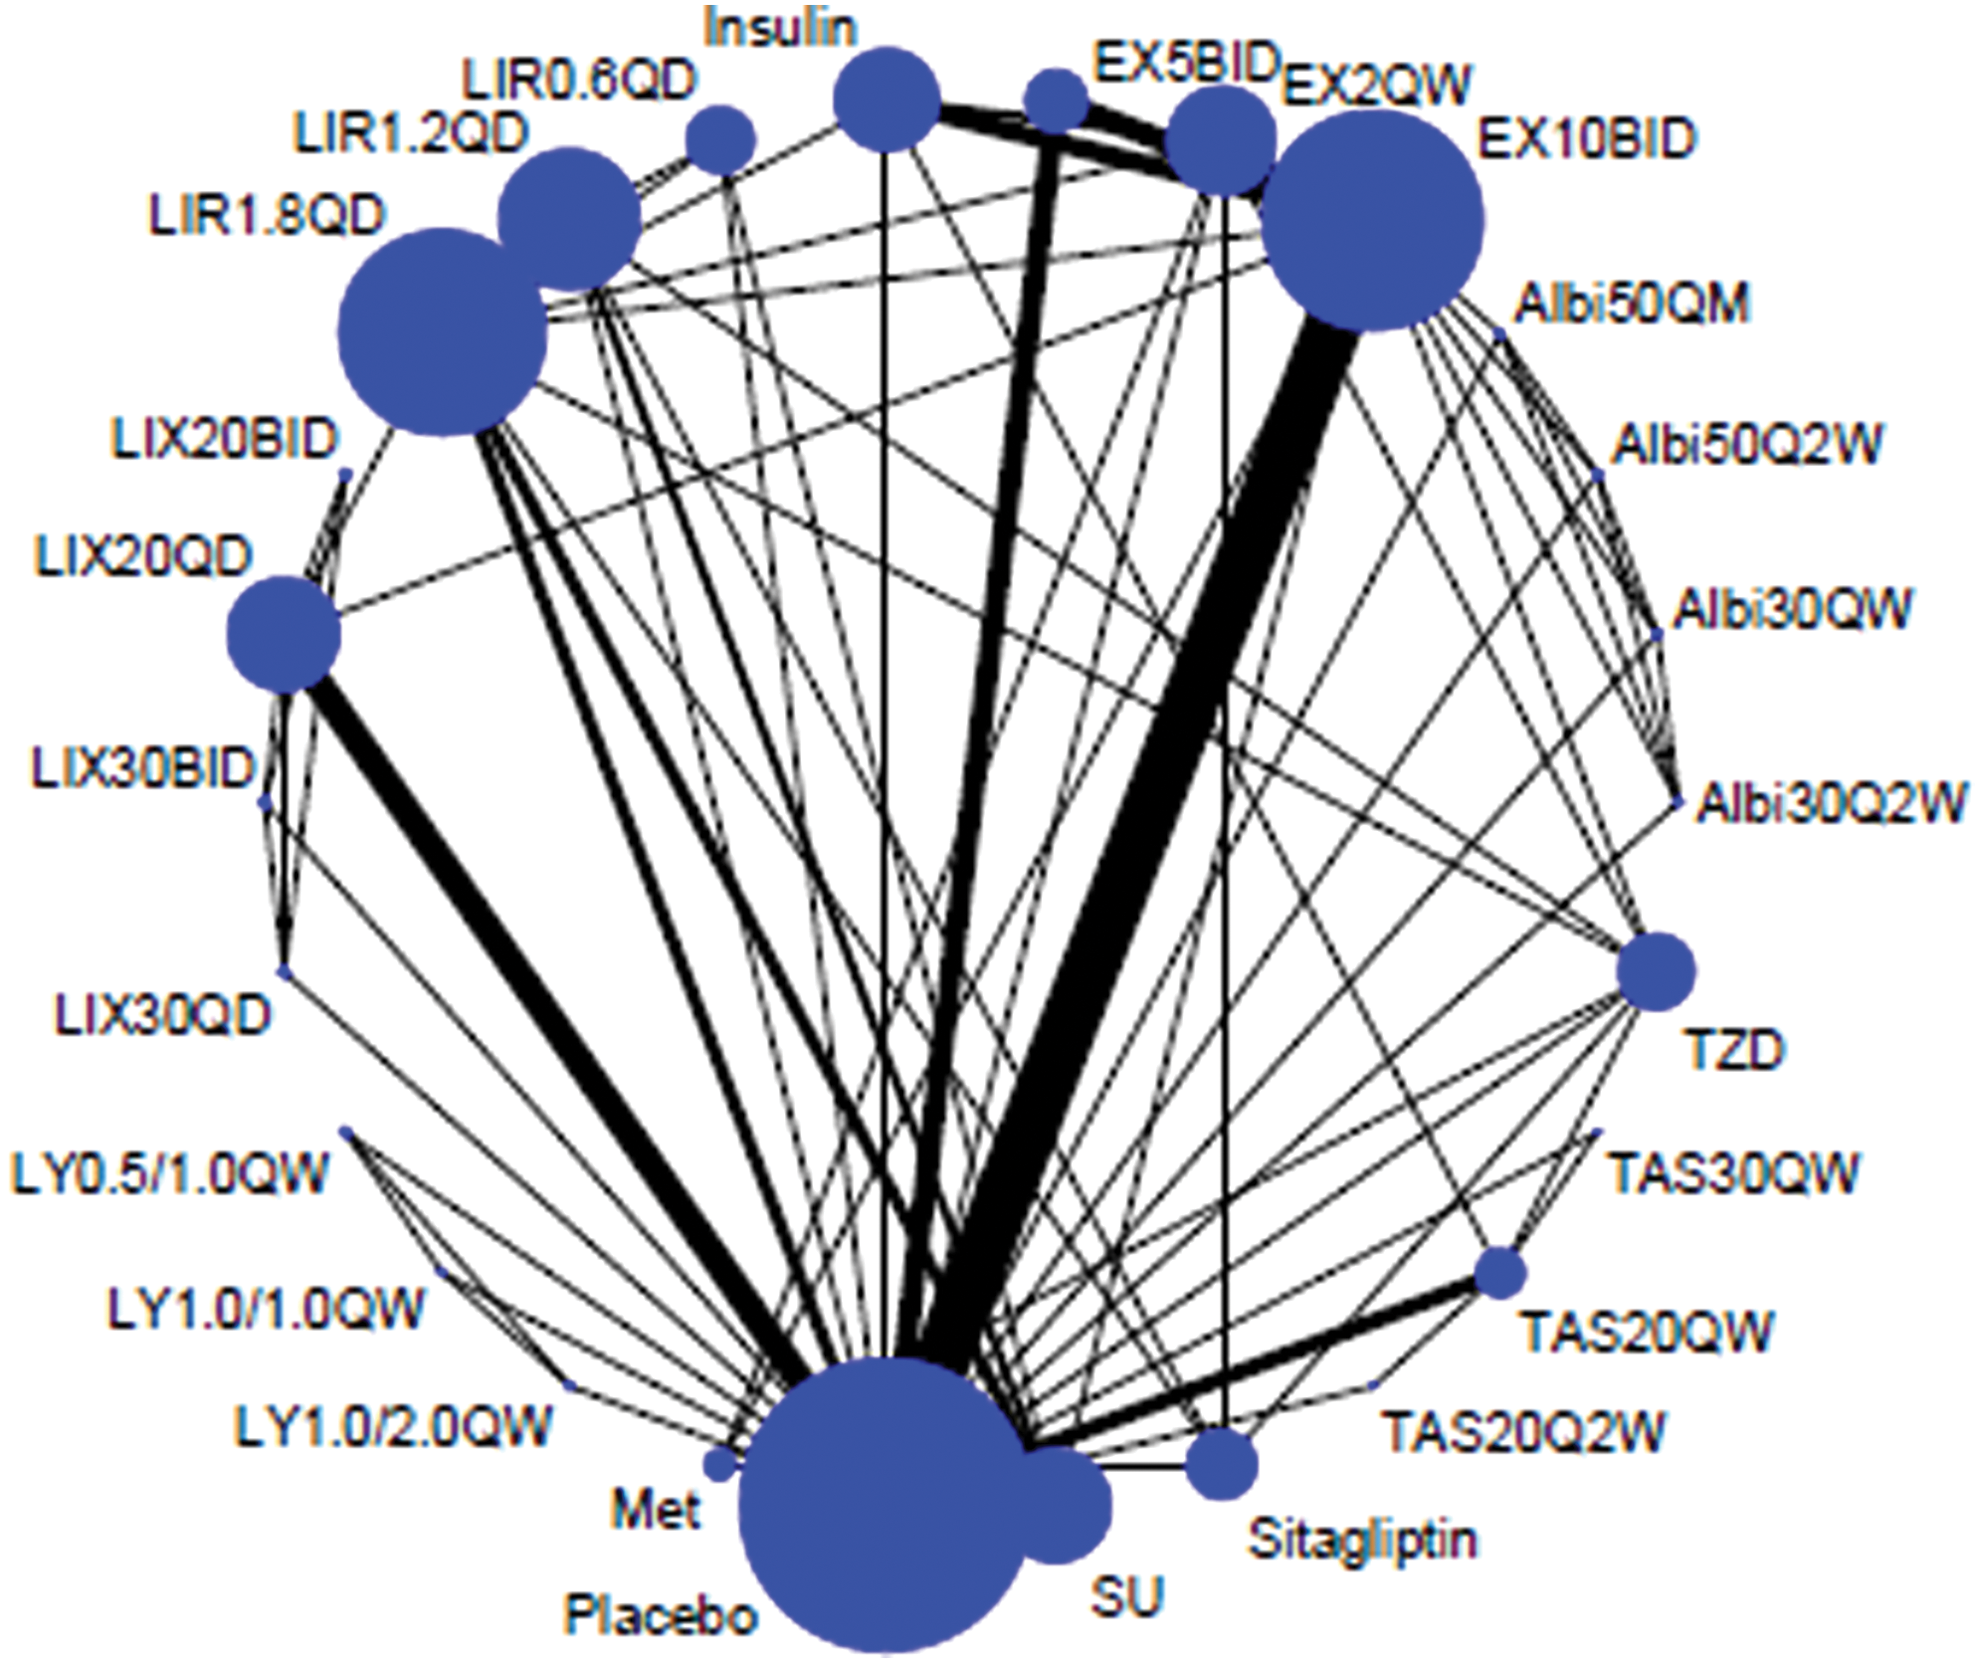
Evidence structure of eligible comparisons of nausea. The numbers along the link lines indicate the number of trials or pairs of trial arms. Lines connect the interventions that have been studied in head-to-head (direct) comparisons in the eligible randomized controlled trials. The width of the lines represents the cumulative number of randomized controlled trials for each pairwise comparison, and the size of every node is proportional to the number of randomized participants (sample size). Albi30Q2W, albiglutide 30 mg once biweekly; Albi30QW, albiglutide 30 mg once weekly; Albi50Q2W, albiglutide 50 mg once biweekly; Albi50QM, albiglutide 50 mg once monthly; EX10BID, exenatide 10 μg twice daily; EX2QW, exenatide 2 mg once weekly; EX5BID, exenatide 5 μg twice daily; LIR0.6QD, liraglutide 0.6 mg once daily; LIR1.2QD, liraglutide 1.2 mg once daily; LIR1.8QD, liraglutide 1.8 mg once daily; LIX20BID, lixisenatide 20 μg twice daily; LIX20QD, lixisenatide 20 μg once daily; LIX30BID, lixisenatide 30 μg twice daily; LIX30QD, lixisenatide 30 μg once daily; LY0.5/1.0, LY2189265 0.5 mg once weekly for 4 weeks, then 1.0 mg once weekly for 12 weeks; LY1.0/1.0, 1.0 mg once weekly for 16 weeks; LY1.0/2.0, 1.0 mg once weekly for 4 weeks, then 2.0 mg once weekly for 12 weeks; Met, metformin; SU, sulfonylureas; TAS20Q2W, taspoglutide 20 mg once biweekly; TAS20QW, taspoglutide 20 mg once weekly; TAS30QW, taspoglutide 30 mg once weekly; TZD, thiazolidinedione. Color images available online at
Network meta-analysis about the impact of GLP-1 RAs on GI AEs versus placebo
Nausea
The results showed almost all GLP-1 RAs significantly increase the incidence of nausea in comparison with placebo. TAS30QW, Abi50QW, and LIX30QD were ranked the top three drugs in terms of nausea. The ORs of nausea versus placebo were 11.8 (95% CI, 2.89, 46.9) for TAS30QW, 11.1 (95% CI, 3.04, 40.2) for Abi50Q2W, and 10.1 (95% CI, 2.92, 35.2) for LIX30QD. The last three ORs were 2.46 (95% CI, 1.45, 4.13) for EX2QW, 3.17 (95% CI, 1.94, 5.22) for EX5BID, and 3.57 (95% CI, 1.56, 8.54) for LIR0.6QD in comparison with placebo (Fig. 3).

Network meta-analysis about the impact of glucagon-like peptide-1 receptor agonists on gastrointestinal adverse events versus placebo:
Vomiting
Similarly, the results showed almost all GLP-1 RAs significantly increase the incidence of vomiting in comparison with placebo. The top three drugs associated with vomiting were TAS30QW (OR=51.7; 95% CI, 7.07, 415), LIX30QD (OR=27.2; 95% CI, 4.58, 193), and Albi50Q2W (OR=15.4; 95% CI, 2.76, 91.4) versus placebo. The last three drugs associated with vomiting were EX2QW (OR=3.33; 95% CI, 1.54, 7.47), EX5BID (OR=5.64; 95% CI, 2.67, 12.1), and LIX20QD (OR=6.01; 95% CI, 3.42, 11.4) (Fig. 3).
Diarrhea
For the diarrhea analysis, the high incidence mainly came from LIX and LIR in comparison with placebo. Compared with placebo, the first three largest ORs among different doses of GLP-1 RAs were from LIX30BID (OR=4.93; 95% CI, 1.75, 14.7), LIR1.8QD (OR=3.70, 95% CI, 2.47, 5.94), and LIR1.2QD (OR=3.46; 95% CI, 2.14, 6.31). The first three lowest ORs were from LIX20QD (OR=1.52, 95% CI, 1.06, 2.23), TAS20QW (OR=1.67; 95% CI, 1.04, 2.73), and EX5BID (OR=1.94, 95% CI, 1.20, 3.23) (Fig. 3).
Network meta-analysis of major GI AEs of EX and LIR in comparison with conventional treatments
The results of major GI AEs about EX and LIR in comparison with conventional treatments were showed (Supplementary Fig. S1). The incidences of nausea treated with EX10BID, LIR1.2QD, and LIR1.8QD were significantly higher than that with conventional drugs. EX5BID, EX2QW, and LIR0.6QD showed substantial effect on nausea in comparison with conventional treatments except for Met. Our analysis indicated that EX5BID, EX10BID, and liraglutide (0.6QD, 1.2QD, and 1.8QD) have a statistically significant impact on the incidence of vomiting in comparison with traditional drugs, but the effect of EX2QW on vomiting only was different from that of insulin. For the diarrhea analysis, EX5BID, EX10BID, and LIR0.6QD showed a higher incidence than that with insulin and TZD, but no significant difference was observed between them and the other drugs. Both LIR1.2QD and LIR1.8QD have a significant impact on the occurrence of diarrhea in comparison with conventional treatments except for Met. Also, the effect of EX2QW on diarrhea only was different from that of insulin, sitagliptin, and TZD.
Network meta-analysis of different doses of GLP-1 RAs on major GI AEs
The results showed four pairs of significant differences between groups of GLP-1 RA doses on the incidence of nausea: Albi50Q2W versus EX2QW (OR=4.55; 95% CI, 1.19, 17.33), EX10BID versus EX2QW (OR=2.73; 95% CI, 1.73, 4.41), EX10BID versus EX5BID (OR=2.11; 95% CI, 1.33, 3.47), and EX2QW versus TAX30QW (OR=0.20; 95% CI, 0.05, 0.85).
We also observed seven pairs of significant differences between groups of GLP-1 RA doses on the incidence of vomiting: Albi50Q2W versus LY1.0/1.0QW (OR=41.36; 95% CI, 1.28, 2,641.31), EX10BID versus EX2QW (OR=1.95; 95% CI, 1.01, 3.76), EX10BID versus TAS30QW (OR=0.12; 95% CI, 0.01, 0.90), EX2QW versus TAS30QW (OR=0.06; 95% CI, 0.01, 0.49), EX5BID versus TAS30QW (OR=0.11, 95% CI, 0.01, 0.87), LIX20QD versus TAS30QW (OR=0.12; 95% CI, 0.01, 0.90), and LIX30QD versus LY1.0/1.0QW (OR=76.6; 95% CI, 2.29, 4,015.4).
We also observed two pairs of significant differences between groups of GLP-1 RA doses on the incidence of diarrhea: LIR1.2QD versus LIX20QD (OR=2.31; 95% CI, 1.29, 4.43) and LIR1.8QD versus LIX20QD (OR=2.47; 95% CI, 1.48, 4.23) (Supplementary Fig. S2).
Ranking of different doses of GLP-1 RAs on GI AEs
Bayesian posterior probabilities can be used to rank the treatments for each outcome. The SUCRA can be quantified to rank the treatments for each outcome. SUCRA would be 1 when a treatment is certain to be the worst and 0 when a treatment is certain to be the best, which means the larger of SUCRA, the higher risk of GI AEs. Results shown in Supplementary Figure S3 give the probabilities of GI AEs about each treatment. According to SUCRA, TAS30QW had most chance to have a negative impact on both nausea and vomiting, whereas for diarrhea, LIX30BID had the highest impact on it (Supplementary Fig. S4). According to the probability of ranking, the first three most harmful treatments on nausea were TAS30QW (83.20%), Albi50Q2W (81.88%), and LIX30QD (79.36%). The first three most harmful treatments on vomiting were TAS30QW (88.52%), LIX30QD (84.60%), and TAS20QW (78.88%). The first three most harmful treatments on diarrhea were LIX30BID (84.76%), LIR1.2QD (80.72%), and LIR1.8QD (78.28%) respectively. However, insulin, TZD and SU had the lowest risk of GI AEs (Table 2).
Entries in bold type indicate the first three most harmful treatments on GI AEs.
Albi30Q2W, albiglutide 30 mg once biweekly; Albi30QW, albiglutide 30 mg once weekly; Albi50Q2W, albiglutide 50 mg once biweekly; Albi50QM, albiglutide 50 mg once monthly; EX10BID, exenatide 10 μg twice daily; EX2QW, exenatide 2 mg once weekly; EX5BID, exenatide 5 μg twice daily; LIR0.6QD, liraglutide 0.6 mg once daily; LIR1.2QD, liraglutide 1.2 mg once daily; LIR1.8QD, liraglutide 1.8 mg once daily; LIX20BID, lixisenatide 20 μg twice daily; LIX20QD, lixisenatide 20 μg once daily; LIX30BID, lixisenatide 30 μg twice daily; LIX30QD, lixisenatide 30 μg once daily; LY0.5/1.0, LY2189265 0.5 mg once weekly for 4 weeks, then 1.0 mg once weekly for 12 weeks; LY1.0/1.0, 1.0 mg once weekly for 16 weeks; LY1.0/2.0, 1.0 mg once weekly for 4 weeks, then 2.0 mg once weekly for 12 weeks; Met, metformin; SU, sulfonylureas; SUCRA, surface under the cumulative ranking curve; TAS20Q2W, taspoglutide 20 mg once biweekly; TAS20QW, taspoglutide 20 mg once weekly; TAS30QW, taspoglutide 30 mg once weekly; TZD, thiazolidinedione.
Model fit and inconsistency check
The model fit can be evaluated using the posterior mean of the residual deviance. The values for nausea, vomiting, and diarrhea were 134.13, 124.84, and 106.99, respectively, closing to the data points (168, 161, and 151) and meaning that model's overall fit is satisfactory. 19 That most loops (nausea, 78.18%; vomiting, 83.19%; and diarrhea, 63.96%) were consistent means the summary estimates of network meta-analysis are relatively convincing (Supplementary Fig. S5).
Discussion
Diabetes patients with poor glycemic control or long duration of disease often have impaired gastric motility. 21 –24 Also, delayed gastric emptying will lead to gastrointestinal symptoms, such as early satiety, postprandial fullness, epigastric pain, nausea, and vomiting. 21 –26 Although these GI symptoms are not considered to be important causes of mortality in T2DM, they have obvious negative influences on diabetes control, diabetes complications, and health-related quality of life. 23,27,28
In our study, both TAS30QW (nausea, 83.20%; vomiting, 88.52%) and LIX30BID (diarrhea, 84.76%) had higher risk for GI AEs when compared with placebo. Our results were similar to previous studies, which reported that GLP-1 RAs have a significant effect on GI AEs compared with other treatments for patients with T2DM. 11,29 –31 Two double-blind placebo-controlled studies showed the highest dose of TAS (20 mg once weekly) was associated with higher incidences of nausea (52% and 31%) and vomiting (22% and 17.8%) than placebo. 32,33 Dose–response studies showed a dose-dependent increase of nausea from EX5BID (range, 3–39%) to EX10 BID (range, 13–51%) and an increase of GI AEs from LIR0.6QD to LIR1.2QD to LIR1.8QD. 34 –40 According to the results obtained, we found that patients treated with high doses of EX had a higher risk of developing nausea than those treated with low doses of it. In addition, our study indicated the incidence of GI AEs was different with diverse dose regimens of GLP-1 RAs. There are 12 separate pairwise comparisons of the various treatments of GLP-1 RAs on GI AEs in our study. Some reports showed the incidence of nausea (28% with EX vs. 25.5% with LIR) and vomiting (9.9% with EX vs. 6.0% with LIR) in patients with EX were higher than in patients with LIR. 41,42 However, little direct evidence exists about the difference among GLP-1 RAs in effects on GI AEs, and there is still a lack of convincing evidence on how these new GLP-1 RAs (Albi, TAS, and LIX) have more risk on GI AEs than EX and LIR.
The results of the present article are accurate and reliable for multiple reasons. First, we performed an extensive literature search. Trial selection and data extraction were done independently by two authors to minimize bias and transcription errors. Second, our study is the largest evaluation of GLP-1 RAs on GI AEs to date and includes the newest GLP-1 RAs, such as TAS, Albi, LIX, and LY. Third, the network technique allows dissection of the individual drug to evaluate GI AEs, especially when faced with very few RCTs that directly compare GLP-1 RA drugs in T2DM. We applied a mixed model to explore the effect of indirect comparison, which is thought to be the most appropriate method for multiple-treatments network meta-analysis. 16,43 Additionally, goodness of our model fit was relatively satisfactory, and posterior probability on some specific outcome of the Bayesian model can be used to rank different treatments directly.
There are still some limitations in this analysis. First, we only included three disorders of gastrointestinal event. Second, owing to limited data, some significant results of pairwise comparison among new GLP-1 RAs (Albi, TAS, LIX, and LY) only were supplied by indirect comparisons, especially when they were shown with wider CI. Lastly, because of the lack of investigation about the distribution of clinical and methodological variables, we suspected there might be potential sources of either heterogeneity or inconsistency in every comparison-specific group of trials.
In conclusion, our study found all dose regimens of GLP-1 RAs significantly increased the incidence of GI AEs, compared with placebo or conventional treatment. The occurrence of GI AEs was different with diverse dose regimens of GLP-1 RAs. TAS30QW had the maximum probability to occur nausea and vomiting, whereas LIX30BID had the maximum probability to develop diarrhea than any other treatments. With similar hypoglycemic effect, our results may be helpful for clinicians in choosing GLP-1 RAs with fewer gastrointestinal side effects for T2DM.
Footnotes
Acknowledgments
We are grateful to all cooperating organizations and their staff. Special thanks to all of the original study authors who promptly and graciously responded to our requests for information. This study is funded by the National Natural Science Foundation of China (grants 81302508, 81370152, and 81228001), the Beijing Natural Science Foundation (grant 7142027), the Research Fund for the Doctoral Program of Higher Education (grant 20120001110015), and the Doctoral Fund of Corps (grant 2010JC15).
Author Disclosure Statement
No competing financial interests exist.
References
Supplementary Material
Please find the following supplemental material available below.
For Open Access articles published under a Creative Commons License, all supplemental material carries the same license as the article it is associated with.
For non-Open Access articles published, all supplemental material carries a non-exclusive license, and permission requests for re-use of supplemental material or any part of supplemental material shall be sent directly to the copyright owner as specified in the copyright notice associated with the article.