
Abstract
Background:
This study investigated the impact of age on the accuracy of glycated hemoglobin (HbA1c) for diabetes screening and explored the possible cause(s).
Materials and Methods:
Data from 3,050 Chinese participants 25–75 years of age without known diabetes in a population-based cross-sectional survey were analyzed. Diabetes was diagnosed by the oral glucose tolerance test (OGTT). The performance of HbA1c for detecting OGTT-defined diabetes in tertile groups (divided by age) was evaluated by the area under the curve (AUC) of the receiver operating characteristic curve (ROC). The effect of age on the difference in glucose levels between participants with and without diabetes and the impact of this difference on the performance of HbA1c were evaluated.
Results:
In young (25–41 years old), middle-aged (41–53 years old), and old (55–72 years old) participants, the ROC AUC (95% confidence interval) of HbA1c for detecting OGTT-defined diabetes was 0.958 (0.915, 1.000), 0.891 (0.852, 0.930), and 0.861 (0.821, 0.901), respectively (P = 0.005). The difference of fasting plasma glucose between participants with diabetes and those without diabetes decreased with increasing age: 3.01 (2.80, 3.22) mmol/L, 2.90 (2.71, 3.09) mmol/L, and 2.33 (2.16, 2.50) mmol/L in the three consecutive age groups, respectively. A similar pattern was found in 2-h postprandial plasma glucose. The impact of age on the diagnostic power of HbA1c diminished after data were rearranged to artificially increase the difference between participants without diabetes and those with diabetes.
Conclusions:
The accuracy of HbA1c for detecting OGTT-defined diabetes declines with age. This is largely due to the decreased separation in glycemic levels between participants with diabetes and without diabetes in the elderly.
Background
T
The performance of HbA1c in diabetes screening can be affected by some factors such as ethnicity and age. 8,9 It was recently reported that the screening accuracy of HbA1c in detecting OGTT-defined diabetes is decreased in the elderly. 6,7,9 The mechanism of this reduction remains unclear. 7,9 HbA1c per se can be affected by mean glucose level, 10 age, 11 and other factors such as ethnicity, 12,13 anemia, 14 red blood cell life span, 15 severe chronic kidney disease, 16 and smoking. 17 Among these factors, glucose is the major determinant of HbA1c level in participants with diabetes but not in participants without diabetes. 18,19 Advanced age is associated with elevated plasma glucose and HbA1c levels in participants without diabetes, 11,13 as well as increased prevalence of diabetes 20 and prediabetes. 21
The goal of this study was to assess the effect of age on the screening accuracy of HbA1c in detecting OGTT-defined diabetes in a Chinese population and to explore the mechanism of such an effect if it was found to exist. Because glucose is the major determinant of HbA1c level, we hypothesized that the spectrum of glucose contributed to the different performance of HbA1c in detecting OGTT-defined diabetes between aged and younger age populations.
Research Design and Methods
A cross-sectional population-based survey for diabetes and metabolic syndrome was conducted in the Pinggu district of Beijing, China, from March 2012 to May 2013. Participants were recruited using a stratified random two-stage cluster sampling process according to sex and age. At the first stage of sampling, five rural towns and one street were first randomly selected. Five villages and seven neighborhood communities were then randomly drawn from each selected rural town and the street. In total, 5,004 individuals who had lived in their registered address for more than 5 years were invited, and 3,350 accepted. The overall response rates were 66.9% (75.4% for residents living in rural towns and 58.4% for those with an address on the street), with 64.1% for males and 69.7% for females.
Seven participants with missing data on age and sex, five with missing data on OGTT results, and 207 participants with previously diagnosed diabetes were excluded. To diminish the effect of anemia and end-stage chronic kidney disease on HbA1c, we further excluded 78 participants with anemia (six men who had a hemoglobin level of <120 g/L and 72 women who had a hemoglobin level of <110 g/L) and three with a plasma creatine level of >133 μmol/L. Finally, 3,050 individuals (1,476 male and 1,574 female) were included in the current data analysis. The study was approved by the ethics committee of Peking University People's Hospital. All participants gave written informed consent before participation (Supplementary Fig. S1; Supplementary Data are available online at
Height and weight were measured using a height–weight scale that had been calibrated before use with subjects standing with bare feet and in light clothing. Waist circumference was measured using a tape at the midpoint between the lower rib margin and the iliac crest. Body mass index was calculated as weight divided by height squared (in kg/m2). Systolic and diastolic blood pressure (in mm Hg) was measured three times after a 10-min rest, and the mean of the three measures was used in the data analysis. Education was divided into a group with college education or higher and a group with lower than college education according to the highest degree of participants. Smoking status was divided into a group of current smokers who were smoking every day and a group of nonsmokers consisting of former smokers, smoking now and then (occasionally), and not smoking participants.
The OGTT was conducted after an overnight fast. Participants were administered orally 75 g of anhydrous glucose dissolved in 250 mL of water. Blood samples were collected before and 2 h after glucose ingestion. The samples were collected in a tube containing sodium fluoride and were processed within 60 min of collection. Plasma glucose was measured by hexokinase method. HbA1c was quantified by the high-performance liquid chromatography method (model ADAMS A1c HA-8160 chromatograph; Arkray, Inc., Kyoto, Japan), which was Diabetes Control and Complications Trial aligned. The International Federation of Clinical Chemistry value was calculated according to the National Glycohemoglobin Standardization Program value. The intra-assay coefficient of variation was 0.78%. The inter-assay coefficient of variation was 1.31% at a mean value of 4.74% and 1.37% at a mean value of 9.12%. Glycated albumin (GA) was measured by an enzymatic method (Lucica@ GA-L kit; Asahi Kasei Pharma, Tokyo, Japan). The intra-assay coefficient of variation was 3.1%. The inter-assay coefficient of variation was 3.8% at a mean value of 15.5% and 2.9% at a mean value of 33.1%. Fasting levels of serum creatine, total cholesterol, triglycerides, high-density lipoprotein cholesterol, and low-density lipoprotein cholesterol were measured using an automated biochemical instrument (model Coulter UniCel DxC 800; Beckman, Miami, FL). Hemoglobin was measured using an automated hematological analyzer (model BC-6800; Mindray, Shenzhen, China).
Previously diagnosed diabetes was defined by self-report of a diabetes history and/or information of current hypoglycemia treatments. According to the World Health Organization diagnostic criteria in 1999, 2 diabetes was defined as fasting plasma glucose (FPG) level of ≥7.0 mmol/L and/or 2-h postprandial plasma (2-h PG) level of ≥11.1 mmol/L.
Statistical analysis
Statistical analysis was performed using SPSS for Windows version 19.0 software (SPSS Inc., Chicago, IL) and Stata version 12 software (StataCorp, College Station, TX). Continuous variables were presented as mean (95% confidence interval [CI]) values, and categorical data were given as number (%). Difference in means between groups was tested using one-way analysis of variance. The χ2 test was used to test the difference between frequencies. The diagnostic accuracy of HbA1c in detecting OGTT-defined diabetes was assessed by the curve of receiver operating characteristic curve (ROC), and the area under the curve (AUC) of ROCs in different age groups was compared using C statistics. The optimal cutoff point of HbA1c for detecting diabetes diagnosed by the OGTT was determined by the Youden Index, which was calculated as (maximum sensitivity + specificity) −1. Positive predictive value is the proportion of true-positive results in all positive results, which was calculated as true-positives/(true-positives + false-positives). Negative predictive value is the proportion of true-negative results in all negative results, which was calculated as true negatives/(true-negatives + false-negatives). 22 The effects of disease (diabetes or nondiabetes), age groups, and their interaction term on glycemic parameters were analyzed by two-way analysis of variance.
Results
Of participants without previously diagnosed diabetes, 10.2% could be classified having diabetes based on OGTT-based diabetes diagnostic criteria in this study population. Participants with diabetes were on average 4.8 years older than participants without diabetes (P < 0.001). Compared with participants without diabetes, FPG and 2-h PG were on average 2.6 mmol/L (P < 0.001) and 8.1 mmol/L higher (P < 0.001) in participants with diabetes, respectively. Higher HbA1c, GA, waist circumference, body mass index, blood pressure, total cholesterol, low-density lipoprotein cholesterol, and triglyceride levels and lower high-density lipoprotein cholesterol level were found in participants with diabetes than in participants without diabetes (Table 1).
Characteristics of participants with and without diabetes who were divided into age tertiles are presented. Data are expressed as mean (95% confidence interval), which were calculated by one-way analysis of variance after adjusting for sex (or sex only if applicable) for continuous data or n (%) for categorical data unless specified otherwise.
Significance of categorical data among the three age groups was tested by χ2 test and one-way analysis of variance: a P < 0.05, b P < 0.01, c P < 0.001. Significance of differences between groups without and with diabetes was analyzed by χ2 test for categorical data or one-way analysis of variance for continuous data: d P < 0.05, e P < 0.01, f P < 0.001.
With missing value.
Geometric mean.
2-h PG, 2 h after load plasma glucose; BMI, body mass index; FPG, fasting plasma glucose; GA, glycated albumin, HbA1c, glycated hemoglobin; HDL-C, high-density lipoprotein cholesterol; LDL-C, low-density lipoprotein cholesterol.
Participants were divided into tertile groups based on age. Young people were defined as participants in the lowest tertile (25–41 years of age), middle-aged people were defined as participants in the middle tertile (42–53 years of age), and old people were defined as participants in the highest tertile (54–75 years of age). In participants without diabetes, the proportion of participants with prediabetes was significant higher in aged participants than in younger people (14.8% vs. 25.2% vs. 37.5% in the three consecutive age groups; P < 0.001). Among participants without diabetes, blood pressure and FPG, 2-h PG, HbA1c, GA, and cholesterol levels rose with increasing age. In participants with diabetes, FPG, 2-h PG, HbA1c, GA, and cholesterol levels and blood pressure showed no statistically significant difference among the three age groups (Table 1).
The ROC AUC (95% CI) of HbA1c for detecting glucose-defined diabetes in all individuals was 0.900 (0.873, 0.932). Compared with young participants, the diagnostic accuracy for detecting diabetes with HbA1c was reduced in middle-aged and old people (the ROC AUC was 0.958 [0.915, 1.000], 0.891 [0.852, 0.930], and 0.861 [0.821, 0.901] in young, middle-aged, and old people, respectively; P = 0.005) (Fig. 1A). The optimal cutoff value of HbA1c was 5.8% (40 mmol/mol), 5.8% (40 mmol/mol), and 6.0% (42 mmol/mol) in the three consecutive age groups, respectively. At the optimal cutoff points, the sensitivity of HbA1c for detecting OGTT-defined diabetes decreased substantially with increasing age, and the specificity was the highest in young people (Table 2).
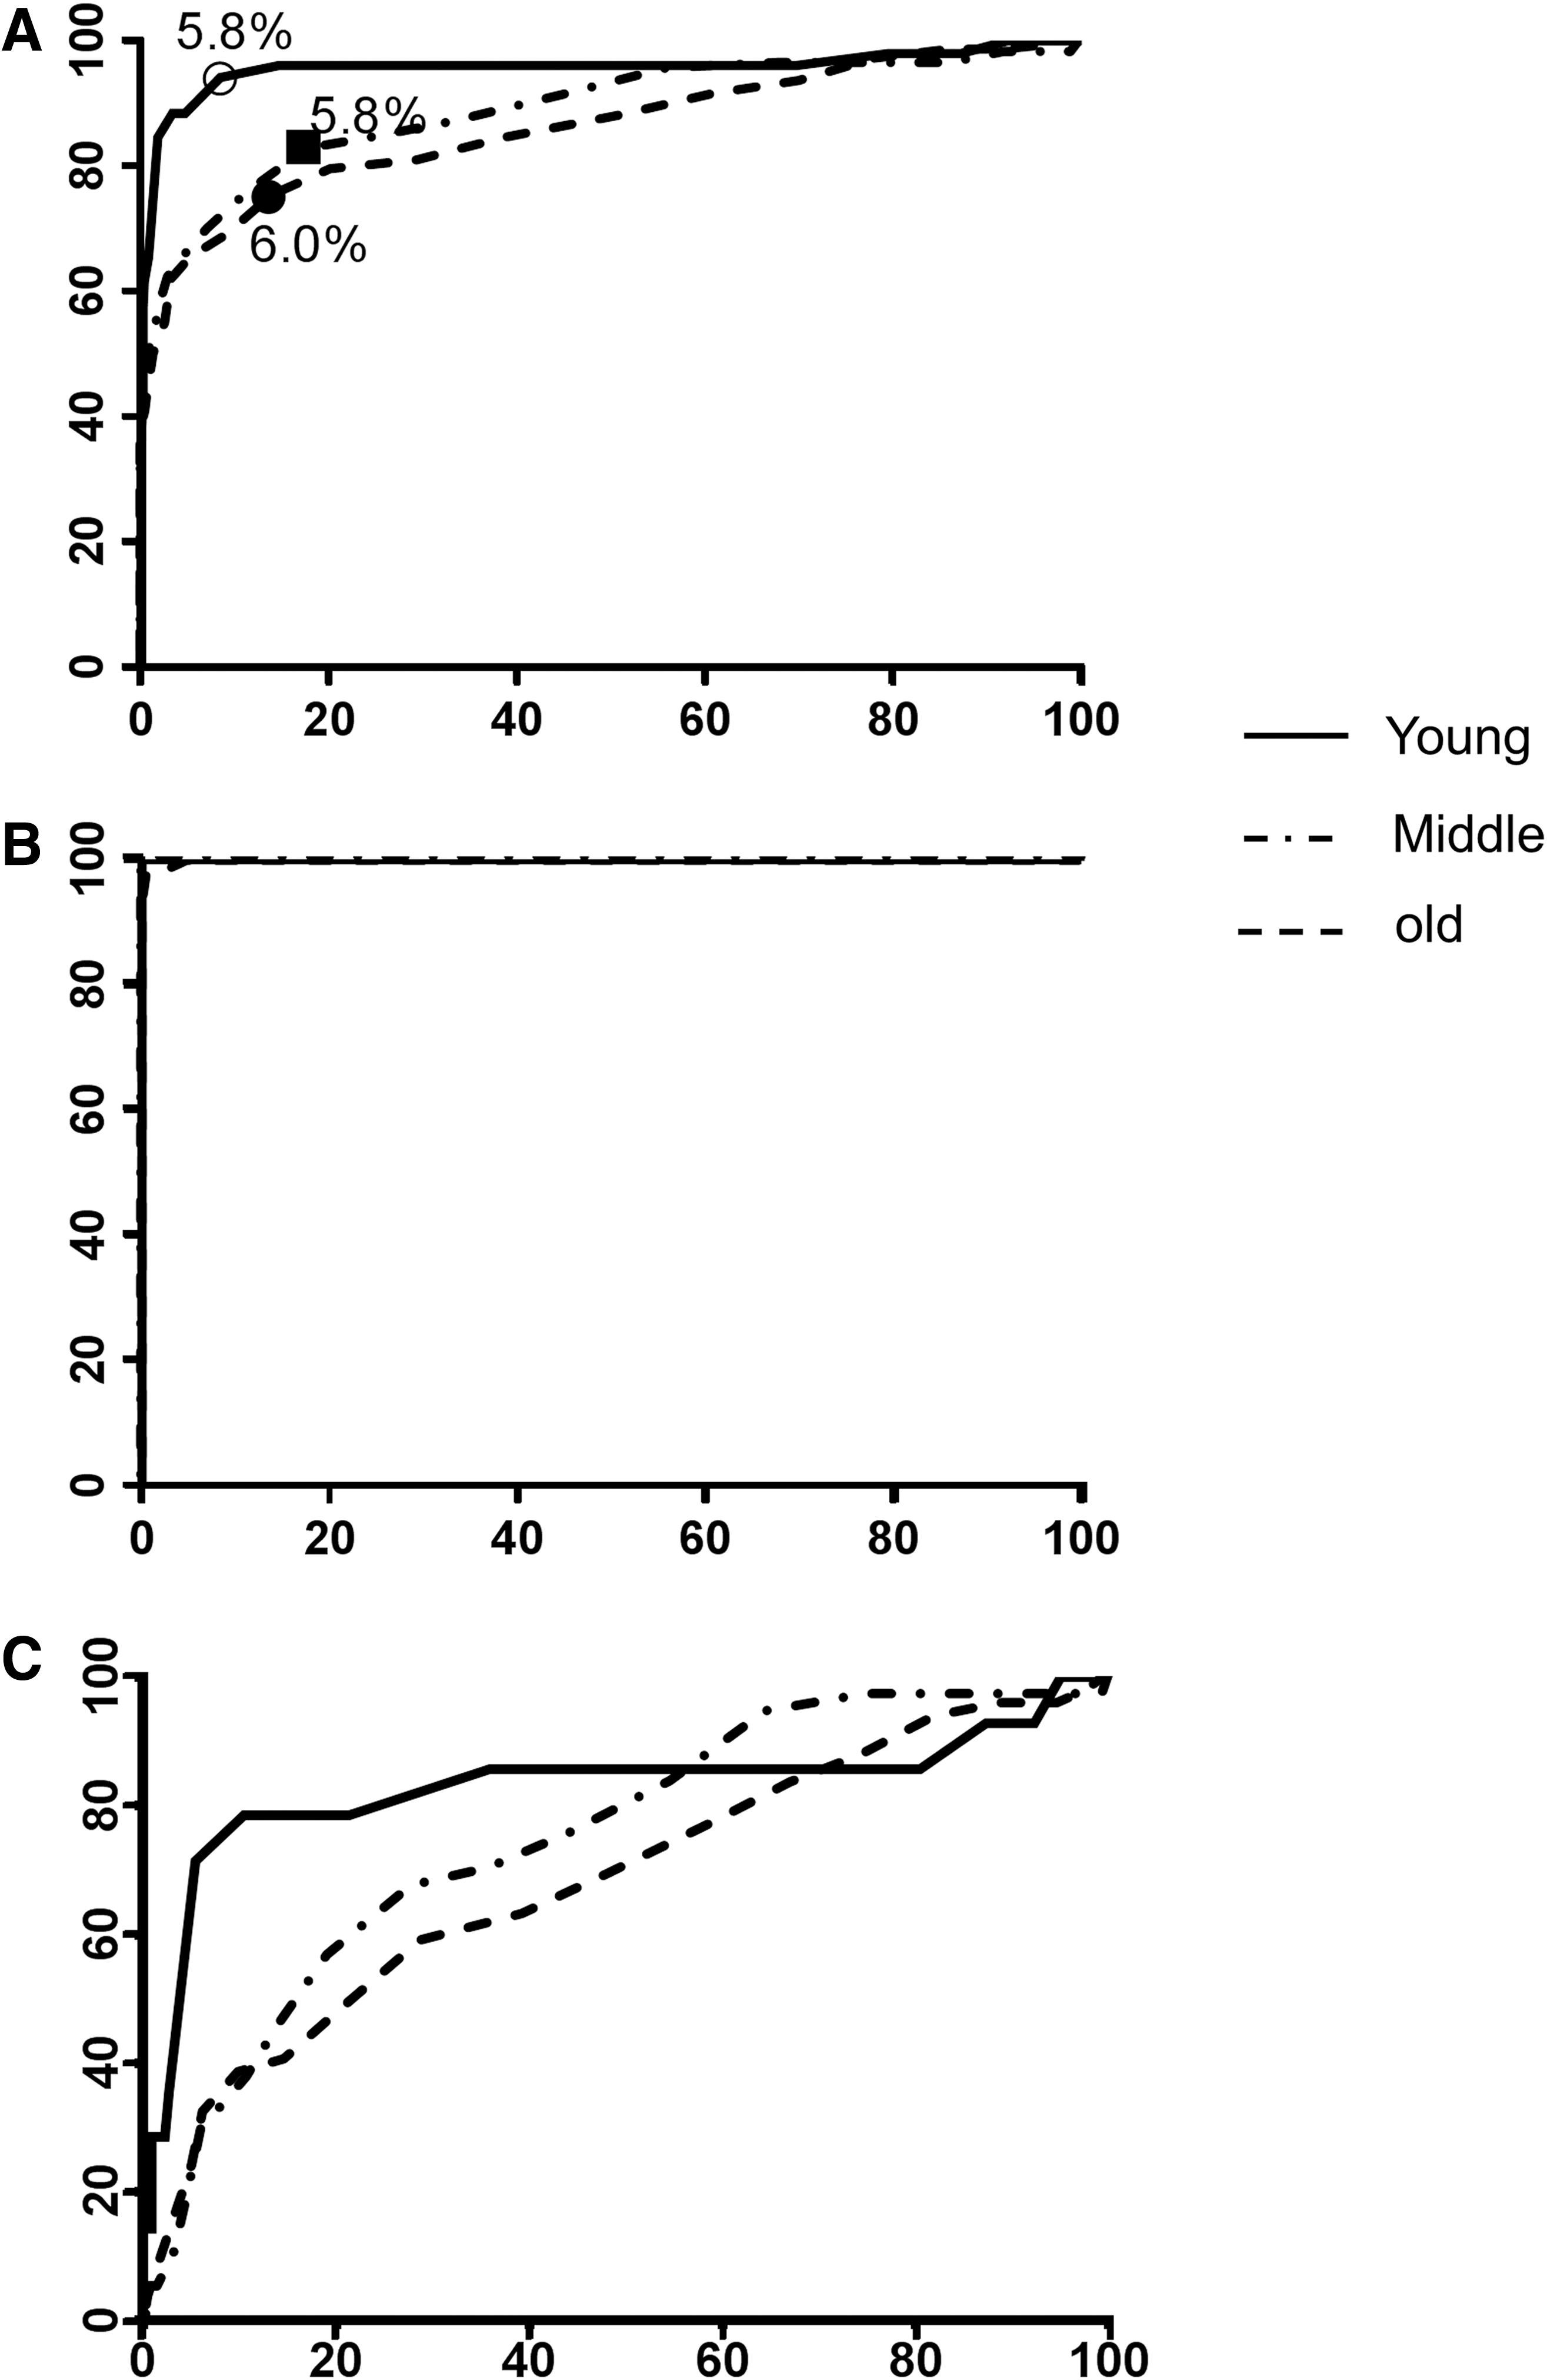
Receiver operating characteristic curves for hemoglobin A1c to detect the presence of glucose-defined diabetes in young (25–41 years), middle-aged (42–53 years), and old (54–75 years) participants.
The glycated hemoglobin (HbA1c) cutoff value was determined by the Youden Index.
CI, confidence interval; NPV, negative predictive value; PPV, positive predictive value.
In all study subjects, two-way analysis of variance showed there were significant differences in FPG (P = 0.004) and 2-h PG (P = 0.006) between subjects without and with diabetes. FPG (P = 0.859) and 2-h PG (P = 0.813) levels were not significantly different among the three age groups. However, the difference between FPG and 2-h PG of individuals without and with diabetes was affected by age (P < 0.001 for the interaction term of age × disease [Supplementary Table S1]). The difference in FPG between individuals with and without diabetes was 3.0 (2.8, 3.2) mmol/L, 2.9 (2.7, 3.1) mmol/L, and 2.3 (2.1, 2.5) mmol/L in young, middle-aged, and old people, respectively. There was also an age-dependent decrease in the difference of 2-h PG between individuals with and without diabetes: 8.8 (8.3, 9.4) mmol/L, 8.5 (8.0, 8.9) mmol/L, and 7.5 (7.0, 7.9) mmol/L in the three consecutive tertile age groups. Similar patterns can be found in GA and HbA1c (Supplementary Fig. S2).
We hypothesize that the decreased accuracy of HbA1c for detecting OGTT-defined diabetes in aged individuals is associated with a narrowed difference between glucose level of individuals without and with diabetes in aged groups. To test this hypothesis, we artificially rearranged the data.
First, we calculated the mean plasma glucose level of each individual, which is the mean of FPG and 2-h PG, and divided individuals into groups without and with diabetes into tertiles according to the mean plasma glucose.
Second, we artificially formed a “large difference group” by combining the highest tertile from the diabetes group and the lowest tertile from the group without diabetes, as well as a “small difference group” by combining the highest tertile group from the group without diabetes and the lowest tertile group from the group with diabetes.
Finally, we divided the “large difference group” and the “small difference group” into young people (25–41 years of age), middle-aged people (42–53 years of age), and old people (54–75 years of age) as we did previously. As expected, the difference of glycemic levels (Δ FPG and Δ 2-h PG) in the large difference group was significantly higher than in the small difference group. The large difference group had decreased average age, FPG, 2-h PG, GA, and prediabetes prevalence compared with the small difference group. The ROC AUC of HbA1c for detecting glucose-defined diabetes in the “large difference group” and the “small difference group” was 1.000 (0.999, 1.000) and 0.734 (0.679, 0.790), respectively (P < 0.001) (Supplementary Fig. S3). In the “large difference group” the ROC AUC was 1.000 (1.000, 1.000), 1.000 (1.000, 1.000), and 0.999 (0.998, 1.000) in young, middle-aged, and old participants, respectively (P = 0.408) (Fig. 1B). In the “small difference group” the ROC AUC was 0.829 (0.670, 0.988), 0.800 (0.668, 0.8318), and 0.685 (0.600, 0.770) in the three consecutive age groups (P = 0.262) (Fig. 1C).
Discussion
In this study we replicated the findings that the accuracy of HbA1c for detecting OGTT-defined diabetes was reduced in individuals with more advanced age. In participants without diabetes, there was an age-dependent increment in the levels of glucose, GA, serum lipids, and blood pressure, but this increment vanished in participants with diabetes. In addition, we demonstrated that the magnitudes in differences in levels of FPG, 2-h PG, GA, and HbA1c between the groups with and without diabetes were all decreased with increasing age. We provided evidence to support our hypothesis that the poor performance of HbA1c in detecting OGTT-defined diabetes in the aged group was due to the glucose spectrum change (i.e., the narrowed difference between glucose level of individuals with and without diabetes in the elderly). To our knowledge our study is the first study to provide a reasonable explanation for the poor performance of HbA1c in detecting glucose-defined diabetes in the aged group.
It was found in both Western and Asian populations 7,19 that the screening accuracy of HbA1c was reduced in populations with more advanced age. Our study further confirmed these findings in a randomly selected northern Chinese population. Age-specific optimal cutoff values for diabetes screening were proposed to achieve the best combination of sensitivity and specificity in each age category. 9 However, even at the optimal cutoff value, the sensitivity and specificity were reduced in older individuals, suggesting that using different optimal cutoff values cannot offset the impact of age on the diagnostic power of HbA1c.
Before our report, there has not been a good explanation for this age-dependent performance of HbA1c in detection of glucose-defined diabetes. Some hypothesized the association of age and HbA1c level in people without diabetes contributed to the reduced sensitivity and specificity of HbA1c-based diagnosis for diabetes, 19 but the underlying mechanism was unexplained. 19 Also, this hypothesis fails to explain why another marker of glucose, such as 1,5-anhydroglucitol, lost its screening accuracy in diabetes detection in elderly people as well. 23
Alterations of disease spectrum can lead to changes in diagnosed test accuracies. 24 For example, the ROC AUC of carcinoembryonic antigen for detecting colorectal cancer varied remarkably in different stages of the cancer. 25,26 Similarly, the diagnostic accuracy of B-type natriuretic peptide for chronic heart failure 27 and spectral-domain optical coherence tomography for glaucoma 28 were all affected by the spectrum of disease in selected populations.
Our hypothesis that the change of disease spectrum in the aged population contributes to the reduced diagnostic power of HbA1c in the elderly was confirmed by transforming the data to artificially minimize or magnify the difference between participants with diabetes and those without diabetes. After data rearrangement, the ROC AUC increased in the “large difference group” and reduced in the “small difference group,” suggesting the diagnostic power of HbA1c can be affected by the glycemic difference between those without and with diabetes in the population. More importantly, the ROC AUC of the three consecutive age groups was not significantly different in both the “large difference group” and the “small difference group,” indicating the impact of age on the diagnostic power of HbA1c is mainly mediated through the difference of glycemic level between participants with and without diabetes with the increase of age.
One strength of our study was the complete data collection. Available data on serum creatine and hemoglobin made it possible to exclude the impact of severe chronic kidney disease and anemia on HbA1c level.
There are several limitations of this study. First, the population was only recruited from one area, suggesting more nationwide studies are required to confirm our observation. Second, because of the limited number of study participants, participants were only divided into tertile groups according to age, not into 10-year categories as in other studies. 11,19 Nevertheless, although only three age groups were studied, the impact of age on the diagnostic accuracy of HbA1c was clearly shown. Third, because of data rearrangements, the sample size was largely reduced in the “large difference group” and the “small difference group,” which may lead to reduced power of the statistics test. This can be further tested in studies using more participants.
In conclusion, the diagnostic accuracy of HbA1c is reduced in detecting glucose-defined diabetes in aged individuals, and this is largely due to the decreased difference in glycemic levels between individuals with and without diabetes in this population. The reduced diagnostic accuracy should be taken into account when applying HbA1c for diabetes screening in elderly people.
Footnotes
Acknowledgments
We give our greatest gratitude to the research teams from the Endocrinology and Metabolism Departments of Beijing Pinggu Hospital and Peking University People's Hospital for their contribution to field survey and data collection. We thank Hechao Li, MD, for his work for this article. Data collection and analysis were supported by the following grants: National Key Technologies R&D Program of China (2009BAI80B02), National High-technology Research and Development Program of China (863 Program 2012AA02A509), National Key Basic Research Program of China (973 Program 2011CB504000), Beijing Science and Technology Committee Funding (D131100005313008), and Beijing Municipal Science and Technology Commission (D12110700440000 and D121100004412002).
Author Disclosure Statement
No competing financial interests exist.
References
Supplementary Material
Please find the following supplemental material available below.
For Open Access articles published under a Creative Commons License, all supplemental material carries the same license as the article it is associated with.
For non-Open Access articles published, all supplemental material carries a non-exclusive license, and permission requests for re-use of supplemental material or any part of supplemental material shall be sent directly to the copyright owner as specified in the copyright notice associated with the article.