
Abstract
Background:
The objective of this study was to determine the risk factors of hypoglycemia by evaluating the glycemic profile using continuous glucose monitoring (CGM) in patients with type 2 diabetes mellitus (T2DM).
Methods:
The participants were 294 patients with T2DM who received inpatient diabetes education. The mean blood glucose (MBG), coefficient of variation (CV), mean postprandial glucose excursion, low blood glucose index (LBGI), and percentage of time with blood glucose (BG) at <70 mg/dL were measured on admission using CGM. We predicted the risk of hypoglycemia utilizing transform to Gaussian model. The primary end point was the relationship between CGM parameters and hypoglycemia.
Results:
Multivariate logistic regression analysis showed that disease duration, MBG, CV, LBGI, and Predicted% of BG correlated significantly with hypoglycemia. Receiver operating characteristic curve analysis showed that the optimal cutoff points for MBG and CV in predicting hypoglycemia were 152 mg/dL and 22%, respectively. The proportion of patients with hypoglycemia was 0% for the group with no hypoglycemia risk factors, 4.2% for the group with one risk factor, and 36.6% for the group with two risk factors, showing a linear increase across the groups (P < 0.001). LBGI was the best predictor of hypoglycemia; and Predicted% BG <70 mg/dL was very useful as an index to predict hypoglycemia.
Conclusions:
Patients with low MBG levels and large fluctuations in BG were more likely to develop hypoglycemia, suggesting that assessment of these two variables is useful for the prediction of hypoglycemia. To achieve good glycemic control free of hypoglycemia, approaches are needed that do not only lower BG level but also minimize fluctuations in blood and interstitial fluid glucose level.
Introduction
M
It is recognized that patients with low mean blood glucose (MBG) level are at risk of hypoglycemia. Previous studies utilizing self-monitoring blood glucose (SMBG) concluded that blood glucose (BG) fluctuation could be used to predict hypoglycemia. 14,15 However, fewer studies have examined this relationship in detail through the use of a continuous glucose monitoring (CGM) system, and thus, the parameters of BG fluctuation that can be considered as predictors of hypoglycemia remain to be clarified. The present study investigated the relationship between glycemic profile and hyperglycemia using CGM in patients with type 2 diabetes mellitus (T2DM) who received inpatient diabetes education.
Methods
Subjects
The study participants were 294 patients with T2DM who were admitted to the Hospital of the University of Occupational and Environmental Health or Wakamatsu Hospital of the University of Occupational and Environmental Health between April 2010 and June 2015 and underwent assessment of glycemic profile using a CGM system (CGMS® System Gold™ or iPro2; Medtronic MiniMed, Inc.), for at least 2 days, within 1 week of hospital admission. The following inclusion criteria were applied in this study: (1) BG level at admission of <300 mg/dL, (2) no diabetic ketosis or nonketotic hyperosmolar coma, and (3) absence of cardiac arrhythmia. Patients with infectious diseases, acute coronary syndrome, anemia, and/or using erythropoiesis-stimulating agents were also excluded from the study. This study does not include patients with T1D.
The study protocol was approved by the Ethics Committee of the University of Occupational and Environmental Health and those of the participating medical centers. Informed consent was obtained from all study participants.
Diabetic nephropathy was graded based on the urinary albumin excretion rate [expressed by the albumin-to-creatinine ratio (mg/g creatinine)] 16 and defined as an albumin-to-creatinine ratio of ≥30 mg/g creatinine. Diabetic retinopathy was defined as simple or severe based on funduscopic examination carried out by expert ophthalmologists. Diabetic neuropathy was diagnosed by the presence of two or more of the following clinical features, bilateral spontaneous pain, hypoesthesia, paresthesia of the legs, absence of ankle tendon reflexes, and decreased vibration sensations using a C128 tuning fork.
CGM system
Previous studies indicated that interstitial glucose concentrations measured by CGM correlate with venous BG levels. 17 The MBG, standard deviation (SD), coefficient of variation (CV), mean postprandial glucose excursion (MPPGE), percentage of time ≥180 mg/dL, percentage of time <70 mg/dL, and minimum and maximum glucose levels were extracted from the data recorded through CGM. The CGM system used in this study required calibration four times a day. BG levels were determined before each meal and at bedtime using the SMBG device (MEDISAFE® MINI; Terumo, Inc.).
MPPGE was calculated as the arithmetic mean of the differences between the postprandial peak glucose values and the corresponding preprandial glucose values for meals. We evaluated preprandial time as 7:30, 12:00, and 18:00 and postprandial period as 7:30–12:00 (breakfast), 12:00–18:00 (lunch), and 18:00–24:00 (dinner).
An episode of hypoglycemia on CGM was defined as a sensor glucose <70 mg/dL for at least 5 min. Duration of hypoglycemia in this study was defined as time of hypoglycemia per 24 h of CGM recording. Incidence of hypoglycemia was defined as episode of hypoglycemia per 24 h.
The formula of low blood glucose index (LBGI) and high blood glucose index (HBGI) is implemented by converting glucose values into risk score. 18 Previous studies demonstrated that this index can be used to predict severe hypoglycemia. 19 Continuous overlapping net glycemic action is calculated by determining the difference between values at different set intervals (CONGA 1). 20
Area under the curve below limit (AUC-L) provides a relative indication of the overall extent and duration of low glucose excursions over the day. AUC-L was calculated by MMT-7340 (CareLink iPro software). AUC-L [mg/(dL·d)] = (∑| sensor glucose—70 mg/dL|/(288) (if sensor glucose <70).
Because the CGMS System Gold and iPro2 have insufficient stability within 12 h after its placement, the data after 12 h were used to avoid bias related to CGM placement or insufficient stability of the monitoring system. We analyzed 24 h data of CGM. The EasyGV (available free for noncommercial use at
Since BG levels of any population generally show skewed distribution, Rodbard
22
recommended the conversion of BG levels to the natural logarithm before assessment of the risk of hypoglycemia. In the present study, BG levels were converted to the natural logarithm of G′ = log10 (glucose = 30 mg/dL) before statistical analysis. After achieving a Gaussian or nearly Gaussian distribution for glucose, it becomes possible to estimate the percentage of observations that fall below 70 mg/dL. The calculation can be performed using an instruction in Microsoft® (Redmond, WA) Excel.
22
Predicted% of BG <70 mg/dL is given by
All patients received optimal meals (25 kcal/kg of ideal body weight; 60% carbohydrate, 15%–20% protein, and 20%–25% fat) during CGM.
Laboratory tests
Glycated hemoglobin (HbA1c; %) was measured with a high-performance liquid chromatography method using the Tosoh HLC-723 G8 (Tosoh Co., Kyoto, Japan). HbA1c level was expressed as the National Glycohemoglobin Standardization Program value by adding 0.4% to the HbA1c level expressed as the conventional Japanese standard substance value (Japanese Diabetes Society value). 23 The estimated glomerular filtration rate (eGFR) was calculated using the following formula. The eGFR was calculated using the following formula for evaluation according to the guidelines prescribed by the Japanese Society of Nephrology 24 : 194 × serum creatinine level (mg/dL)−1.094 × age−0.287 for men and 194 × serum creatinine level (mg/dL)−1.094 × age−0.287 × 0.739 for women.
Data handling and statistical analyses
Data are expressed as mean ± SD. Data distribution was checked using the Shapiro–Wilk test. For statistical comparison of two groups, the Student's t-test was used when an equal variance was demonstrated by the F-test, while the Welch's t-test was used for parameters with unequal variance.
A multiple logistic regression model was used to calculate the odds ratios (ORs) and 95% confidence intervals (CIs) to determine the risk factors for hypoglycemia using three models. The variables represented all factors with P-value of <0.25 in the univariate analysis, after excluding the factors with multicollinearity by Spearman's correlation analysis. Model 1 was including age, gender, duration of diabetes, retinopathy, nephropathy, insulin therapy, MBG, and CV. Model 2 was including age, gender, duration of diabetes, retinopathy, nephropathy, insulin therapy, MBG, and LBGI. Model 3 was including age, gender, duration of diabetes, retinopathy, nephropathy, insulin therapy, MBG, and Predicted% BG <70 mg/dL. Patients were divided into three groups based on the number of hypoglycemia risk factors obtained from the multivariate logistic regression analysis, and the incidence and duration of hypoglycemia were calculated for each group.
Differences in the incidence of hypoglycemia were assessed using the chi-square test, and duration of hypoglycemia was assessed using the Jonckheere test. Statistical significance was set at P < 0.05. All statistical analyses were carried out using SPSS Statistics software, version 24.0 (SPSS Inc., Chicago, IL).
Results
Clinical characteristics of study participants
Table 1 summarizes the characteristics of the study patients. They comprised 294 patients with T2DM, including 177 men and 117 women, with a mean age of 62.2 ± 13.7 years. The mean HbA1c level was 8.6 ± 1.7%.
Data are mean ± SD or n (%). P-values are for differences between hypoglycemia and nonhypoglycemia groups, by the Student's t-test if variances were equal as determined by the F-test and otherwise by the Welch test.
Chi-squared test was used to determine the association between hypoglycemia and nonhypoglycemia difference.
Measured by the CGM system.
Using the log transformation. G′ = log10 (glucose +30 mg/dL).
Calculated probabilities of hypoglycemia using Equation (1).
AUC-70, area under the curve below 70 mg/dL; BG, blood glucose; CGM, continuous glucose monitoring; CONGA, continuous overlapping net glycemic action; CV, coefficient of variation; DPP4, dipeptidyl peptidase-4; eGFR, estimated glomerular filtration rate; GLP-1, glucagon-like peptide-1; HbA1c, glycated hemoglobin; HBGI, high blood glucose index; LBGI, low blood glucose index; MBG, mean blood glucose; MPPGE, mean postprandial glucose excursion; SD, standard deviation.
Of the 294 patients, 21 (7.1%) developed hypoglycemia. Patients were divided into the hypoglycemia and nonhypoglycemia groups. Patients of the hypoglycemia group were significantly longer disease duration (P = 0.003) than the nonhypoglycemia group. Both fasting BG level and HbA1c level were significantly lower in the hypoglycemia group than in the nonhypoglycemia group (P < 0.0005 for both groups). With regard to the treatment of diabetes, there were no significant differences in diet regimen or use of oral antihyperglycemic drugs between the two groups. The rate of insulin use was significantly higher in the hypoglycemia group than in the nonhypoglycemia group (P = 0.011).
CGM parameters
The MBG was significantly lower in the hypoglycemia group than in the nonhypoglycemia group (130.5 ± 19.2 mg/dL vs. 171.9 ± 44.1 mg/dL; P < 0.00007). While neither SD nor MPPGE was significantly different between the two groups, CV and LBGI were significantly higher in the hypoglycemia group (CV: 26.8 ± 6.5% vs. 20.6 ± 6.5%, P < 0.00007; LBGI: 2.6 ± 1.0 vs. 0.3 ± 0.7, P < 0.00007) (Table 1) (Fig. 1).
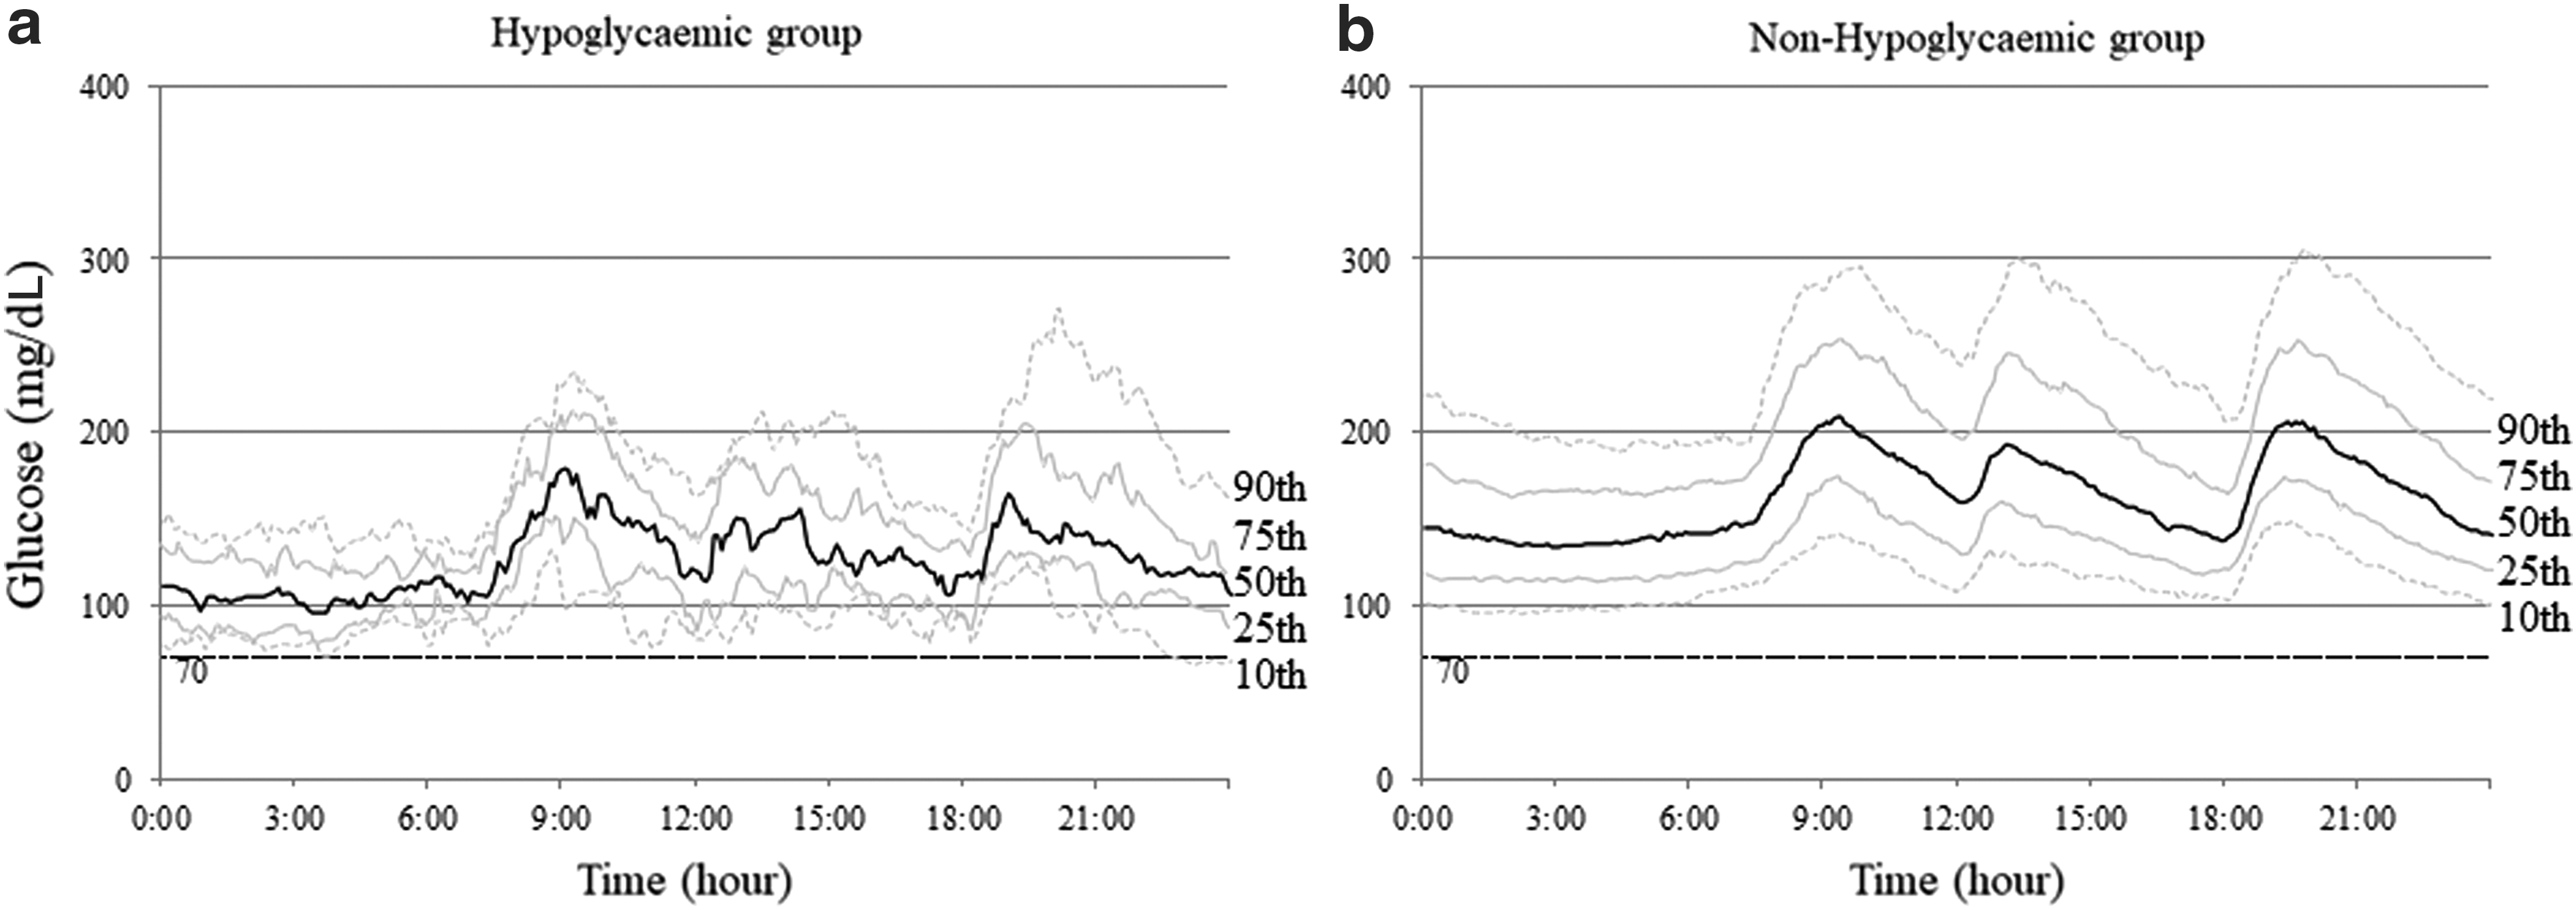
The glucose level of the patients measured by continuous glucose monitoring. The 24-h glycemic profile of 21 patients of the hypoglycemic group
The MBG′ was significantly lower (2.19 ± 0.05 vs. 2.29 ± 0.09, P < 0.00007), whereas SD′ and Predicted% BG <70 mg/dL were significantly higher (SD': 0.10 ± 0.02 vs. 0.07 ± 0.02, P < 0.0005) (Predicted% BG <70 mg/dL: 3.2 ± 2.8% vs. 0.3 ± 0.9%, P < 0.0005) in the hypoglycemia group compared with the nonhypoglycemia group.
Univariate and multivariate analyses were performed to determine the risk factors of hypoglycemia (Table 2). To evaluate predictors of hypoglycemia, we performed a multiple logistic analysis using three models. As a result of the multivariate logistic analysis, disease duration, MBG, and CV were identified in model 1 as factors that might influence hypoglycemia. The OR of hypoglycemia for 1 SD in disease duration was 2.14 (95% CI: 1.13–4.20), in MBG 0.02 (95% CI: 0.00–0.09), and in CV 4.18 (95% CI: 2.12–9.28). In model 2, disease duration, MBG, and LBGI were identified as factors that might influence hypoglycemia and the OR for 1 SD in LBGI 7.06 (95% CI: 3.52–19.23). In model 3, disease duration, MBG, and Predicted% of BG <70 mg/dL were identified as factors that might influence hypoglycemia, the OR for 1 SD in MBG 0.14 (95% CI: 0.03–0.47), and in Predicted% of BG <70 mg/dL 2.53 (95% CI: 1.60–4.20).
Only factors with P < 0.25 on univariate logistic regression. Model 1 was including age, gender, duration of diabetes, retinopathy, nephropathy, Insulin therapy, MBG, and CV. Model 2 was including age, gender, duration of diabetes, retinopathy, nephropathy, insulin therapy, MBG, and LBGI. Model 3 was including age, gender, duration of diabetes, retinopathy, nephropathy, insulin therapy, MBG, and Predicted% BG <70 mg/dL. Model chi-squared test, P < 0.001.
Measured by the CGM system.
Defined as the relative risk for each increase of 1 SD in the variable in question.
CI, confidence interval; OR, odds ratio.
A receiver operating characteristic (ROC) curve was constructed, and the area under the ROC curve and 95% CI were calculated to evaluate the effects of MBG, CV, and LBGI on hypoglycemia. The ROC curve analysis showed that the optimal cutoff point of MBG in predicting hypoglycemia was 152 mg/dL (AUC = 0.826; 95% CI: 0.753–0.900), and the optimal cutoff point of CV in predicting hypoglycemia was 22% (AUC = 0.756; 95% CI: 0.667–0.845), 0.87 (AUC = 0.971, 95% CI: 0.953–0.990) for LBGI, and 0.36% (AUC = 0.930, 95% CI: 0.892–0.968) for Predicted% of BG <70 mg/dL (Fig. 2).
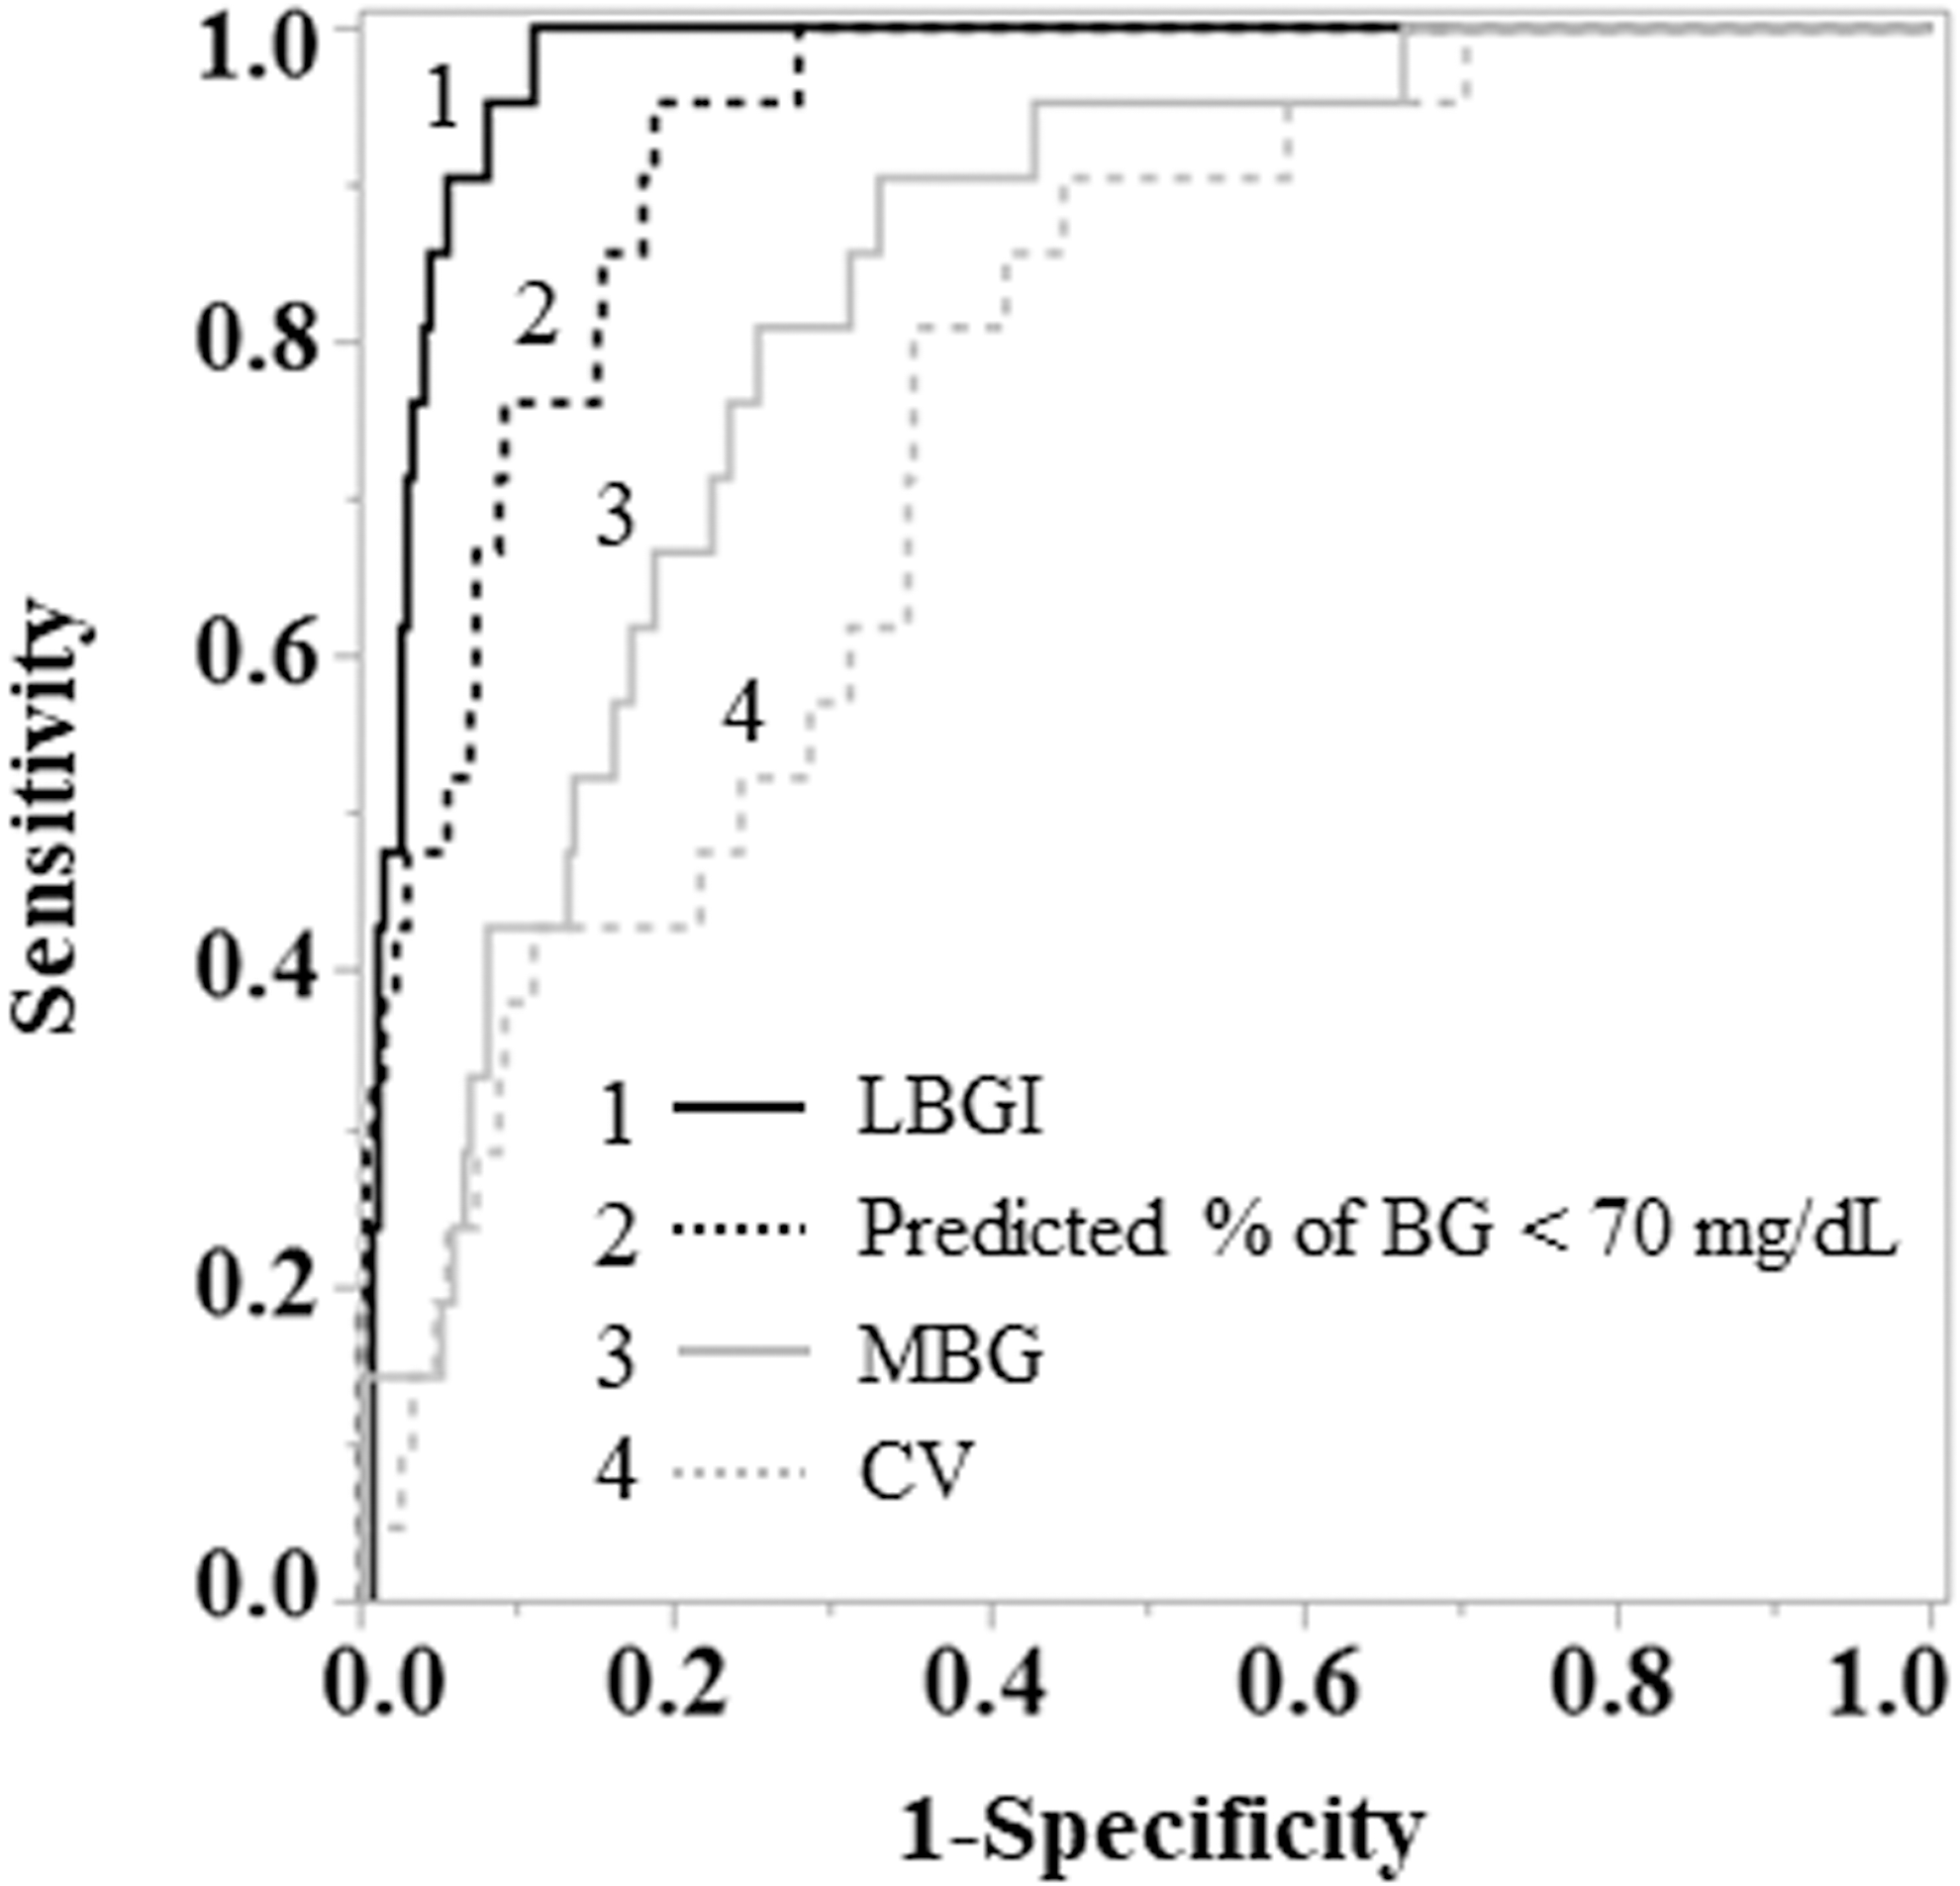
Receiver operating characteristic curves for hypoglycemia in LBGI, Predicted% of BG <70 mg/dL, and MBG and CV. LBGI: The cutoff point of 0.87 (AUC = 0.971, 95% CI: 0.953–0.990). Predicted% of BG: The cutoff point of 0.36% (AUC = 0.930, 95% CI: 0.892–0.968). MBG: The cutoff point of 152 mg/dL (AUC = 0.826; 95% CI: 0.753–0.900). CV: The cutoff point of 22% (AUC = 0.756; 95% CI: 0.667–0.845). AUC, area under the curve; BG, blood glucose; CI, confidence interval; CV, coefficient of variation; LBGI, low blood glucose index; MBG, mean blood glucose.
First, patients were divided into two groups using a CV cutoff value of 22% to assess the proportion of patients who developed hypoglycemia and the duration of such episodes (Fig. 3). Hypoglycemia was observed in only 2.2% of patients of the CV <22% group but in a significantly larger proportion (15.0%) of those with CV ≥22% (P < 0.001). We evaluated the duration of hypoglycemia, using data only from the 21 patients who had hypoglycemia, and found that the duration was 25.0 min in cases of CV <22% and 47.4 min in cases of CV ≥22%. Thus, the MBG <152 mg/dL and CV ≥22% were defined as predictors of hypoglycemia.
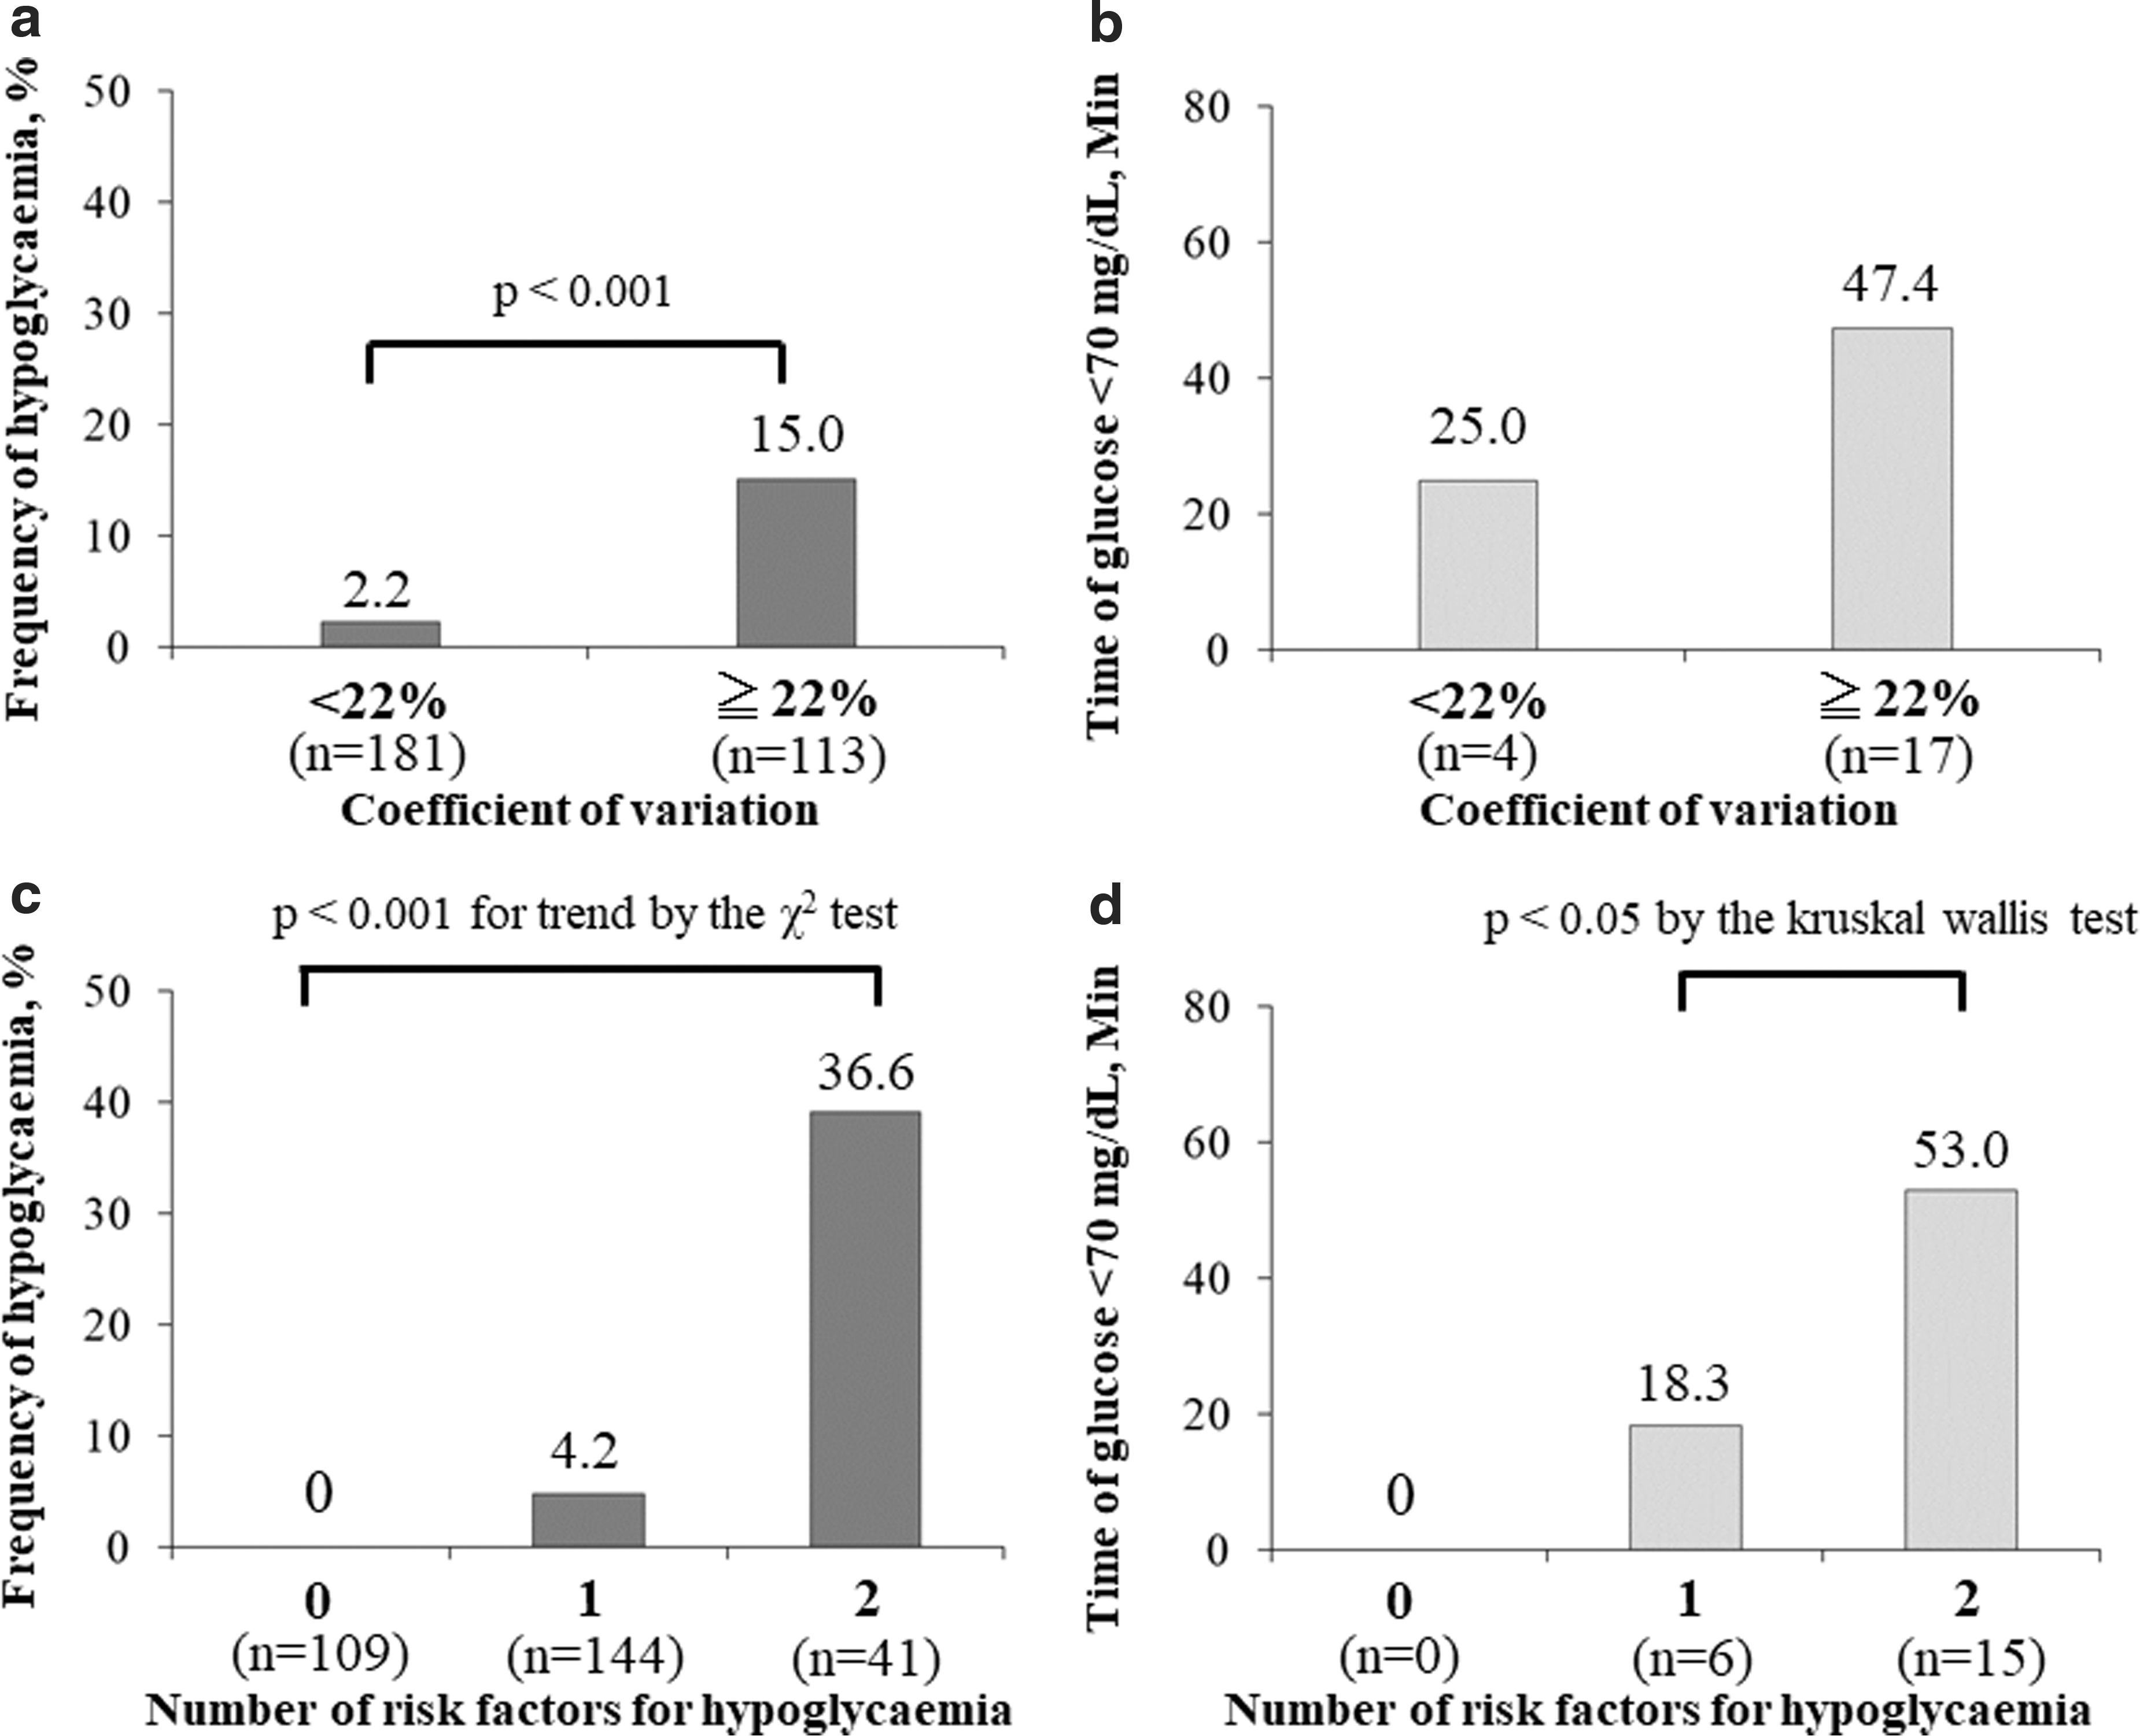
Relationship between the number of risk factors and hypoglycemia.
Based on these cutoff values, we divided the patients into three groups based on the number of hypoglycemia predictors, to analyze the differences in the incidence and duration of hypoglycemia (Fig. 3): 0 [MBG ≥152 mg/dL and CV <22% (n = 109)]; 1 [MBG <152 mg/dL or CV ≥22% (n = 144)]; and 2 [MBG <152 mg/dL and CV ≥22% (n = 41)].
The incidence of hypoglycemia was 0% for the group with none of the predictors, 4.2% for the group with a single predictor, and 36.6% for the group with two predictors, showing a linear increase across the groups (P < 0.001). The duration of hypoglycemia was 0 min for the group with none of the predictors, 18.3 min for the group with one predictor, and 53.0 min for the group with two predictors, showing a significant increase across the groups (P = 0.028). The AUC-L was 0 mg/(dL·d) in cases with 0 predictors, 0.09 mg/(dL·d) in cases with 1 predictor, and 0.25 mg/(dL·d) in cases with 2 predictors, showing a significant increase with the number of predictors (P = 0.035).
Table 3 shows the relative risk of hypoglycemia in three equal subgroups of the patient population defined according to the distributions of duration of diabetes, MBG, and CV. While CV was associated with a 13.0-fold increase in risk from the lowest to the highest tertile group, a 16.7-fold reduction in risk was observed with increasing levels of MBG.
The relative risks are shown for each of three equal groups (terciles) of subjects defined according to the units of each marker, from 1 (the group with the lowest units) to 3 (the group with the highest). The group of patients with the lowest values for each parameter serves as the reference group.
Measured by the CGM system.
Defined as the relative risk for each increase of 1 SD in the variable in question.
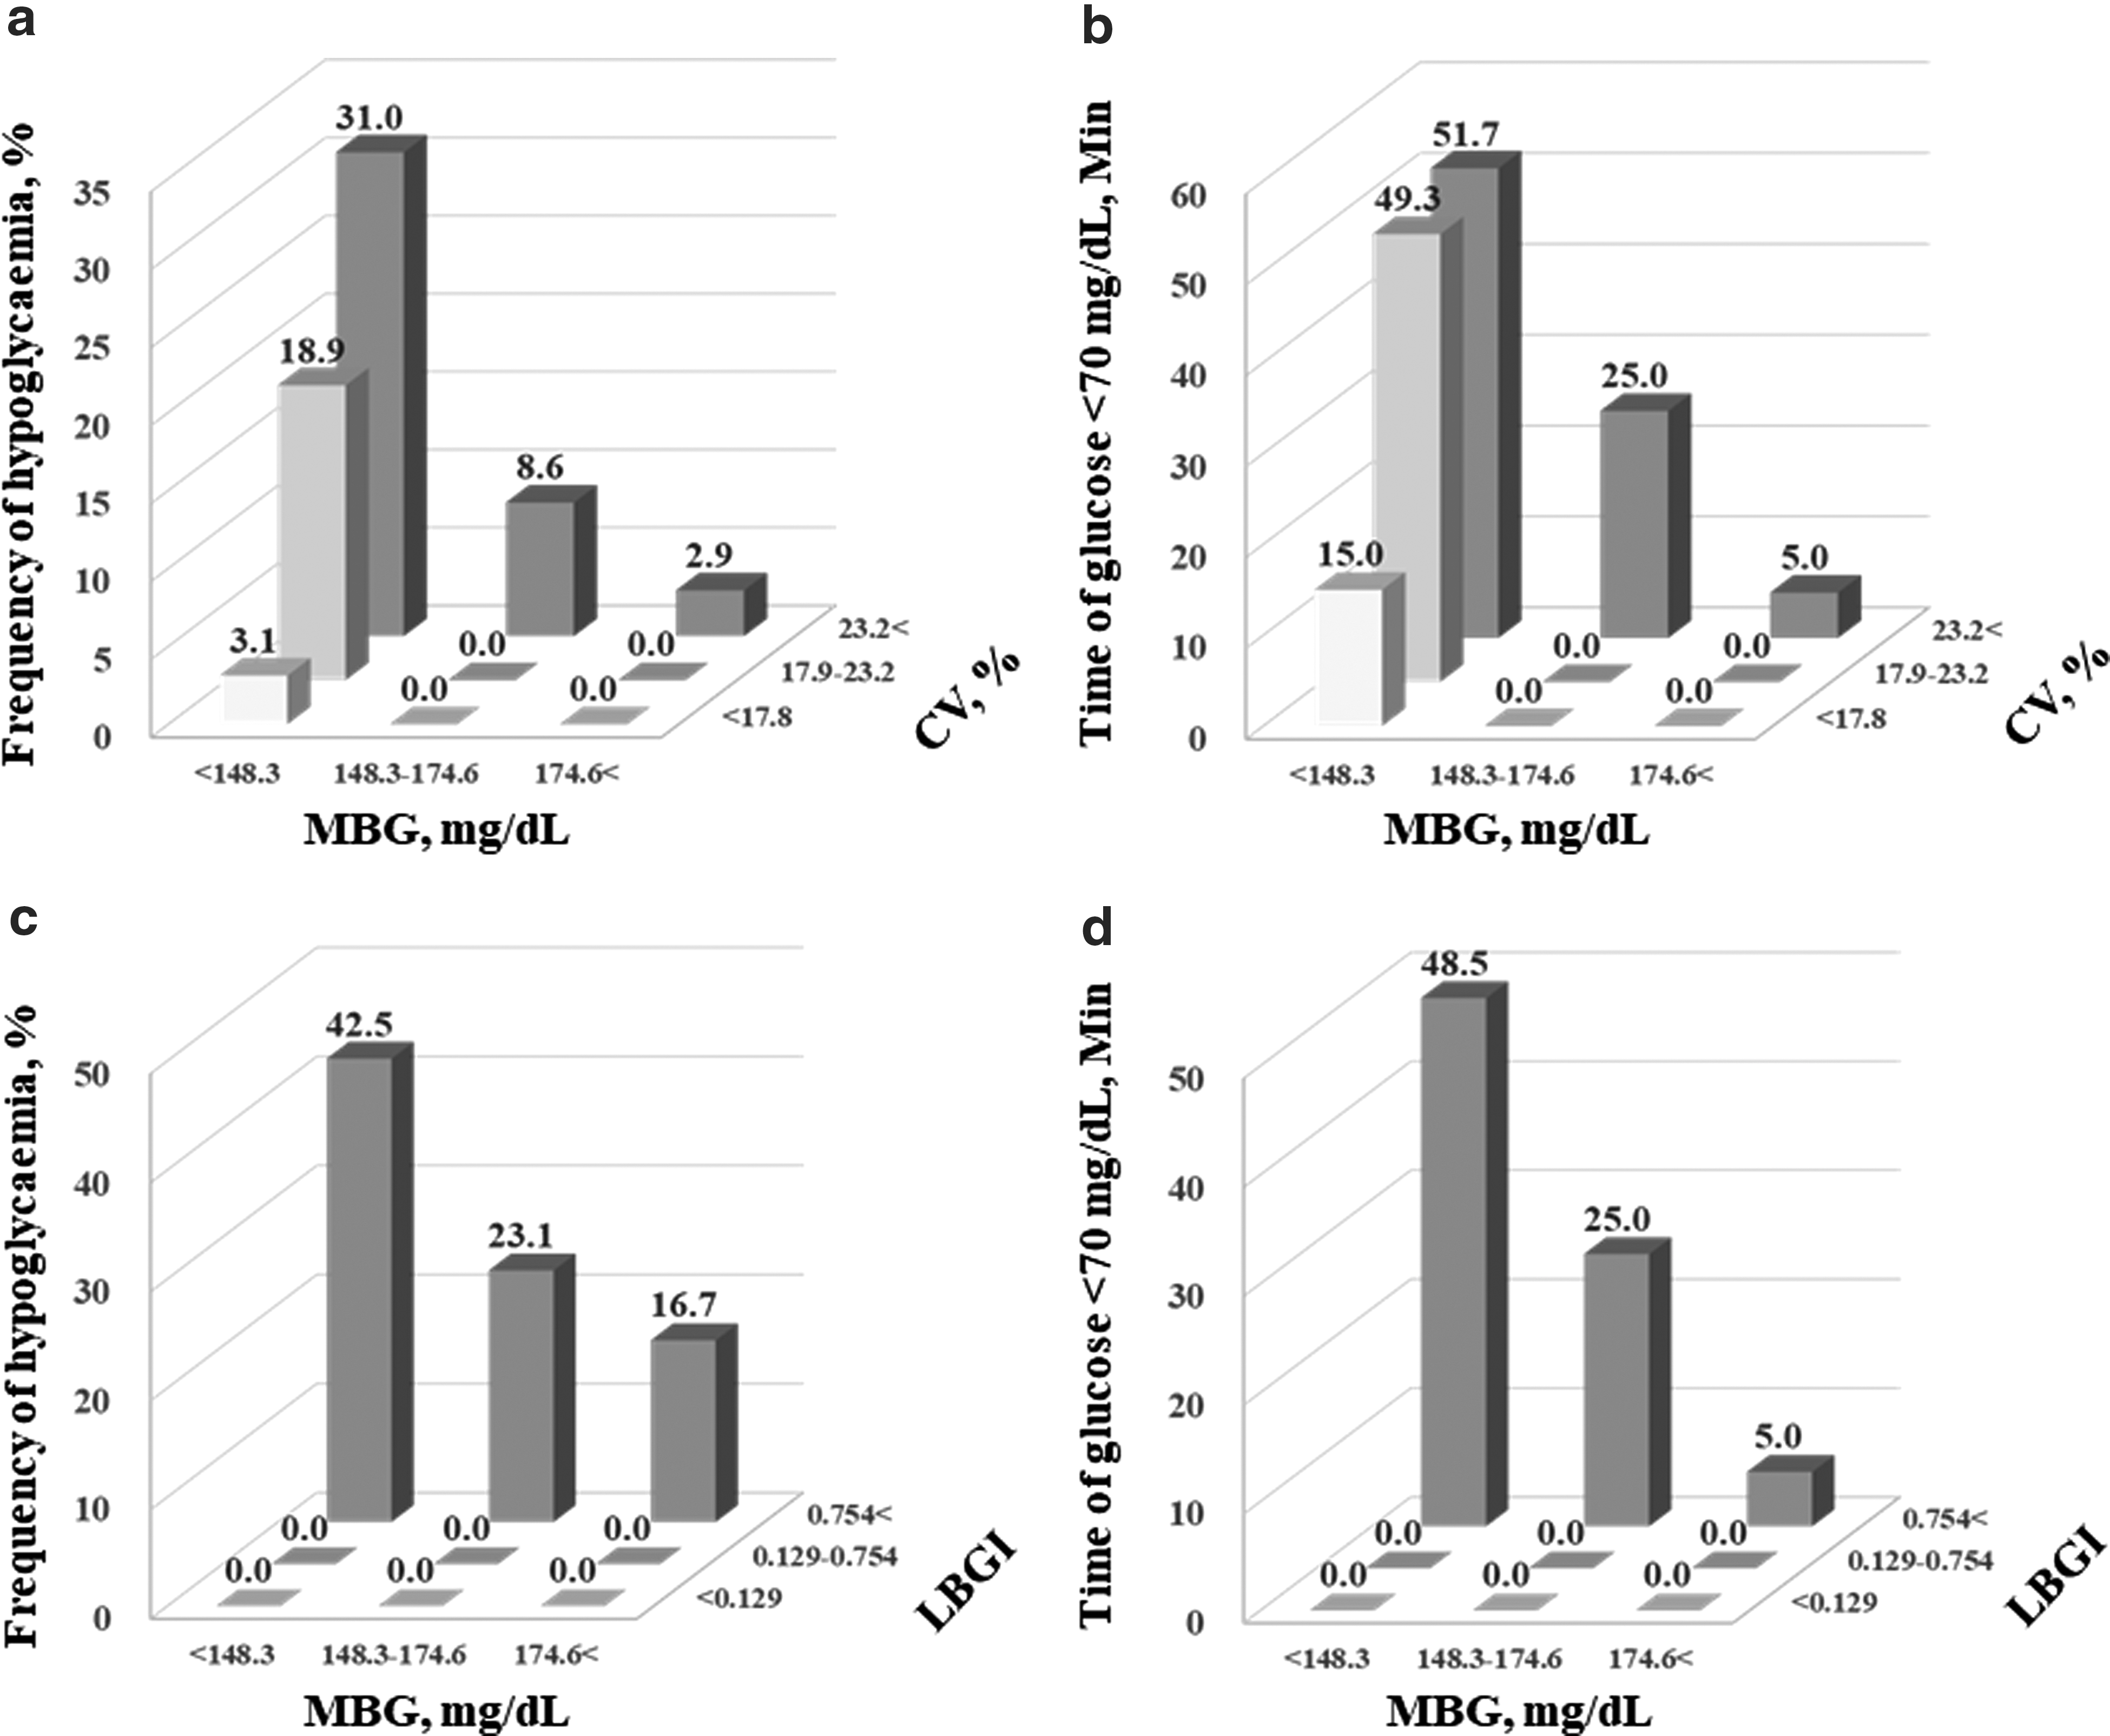
Figure 4a and b illustrates the frequency of hypoglycemia and time with hypoglycemia as a function of terciles of both the MBG and CV. While the lower MBG values increased the risk for hypoglycemia, the greatest independent risk was observed in the highest tercile of glycemic variability. Figure 4c and d illustrates the frequency of hypoglycemia and time with hypoglycemia as a function of terciles of both the MBG and LBGI. While the lower MBG values increased the risk for hypoglycemia, hypoglycemia was observed only in the highest tercile of LBGI.
Discussion
The present study using the CGM demonstrated that MBG level, BG fluctuation, LBGI, Predicted% of BG, and disease duration influenced the incidence of hypoglycemia in patients with T2DM. LBGI was the best predictor of hypoglycemia, and Predicted% BG <70 mg/dL was very useful as an index to predict hypoglycemia. The results also demonstrated that hypoglycemia is more likely to develop in patients with low MBG level (MBG <152 mg/dL) and large fluctuations in BG level (CV ≥22%), suggesting that the combined assessment of these two variables is useful. In daily clinical practice, maintaining good glycemic control is important to prevent vascular complications; however, strict glycemic control may lead to hypoglycemia. To prevent this, our study showed that it is important to assess BG kinetics, in addition to MBG level.
Our study demonstrated that the incidence and duration of hypoglycemia were associated with BG fluctuation. It is known that strict glycemic control increases the risk of hypoglycemia. 4,5 In contrast, HbA1c levels and the incidence rate of hypoglycemia showed a J-shaped association. 25 In other words, the risk of hypoglycemia is increased even at high HbA1c levels. Thus, fluctuations in BG levels need to be assessed, as emphasized in previous studies. 25 Studies using SMBG reported that MBG level and SD measured at seven time points can be used to predict hypoglycemia. 14,15 Other studies also used the CGM. For example, Monnier et al. 26 studied outpatients with T2DM and reported a close association between MBG level, as well as SD, and hypoglycemia. The study by Monnier et al. 26 indicated that the lower mean glucose values and the higher glycemic variability were risks of hypoglycemia, similar to the present study.
However, although CV was useful for predicting hypoglycemia, SD was not useful in the present study. Compared with Monnier's article, 26 background of our patients was different. It was that the hypoglycemic frequency was low, and the severity of hypoglycemia was mild in the present study. And Monnier et al. 26 defined hypoglycemia as ≦56 mg/dL, but we did it as ≦70 mg/dL in the present study. Therefore, it may be suggested that CV may be useful for sensing mild hypoglycemia.
Moreover, in patients with T2DM treated with insulin, the onset of hypoglycemia is reported to be associated with fluctuations in BG level in terms of SD or CV. 27,28 In contrast, Jin et al. 29 studied 480 patients with T1DM or T2DM and demonstrated that CV rather than SD was associated with hypoglycemia. They reported that CV is a predictor of hypoglycemia regardless of disease condition or therapy status. Monnier et al., 30 who assessed in detail the association of CV with treatment contents and pathological conditions, reported that CV or the risk of hypoglycemia is high in patients treated with insulin secretagogues or insulin and in those with T1DM and that the incidence of hypoglycemic events increases particularly in patients with high CV.
In the present study, MBG and CV were identified as factors that can influence hypoglycemia, in agreement with the findings of Jin et al. 29 and Monnier et al., 30 confirming that CV is a useful parameter of BG fluctuation in predicting hypoglycemia. Rodbard 31 reported that CV is an index of fluctuations in BG levels that can be assessed separately from HbA1c and mean glucose levels and that it can be used to predict the risk of hypoglycemia even in patients with various levels of glycemic control. 22,31
Although CGM has allowed safer reductions in BG levels, the incidence rate of hypoglycemia increases in patients under strict control of HbA1c levels. 32 The general target for glycemic control is an HbA1c level <7% without hypoglycemia, although the target level differs among patients. 16,33 Previous studies demonstrated that HbA1c level is associated with MBG level measured by the CGM, 34 –37 and HbA1c level of 7% corresponds to MBG of 8.6 mmol/L. 34 In the present study, patients with low MBG (MBG <152 mg/dL) or large BG fluctuation (CV ≥22%) were likely to develop hypoglycemia and those with both parameter values were more likely to develop hypoglycemia. Thus, approaches that do not only lower BG level but also control BG fluctuations are needed to keep HbA1c level below 7% without causing hypoglycemia.
LBGI is an indicator proposed by Kovatchev et al. 18 to evaluate the risk of severe hypoglycemia. Rama Chandran et al. 38 reported that LBGI stood out as the best predictor of hypoglycemia in T2D when the indices were derived from SMBG. In addition, Gómez et al. 39 reported that LBGI is an important indicator for assessing hypoglycemic risk among all indicators. Rodbard 22 has demonstrated that one can obtain reasonable estimates of the risks of hypoglycemia or hyperglycemia for any arbitrary glucose threshold by transforming glucose values to achieve a Gaussian distribution. This method can be used to estimate the risk of rare events (e.g., severe hypoglycemia), even when such events have not been observed. We estimated the risk of hypoglycemia by utilizing this model. 22 In the present study, it was shown that LBGI was the best predictor of hypoglycemia, and Predicted% BG <70 mg/dL was very useful as an index to predict hypoglycemia.
In the present study, CV% predicting hypoglycemia was 22%, which was lower than that shown by Monnier et al. and Rodbard. 22,28 –32,40 A possible explanation is that the limited number of patients on insulin therapy and nothing to T1DM led to the low cut point of CV. And the proportion of patients on drugs that may cause hypoglycemia (sulfonylurea, glinides, and insulin) are relatively low and those of patients on drugs with a low risk of hypoglycemia [dipeptidyl peptidase-4 (DPP4) inhibitors, alpha glucosidase inhibitors, metformin, pioglitazone, glucagon-like peptide-1 receptor agonists (GLP-1RA), and diet therapy only] are high in the present study. DPP4 inhibitors and GLP-1RA have been shown to have a lower risk of glycemic variability and a lower CV. 41,42
Regarding the relationship between hypoglycemia risk and disease duration, one study found a significant association between disease duration and hypoglycemia risk in insulin-treated patients with T2DM. 43 In addition, a study of patients with T1DM or T2DM using CGM also reported that long disease duration was associated with higher frequency of hypoglycemia. 44 The present study confirmed these previous findings by demonstrating a strong association between long disease duration and high risk of hypoglycemia.
This study has a few limitations. First, it was conducted in routine clinical practice, and therefore, the target for glycemic control differed between patients. Previous studies recommended less stringent targets for glycemic control in elderly diabetic patients. 16,45 In the present study, the risk of hypoglycemia was low in the elderly patients. This finding is probably attributed to the difference in the target levels between younger and older patients. Second, since the present study was conducted in patients admitted to the hospital, the results are slightly different from those reported in studies conducted in patients who visited the outpatients' clinics. Third, it has been reported that the risk of hypoglycemia associated with fluctuations in BG level theoretically varies according to the MBG level. 22 In the present study, we performed an evaluation using only one cutoff point. In the future, the risk of hypoglycemia associated with fluctuations in BG level should be evaluated in a greater number of patients and in terms of the mean values of various factors. Fourth, the present study was a cross-sectional study conducted at two institutions, and the number of cases is small. A longitudinal multicenter study is needed to clarify the causal relationship between BG fluctuation and hypoglycemia.
The present study demonstrated that the incidence of hypoglycemia is influenced by MBG level, BG fluctuation, LBGI, Predicted% of BG, and disease duration. LBGI was the best predictor of hypoglycemia, and Predicted% BG <70 mg/dL was very useful as an index to predict hypoglycemia. In addition, patients with low MBG level and large BG fluctuations were more likely to develop hypoglycemia than others, suggesting the need for assessment of the two variables rather than MBG level alone. To achieve good glycemic control without hypoglycemic episodes, approaches are needed that can stabilize BG at euglycemic level, that is, therapeutic regimen that do not only lower BG level but also control BG fluctuation.
Footnotes
Acknowledgment
The authors thank Ms. N. Sakaguchi for the excellent technical assistance.
Author Disclosure Statement
No competing financial interests exist.