
Abstract
Objective:
To evaluate the relationship between continuous glucose monitoring (CGM)-measured time-in-range 70–180 mg/dL (TIR) and time-in-tight-range 70–140 mg/dL (TITR).
Methods:
TIR and TITR were calculated from CGM data collected using blinded or unblinded Dexcom sensors from 9 studies with 912 participants with type 1 diabetes (T1D) and 2 studies with 184 participants with type 2 diabetes (T2D). The TIR-TITR relationship was assessed overall and stratified by coefficient of variation (CV) and by time below range <70 mg/dL (TBR).
Results:
The correlation between TIR and TITR was 0.94. TITR was higher for a given TIR for T2D compared with T1D. However, after adjusting for the differences in CV or TBR, both of which were higher with T1D than T2D, the differences were minimized. The TIR-TITR relationship was nonlinear, with a higher ratio of TITR:TIR observed as TIR increased ranging from 0.42 when TIR was 20% to 0.66 when TIR was 80%. Similarly, as TITR increased, the ratio of TIR:TITR decreased, varying from 2.6 with TITR of 10% to 1.3 for TITR of 70%. The TIR-TITR relationship varied according to CV and TBR, such that the higher the CV or higher the amount of TBR the greater was TITR for a given TIR.
Conclusions:
TIR and TITR are highly correlated, although the relationship is nonlinear. With knowledge of TIR, TITR can be estimated with reasonable precision.
Introduction
The percentage of time that glucose values are in the range of 70 to 180 mg/dL (time-in-range, “TIR”) as measured with continuous glucose monitoring (CGM) has become an integral metric for assessing glycemic control for clinical care and as an endpoint in clinical trials. The TIR percentage is largely determined by the amount of time >180 mg/dL and to only a small degree by the amount of time <70 mg/dL.
TIR has been shown to have a strong association with both microvascular and macrovascular complications related to diabetes. 1,2 A target of 70% TIR has been established as a goal for both type 1 diabetes (T1D) and type 2 diabetes (T2D), which approximates a glycated hemoglobin (HbA1c) level of 7%. 3
There are circumstances where the percentage of time that glucose values are 70 to 140 mg/dL (time-in-tight-range, “TITR”) may be more relevant as it more closely approximates normoglycemia. For instance, glycemic goals during pregnancy are based on a target range of 63–140 mg/dL. With current therapies for T2D such as SGLT-2 inhibitors and GLP-1 receptor agonists, some patients have the ability to achieve near-normal glycemic levels.
For these patients, setting a glycemic goal based on TITR may be more relevant than TIR. Similarly, as automated insulin delivery (AID) systems advance with improved ability to reduce hyperglycemia, TITR may become more relevant for establishing goals for therapy.
With this in mind, it is important to understand the relationship between TIR and TITR. Should new glycemic goals be established for TITR or would adjusting the TIR goal upward serve the same purpose? We combined datasets from multiple studies of T1D or insulin-treated T2D to evaluate the relationship between CGM-measured TIR and TITR and to explore whether there are differences in the TIR-TITR relationship between T1D and T2D and the effect of AID system use.
Methods
The analysis included CGM data collected using blinded or unblinded Dexcom sensors from 9 studies with 912 participants with T1D and 2 studies with 184 participants with T2D (Supplementary Table S1). TIR and TITR were calculated from CGM data for periods of up to 90 days, with a minimum requirement of at least 10 days of CGM data in a period. Based on the design of the study, a participant may have contributed separate periods of blinded and unblinded data. The amount of CGM data ranged from 11 to 90 days in unblinded periods (median 76 days, interquartile range 55 to 87 days) and from 10 to 97 days in blinded periods (median 14 days, interquartile range: 13 to 27 days).
For T1D, blinded CGM data were obtained from 634 participants using a G4 sensor with 505 software or G5 sensor (Supplementary Table S1). Unblinded CGM data without an AID system were obtained from 641 participants using either a G4 with 505 software or G5 sensor and from 78 participants using a G6 sensor. AID system data from a G6 sensor (t:slim X2 insulin pump with Control-IQ Technology; Tandem Diabetes Care, San Diego, CA) were obtained from 174 participants.
For T2D, blinded CGM data were obtained from 76 participants on basal-bolus insulin using a G4 sensor with 505 software and 65 participants on basal insulin using a G6 sensor. Unblinded CGM data without an AID system were obtained from 77 participants on basal-bolus insulin using a G4 with 505 software and 106 participants on basal insulin using a G6 sensor.
Penalized B-spline regression lines were fitted to assess the relationship between TIR and TITR for (1) participants with T1D using AID system, (2) participants with T1D not using AID system, and (3) participants with T2D not using AID system (no participants with T2D using AID system). Further analyses explored this relationship after adjusting for coefficient of variation (CV) or time below range <70 mg/dL (TBR).
Adjustment for a given covariate was performed by producing regression lines stratified by covariate group (e.g., glucose CV <32%), and then weighting the predictions based on the number of participants in each subgroup of the covariate. This approach compared the relationship between TIR and TITR for the three groups when the CV or TBR were equal, but it has the undesired consequence of reducing the domain of the predictor variable when stratifying by covariate groups.
Results
The 1096 participants ranged in age from 2 to 83 years. Mean (standard deviation [SD]) age was 40 (21) years; 76% were ≥18 years old, and 24% were <18 years old. Sixty-two (6%) of the participants identified as Black, 850 (78%) as White, 120 (11%) as being of Hispanic ethnicity, and 64 (6%) as another or more than one race.
Mean TIR and mean TITR were 53% versus 32% for the 1353 periods for participants with T1D not using AID, 71% versus 47% for the 174 periods for T1D AID users, and 55% versus 29% for the 324 periods for participants with T2D (Supplementary Table S2). The amount of TBR was greater with T1D without AID than T1D with AID or T2D (medians 3.2%, 1.6%, 0.3%, respectively) and varied among the T1D groups (3.2% without AID vs. 1.6% with AID). CV data followed a similar pattern.
The Pearson and Spearman correlation coefficients between TIR and TITR values were both 0.94, although the relationship is nonlinear as indicated in the scatterplot of paired TIR-TITR values (Supplementary Fig. S1). The plotted curves for predicting TITR from TIR were similar comparing T1D without AID and T1D with AID but both curves depicted a higher TITR for a given TIR than the curve for T2D (Fig. 1A).
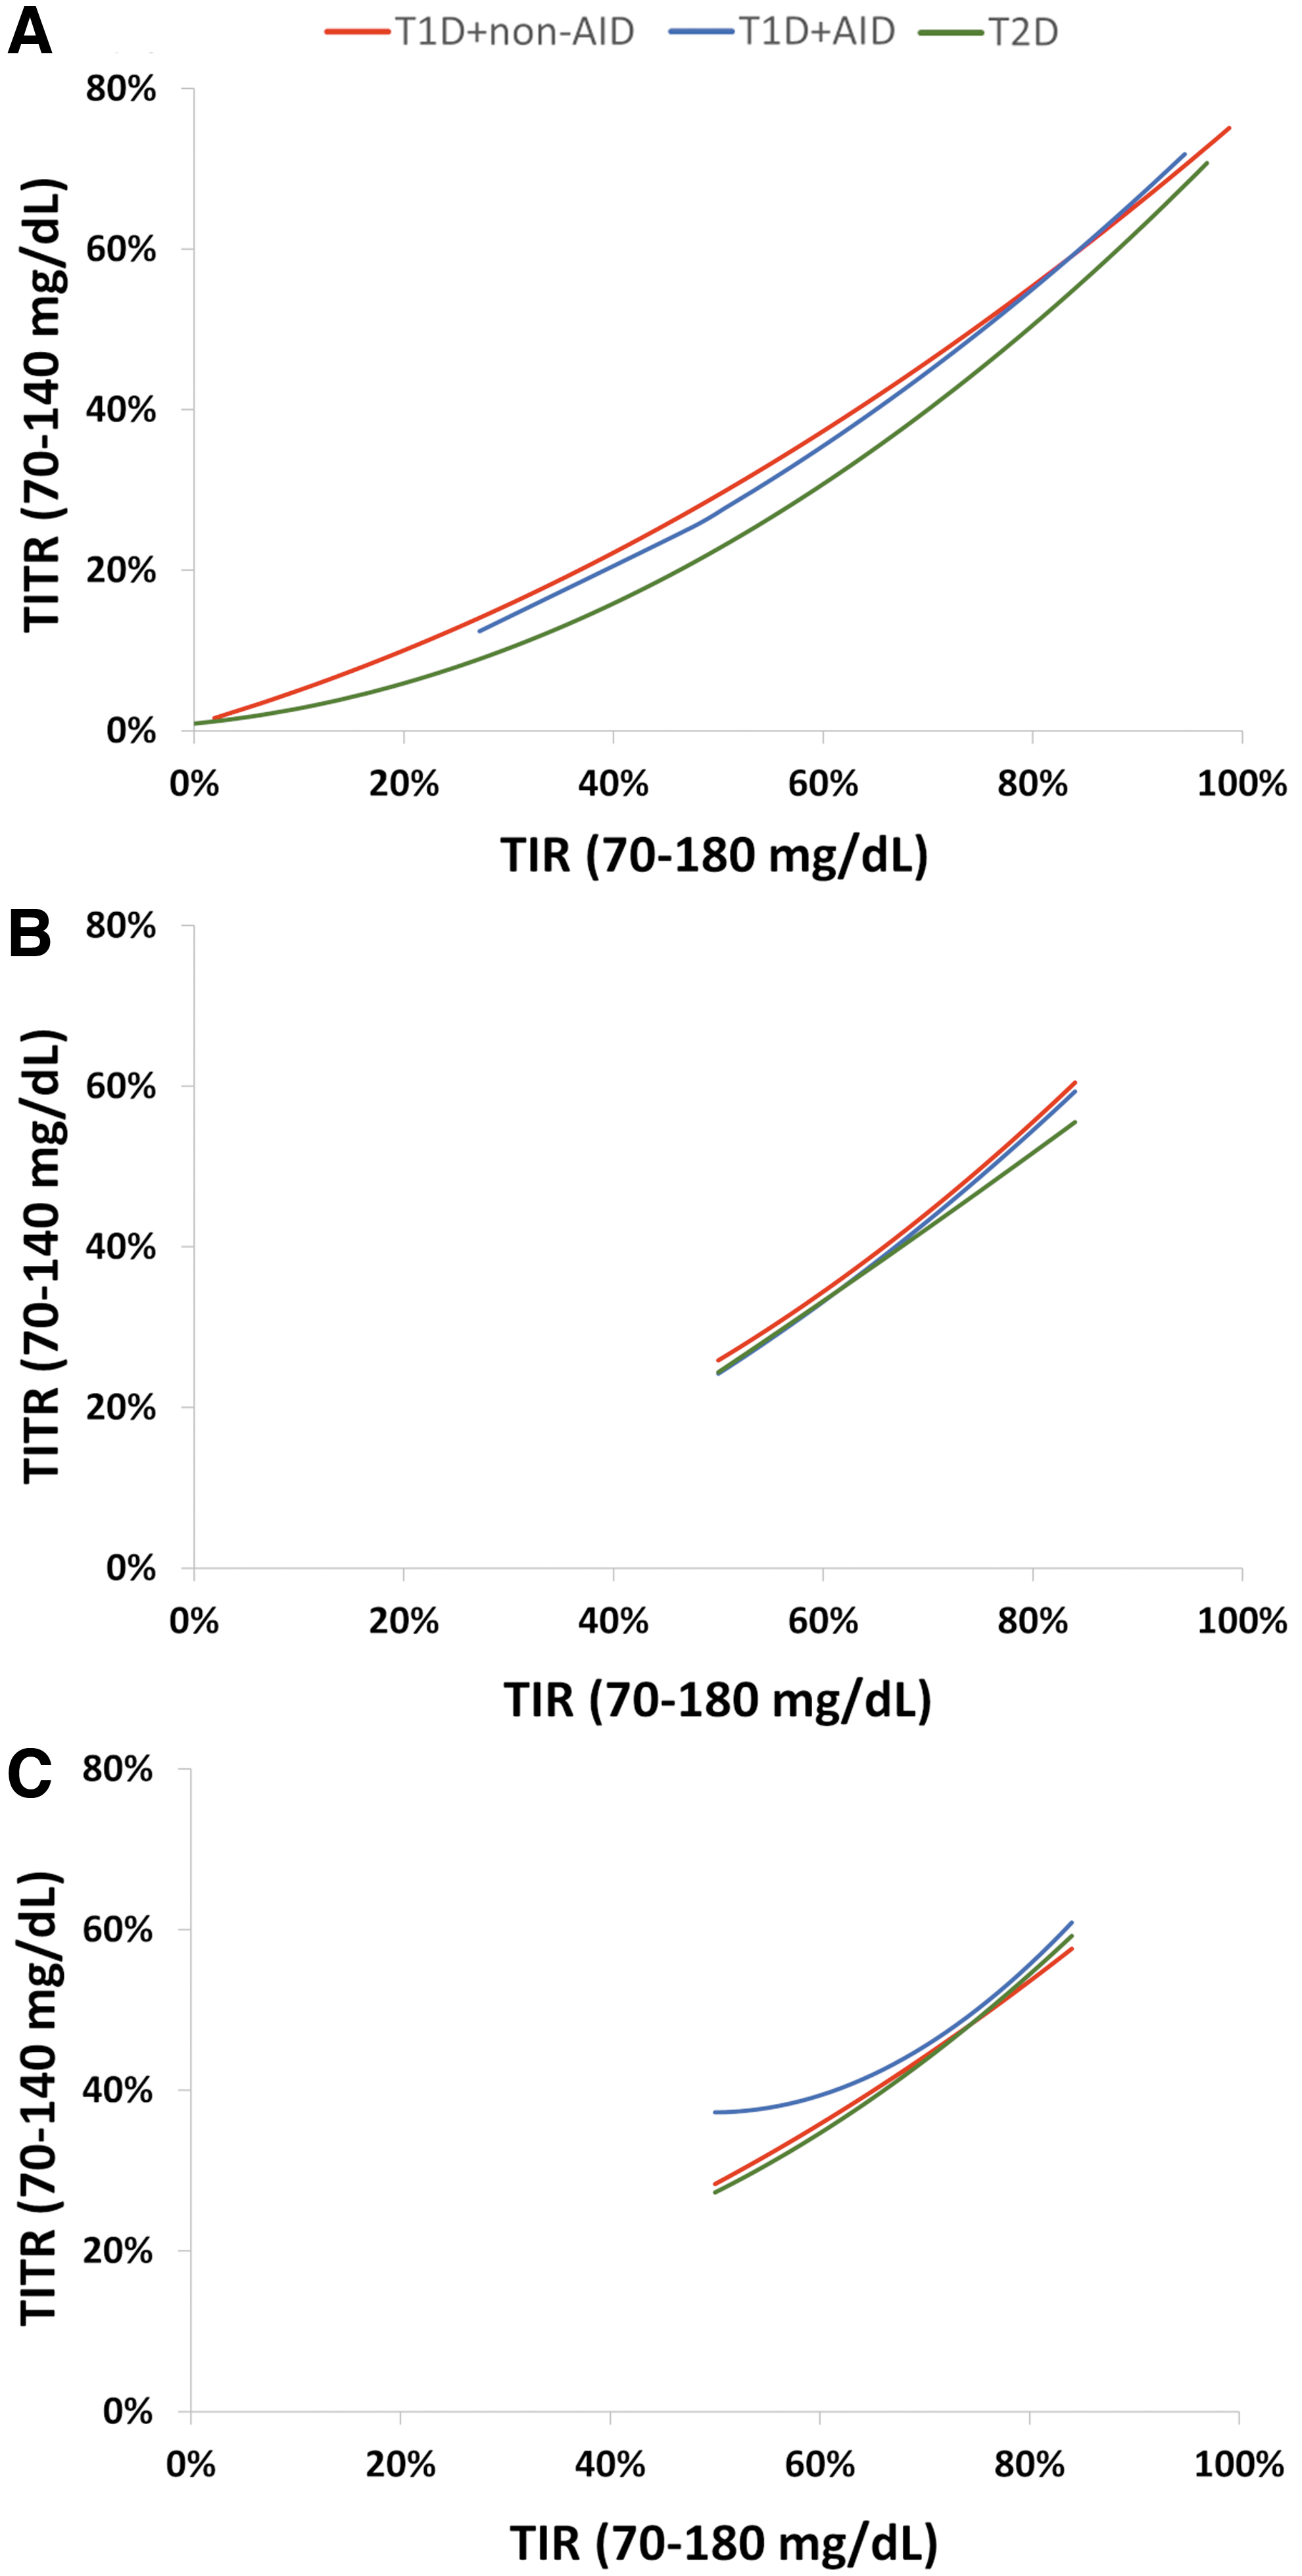
Predicted TITR (70–140 mg/dL) Curves based on TIR (70–180 mg/dL):
However, after adjusting for the differences in CV (Fig. 1B) or TBR (Fig. 1C), the differences were minimized. Therefore, the different relationships between TIR and TITR by type of diabetes were explained statistically by differences in CV and TBR. The relationship between TITR and TIR did not vary according to race-ethnicity group (Supplementary Fig. S2) or HbA1c (data not shown).
Since predicting TITR from TIR appeared similar for T1D and T2D after adjusting for CV or TBR, T1D and T2D were combined in Figure 2, which shows curves for the prediction of TITR from TIR according to CV groups (Fig. 2A) and TBR groups (Fig. 2B). The higher the CV or higher the amount of TBR, the greater is TITR for a given TIR.
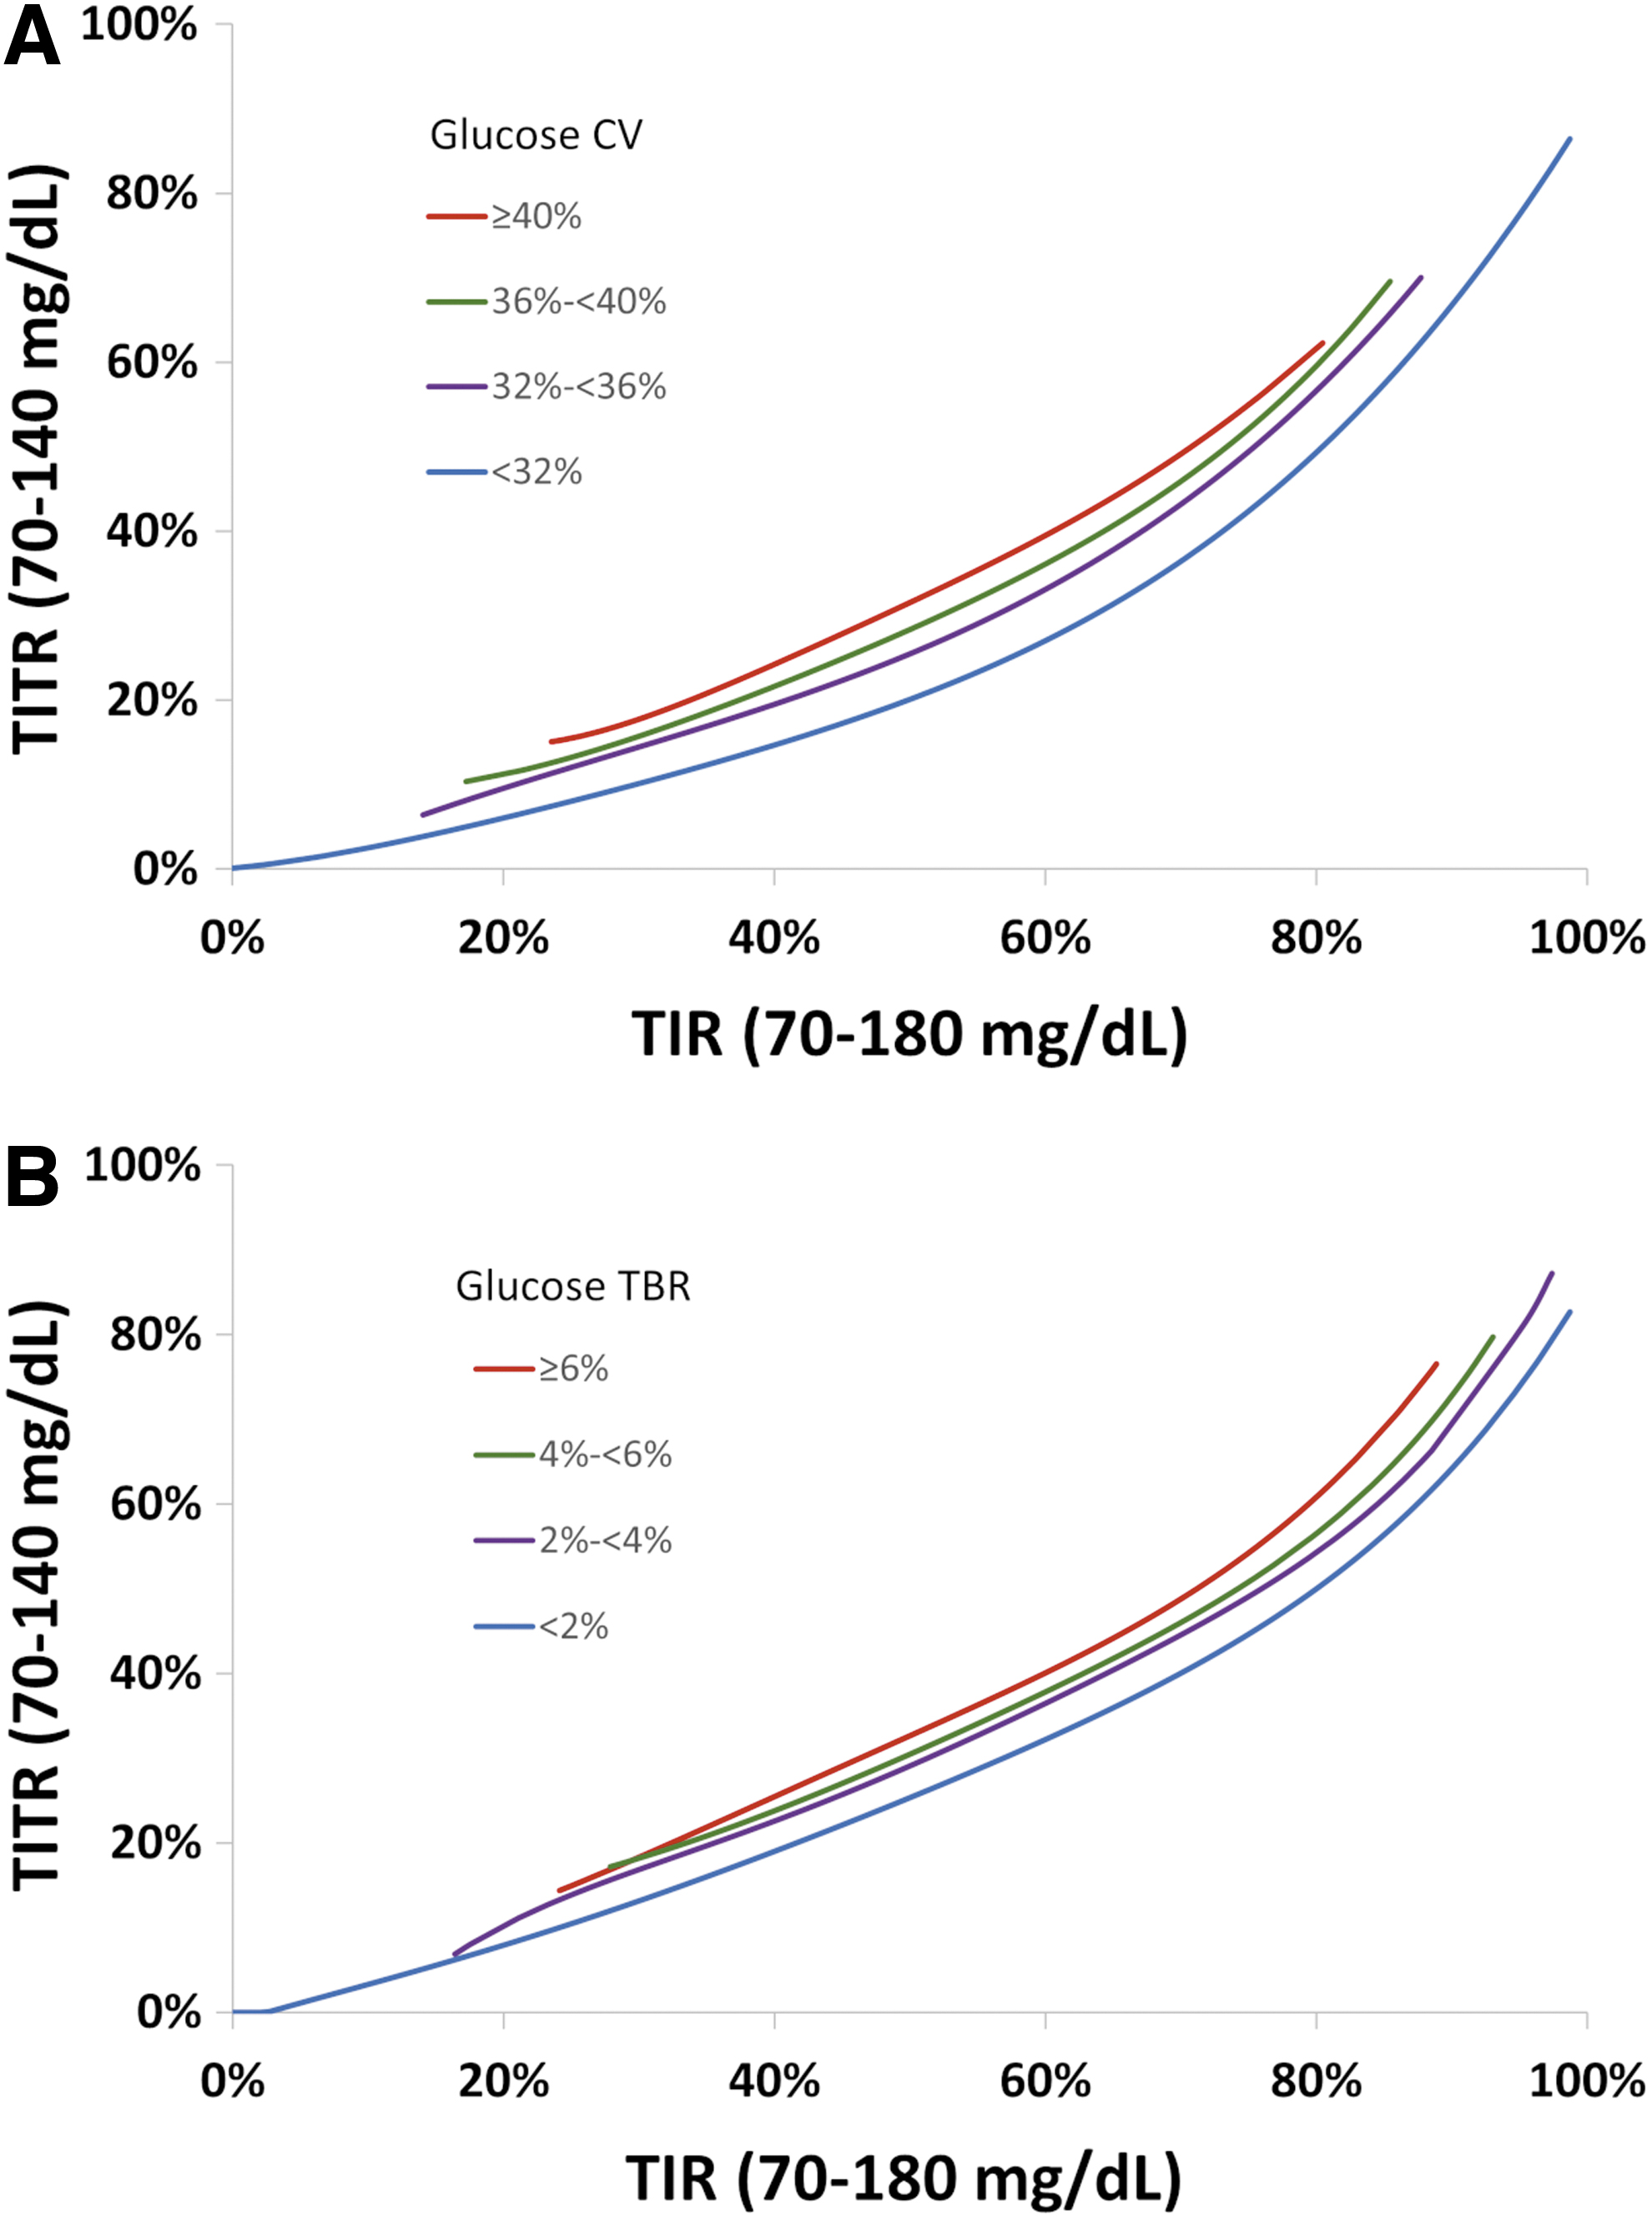
Predicted TITR (70–140 mg/dL) Curves based on TIR (70–180 mg/dL):
This is reflected in the ratio of TITR to TIR varying based on the TIR, ranging from 0.42 when TIR was 20% to 0.66 when TIR was 80% (insufficient data to compute above TIR of 80%) (Table 1). For a participant with a TIR of 70% (meeting the TIR goal), the predicted TITR is 45% overall with a predicted TITR ranging from 38% if their CV is <32%, to 49% if their CV is ≥40%.
Ratio of Time-in-Tight-Range (70–140 mg/dL) to Time-in-Range (70–180 mg/dL) and Predicted Time-in-Tight-Range based on Time-in-Range
The predicted TITR was calculated overall and by different subgroups of glucose CV and glucose TBR.
CV, coefficient of variation; TBR, time below range; TITR, time-in-tight-range; TIR, time-in-range.
A similar pattern was seen when predicting TIR from TITR, with the ratio of TIR to TITR varying from 2.6 with TITR of 10% to 1.3 for TITR of 70% (Table 2). For this relationship, a higher CV or higher TBR yielded lower TIR for a given TITR. Supplementary Figure S3 demonstrates why a higher CV corresponds to lower TIR for a given TITR. The CGM glucose density curves by CV group are shown for periods with a TITR of 50%; the area of the density between 70 and 140 mg/dL is the same for both CV groups, but the area of the density between 140 and 180 mg/dL is much lower for the higher CV group. Thus, a higher CV yields more variability for a given TITR, which leads to less TIR.
Ratio of Time-in-Range (70–180 mg/dL) to Time-in-Tight-Range (70–140 mg/dL) and Predicted Time-in-Range Based on Time-in-Tight-Range
The predicted TIR was calculated overall and by different subgroups of glucose CV and glucose TBR.
Discussion
In this analysis, we evaluated the relationship between TIR and TITR. The value of either one can be reasonably well estimated from the other one when only one of the metrics is known. Aside from circumstances where TITR (or similar range) is widely used such as pregnancy, TIR has become entrenched as a key measure of glycemic control and is a core metric that appears on Ambulatory Glucose Profile (AGP) 4 and other CGM data reports. Therefore, we focused the analyses on predicting TITR when TIR is known.
The results showed a strong correlation between TIR and TITR as expected. However, the relationship was not linear and varied according to type of diabetes, CV, and TBR. The relationship between TIR and TITR was mostly similar for T1D without AID and T1D AID users, but for both groups TITR was higher for a given TIR than it was for T2D non-AID users. This difference appeared to be due to a higher amount of variance and hypoglycemia in the T1D cohort as the difference largely disappeared after adjusting for CV or TBR.
It is not surprising that the lower CV yields higher predicted TIR for a given TITR. Intuitively, if TITR is relatively high and CV is low, then this would suggest that mean glucose would be relatively low with little variance (Supplementary Fig. S3). Thus, we would expect TIR to be very high with a low mean glucose and SD. If the CV is high though, then the increased variability means the participant is spending more time above range and predicted TIR will be lower. This same argument also indicates that higher glucose CV yields higher predicted TITR for a given TIR.
The relationship between TIR and TITR was nonlinear with a higher ratio of TITR:TIR observed as TIR increased. Similarly, as TITR increased, the ratio of TIR:TITR decreased. Although the predicted TITR for a given TIR varied according to CV or TBR, this pattern of an increasing TITR:TIR ratio was consistent across the range of CV or TBR levels.
There are several limitations of this analysis to consider. First, the analysis cohort was predominately White as participant data were drawn from clinical trials that tend to overrepresent Whites compared with other races; however, 22% of the cohort represented a minority group. Second, it is possible that the TIR-TITR relationship could differ based on factors such as c-peptide level, use of therapies such as GLP-1 receptor agonists or SGLT-2 drugs, or type of AID system. Differences among AID systems could affect the TIR-TITR relationship in whether auto-boluses are delivered and by having differing set points. Third, we do not have data for an assessment of diabetes complications. TIR has been shown to be strongly associated with microvascular and macrovascular complications, but whether TITR could be a better predictor than TIR is still unknown. However, this paper shows the two predictors are highly correlated and one could accurately predict one metric from the other, and using CV or TBR improves the precision.
TITR may gain more widespread use in the future as advances in pharmacologic treatments for T2D such as SGLT-2 inhibitors and GLP-1 receptor agonists and advances in AID system technology for T1D have made near-normalization of glycemia a realistic goal for many patients.
The standard TIR goal of 70%, which corresponds on average to a TITR goal of 45%, could be increased for participants using these treatments. This analysis shows that both metrics are strongly related to each other and TIR can be used to set goals for TITR.
Footnotes
Authors' Contributions
R.W.B., P.C., and R.M.B. wrote/edited the article. D.R. performed statistical analysis and wrote/edited the article.
Author Disclosure Statement
R.W.B. reports no personal financial disclosures but reports that his institution has received funding on his behalf as follows: grant funding, study supplies, and consulting fees from Insulet, Tandem Diabetes Care, and Beta Bionics; grant funding and study supplies from Dexcom; grant funding from Bigfoot Biomedical; study supplies from Medtronic, Ascencia, and Roche; consulting fees and study supplies from Eli Lilly and Novo Nordisk; and consulting fees from Embecta, Vertex, Hagar, Ypsomed, Sanofi, and Zucara. D.R. and P.C. have no financial disclosures. R.M.B. has received research support, has acted as a consultant, or has been on the scientific advisory board for Abbott Diabetes Care, Ascensia, Bigfoot Biomedical, Inc., CeQur, DexCom, embecta, Eli Lilly, Hygieia, Insulet, Medtronic, Novo Nordisk, Onduo, Roche Diabetes Care, Sanofi, United Health care, Vertex Pharmaceuticals, and Zealand Pharma. Dr. Bergenstal's employer, nonprofit HealthPartners Institute, contracts for his services for which he receives no personal income.
Funding Information
Supported through the Jaeb Center for Health Research Foundation.
Supplementary Material
Supplementary Table S1
Supplementary Table S2
Supplementary Figure S1
Supplementary Figure S2
Supplementary Figure S3
References
Supplementary Material
Please find the following supplemental material available below.
For Open Access articles published under a Creative Commons License, all supplemental material carries the same license as the article it is associated with.
For non-Open Access articles published, all supplemental material carries a non-exclusive license, and permission requests for re-use of supplemental material or any part of supplemental material shall be sent directly to the copyright owner as specified in the copyright notice associated with the article.