
Abstract
Aim:
To compare the safety in terms of hypoglycemic events and continuous glucose monitoring (CGM) metrics during aerobic exercise (AE) of using temporary target (TT) versus suspension of insulin infusion (SII) in adults with type 1 diabetes (T1D) using advanced hybrid closed-loop systems.
Methods:
This was a randomized crossover clinical trial. Two moderate-intensity AE sessions were performed, one with TT and one with SII. Hypoglycemic events and CGM metrics were analyzed during the immediate (baseline to 59 min), early (60 min to 6 h), and late (6 to 36 h) post-exercise phases.
Results:
In total, 33 patients were analyzed (44.6 ± 13.8 years), basal time in range (%TIR 70–180 mg/dL) was 79.4 ± 12%, and time below range (%TBR) <70 mg/dL was 1.8 ± 1.7% and %TBR <54 mg/dL was 0.5 ± 0.9%. No difference was found in the number of hypoglycemic events, %TBR <70 mg/dL and %TBR <54 mg/dL between TT and SII. Differences were found in the early phase, with better values when using TT for %TIR 70–180 mg/dL (83.0 vs. 65.3, P = 0.005), time in tight range (%TITR 70–140 mg/dL) (56.3 vs. 41.5, P = 0.04), and time above range (%TAR >180 mg/dL) (15.3 vs. 31.8, P = 0.01). In the diurnal period, again %TIR was better for TT use (82.1 vs. 73.1, P = 0.02) and %TAR (15.0 vs. 22.96, P = 0.04). No significant differences were found in the CGM metrics during the different phases of AE.
Conclusion:
Our data appear to show that the use of TT compared with SII is equally safe in all phases of AE. However, the use of TT allows for a better glycemic profile in the early phase of exercise.
Introduction
Physical activity is a cornerstone of type 1 diabetes (T1D) management. Guidelines recommend 150 min of moderate- or vigorous-intensity physical activity per week; however, only 30% of patients meet this recommendation. 1 In patients with T1D, the glycemic response to exercise is influenced by several factors, including insulin use, glucose levels, carbohydrate intake before exercise, type of exercise, intensity, and duration of exercise. 2 Aerobic exercise has been shown to significantly reduce blood glucose levels between 18 and 39 mg/dL, 1,3 with increased glycemic variability, resulting in a greater risk of post-exercise hypoglycemia, which lasts up to 36 h after exercise is completed. 4,5
In recent years, the technology available to improve metabolic control in T1D has advanced significantly. MiniMed 780G is an advanced hybrid closed-loop (AHCL) system with a self-adjusting basal insulin system and autocorrection boluses, as well as the ability to select the glycemic target (100–120 mg/dL). This device has a temporary target (TT) feature that sets the glycemic target at 150 mg/dL for a period of time without the option of autocorrection boluses, allowing glucose levels to be elevated prior to exercise and reducing the risk of hypoglycemia. The current recommendation for patients with T1D using automated insulin delivery (AID) systems is to use the TT 90–120 min before exercise, which often limits its use. 6 Despite current recommendations, ∼60% of patients prefer to stop insulin infusion and remove the device prior to exercise. 4 However, there is currently limited evidence regarding the use of this feature in patients who are physically active, and there are no studies comparing these two practices.
The objective of this study is to compare the safety in terms of hypoglycemic events of using a temporary target versus suspension of insulin infusion in adults with T1D undergoing aerobic exercise and to evaluate measures of glycemic control during exercise and up to 36 h post-exercise.
Methods
Study design
A randomized, crossover clinical trial was conducted. Patients with T1D who engaged in regular physical activity and were being followed at the San Ignacio University Hospital in Bogota, Colombia, between July 2022 and June 2023 were invited to participate. Patients over 18 years of age who had used the AHCL system (MiniMed 780G, Medtronic, Northridge, CA) for at least 3 months at the time of recruitment were included. Patients were excluded if they were pregnant, had a history of coronary artery disease, had a history of diabetic ketoacidosis or severe hypoglycemia in the past month, were taking beta-blockers and glucocorticoids, had severe proliferative or nonproliferative diabetic retinopathy, or had stage 5 chronic kidney disease on renal replacement therapy. All patients signed an informed consent form. The protocol was approved by the institutional ethics committee (code FM-CIE-0837-22).
Exercise sessions
Two training sessions were performed, one with the TT and the other with the suspension of insulin infusion (SII), separated by a washout period of at least 14 days. Treatment type for the first session was randomly and centrally assigned using a numerical sequence generated by the Randomizer for Clinical Trial Lite application. 7 TT or SII use was initiated 60 min before exercise, maintained throughout the session, and continued until 15 min after exercise ended. Capillary glucose (CG) was measured at the start of the activity, with a target glucose at the start of the exercise set between 126 and 180 mg/dL. If CG was <90 mg/dL, 20 g of carbohydrate (CHO) was administered; if CG was between 90 and 126 mg/dL, 10 g of CHO was administered. If CG was >200 mg/dL, rapid insulin correction according to usual care was indicated. If corrections were required, CG was measured every 15 min until safe levels were reached before beginning physical activity. After the session, all patients underwent CG to calculate the mean absolute relative difference. The Guardian Sensor 3 was the continuous glucose monitoring (CGM) device used. CGM data were downloaded 36 h after the end of each session using Carelink (Medtronic).
All participants were instructed to abstain from alcohol and physical activity for 7 days prior to study entry. The exercise sessions were scheduled between 7 a.m. and 9 a.m. on an empty stomach and consisted of 45 min of exercise cycling at a moderate intensity. The parameter used to monitor the intensity was the percentage of the maximum heart rate (HR) obtained by the sensor (POLAR H9), which was placed at chest level and sent the data by Bluetooth system to the application (POLAR FLOW), where the anthropometric variables of each participant had been previously registered for the exact calculation of the percentage of the maximum target HR. Each session began with 5 min of low-intensity warm-up (55%–65% of maximum HR), followed by 35 min of moderate-intensity exercise (70%–80% of maximum HR), and ended with 5 min of recovery (maximum HR <55%).
Baseline physical activity was classified as PA0: inactive, PA1: 1–2 times per week, and PA2: more than 2 times per week. Activity intensity was determined according to the definitions of the American College of Sports Medicine, where low intensity was defined as 55%–65% of maximum HR, moderate intensity between 70% and 80% of maximum HR, and vigorous intensity above 80% of maximum HR. 8 Three phases of exercise were evaluated: the immediate phase of exercise, defined as the time between minute 0 and minute 59; the early phase between minute 60 and 360 (6 h) post-exercise; and the late phase between hour 6 and 36 post-exercise. The daytime period was between 6:00 a.m. and 11:59 p.m., and the nighttime period was between 00:00 a.m. and 5:59 p.m. within the first 24 h after completion of each session. Clinically significant hypoglycemic events were defined as CGM values <70 mg/dL and <54 mg/dL in at least three consecutive measurements. Baseline CGM data from 2 weeks before the physical activity section were analyzed. Metrics of glycemic control were also analyzed: time in range (TIR) defined as the percentage of time between 70 and 180 mg/dL, time above the 180 mg/dL range (TAR >180), time above the 250 mg/dL range (TAR >250), time below the 70 mg/dL range (TBR <70), time below the 54 mg/dL range (TBR <54), and time in tight range between 70 and 140 mg/dL (TITR 70–140). The coefficient of variation (%CV) was calculated by dividing the standard deviation by the average glucose multiplied by 100, with high glycemic variability defined as %CV >36%.
Statistical analysis
The sample size was calculated to detect a difference of 25% in the mean number of episodes of hypoglycemia <70 mg/dL in the 36-h post-exercise follow-up, based on data from a pilot study that showed 2.75 episodes in the TT group and 3.7 episodes in the SII group. 3 With 80% power, alpha value of 0.05 and standard deviation of difference of 1.8, we calculated that 32 patients would need to be enrolled in the two training phases.
Continuous variables were analyzed using measures of central tendency and dispersion, utilizing mean and standard deviation or median and interquartile range as suitable based on data distribution. A Shapiro–Wilk test was used to assess normality assumptions. The exercise phases were independently analyzed. The incidence rate ratio (IRR) of hypoglycemia was determined at the 36-h follow-up. To compare the IRR, TAR, TBR, and CV metrics, a t-test was performed. A priori it was established that a difference in individual TIR of ≥5% or a difference of ≥3% between intervention groups would be considered clinically significant in accordance with the international consensus for CGM use in clinical trials. 9 We used Stata software (Stata Statistical Software: Release 17. College Station, TX: StataCorp LLC) for statistical analysis.
Results
Thirty-two patients were randomized; one patient was excluded from the final analysis due to loss of CGM data. The mean age was 44.6 ± 13.8 years, mean duration of T1D at enrolment was 21.7 years, HbA1c was 7.0 ± 0.9%, and mean %TIR between 70 and 180 mg/dL was 79.4 ± 12%. Sensor and SmartGuard usage was >85% in all patients. Baseline characteristics of the patients enrolled in the study are shown in Table 1.
Baseline Characteristics of the Patients Included in the Study
BMI, body mass index; CV, coefficient of variation; GMI, glucose management indicator; GS, glucose sensor; HbA1c, hemoglobin A1C; MARD, mean absolute relative difference; PA2, physical activity >2 times a week; TAR, time above range; TBR, time below range; TDD, total daily dose; TIR, time in range; TITR, time in tight range; SD, standard deviation.
Hypoglycemic events
Forty-seven events of hypoglycemia <70 mg/dL were documented in the TT group compared with 52 events in the SII group at 36 h of follow-up with an IRR of hypoglycemia of 0.90 (95% CI: 0.59–1.36; P = 0.62). For hypoglycemia <54 mg/dL, there were 13 events in the TT group compared with 12 events in the SII group at 36 h, with an IRR of hypoglycemia that was not statistically significant (1.08; 95% CI: 0.46–2.60; P = 0.84). There was only one hypoglycemic event in each group during exercise and only —three to four events in each group in the 5 h after exercise. Table 2 summarizes the IRR of hypoglycemia <70 and <54 mg/dL in each of the exercise phases.
Incidence Rate Ratio for Hypoglycemic Events at Temporary Target Versus Suspension of Insulin Infusion
IRR reported as number of hypoglycemic events per 36 h/patient.
Number of hypoglycemic events.
Events that occur within 24 h of the start of the exercise.
CI, confidence interval; IRR, incidence rate ratio; NA, not applicable; SII, suspension of insulin infusion; TT, temporary target.
Metrics for glycemic control
Glycemic control metrics by treatment and exercise phase are presented in Table 3. Analysis of the CGM data showed a difference between the use of TT versus SII in the early phase for %TIR 70–180 mg/dL (83.0 vs. 65.3, P = 0.005), %TITR 70–140 mg/dL (56.3 vs. 41.5, P = 0.04), and %TAR >180 mg/dL (15.3 vs. 31.8, P = 0.01). When evaluating the diurnal period, %TIR 70–180 mg/dL was higher with TT use (82.1 vs. 73.1, P = 0.02) and %TAR >180 mg/dL was higher with SII use (15.0 vs. 22.96, P = 0.04) in the same period.
Results of the Difference in Glycemic Control Metrics Between Temporary Target Versus Suspension of Insulin Infusion in Different Phases of Exercise
A percentage difference of 17.7%, P = 0.005, and 8.97%, P = 0.02, was observed when comparing %TIR between 70 and 180 mg/dL in the early phase and during the daytime, respectively. Similar results were found for TITR 70–140 mg/dL in the early phase with a difference of 14.81%; P = 0.04 favoring TT compared with SII. Figure 1 shows the percentage differences of metrics in each exercise phase.
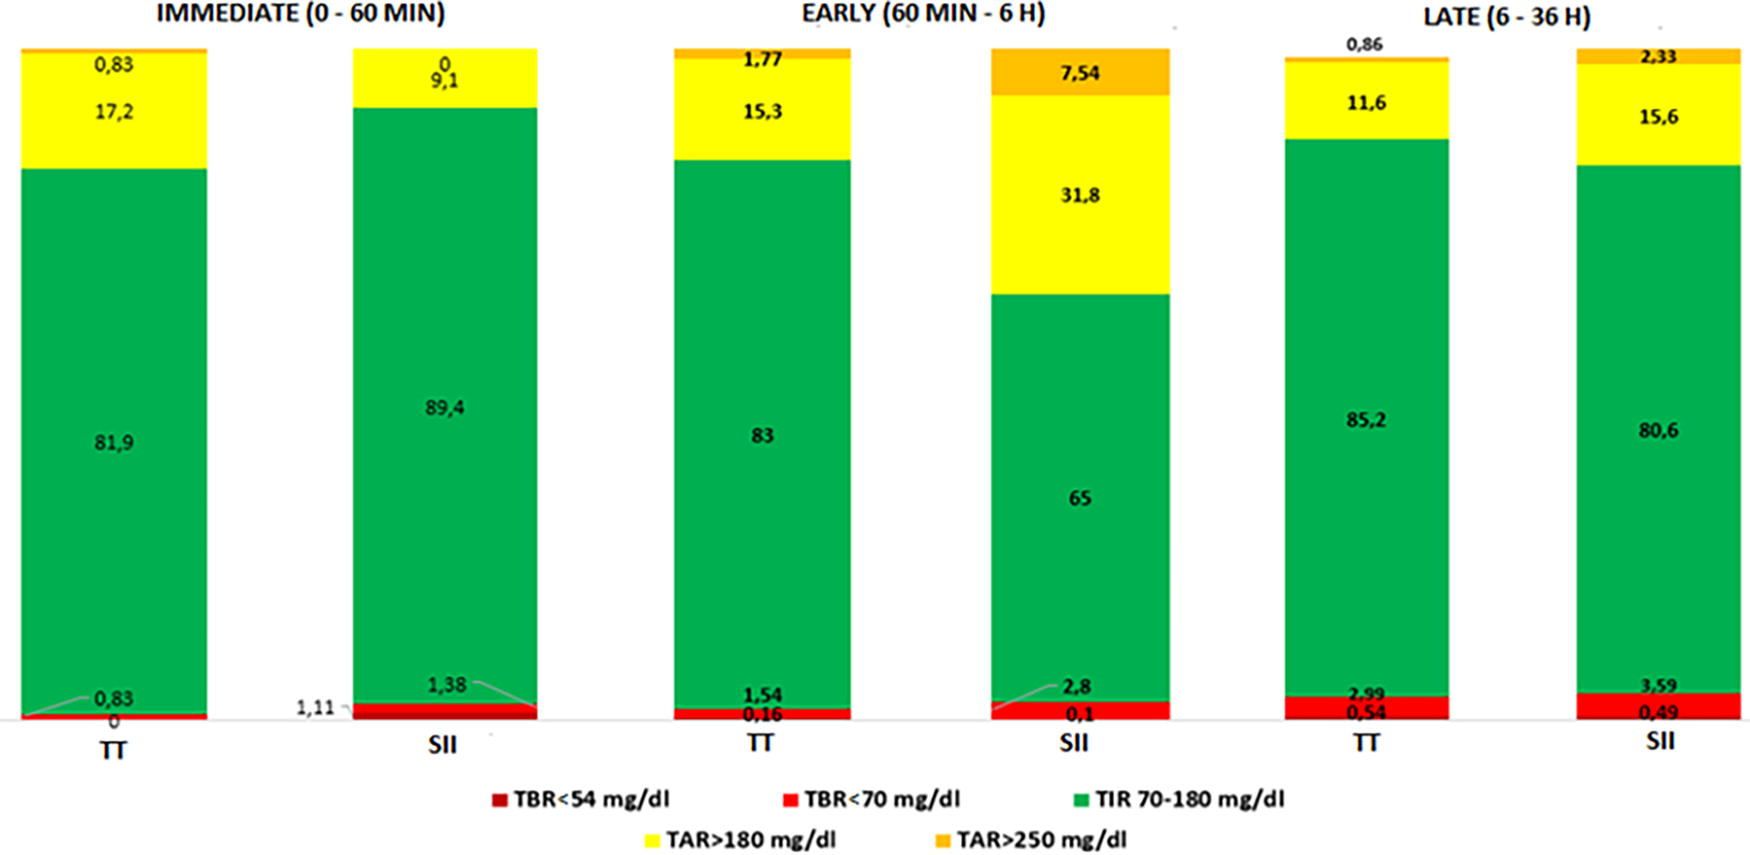
Percentage differences in metrics for each phase of the exercise. TAR, time above range; TBR, time below range; TIR, time in range; TT, temporary target; SII, suspension of insulin infusion.
Discussion
In people with T1D using AID systems, current recommendations suggest the use of TT between 1 and 2 h before and during exercise (in devices with this feature) or SII during aerobic exercise as strategies to reduce the risk of hypoglycemia. 6 This study showed that the two strategies used, such as using TT 60 min before and during exercise compared with SII, were equally safe. In addition, the use of the TT allows a better glycemic profile in the early phase of exercise with better %TIR between 70 and 180 mg/dL, better TITR between 70 and 140 mg/dL, and less exposure to hyperglycemia (%TAR >180 mg/dL). No increase in TBR or hypoglycemic events was observed during the three phases of exercise and up to 36 h after the end of exercise.
In this study, we found that safety in terms of hypoglycemia was similar between the two interventions (use of TT vs. SII), possibly related to the fact that all patients were instructed to resume SmartGuard after completing physical activity. Our results reflect the adequate metabolic control and safety of this new technology, which has been shown to reduce TBR <70 mg/dL by up to 4% in real-world studies, 10 making it difficult to find significant differences between one intervention and the other. Although no statistically significant differences in %TBR <70 mg/dL or %TBR <54 mg/dL were found in any of the exercise phases, a trend toward a lower percentage of TBR was found in the TT group compared with SII. Therefore, the use of the TT for aerobic exercise would be advisable for patients using AHCL systems.
In addition, the benefit in metabolic control is obtained by activating the TT 60 min earlier. The differences in TIR between the TT and SII groups were 7.5% for immediate phase (0–60 min exercise) and 18% for early post-exercise phase. The consensus report states that a 5% difference in TIR between treatment arms is clinically significant for the individual and that a treatment group difference in TIR in a clinical trial is significant if >3%. 11 The differences in TIR between groups were clinically significant for both individual and group analyses. Recent studies have evaluated the post-prandial glycemic response to aerobic exercise using AHCL systems in adults with T1D and found that the most effective strategy for minimizing dysglycemia in this population is to reduce the insulin bolus by 25% and to announce it 90 min before exercise. 12 However, unlike our study, which was conducted while fasting, McCarthy’s 12 study was conducted with a meal 90 min prior to activity. Results similar to this study have been reported with other devices. Forlenza et al. reported that the use of a variable glucose set point with reduction of basal infusion 90 min before exercise was safe during daytime and nighttime use. 13
The present study expands information about the safety of the AHCL system and directly evaluates the safety of two interventions during and after aerobic exercise. This information will generate future clinical recommendations in patients with T1D who use this technology. Strengths of this study are the crossover experimental design in which all participants serve as their own controls, reducing between-subject variability and allowing evaluation of each patient’s response to both interventions. In addition, metrics were analyzed during the three phases of exercise and up to 36 h after the end of physical activity, as well as the numerical accuracy of the device before and after the intervention. The population included in this study has a similar age and duration of diabetes compared to other studies. However, they had better metabolic control and a higher level of physical activity. 11,14 In fact, the whole of our population performed more than two exercise sessions per week. This is different from what was reported by Bohn et al. who found that only one fifth of the patients reached the recommended level of 150 min of physical activity per week. The characteristics of our population do not allow us to generalize our conclusions to other populations (sedentary or PA0, pediatric populations, or older adults). Therefore, further studies are needed to confirm our findings in these groups. In addition, our results cannot be extrapolated to previous versions of this technology or to other modalities of physical activity. Finally, the number of hypoglycemic events was minimal, making it difficult to find differences between the data. However, they reflect the safety of using SmartGuard even when the patient is engaged in aerobic physical activity.
Conclusions
This study suggests the clinical safety of using TT during aerobic exercise in terms of hypoglycemia events and metabolic control by improving %TIR and %TITR with a reduction in early-phase and diurnal hyperglycemia without an increase in hypoglycemia, which is maintained up to 36 h after the end of exercise. In those patients who are not able to start the TT in the pre-exercise phase. SII is safe, and it is important to instruct patients to resume SmartGuard after aerobic exercise. Further studies are needed to determine if conclusions are similar in other settings, such as high-intensity aerobic, endurance, and mixed training.
Footnotes
Author Disclosure Statement
A.M.G. received speaker’s fees from Novo Nordisk, Elli Lilly, Boehringer Ingelheim, Abbott, and Medtronic. D.C.H. received speaker’s fees from Novo Nordisk, Sanofi, and Abbott.
Funding Information
No funding was received for this article.