
Abstract
Objective:
To compare the accuracy of commonly used continuous glucose monitoring (CGM) analysis programs with ambulatory glucose profile (AGP) and Dexcom Clarity (DC) in analyzing CGM metrics in patients with type 1 diabetes (T1D).
Research Methods:
CGM data up to 90 days from 152 adults using the same CGM and automated insulin delivery system with T1D were collected. Six of the 19 CGM analysis programs (CDGA, cgmanalysis, Glyculator, iglu, EasyGV, and GLU) were selected to compare with AGP and DC. Metrics were compared etween all tools with two one-sided t-tests equivalence testing. For the equivalence test, the acceptable range of deviation was set as ±2 mg/dL for mean glucose, ±2% for time in range (TIR), ±1% for time above range (TAR), time above range level 1 (TAR1), time above range level 2 (TAR2), and coefficient of variation (CV).
Results:
All packages were compared with each other for all CGM metrics, and most of them had statistically significant differences for at least some metrics. All tools were equivalent to AGP for mean glucose, TIR, TAR, TAR1, and TAR2 within ±2 mg/dL, ±2%, ±1%, ±1% and 1%, respectively. CDGA, Glyculator, cgmanalysis, and iglu were not equivalent to AGP for CV within ±1%. All tools were equivalent to DC for mean glucose, TIR, and TAR2 within ±2 mg/dL, ±2%, and ±1%, respectively. Glyculator was not equivalent for TAR1, TAR, and CV. CGDA, cgmanalysis, and iglu were not equivalent to DC for TAR1 and TAR. EasyGV and GLU were not equivalent for TAR within ±1%.
Conclusions:
CGM analysis programs reported CGM metrics statistically differently, but these differences may not be applicable in clinical practice. The equivalence test also confirmed that the differences are negligible for TIR and mean glucose, while they can be important for hyperglycemic ranges and CV. A standardization for CGM data handling and analysis is necessary for clinical studies reporting CGM-generated outcomes.
Introduction
Continuous glucose monitoring (CGM) has been increasingly used in clinical practice and studies. 1,2 The International Consensus defined CGM metrics and suggested targets in 2017 3 and 2019, 4 respectively. In 2023, different CGM metrics were defined as core endpoints for clinical trials. 5 Some of the newly defined CGM metrics in the 2023 Consensus are not reported in the International Diabetes Center’s Ambulatory Glucose Profile (AGP) 6 and CGM manufacturer reports. In addition, commercially available CGM software algorithms are proprietary; therefore, using third-party statistical packages in CGM data analysis is necessary.
Handling large CGM data is challenging in clinical trials, and a more robust analysis of CGM data requires using different methods. Various statistical packages were developed in R, MathLab, Excel, and other coding platforms. 7,8 The packages have different features, such as reporting different CGM metrics, detecting data gaps, interpolation of missing data, excluding certain days, and data cleaning. However, these data-handling steps were not standardized, and packages use different methods and criteria. Although some statistical packages were evaluated for their performances individually, 9 they were not compared to the AGP, the suggested reporting platform by the International Consensus. 4 CGM metrics and goals were well-defined for clinical practice and studies by the International Consensus; 3,4 however, there has been no consensus on how to standardize CGM data handling and analysis. In this study, we compared different statistical packages that are used for the analysis of CGM data to the AGP. We hypothesize that using different CGM analysis programs to analyze the same CGM data may report different CGM metrics.
Methods
Adult CGM users at the Barbara Davis Center for Diabetes from February 2020 to June 2022 were included in this study. Inclusion criteria were having type 1 diabetes (T1D) and using the same CGM model (Dexcom, G6, Dexcom Inc., San Diego, CA) and the same automated insulin delivery (AID) system (t:slim X2 with Control IQ technology, Tandem Diabetes, San Diego, CA). Demographics (age, sex, race, ethnicity, diabetes duration) were collected from electronic medical records. Up to 90 days of CGM raw data were collected from Dexcom Clarity (DC) (Dexcom, Inc.). As suggested by the International Consensus, CGM data of at least 14 days with 70% completeness were included in this analysis. 4 Percent time in 70–180 mg/dL range (time in range [TIR]), time above 180 mg/dL range (time above range [TAR]), time in 180–250 mg/dL (time above range level 1 [TAR1]), time above 250 mg/dL (time above range level 2 [TAR2]), mean sensor glucose, standard deviation (SD), coefficient of variation (CV), glucose management indicator (GMI), and sensor usage were collected from DC and AGP v5.0 reports and from the same time interval of raw data. Since DC does not report CV but mean sensor glucose and SD, we calculated it using CV = 100 × SD/mean sensor glucose. AGP and DC 10 report percent time below 70 mg/dL (time below range [TBR]) and time below 54 mg/dL (TBR2) metrics as “<1%” if the value is <1%, and they do not report absolute numbers. Thus, AGP and Dexcom reports were not included in the analyses for TBR metrics.
We found 19 statistical packages for CGM analysis: EasyGV, 11 CGM-GUIDE, 12 GVAP, 13 Tidepool platform, 14 CGManalyzer, 15 MAGECAA, 16 cgmanalysis, 17 GLU, 18 Cgmquantify, 19 iglu, 20 KAMOGAWA, 21 CGMShiny, Glucodensity, 22 CGDA, 23 CGMStatsAnalyser, 24 CGMTSA, rGV, 25 AGATA, 26 and Glyculator. 7,27 Among them, 13 of them can calculate at least six CGM metrics defined by the International Consensus (EasyGV, CGM-GUIDE, GVAP, Tidepool Platform, cgmanalysis, GLU, iglu, CGMshiny, CGDA, CGMStatsAnalyzer, rGV, AGATA, and Glyculator). CGM-GUIDE was not publicly available and was not included in this study. CgmAnalyzer R package and CGMStatsAnalyzer could not process the Dexcom raw data format and were not included. GVAP did not allow exporting of results and was not included in the analysis. AGATA was excluded from the study due to a MATLAB-dependent work environment. CGMshiny was excluded due to performance issues and errors during data processing. Raw data could not be uploaded to Tidepool and rGV. Therefore, six statistical packages were included in the analysis in comparison to AGP and DC. The AGP analysis and method were initially developed by Mazze et al. 28 and then key parts of the AGP concept and method were introduced by Rodbard et al. 29 The International Diabetes Center’s AGP v5.0 reports were used for comparison.
Deidentified CGM raw data were analyzed with CDGA v0.8.2, cgmanalysis v2.7.7, iglu v3.5.0, and GLU v0.2.0R software packages, with EasyGV v10.0 Microsoft Excel micro, and with Glyculator 3.0 webtool. In all tools, default settings were used for interpolation and processing of data. If the default glucose unit was mmol/mol, the unit setting was changed to mg/dL. Although tools provide many different CGM metrics, only the CGM metrics that were collected from DC and AGP reports were included in this analysis (Table 1), excluding TBR as previously outlined.
International Consensus Metrics Produced by Continuous Glucose Monitoring Software Packages
AGP, Ambulatory Glucose Profile; CGM, continuous glucose monitoring.
Cutoffs need to be entered manually.
Pregnancy cutoffs (63–140 mg/dL) are available.
Statistical analysis
Continuous data are presented as mean and SD and categorical data as numbers and percentages. Metrics were compared using the two one-sided t-test (TOST) method to determine equivalence. Each tool was tested for clinical equivalence with AGP and Dexcom reports separately. For the equivalence test, the acceptable range of deviation was set as ±2 mg/dL for mean glucose, ±2% for TIR, and ±1% for TAR, TAR1, TAR2, and CV. Differences between packages and AGP and Dexcom were examined for mean glucose and TIR using Bland–Altman plots to evaluate bias. Limits of agreement were calculated based on 1.96 SDs above the mean value. GraphPad Prism v10.2 and SAS were used for statistical analysis. P value <0.05 was considered significant.
Results
Out of 152 patients with T1D, the mean age was 39.6 ± 14.1 years, diabetes duration was 22.2 ± 14.1 years, 66% were female, 87% had private insurance, and 93% were non-Hispanic White. Their latest point-of-care A1c was 7.2 ± 1.2%. CGM usage was 93.2% ± 5.5% in AGP and 95.5% ± 5.6% in DC reports. CGDA included 21,184 ± 4656 sensor reads/patient and 73.6 ± 16.2 days/patient with 92.3 ± 5.6% completeness of data. Cgmanalysis included 21,282 ± 4505 sensor reads/patient and 81.4 ± 15.9 days/patient with 89.3% ± 7.4% completeness of data. Glyculator 3.0 included 47.6 ± 25.2 days/patient with 97.5% ± 1.6% completeness of data, and GLU included 57.4 ± 15 days/patient of data. EasyGV included 22,336 ± 4539 sensor reads/patient. Iglu did not report sensor reads or included days/completeness of data.
Mean TBR and TBR2 could not be calculated for AGP and DC due to not reporting absolute numbers by AGP and DC. Both report TBR metrics as <1% and no numerical data if TBR values <1%. On the other hand, all CGM analysis programs report numerical numbers if TBR is <1%. EasyGV did not report GMI, TAR1, and TAR2, and GLU reported only TBR, TIR, and TAR.
To understand if the packages had clinically meaningful differences, all packages were compared with the AGP for equivalence using the TOST method according to predetermined agreement cutoffs (Table 2). DC was not equivalent to AGP for TAR1 and TAR within ±1% but was equivalent to AGP for all other metrics. All other tools were equivalent to AGP for mean glucose, TIR, TAR, TAR1, and TAR2 within ±2 mg/dL, ±2%, ±1%, and 1%, respectively. CDGA, Glyculator, cgmanalysis, and iglu were not equivalent to AGP for CV within ±1%.
Comparison of All Continuous Glucose Monitoring Packages to Ambulatory Glucose Profile and Dexcom Clarity c
The acceptable range of deviation was set as ±2 mg/dL for mean glucose, ±2% for TIR, and ±1% for TAR, TAR1, TAR2, and CV.
AGP, Ambulatory Glucose Profile; CGM, continuous glucose monitoring; CV, coefficient of variation; TAR, time above range; TAR1, time above range level 1; TAR2, time above range level; TIR, time in 70–180 mg/dL range.
Not equivalent to AGP.
Not equivalent to Dexcom Clarity.
Selected programs may handle data differently, discrepancies are likely due to the algorithms used to select subsets of data, rather than the equations or calculations for the various parameters.
All packages were also compared with DC for equivalence (Table 2). All tools were equivalent to DC for mean glucose, TIR, and TAR2 within ±2 mg/dL, ±2%, and ±1%, respectively. Glyculator was not equivalent for TAR1, TAR, and CV. CGDA, cgmanalysis, and iglu were not equivalent to DC for TAR1 and TAR. EasyGV and GLU were not equivalent for TAR within ±1%. For metrics in Table 2, we plotted the differences between each package and AGP (Fig. 1) and each package and DC (Fig. 2).
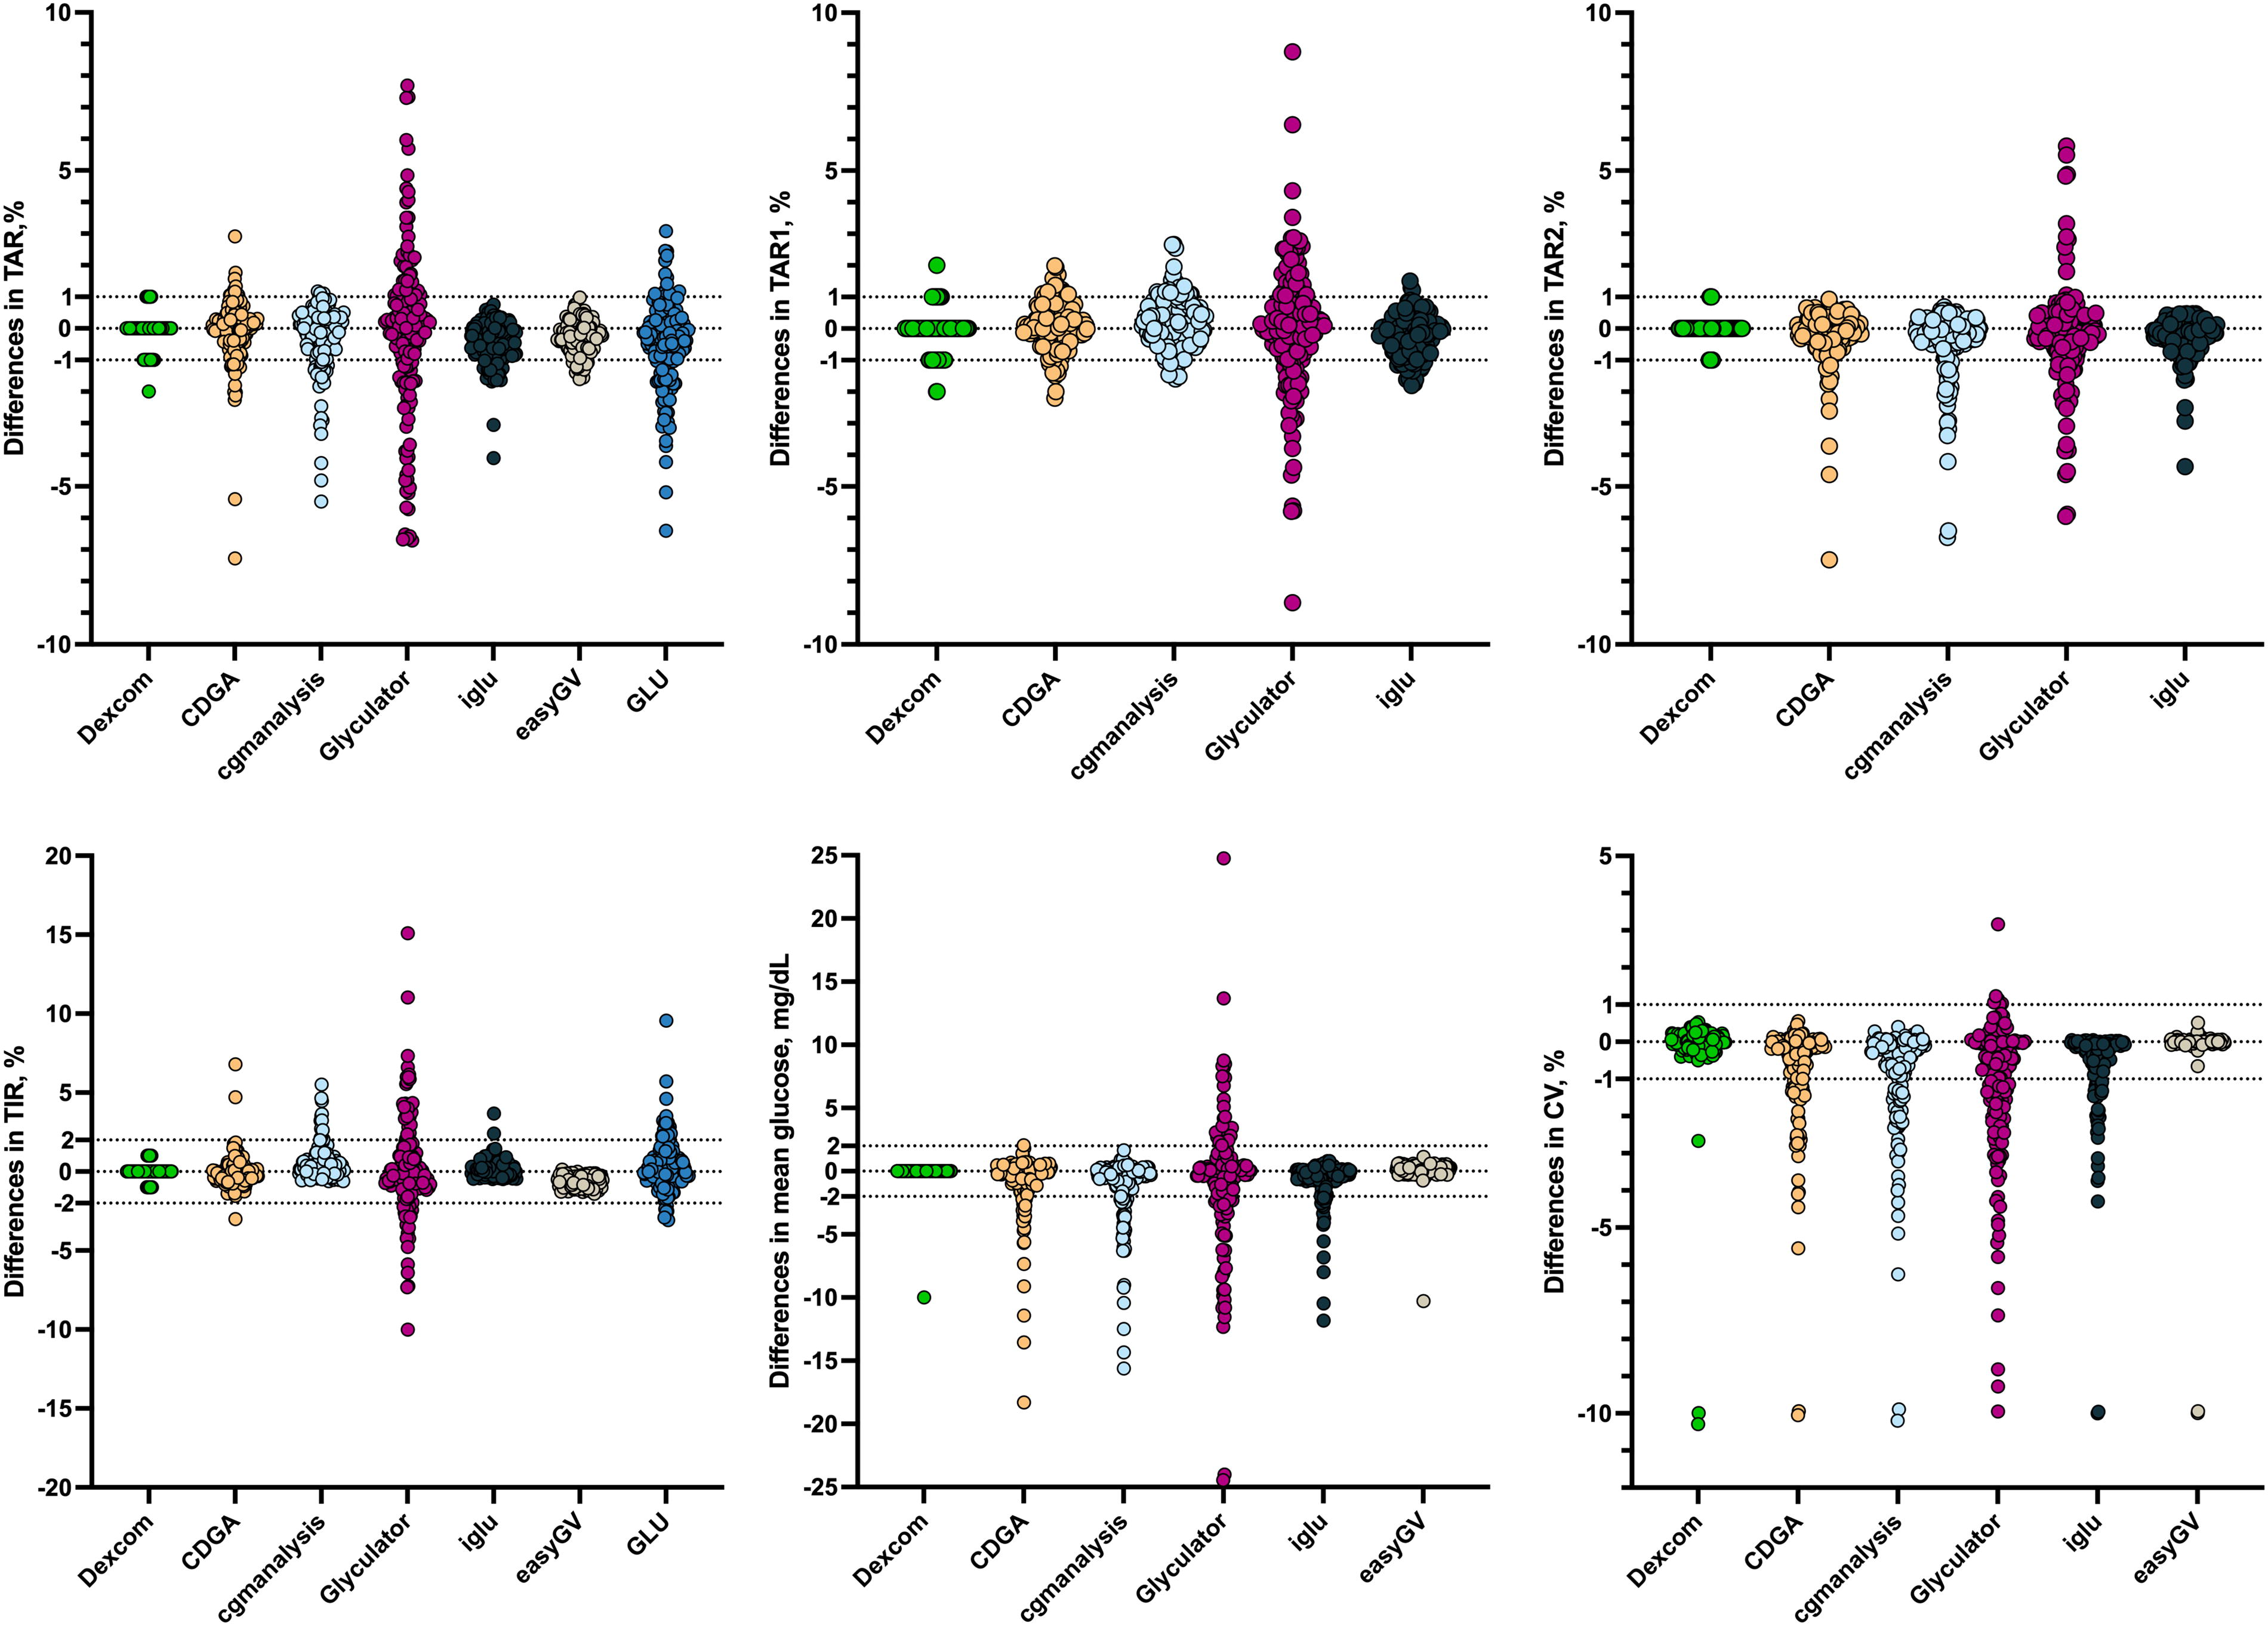
Differences between AGP and statistical packages (package—AGP). Each dot represents a patient’s difference between AGP and given package for given metric. The cutoffs used in the equivalence test are shown as dotted lines. AGP, Ambulatory Glucose Profile.
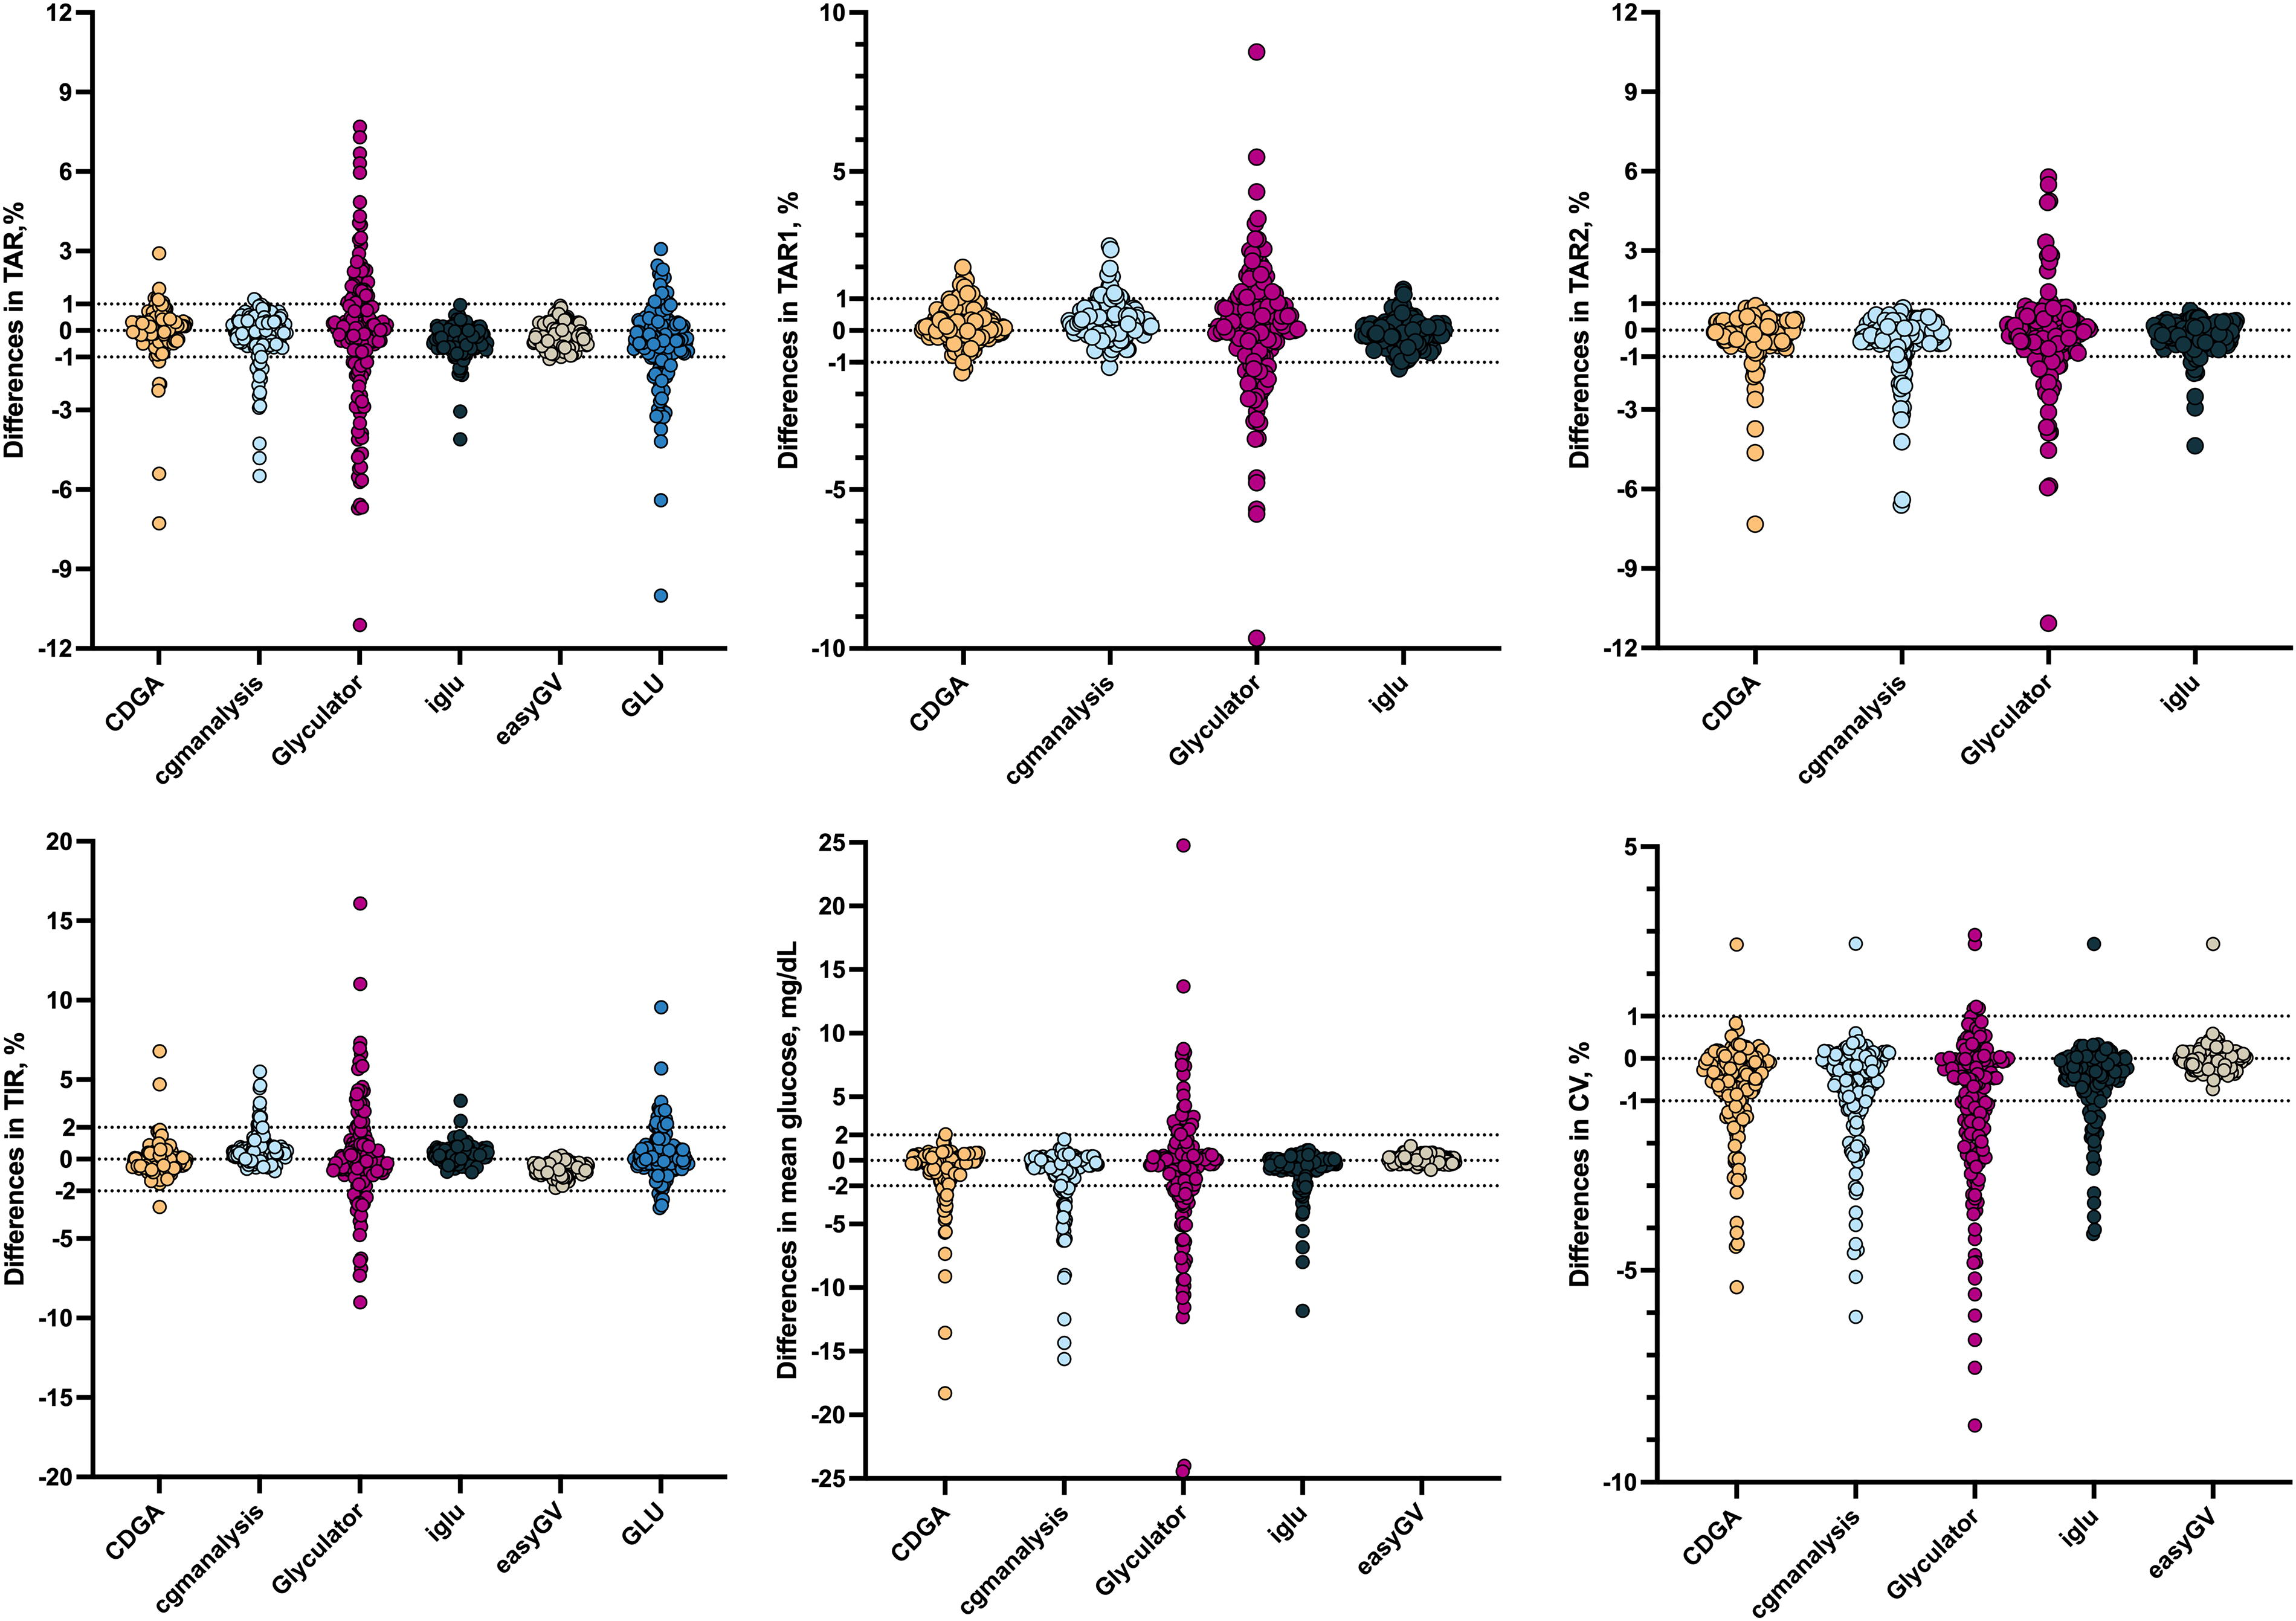
Differences between Dexcom report and statistical packages (package—Dexcom). Each dot represents a patient’s difference between Dexcom report and given package for given metric. The cutoffs used in equivalence test are shown as dotted lines.
For TIR and mean glucose, Bland–Altman plots for each package vs. AGP are presented in the Supplementary Material. As shown in Supplementary Figure S1, the Y axis is the mean difference in the TIR for each method vs. AGP, and the X axis is the pooled mean for TIR. The solid blue line is set at 0, while the solid red line is the mean difference. The dashed red lines are the upper and lower limits of agreement based on a 1.96 SD difference. As shown in Supplementary Figure S1A, differences in TIR for AGP vs. CDGA were centered around the pooled mean, and most values (96.7%) were within the limits of agreement (Supplementary Table S1). Similarly, in Supplementary Figure S1B, differences in TIR for AGP vs. Glyculator 3.0 were centered around the mean, and 95.4 were within the limits of agreement (Supplementary Table S1). As shown in Supplementary Figure S1C, AGP TIR tended to be lower by −0.55% than cgmanalysis TIR, with a confidence interval that excludes 1 and 94.1% within limits of agreement. TIR calculated by AGP was higher than EasyGV TIR by 0.63% (95% CI: 0.57–0.68), as shown in Supplementary Table S1, but 100% of the differences were within the limits of agreement. Both iglu (Supplementary Fig. S1E) and GLU (Supplementary Fig. S1F) TIR values were higher than AGP TIR values, but 96.7% and 96.1% of values were within the limits of agreement. Comparisons of mean glucose between AGP and the packages with mean glucose calculated are shown in Supplementary Figure S2. The CDGA package mean glucose was centered around the mean with most measures (96.7%; Supplementary Table S1) within the limits of agreement (Supplementary Fig. S2A). Similarly, Glyculator 3.0 and EasyGV had mean glucose differences with AGP mean glucose values that were centered around the mean (Supplementary Fig. S2B and D), and 96.1% and 99.3% of the differences were within the limits of agreement, respectively. CGManalysis and iglu both had mean glucose values that were lower than the AGP mean glucose (Supplementary Table S1), although, for both packages, 96.1% of mean glucose values were within the limits of agreement.
Discussion
In this study, we compared AGP, DC, and six commonly used CGM analysis tools to assess common CGM metrics. Although the differences were not clinically meaningful, statistically significant differences may raise a concern for the reproducibility of research. Among these tools, only AGP and DC are used in clinical settings, and they were similar for all metrics except for TAR1 and TAR. The equivalence test also confirmed that the differences are negligible for TIR and mean glucose, while they can be important for hyperglycemic ranges and CV. Further analysis using Bland–Altman plots showed that TIR was within the limits of agreement for at least 95% of values for all packages except cgmanalysis, and mean glucose values were within the limits of agreement for >95% of values for all packages tested. The Bland–Altman analysis showed some bias in TIR, with AGP values lower than those generated by the CGM packages for cgmanalysis, iglu, and GLU, and AGP TIR values higher than those generated by EasyGV. For mean glucose, bias was demonstrated by cgmanalysis and iglu, with AGP mean glucose being higher than the mean glucose generated by the package.
The discordances are probably due to raw data handling, such as excluding days with insufficient data, interpolation of data gaps, trimming of first and last days, smoothing, and rounding. There is no consensus on how to handle CGM raw data, and all packages used different methodologies to fill data gaps or trim the data. Although some packages allow us to determine interpolation and inclusion/exclusion criteria, we used default settings to observe the effect of lack of standardization in these steps. For example, in the default settings comparison, Glyculator included 47 days on average, whereas cgmanalysis included 81 days from the same 90-day CGM data for analysis, which proves unstandardized data inclusion and processing. This raises concerns for CGM research since researchers can use raw data and report the downloaded period; however, their results may stem from a much shorter period with strict inclusion or exclusion criteria. In this regard, most studies do not explicitly explain their data obtainment, processing, and resulting steps in methodology.
The rounding of numbers in AGP and DC is another concern for research since statistical packages provide numbers with decimals, and the difference in decimal level would result in small but significant differences in large datasets. Neither report includes any numerical results for hypoglycemia metrics.
Here, we observed differences in reporting among different statistical packages while keeping confounders as minimal as possible, such that all patients were using the same CGM model and the same insulin pump with the same algorithm. We also excluded <14 days or <70% completeness of raw data. CGM raw data with less completeness or fewer days may result in more discordant results since data handling would become more important regarding increased data gaps and incomplete days. Using the same methodology is crucial in CGM data analysis since differences in reporting CGM metrics may not be significant for clinical care but can be for research. For example, different programs may report TIR and TBR differently for the same dataset, and a patient may have 69% TIR and 4% TBR calculated by one program and 71% TIR and 3% TBR by another one. If the study aims to report in a large data set how many patients met International Consensus goals for CGM metrics such as >70% TIR and/or <4% TBR, the number of patients will differ.
The strengths of this study include comparing a large number of patients that use the same CGM and AID with all available CGM analysis programs that report all CGM metrics reported by the AGP. The limitations of this study include not being able to analyze hypoglycemia metrics due to reporting differences among AGP, DC, and CGM analysis packages and using the default settings of each CGM analysis package, setting up an arbitrary acceptable range of deviation, and not including other CGM metrics that are not reported in the AGP, such as MAGE.
In conclusion, statistical packages for CGM analysis reported clinically nonsignificant but statistically significant differences for hyperglycemia metrics and CV. Standardization of CGM data interpolation and missing data handling criteria may be necessary for future studies, and there is a need for a detailed explanation of CGM data processing steps in the published studies. Studies reporting CGM data should give details of CGM data handling and analysis. As a next step, the International Consensus should standardize CGM data processing and analysis.
Footnotes
Acknowledgments
The authors thank the patients who shared their CGM data with the clinic. The authors had requested Drs. Richard Bergenstal and Tomas Walker from the International Diabetes Center and Dexcom, respectively, to clarify the TBR reports for AGP and Dexcom regarding reports of TBR <1% and appreciate both for their responses. They were not involved in data analysis or in the study.
Authors’ Contributions
Conception and design of the study, acquisition, analysis, and interpretation of data, drafting the paper, and final approval of the paper are done by all authors: K.E.K., J.S.B., and H.K.A. H.K.A. has full access to all study data and takes responsibility for the integrity of the data and the accuracy of the data analysis.
Author Disclosure Statement
K.E.K. and J.S.B. disclose no conflict of interest; H.K.A. discloses receiving, through the University of Colorado, research support and consultation fees from Tandem Diabetes Care, Dexcom, and Medtronic.
Funding Information
There is no funding for this study.
Supplementary Material
Supplementary Figure S1
Supplementary Figure S2
Supplementary Table S1
References
Supplementary Material
Please find the following supplemental material available below.
For Open Access articles published under a Creative Commons License, all supplemental material carries the same license as the article it is associated with.
For non-Open Access articles published, all supplemental material carries a non-exclusive license, and permission requests for re-use of supplemental material or any part of supplemental material shall be sent directly to the copyright owner as specified in the copyright notice associated with the article.