
Abstract
The binding of vincristine with DNA has been investigated using Fourier transform infrared spectroscopy. Various changes in the double helical structure of DNA after addition of vincristine have been examined. It is evident from Fourier transform infrared results that vincristine–DNA interaction occurs through guanine and cytosine base pairs. External binding of vincristine with phosphate backbone of the DNA is also observed. Vincristine perturbs guanine band at 1714 cm−1, cytosine band at 1488 cm−1, and the phosphate vibrations at 1225 and 1086 cm−1. The UV–visible spectra of vincristine–DNA complex show hypochromic and bathochromic shifts, indicating the intercalation of vincristine into the double helical structure of DNA. Both intercalative and external binding modes are observed for vincristine binding with DNA, with an estimated binding constant K = 1.0 × 10³ M−1.
Introduction
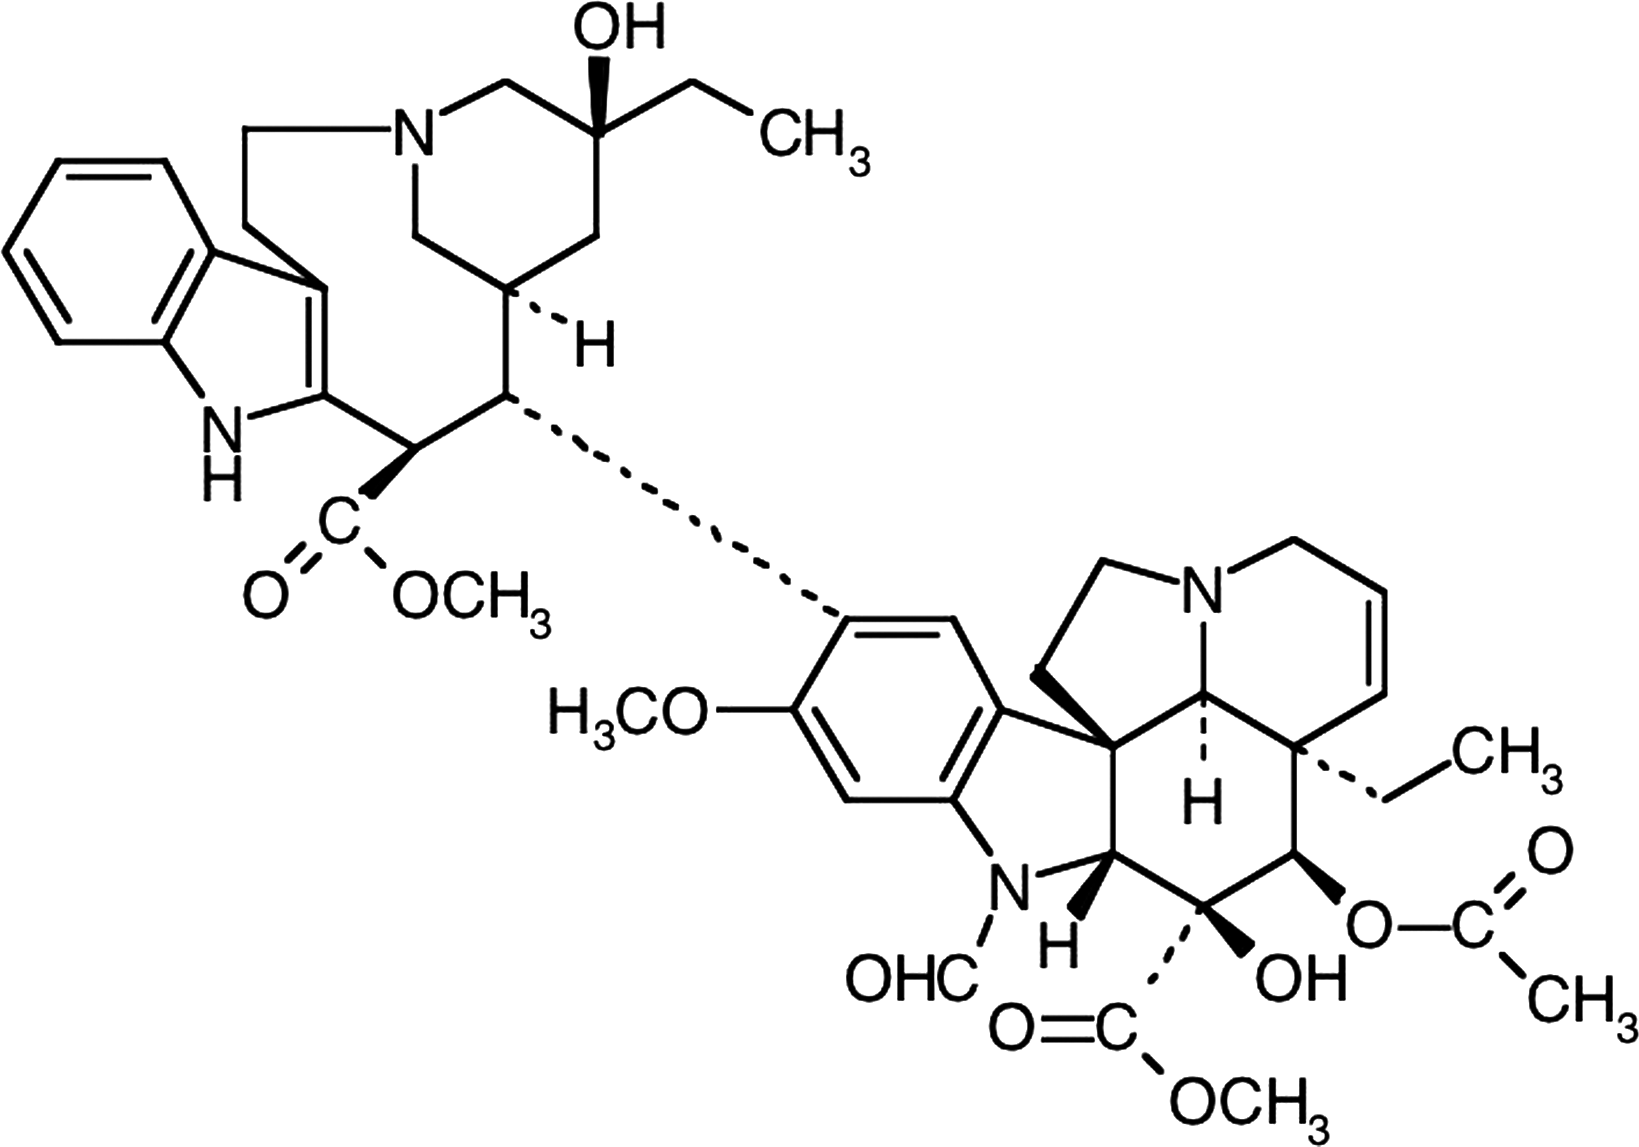
Chemical structure of vincristine.
The mode of action of vincristine inside the cell has not been completely delineated. Evidence is available from in vitro studies that vincristine inhibits spindle formation (Gidding et al., 1999). It binds to the tubulin monomers, preventing the formation of spindle microtubules and disabling the cell's mechanism for aligning and moving the chromosomes. Vincristine stops the separation of the duplicated chromosomes and prevents cell division (Rowinsky and Donehower, 1991). Vincristine is found to interfere with RNA synthesis (Tachihara, 1997). It has also been shown to stop cell reproduction in metaphase (Hiller et al., 1982). Though vincristine is effective against many forms of cancer, several side effects are also associated with it. It is known to cause neuropathy (Weisfeld-Adams et al., 2007). Adverse effects of vincristine are reversible and dose related. As vincristine is a potent anticancer agent and is the cause of many adverse effects, detailed study on its intracellular action requires attention. Thus, study on its reaction with cell molecules such as DNA becomes biologically important. Some studies report about its ability to bind DNA fragments. Zhu et al. (2004) reported about the ability of vincristine to cause structural variations in linear plasmid DNA. Tang et al. (2003) indicated about its slight interaction with DNA. However, detailed information on the effect of vincristine on the structure of DNA remains unclear.
In recent times, infrared spectroscopy is emerging as an efficient tool in life sciences, having applications ranging from characterizing small biomolecules to medical diagnosis. Fourier transform infrared (FTIR) spectroscopy is a major tool to characterize the nature of drug–biomolecule complexation and the effects of such interaction on the structure of biomolecules (Neault et al., 1996; Neault and Tajmir-Riahi, 1996; Nafisi et al., 2007; N'soukpoe-Kossi et al., 2008; Nafisi and Norouzi, 2009; Jangir et al., 2010). In view of the biochemical actions of vincristine, we studied the effect of vincristine on the structure of DNA double helix to understand the peculiarities of vincristine–DNA interaction by utilizing the potential of infrared spectroscopy. Binding mode and binding constant for vincristine–DNA complex were determined.
Materials and Methods
Materials
Vincristine sulfate and highly polymerized type I calf thymus DNA (sodium content 6%) were purchased from Sigma-Aldrich chemicals. Purity of DNA was determined by recording the UV absorbance at 260 nm (A 260) and 280 nm (A 280). The A 260/A 280 ratio of DNA sample was found to be 1.82, suggesting the purity of DNA. Other chemicals and reagents were of analytical grade and used as supplied. For the preparation of buffer solution and vincristine solutions, ultrapure water was used.
Preparation of solutions
Calf thymus DNA 1% (w/v) was prepared in 10 mM Tris-HCl buffer (pH 7.4) and kept at 8°C for 24 h. The solution was continuously stirred at frequent intervals to ensure the homogeneity of DNA solution. Final concentration of the DNA stock solution was measured spectrophotometrically using excitation coefficient of 6600 cm−1 M−1 (Vijayalakshmi et al., 2000). The final concentration of DNA stock solution was 10 mM. The vincristine solution was prepared in ultrapure water. Solutions of vincristine and DNA were prepared by mixing different concentrations of vincristine with a constant concentration of DNA. For FTIR studies, vincristine–DNA complex solution was prepared, so as to attain the vincristine:DNA molar ratios (r) of 1:80, 1:40, and 1:20 with varying concentration of vincristine and a constant concentration of DNA (5 mM). UV–visible studies were carried out using vincristine concentrations ranging from 0.15 to 0.5 mM and DNA concentration of 2.5 mM.
FTIR spectroscopy
FTIR spectra were recorded with a Varian 660-IR spectrophotometer, equipped with deuterated triglycine sulphate detector and KBr beam splitter. Spectra were collected in 10 mM Tris-Hcl buffer as a solvent with pH of 7.4. Liquid samples were tightly packed in a liquid cell made up of two ZnSe windows. The experiment was performed at an ambient humidity of 45% relative humidity (RH). Then, 256 scans were recorded for each sample in the spectral range of 4000–650 cm−1, with a resolution of 4 cm−1. Background spectra were collected before each measurement. A spectrum of buffer solution was recorded and subtracted from the spectra of DNA and vincristine–DNA complexes. A satisfactory buffer subtraction was considered to be achieved when the intensity of water combination band at about 2200 cm−1 became zero in the spectra of DNA and vincristine–DNA complexes.
UV–visible spectroscopy
The UV–visible spectra were recorded on a Zeiss spectrophotometer (Specord M 500). Quartz cuvettes of 1 cm path length were used for measurement. Spectra were recorded for free DNA and for various vincristine–DNA complex solutions.
The constant for the binding of vincristine with DNA was calculated according to the methods described by Kanakis et al. (2009), assuming that only one type of interaction occurred between vincristine (V) and DNA (D) in aqueous solution and that only one type of complex (DV) forms. It is also assumed that the substrate and ligand follow Beer's law for the absorbance of light.
The absorbance of DNA solution at its total concentration with a pathlength (l) of 1 cm is given as follows:
where ɛ
D is the molar absorptivity of DNA. The absorbance of solution containing the total concentration of DNA in the presence of total concentration of vincristine is given as follows:
where [D] is the concentration of uncomplexed DNA, [V] is the concentration of uncomplexed vincristine, [DV] is the concentration of vincristine–DNA complex, and ɛ
V is the molar absorptivity of vincristine. After combining with the mass balance of DNA and vincristine, the absorbance equation can be written as follows:
where Δɛ
DV = ɛ
DV − ɛ
D − ɛ
V. The absorbance of solution measured against the total concentratin of vincristine as reference is calculated as follows:
The stability constant for the formation of complex (DV) can be given as follows:
Combining equations (4) and (5),
where ΔA = A − A 0.
From the mass balance equation D
t = [D] + [DV], we get [D] = D
t/(1 + K
DV [V]), which gives equation (7).
This shows the hyperbolic dependence of binding on free ligand concentration. Linear transformation of equation (6) is done by taking the reciprocal of each side of equation (7).
The double reciprocal plot of 1/ΔA versus 1/[V] is linear and the binding constant (K) can be estimated by calculating the ratio of the intercept to the slope.
Results and Discussion
FTIR spectroscopic analysis of vincristine–DNA complex
Base binding
Figure 2 shows the spectrum of free DNA and its complexes with vincristine. The band at 1714 cm−1 is attributed mainly to guanine in plane stretching vibrations. The band at 1669 cm−1 is mainly due to vibrations caused by thymine stretching. The bands at 1489 cm−1 denote cytosine base vibrations (Ghomi et al., 1990). Infrared bands observed in the spectrum of free DNA at 1714 cm−1 (guanine), 1669 cm−1 (thymine), and 1489 cm−1 (cytosine) are shifted to 1716, 1670, and 1488 cm−1, respectively, after the formation of vincristine–DNA complex. Second-order derivative spectra further shows the shifting of guanine and thymine bands toward higher wave number and cytosine band toward lower wave number (Fig. 3a). Shifting of these absorption bands is accompanied by increase in their vibrational intensity at all the three vincristine–DNA molar ratios examined. The positive bands observed in the difference spectra at about 1711, 1650, and 1490 cm−1 are due to increase in the intensity of guanine, thymine, and cytosine base vibrations, respectively (Fig. 4). Spectral changes observed for guanine and cytosine base vibrations may be attributed to vincristine interaction with DNA via G–C base pairs. These results are in corroboration of the behavior of reserpine, another indole alkaloid, which showed binding preference to G–C-rich DNA duplex (Wang et al., 2008). The absorption band at 1607 cm−1 due to adenine remains unchanged in terms of shifting and intensity upon vincristine complexation with DNA. Spectral features observed for adenine are indicative of no major vincristine interaction with DNA via adenine at all the concentrations of vincristine used for the experiment.
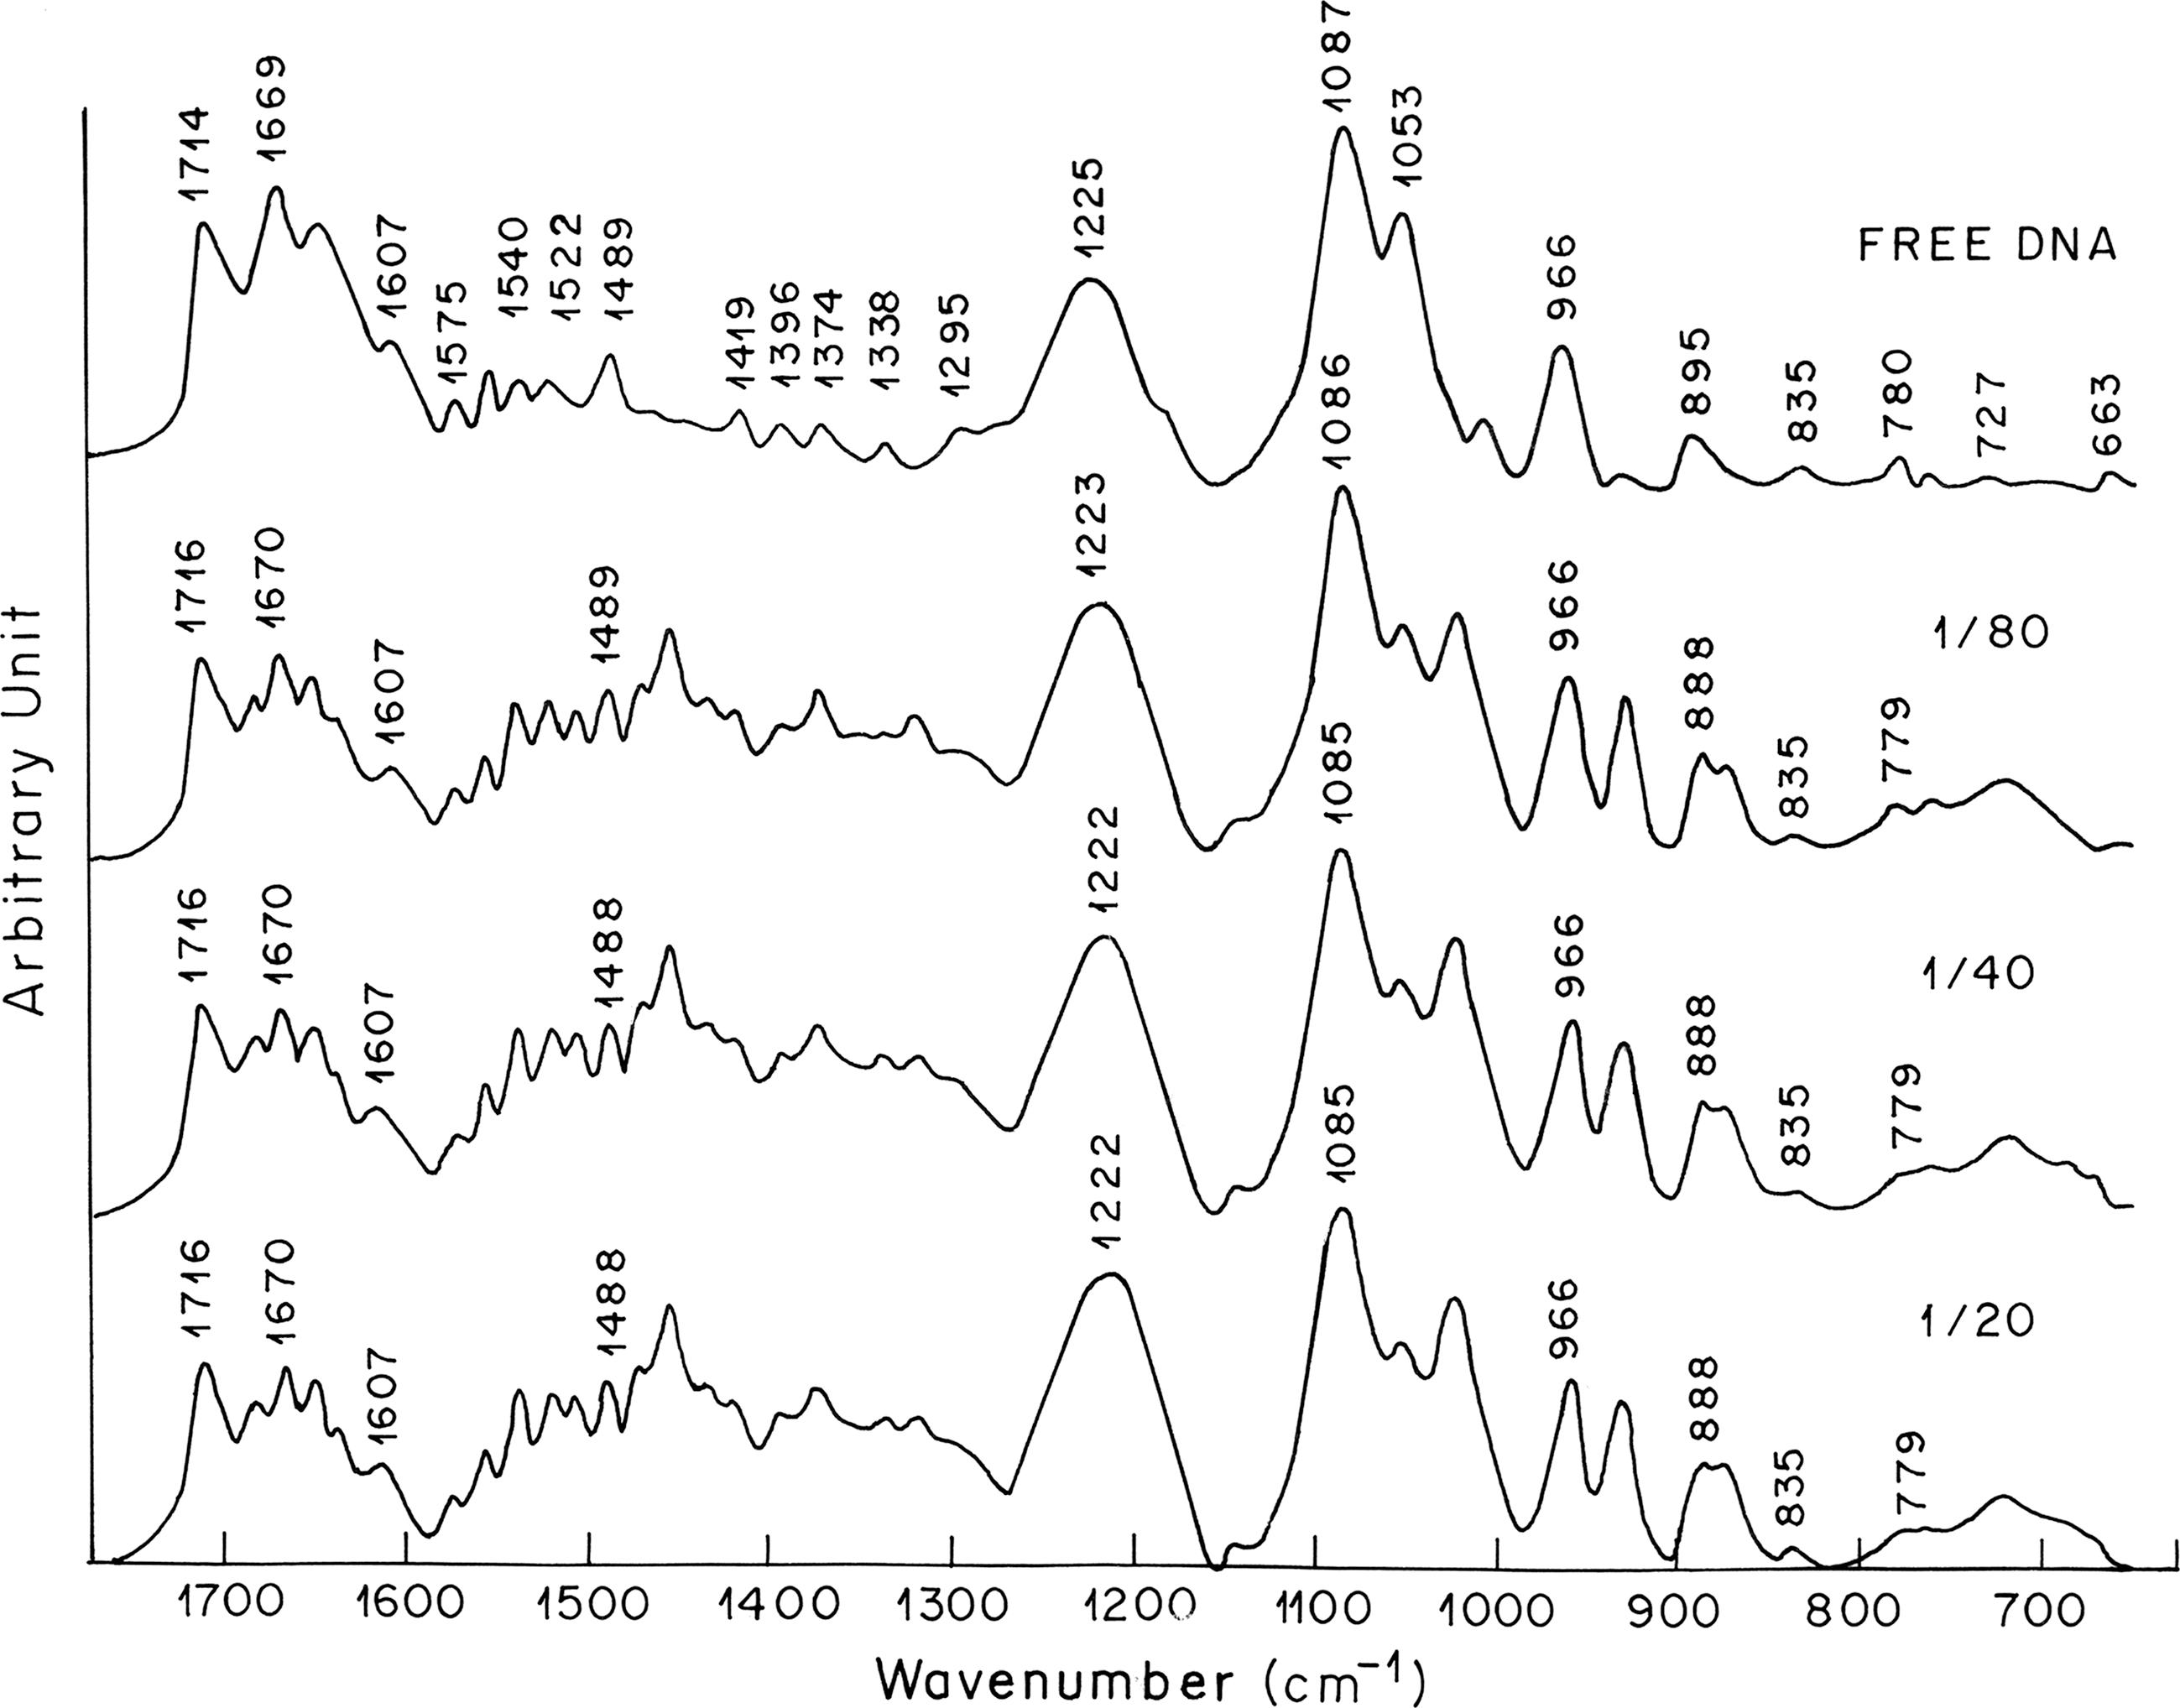
Fourier transform infrared spectra showing the region of 1700–600 cm−1 for free DNA and vincristine–DNA complexes at molar ratios of 1:80, 1:40, and 1:20.
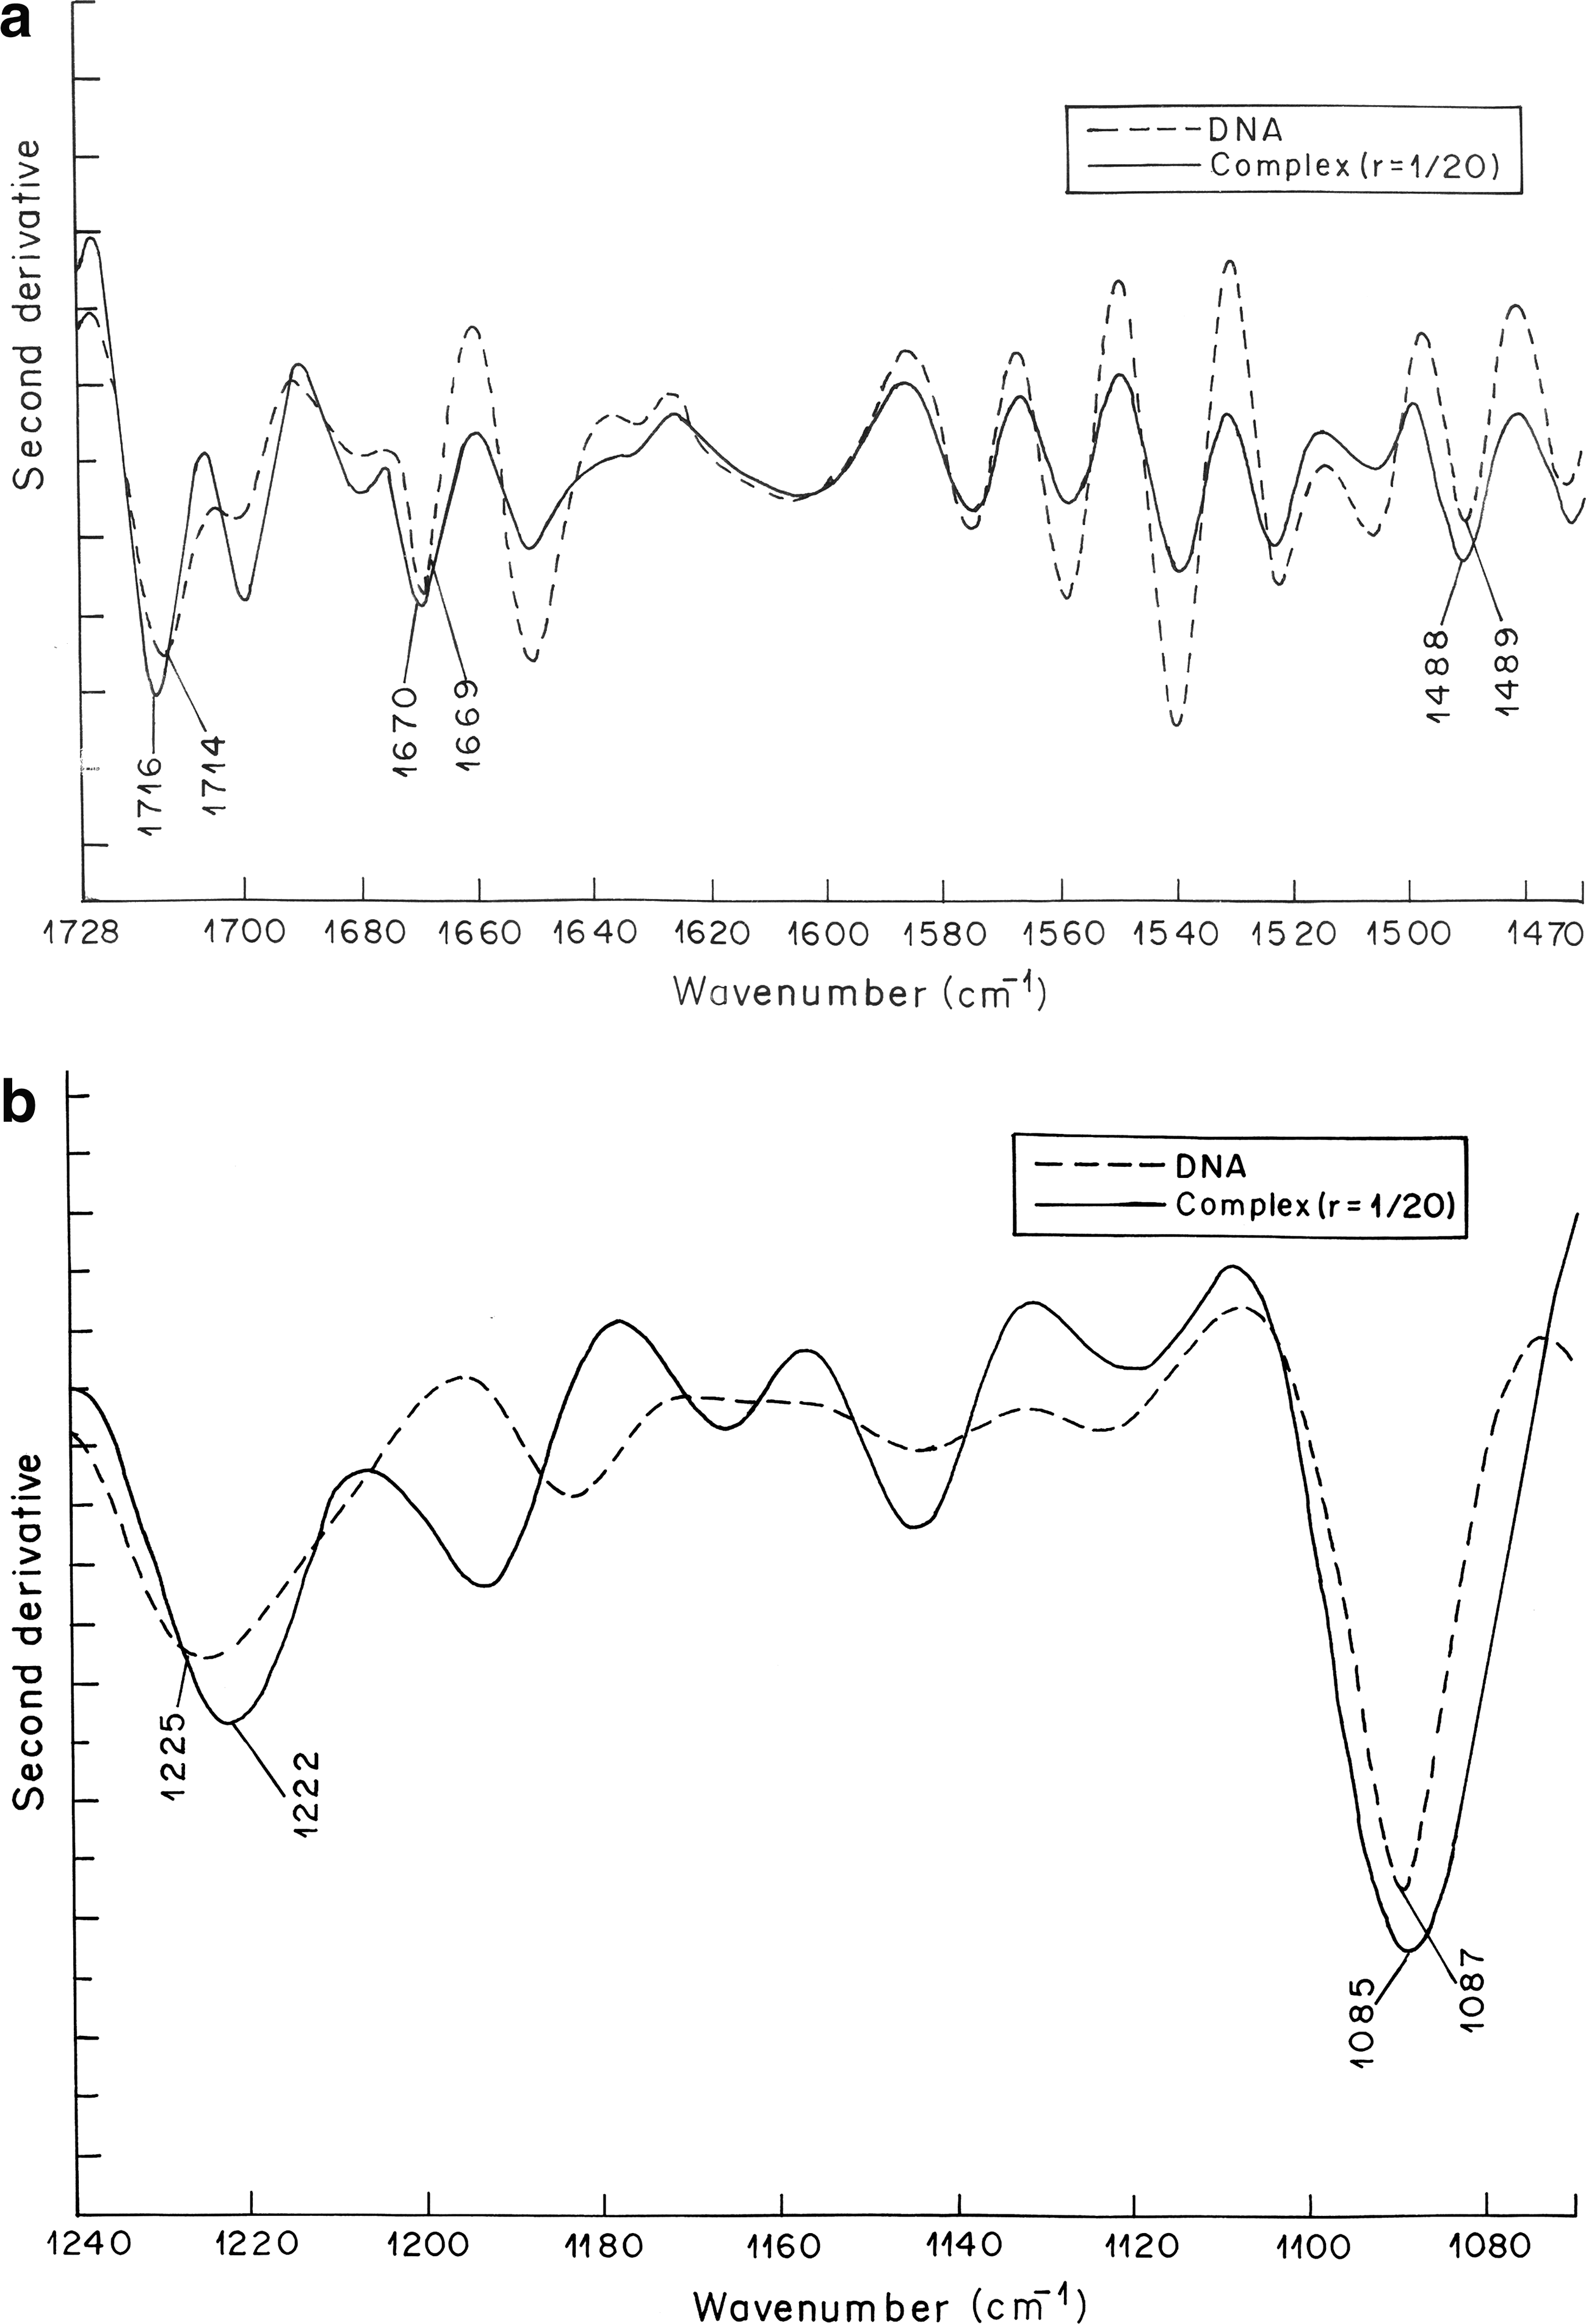
Second-order derivative spectra showing peak shifting in the region of (
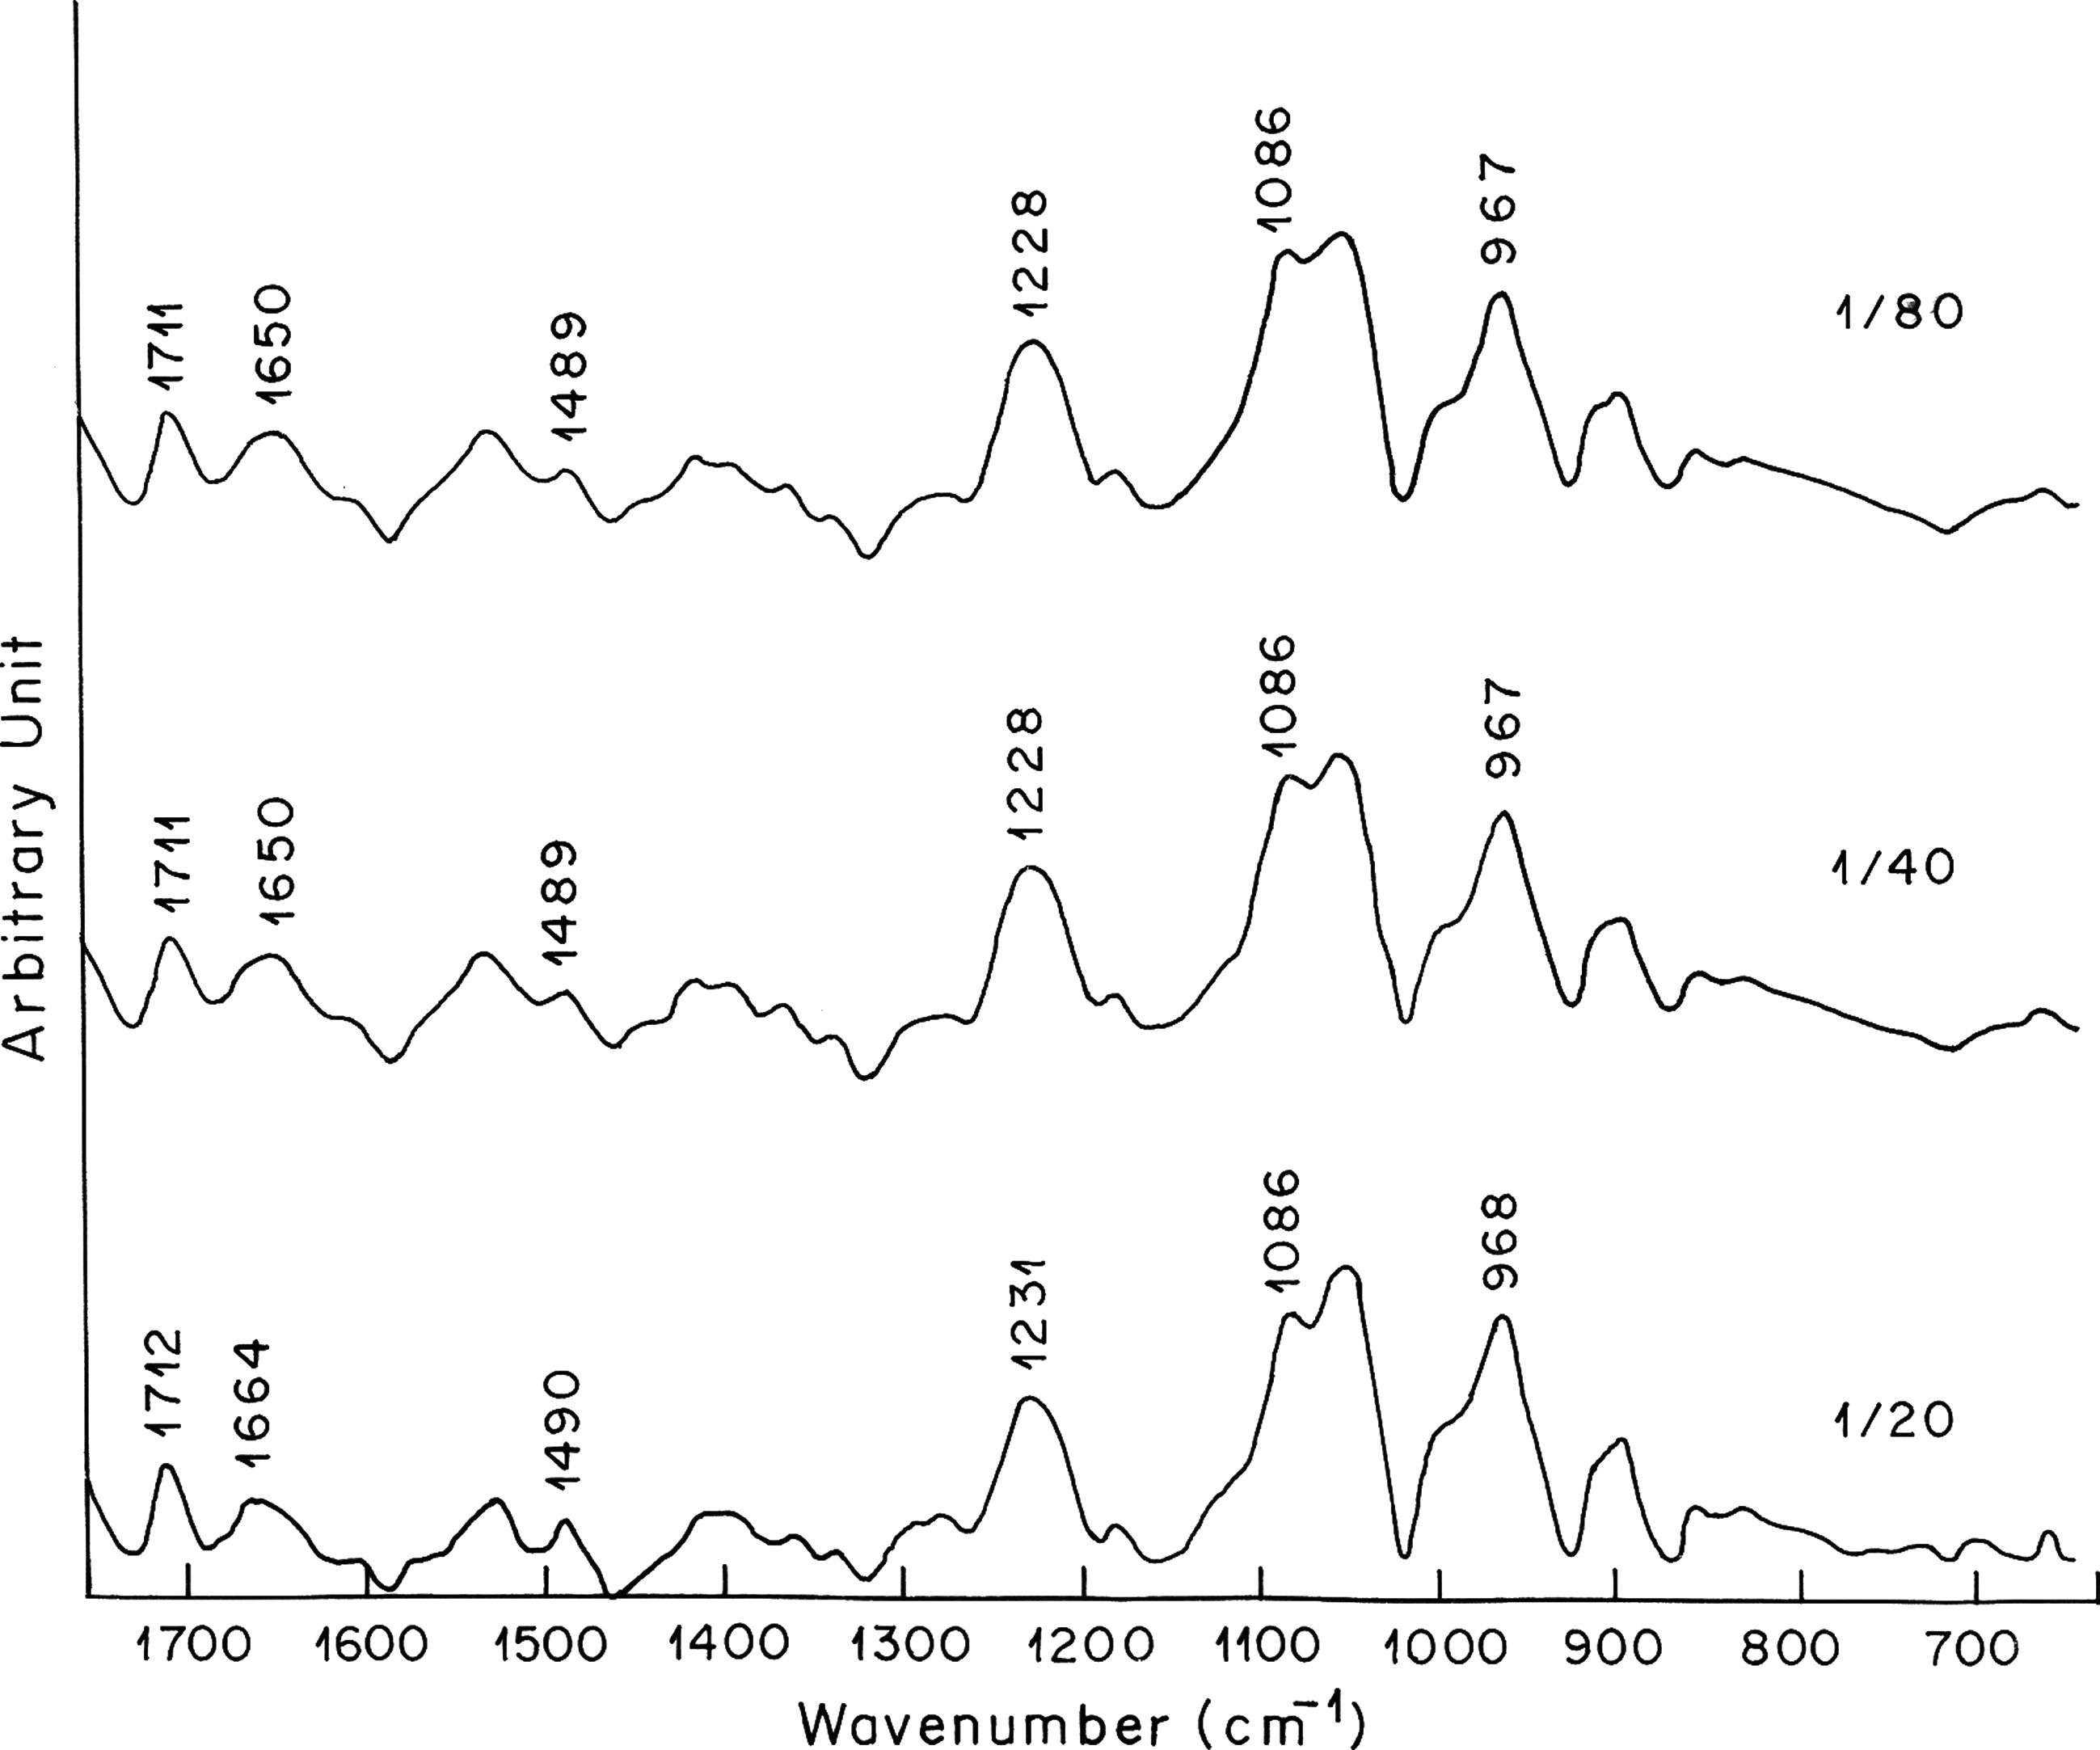
Difference spectra [(DNA solution + vincristine solution) − DNA solution] of vincristine–DNA complexes in the region of 600–1700 cm−1.
Phosphate binding
The phosphate asymmetric stretching at 1225 cm−1 and symmetric stretching at 1087 cm−1 in the spectrum of free DNA are shifted to 1223 and 1086 cm−1, respectively, when lower concentration of vincristine is complexed with DNA (r = 1:80; Fig. 2). Further shifting toward lower wave number (1222 cm−1 for asymmetric phosphate stretching and 1085 cm−1 for symmetric phosphate stretching) is observed when higher concentration of vincristine is complexed with DNA. The shifting of phosphate asymmetric and symmetric bands upon vincristine complexation with DNA becomes clearer in the second derivative spectra (Fig. 3b). The shifting of the asymmetric and symmetric phosphate bands is accompanied by noticeable increase in their vibrational intensity. The positive features at 1228, 1231, and 1086 cm−1 in the difference spectra are due to increase in the intensity of phosphate base vibrations (Fig. 4). These results suggest external binding of vincristine through phosphate backbone upon its interaction with DNA double helix.
DNA conformation
The vincristine complexation did not alter the DNA conformation. In a B-to-A transition, B DNA marker bands at 835 cm−1 due to phosphodiester mode and at 1710–1717 cm−1 due to guanine shift toward lower frequencies. The band at 1225 cm−1 due to symmetric phosphate vibrations shifts toward higher frequencies. In a B-to-Z conformational change, the band at 835 cm−1 displaces to 800 cm−1 and the band at 1710–1717 cm−1 appears near 1690 cm−1, whereas the band at 1225 cm−1 shifts toward 1215 cm−1 (Arakawa et al., 2000). The sugar phosphate band at 835 cm−1 exhibited no spectral shifting upon vincristine complex formation with DNA (Fig. 2). The changes observed in the bands at 1714 cm−1 and 1225 cm−1 are not indicative of DNA conformation change. However, minor spectral changes observed in the deoxyribose region 900–1000 cm−1 may be attributed to minor alterations in the sugar–phosphate geometry while DNA remains in the B state of conformation (Tajmir-Riahi et al., 1995; Ahmed et al., 2006).
UV–visible spectroscopic analysis of vincristine–DNA complex
Binding mode
Figure 5 shows the UV–visible spectra of free vincristine and its complex with DNA. Binding of vincristine to DNA exhibited hypochromic effect. The absorbance of vincristine is reduced after its complex formation with DNA. In addition to the decrease in absorbance, a 3-nm shift of the absorbance maxima (λ max) from 251 nm of free vincristine to 254 nm of complex is also observed (bathochromic shift). The hypochromic and bathochromic shifts are indicative of intercalation of vincristine into DNA double helix (Wu et al., 1998; Kanakis et al., 2007). The reduced absorbance of vincristine after binding with DNA (hypochromic shift) can be attributed to the hindrance caused by the double helical structure of DNA to the chromophores of vincristine to absorb light after intercalation. A small bathochromic shift observed in the UV–visible spectra of vincristine–DNA complexes can be attributed to the hydrophobic envelope provided by DNA duplex to vincristine after intercalation, which might affect the π − π* transitions of vincristine aromatic chromophores (Zhong et al., 2004).
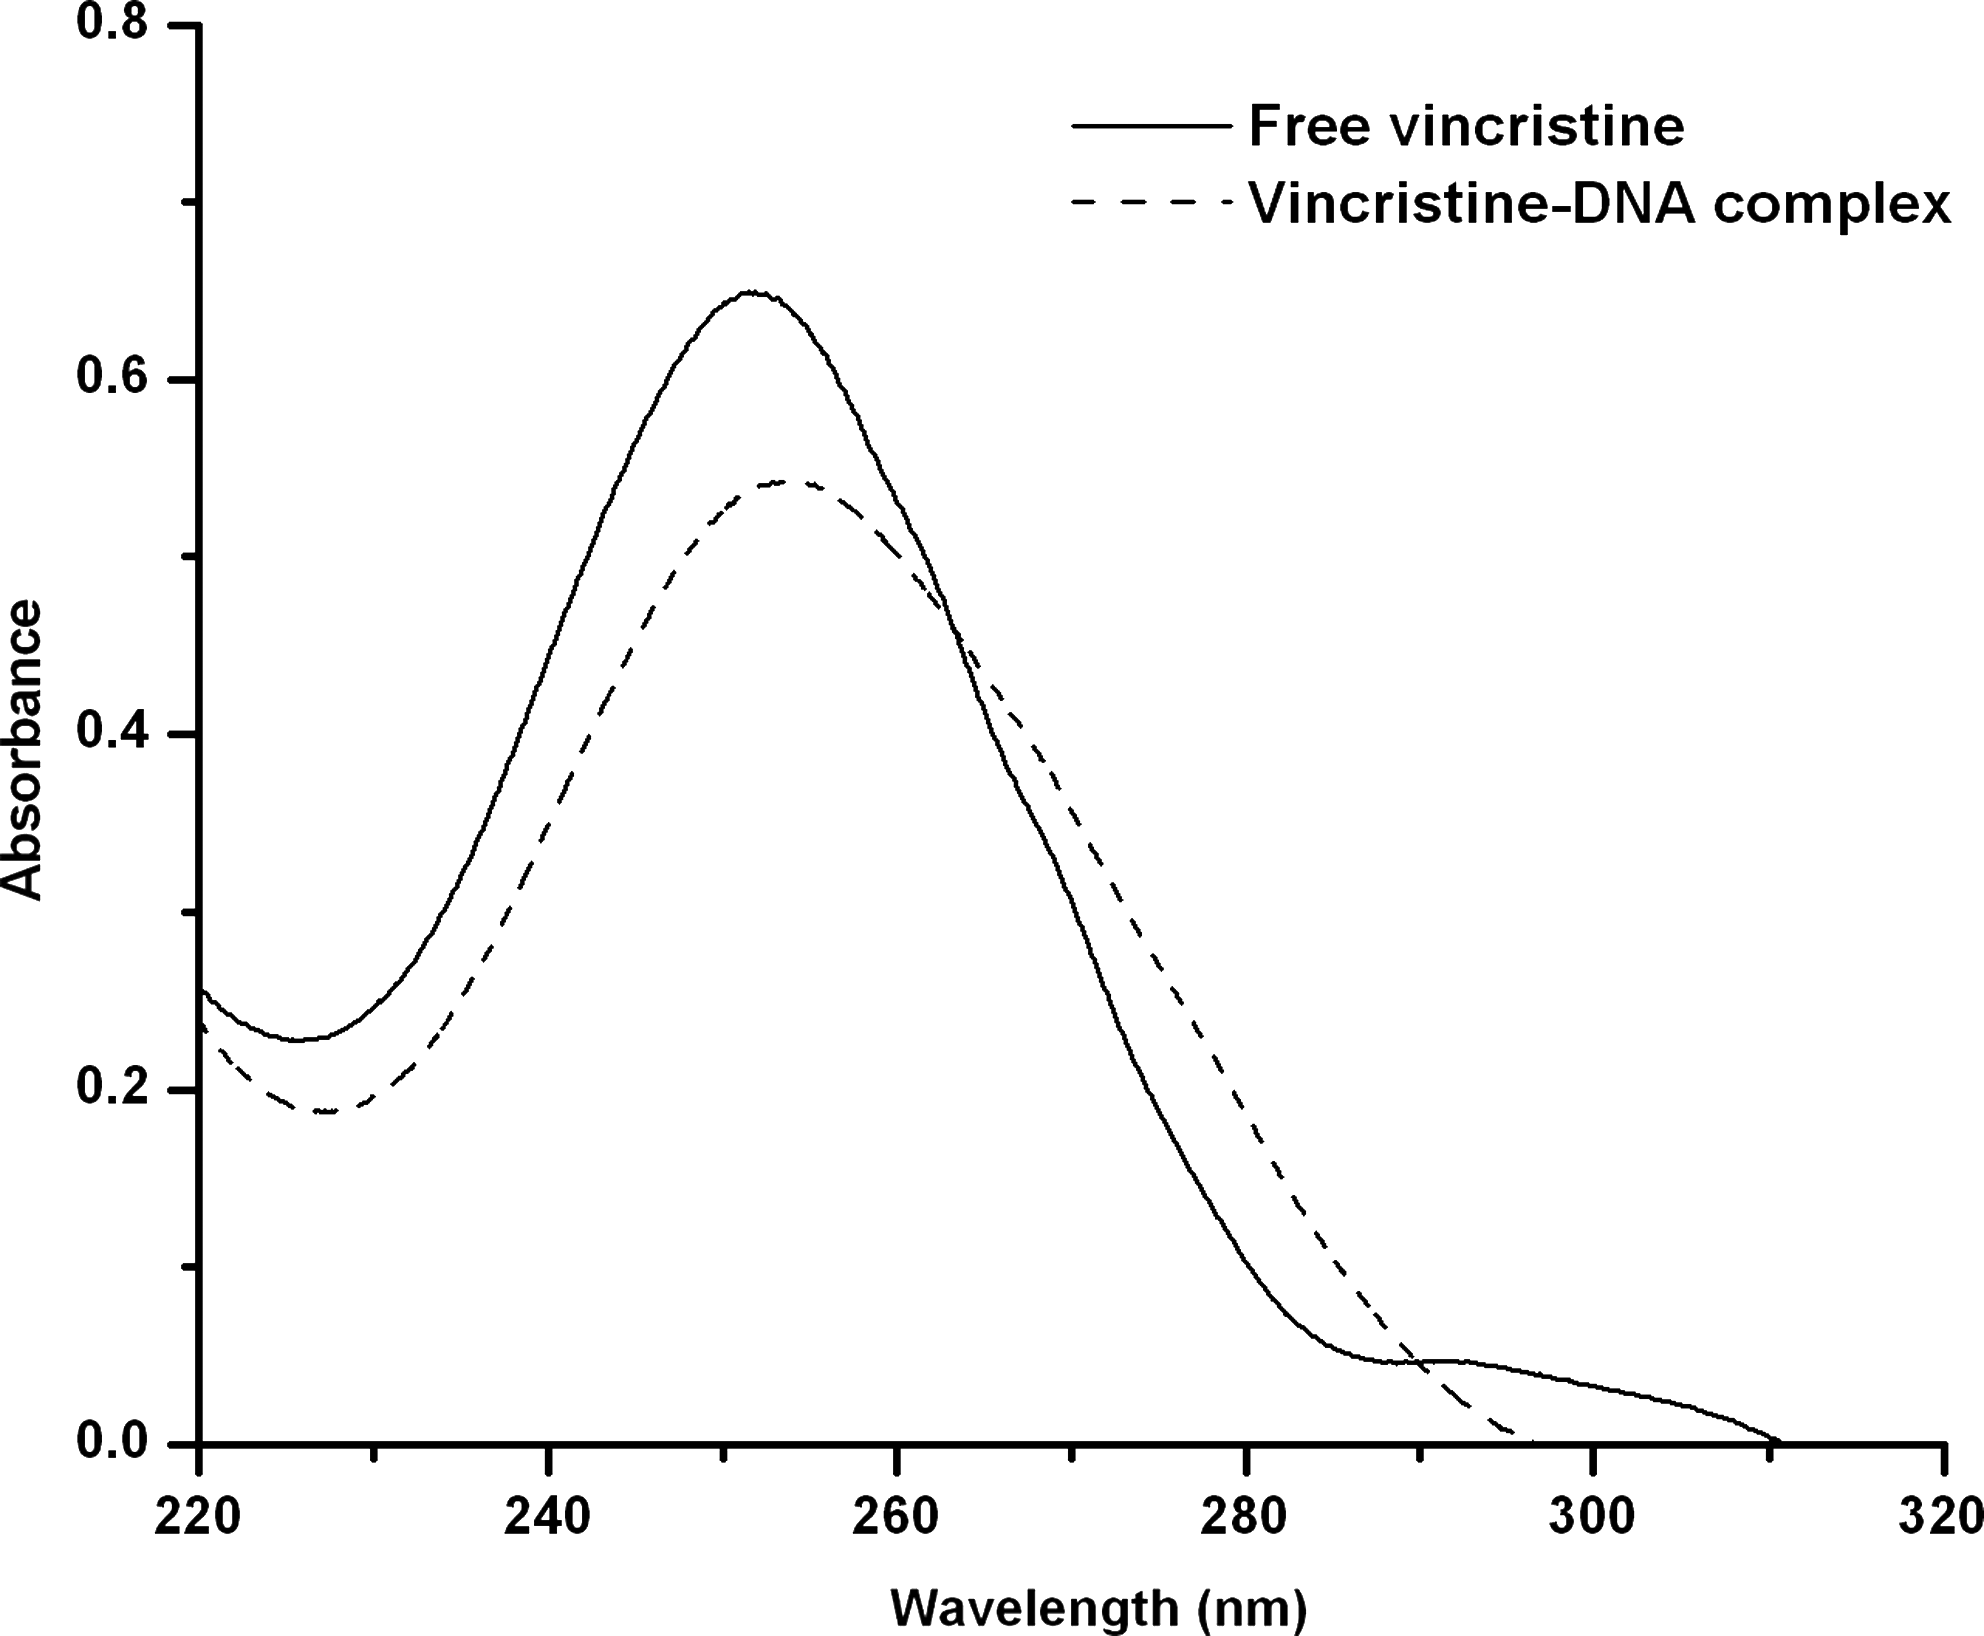
UV–visible spectra of free vincristine and vincristine–DNA complex with final DNA concentration of 2.5 mM and vincristine content of 0.5 mM.
Stability
The stability of the vincristine–DNA complex is estimated by determining the binding constant of the reaction between vincristine and DNA following the method described in the experimental section. The observed binding constant in the concentration range of 0.15–0.5 mM of vincristine is K = 1.0 × 10³ M−1 (Fig. 6). The small binding constant is suggestive of weak binding of vincristine with DNA. The binding constant observed in the study is of the same order as reported earlier for weak DNA binders (Tajmir-Riahi et al., 2004).
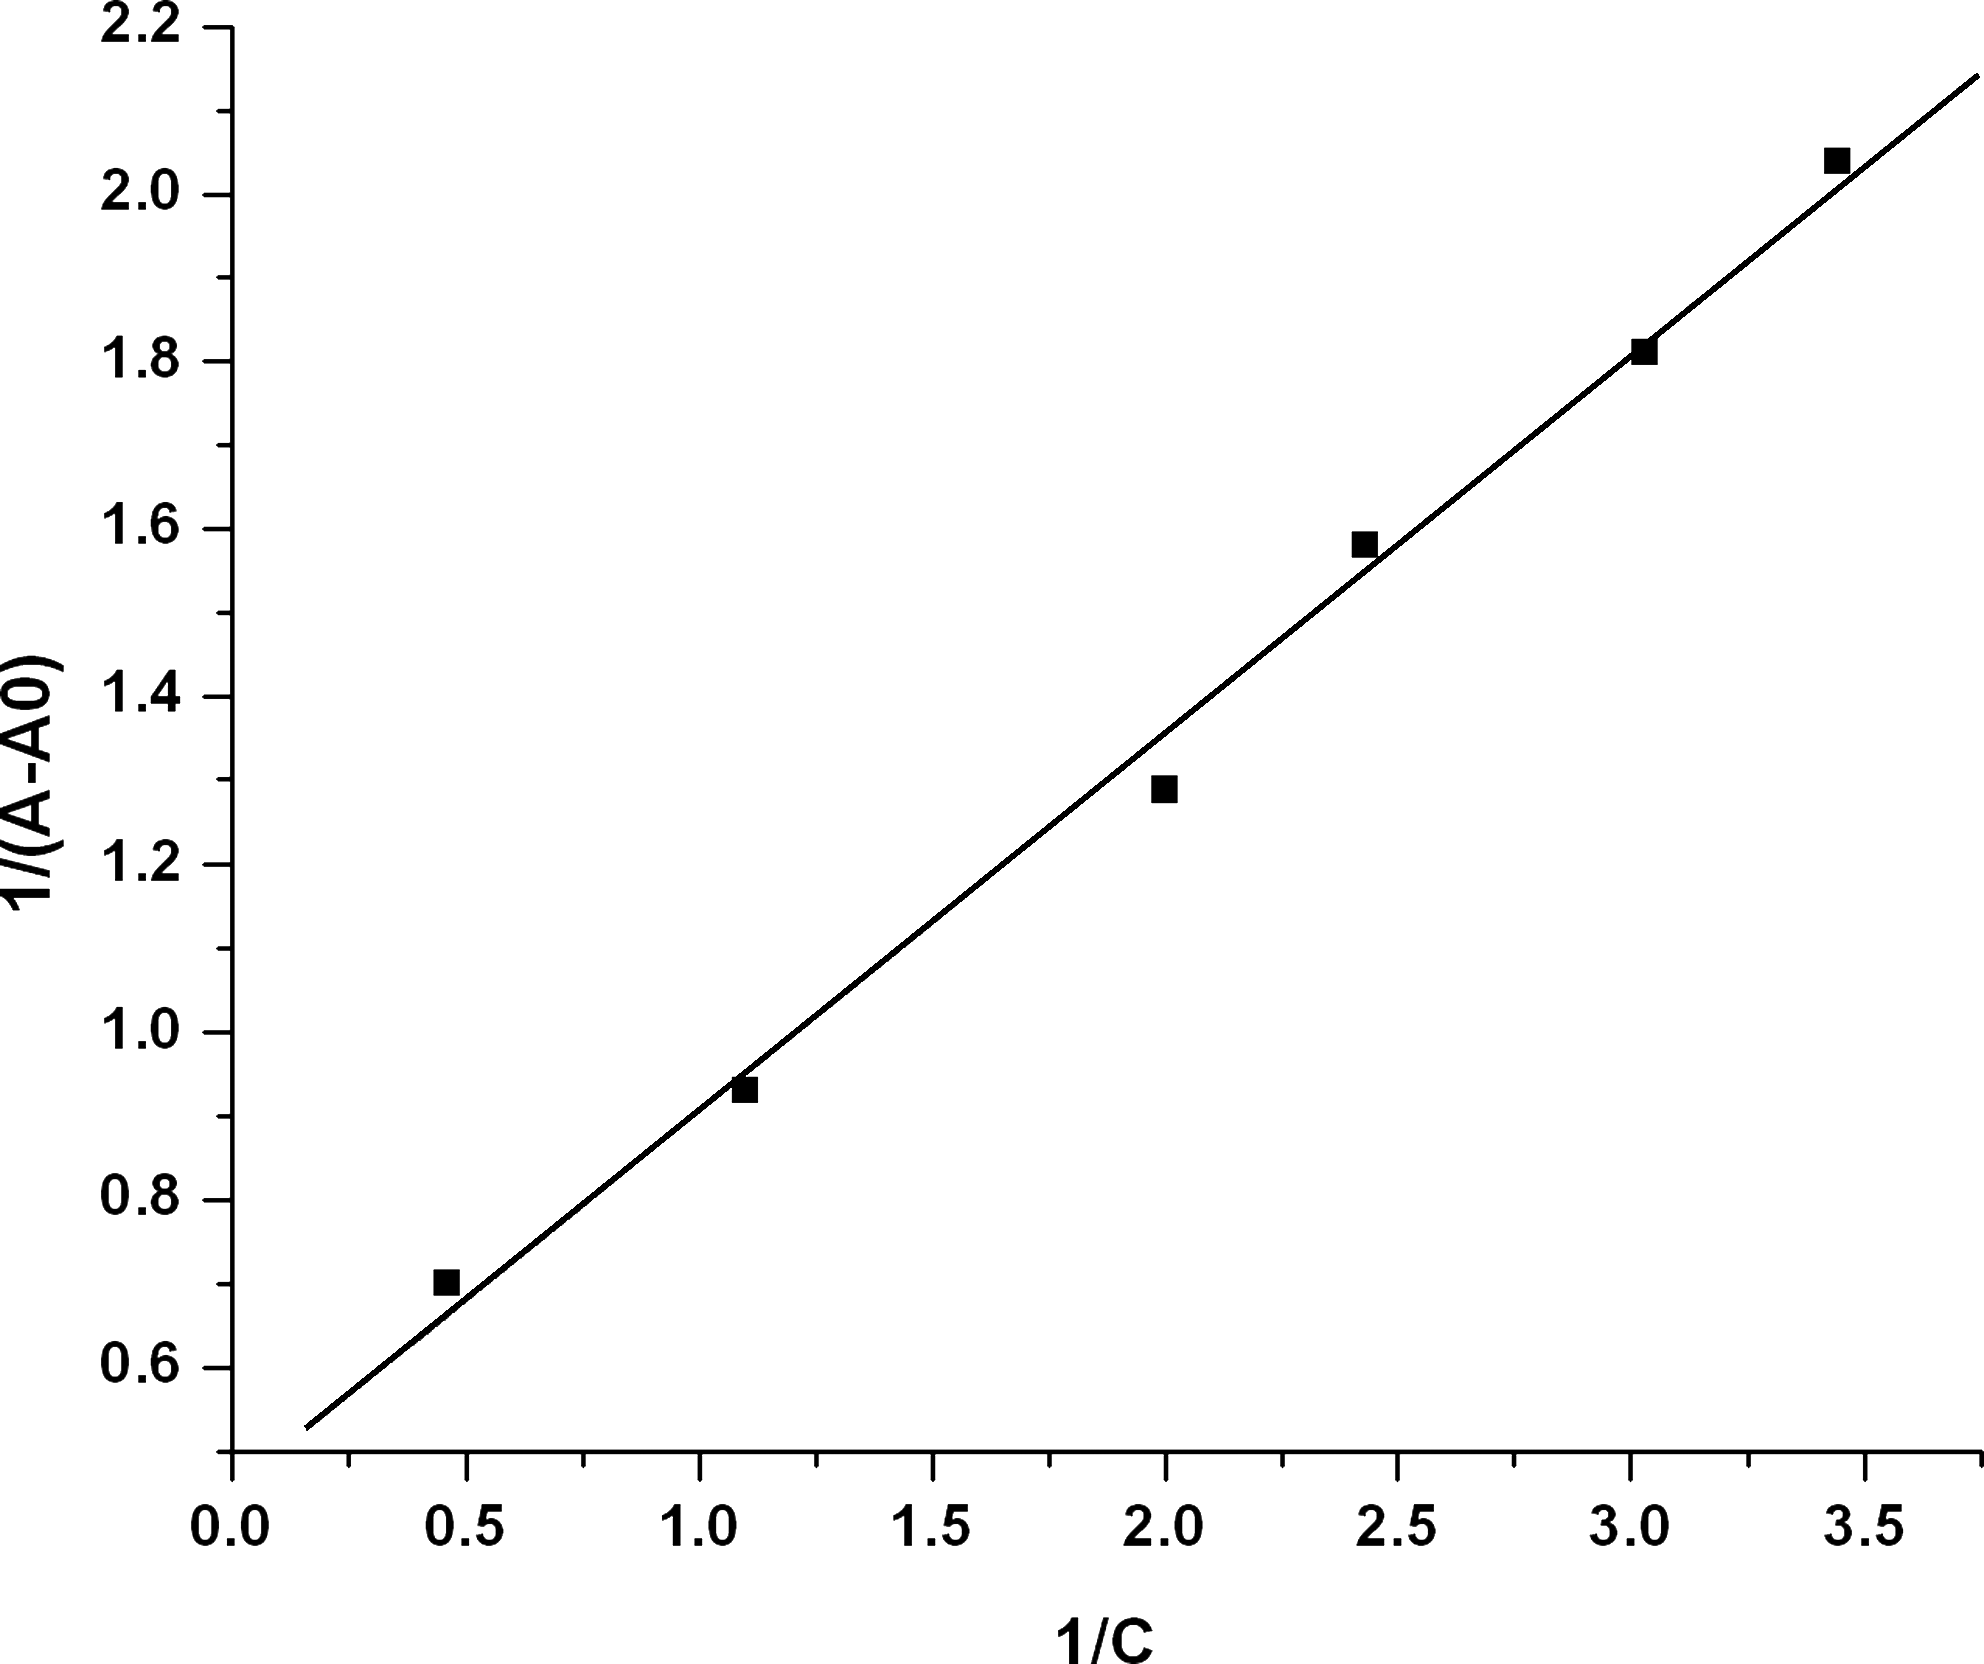
Double reciprocal plot of vincristine binding to DNA. A 0 is the initial absorption of free DNA and A is the absorption at different concentrations at 260 nm. C is the analytical concentration of vincristine in solution.
Conclusions
In this article, we report the spectroscopic analysis of vincristine interaction with double helical structure of DNA and the results indicate the intercalation and external binding mode of interaction between vincristine and DNA. FTIR results suggest that vincristine interaction occurs via guanine and cytosine base pairs as well as through phosphate backbone of the DNA double helix. UV–visible spectroscopic results indicate intercalation of vincristine into DNA. The binding constant for vincristine–DNA complex formation is estimated to be K = 1.0 × 10³ M−1. These results might contribute to further understanding the mode of action of vincristine.
Footnotes
Acknowledgments
The authors thank the Director of the National Physical Laboratory for granting permission for publication of this work. The authors D.K.J. and P.S. are thankful to the Indian Council of Medical Research for providing financial support.
Disclosure Statement
No competing financial interests exist.