
Abstract
Hepatitis B Virus (HBV) covalently closed circular DNA (cccDNA) is the main replicative intermediate of HBV and is organized into minichromosomes by the interaction with histone and nonhistone proteins. The remodeling of HBV minichromosomes such as post-translational modifications of histone proteins plays an important role in regulating HBV replication. To determine whether other remodeling occurs in addition to acetylation of cccDNA-bound H3 histones in the presence of HBV replication, a cell culture replication model of HBV was used to assess the dynamic status of acetylation, phosphorylation, and methylation of cccDNA-bound H3 histones at various times after transient transfection of linear HBV DNA into human hepatoma, HepG2 cells. H3 histones bound to cccDNA were found to be phosphorylated, mono-methylated, and acetylated in HepG2 cells containing replicating HBV. The acetylation and methylation status of H3 histones bound to cccDNA paralleled HBV replication. Our results demonstrate that phosphorylation and methylation occur in the remodeling of HBV minichromosomes during HBV replication. The modifications of cccDNA-bound H3 histones were associated with the level of HBV replication. These findings suggest that alterations in the extent of minichromosome remodeling might be a potential target to inhibit HBV replication in the development of effective novel antiviral agents.
Introduction
Using an HBV cccDNA chromatin immunoprecipitation (ChIP) assay, a previous study has shown that the H3/H4 histones of HBV minichromosomes were acetylated during HBV replication. In both the HBV replicating cells and the livers of patients chronically infected with HBV, HBV replication has been found to be regulated by the acetylation status of H3/H4 histones bound to viral cccDNA. In addition, histone deacetylase inhibitors increased cccDNA-bound acetylated H3/H4, whereas levels of HBV replication significantly increased (Pollicino et al., 2006). Although the study did not investigate other remodeling mechanisms of the HBV minichromosome, the data demonstrated its importance in the regulation of HBV replication. Therefore, we postulated that in the process of HBV replication, cccDNA-bound H3 histones, which consist of HBV minichromosomes, are modified by other types of histone post-translation modifications as well as acetylation. The aims of the current study were to determine what other post-translation modifications occur and to determine the impact of such modifications on minichromosome remodeling of cccDNA.
Materials and Methods
Cells and cell culture
HepG2 human hepatoma cells were cultured in six-well (3.5 cm diameter) cell culture plates (Gibco) containing 5% fetal calf serum (Hyclone) under 5% CO2, at 37°C. Media were changed daily.
Transient transfection of full-length HBV DNA
From plasmid-integrated pGEM-HBV1.3 that included a 1.3-fold HBV DNA, full-length HBV genomes were obtained by amplification by a high-fidelity polymerase chain reaction (PCR) system (Takara), according to the method described by Gunther et al. (1995) P1 primer (HBV positions: 1821-1841) was modified to contain the HinDIII/SapI sites, and the P2 antisense primer (HBV positions:1823-1806) was modified to contain SacI/SapI sites.
P1: 5′-CCGGAAAGCTTGAGCTCTTCTTTTTCACCTCTGCCTAATCA-3′, P2: 5′-CCGGAGCTCGTGAGCCTCTTCAAAAAGTTGCATGGTGCTGG-3′ (Gunther et al., 1995). The amplified HBV DNA was digested with the HinDIII and SacI (Takara), and the 3.2 kb full length HBV DNA fragments were recovered by gel purification using a DNA Gel extraction kit (Promega) and inserted into pUC19 vectors (Takara). The ligation products were transfected into competent DH-5α cells and blue-white screened by X-Gal and IPTG. A single selected clone was prepared, and the plasmid DNA was extracted and sequenced (DaLian Takara) to confirm the primary structure. pUC19-HBV1.0 integrated plasmids were prepared according to the manufacturer's instructions.
Linear HBV monomers were released from the pUC19-HBV1.0 plasmids by SapI (MBI) digestion and gel-purified using DNA gel extraction kit (Promega). Linear HBV DNA was transiently transfected into HepG2 cells using the Lipofectamine 2000 (Invitrogen). We transfected various ratios of liposomes to HBV DNA and compared the efficiency of transfection by green fluorescence protein to determine the best conditions for transfection. Briefly, HepG2 cells were seeded at a density of 1.8 × 10⁶ cells in six-well plates (Gibco). Twenty-four hours later, cells at 85%–90% confluence were transfected with Lipofectamine 2000 (6 μL) and HBV DNA (3 μg). Each transfection included 1 μg of a reporter plasmid expressing enhanced green fluorescence protein to assess transfection efficiency. Cell culture media were changed daily with Dulbecco's modified Eagle's medium (Hyclone). The mean transfection efficiency was approximately 30%. A negative control with nontransfected HepG2 cells was treated identically with each experimental group.
Total RNA northern blots
Total RNA was extracted from HepG2 cells 48 h after transfection using a TRIzol reagent (Invitrogen). The RNA samples were treated for 1 h at 37°C with RNase-Free DNase (Promega), and the quality was determined by measurement of the 260/280 nm UV absorption ratio. RNA samples (25 μg) were electrophoresed on 1% formaldehyde-agarose gel and blotted onto membranes, hybridized with 32P probes, washed, and exposed to film (Kodak) at −80°C. The probes were full-length HBV DNA labeled with α-32P-d-ATP (Takara) by a random primer labeling method (Sambrook and Russel, 2001).
HBV DNA southern blots
Cells were harvested 48 h after transfection, and cytoplasmic HBV DNA was extracted by using a Cytoplasmic DNA extraction kit (Nanjing KeyGen). Nuclear cccDNA was extracted according to the procedure described by Wieland et al. (2004). Briefly, HBV-transfected cells were collected at 48 h after transfection, lysed in 500 μL cell lysis buffer, and centrifuged for 10 min at 12,000 rpm at 4°C. Then, the precipitates were treated with 500 μL nuclear lysis buffer, mixed, and incubated for 30 min at 37°C. The lysates were neutralizated with potassium acetate (pH 4.8) and then centrifuged for 20 min at 12,000 rpm at 4°C. HBV cccDNA was extracted from the supernatant with phenol/chloroform, precipitated with ethanol, and dissolved in 50 μL 10 mmol of Tris-HCl (pH 7.5) and 1 mmol ethylenediaminetetraacetic acid. After cytoplasmic HBV DNA and cccDNA quantities were measured, 10 μg cytoplasmic HBV DNA and cccDNA was electrophoresed on 1% agarose gels, blotted onto a membrane, hybridized, washed, and exposed to film at −80°C. The probes were the same as those used for Northern Blots (Sambrook and Russel, 2001).
Detection of hepatitis B surface antigen and hepatitis B e antigen by enzyme-linked immunosorbent assay
At different transfection times, we assayed the dynamic changes of the hepatitis B surface antigen (HBsAg) and hepatitis B e antigen (HBeAg) by ELISA kits (Shanghai KeHua). HBsAg is a general marker for HBV infection, and HBeAg is usually used as a surrogate marker of HBV replication. Culture supernatants of HepG2 cells were collected at 12, 24, 48, and 72 h after transfection and centrifuged for 1 min at 12,000 rpm. Culture supernatants in 50 μL were mixed with 50 μL enzyme conjugate and applied on plates coated by HBsAg and HBeAg antibody, mixed and incubated at 37°C for 30 min. After washing with wash buffer, reagent A, B, 50 μL were added, mixed fully, and incubated at 37°C for 20 min. Finally, 50 μL stopping solution was added to the plate. The absorbance of the contents of each well was determined at the wavelength of 450 nm by enzyme-linked immunosorbent assay (ELISA) meter. Final results were expressed as optical density (OD) values (mean ± standard deviation [SD]).
Quantification of cytoplasmic HBV DNA by real-time PCR
The cytoplasmic HBV DNA was extracted from HepG2 cells 24, 48, and 72 h after transfection and quantified by real-time PCR using Taqman probes. The forward primer was 5′-AGAAACAACACATAGCGCCTCAT-3′, and the reverse primer was 5′-TGCCCCATGCTGTAGATCTTG-3′. The sequence of the Taqman probe was 5′-FAM-TGTGGGTCACCATATTCTTGGG-TAMER-3′ (Sambrook and Russel, 2001). Real-time PCR was performed by using a Premix Ex Taq kit (Takara) and a 20 μL PCR reaction system containing 10 μL premix Ex-taq, 0.4 μL Rox reference dye, 0.4 μL (0.2 mmol/L) forward and reverse primers, 50 ng of DNA samples, and 0.8 μL (0.4 mmol/L) probes. The rest of the sample was brought up to a volume of 20 μL by ddH20. Amplification was performed as follows: the pre-denaturation step of 30 s at 95°C, 40 cycles of 5 s at 95°C, and 31 s at 60°C. The plasmid pU19-HBV1.0 was serially diluted 10-fold as a standard for real-time PCR, and standard curves were prepared. The final results were expressed as the number of DNA copies per cell (mean ± SD).
Quantification of HBV cccDNA by real-time PCR
HBV cccDNA was quantified by real-time PCR as described by Werle-Lapostolle et al. (2004) HBV cccDNA samples extracted from HepG2 cells were treated for 1 h at 37°C with Plasmid-safe DNase (Epicentre) to eliminate open circular duplex HBV DNAand single strand HBV DNA. The forward primer was 5′-CTCCCCGTCTGTGCCTTCT-3′; the reverse primer was 5′-GCCCCAAAGCCACCCAAG-3′; and the probes were 5′-GTTCACGGTGGTCTCCATG CAACGT-FAM-3′, and 5′-ROX-AGGTGAAGCGAAGTGCACACGGACC-PO4-3′ (Takara) (Keasler et al., 2007). The PCR reaction mixture (20 μL) contained 10 μL Premix, 20 ng cccDNA, 2 μL (0.5 μmol/L) forward and reverse primers, 0.4 μL (0.2 μmol/L) FAM-3′-labeled probes, and 0.8 μL (0.4 μmol/L) 5′-ROX-labeled probes, brought up to the final volume with ddH20. Standard curves were prepared as described in the quantification of cytoplasmic HBV DNA by real-time PCR, and the final results were expressed as the number of cccDNA copies per cell (mean ± SD).
ChIP assays of cccDNA
ChIP were performed as previously described using an EZ-Magna ChIP A Chromatin Immunoprecipitation Kit (Millipore cat. no.17-408) (Costanzo et al., 2002; Werle-Lapostolle et al., 2004). At 12, 24, 48, and 72 h post-transfection, DNA-proteins in HepG2 cells were cross-linked with a fresh 37% formaldehyde to make a final concentration of 1% formaldehyde. Cells were washed twice with phosphate-buffered saline, incubated for 15 min in cell lysis buffer, and finally sonicated in nuclear lysis buffer to generate cellular chromatin fragments of 200–400 bp. Microfuge tubes were prepared, each containing 50 μL (1 × 10⁶ cell equivalents) of sheared cross-linked chromatin. Each tube was subjected to immunoprecipitation for 12–16 h at 4°C using 10 μL of antibodies specific to H3 (Millipore cat. no. 06-755) rabbit polyclonal immunoglobulin G (IgG) recognizing unmodified human 17 kDa, 0.5 mg/mL, 8 μL antibody against acetylated H3 (MLlipore cat. no. 06-599) rabbit polyclonal IgG recognizing histone H3, 1 mg/mL against H3 di-acetylated at lysines 9 and 14, 8 μL antibody against phosphorylated H3 (Millipore cat. no. 04-817) rabbit monoclonal IgG recognizing histone H3 phosphorylated at serine 10, and 7 μL antibody against methylated H3 (Millipore cat. no. 07-436) rabbit polyclonal IgG recognizing histone H3, 1 mg/mL antibody against H3 mono-methylated at lysine 4, 20 μL fully suspended protein A magnetic beads, and 5 μg non-specific IgGs as a negative control (normal rabbit IgG, 1 mg/mL). After isolation of the protein A-enriched DNA and reversal of the cross-linking, the chromatin immunoprecipitates were treated with plasmid-safe DNase (Epicentre) for 1 h at 37°C before real-time PCR. The antibody cocktail precipitates both host and viral H3, but viral chromatin is distinguished from that of host by RT-PCR assays by using virus-specific primers. HBV P23 and P24 primers specific to the HBV precore-core promoter region (Orlando, 2000; Pollicino et al., 2004) were used to amplify the HBV cccDNA. HBV P23, P24 were used to discriminate between the rc DNA and cccDNA to ensure specificity and reliability of the experiments. HBV rcDNA contains two regions sensitive to digestion with mung bean nuclease: the single-stranded area, which covers about 10%–60% of the genome length, and a nick within the minus strand around position 1820. Sense primers P23 are located within the single-stranded region of HBV rcDNA. If they are used together with the antisense primers P24, amplification runs across the minus-strand nick of HBV rcDNA. After digestion of the PCR templates, a positive signal should be obtained only from HBV cccDNA present in cells supporting HBV replication and not from rcDNA originating from viral particles. The 50 μL PCR reaction volume contained 25 μL of premix, 2 μL (0.4 μmol/L) P23 and P24, and 20 ng cccDNA, brought up to the final volume with ddH20. Amplification was performed as follows: 35 cycles at 94°C for 30 s, 55°C for 30 s, and 72°C for 30 s. The final results were expressed as percentage of input chromatin (mean ± SD). Input means the 5 μL (1%) supernatants obtained from 500 μL liquid containing 50 μL chromatin after sonication and 450 μL dilution buffer. The samples were reverse cross-linked and purified. Input chromatin was used to normalize differences in cell numbers of various samples and as a negative control.
Statistical analysis
The transfection experiments at each time point were performed at least in triplicate. The results of quantification of cytoplasmic DNA, cccDNA, and the ELISAs of culture supernatant were all expressed as mean ± SD. Means at four time points were compared with a single factor analysis of variance by a completely random design, and Student-Newman-Keuls (SNK)-q tests were compared pairwise. The data were analyzed with SPSS 13.0 software. p-Values <0.05 were considered to indicate statistically significant differences.
Results
Construction of cells as a model of HBV replication
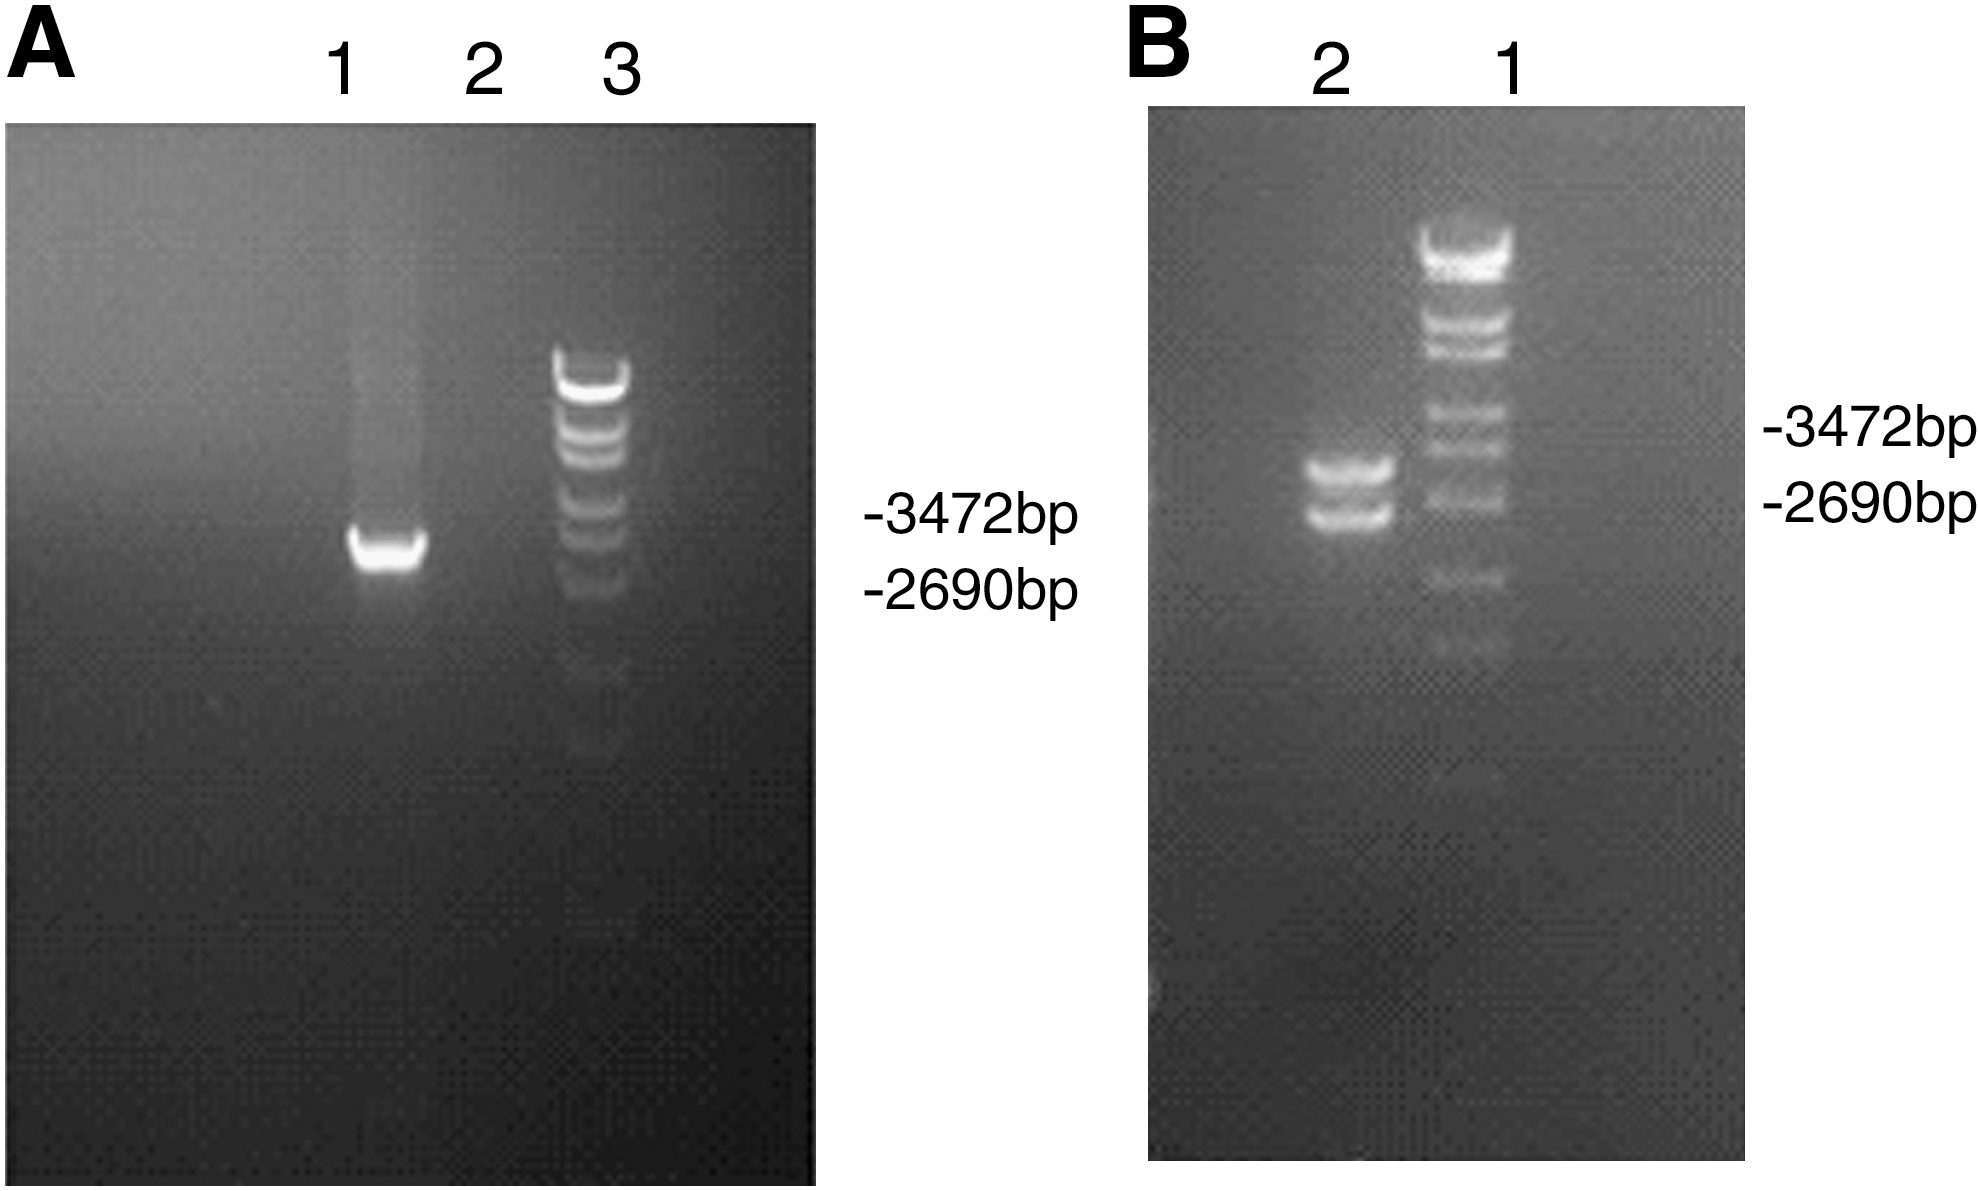
A full-length HBV genome was amplified using a high-fidelity PCR system and was inserted into pUC19 vectors after digestion by HinDIII and SacI restriction enzymes (Fig. 1A). Sequencing confirmed that the pUC19-HBV 1.0 plasmid was successfully constructed. Linear HBV monomers were released from the pUC19-HBV1.0 plasmids by SapI digestion shown in Figure 1B. (Also see Supplementary Fig. S1, available online at
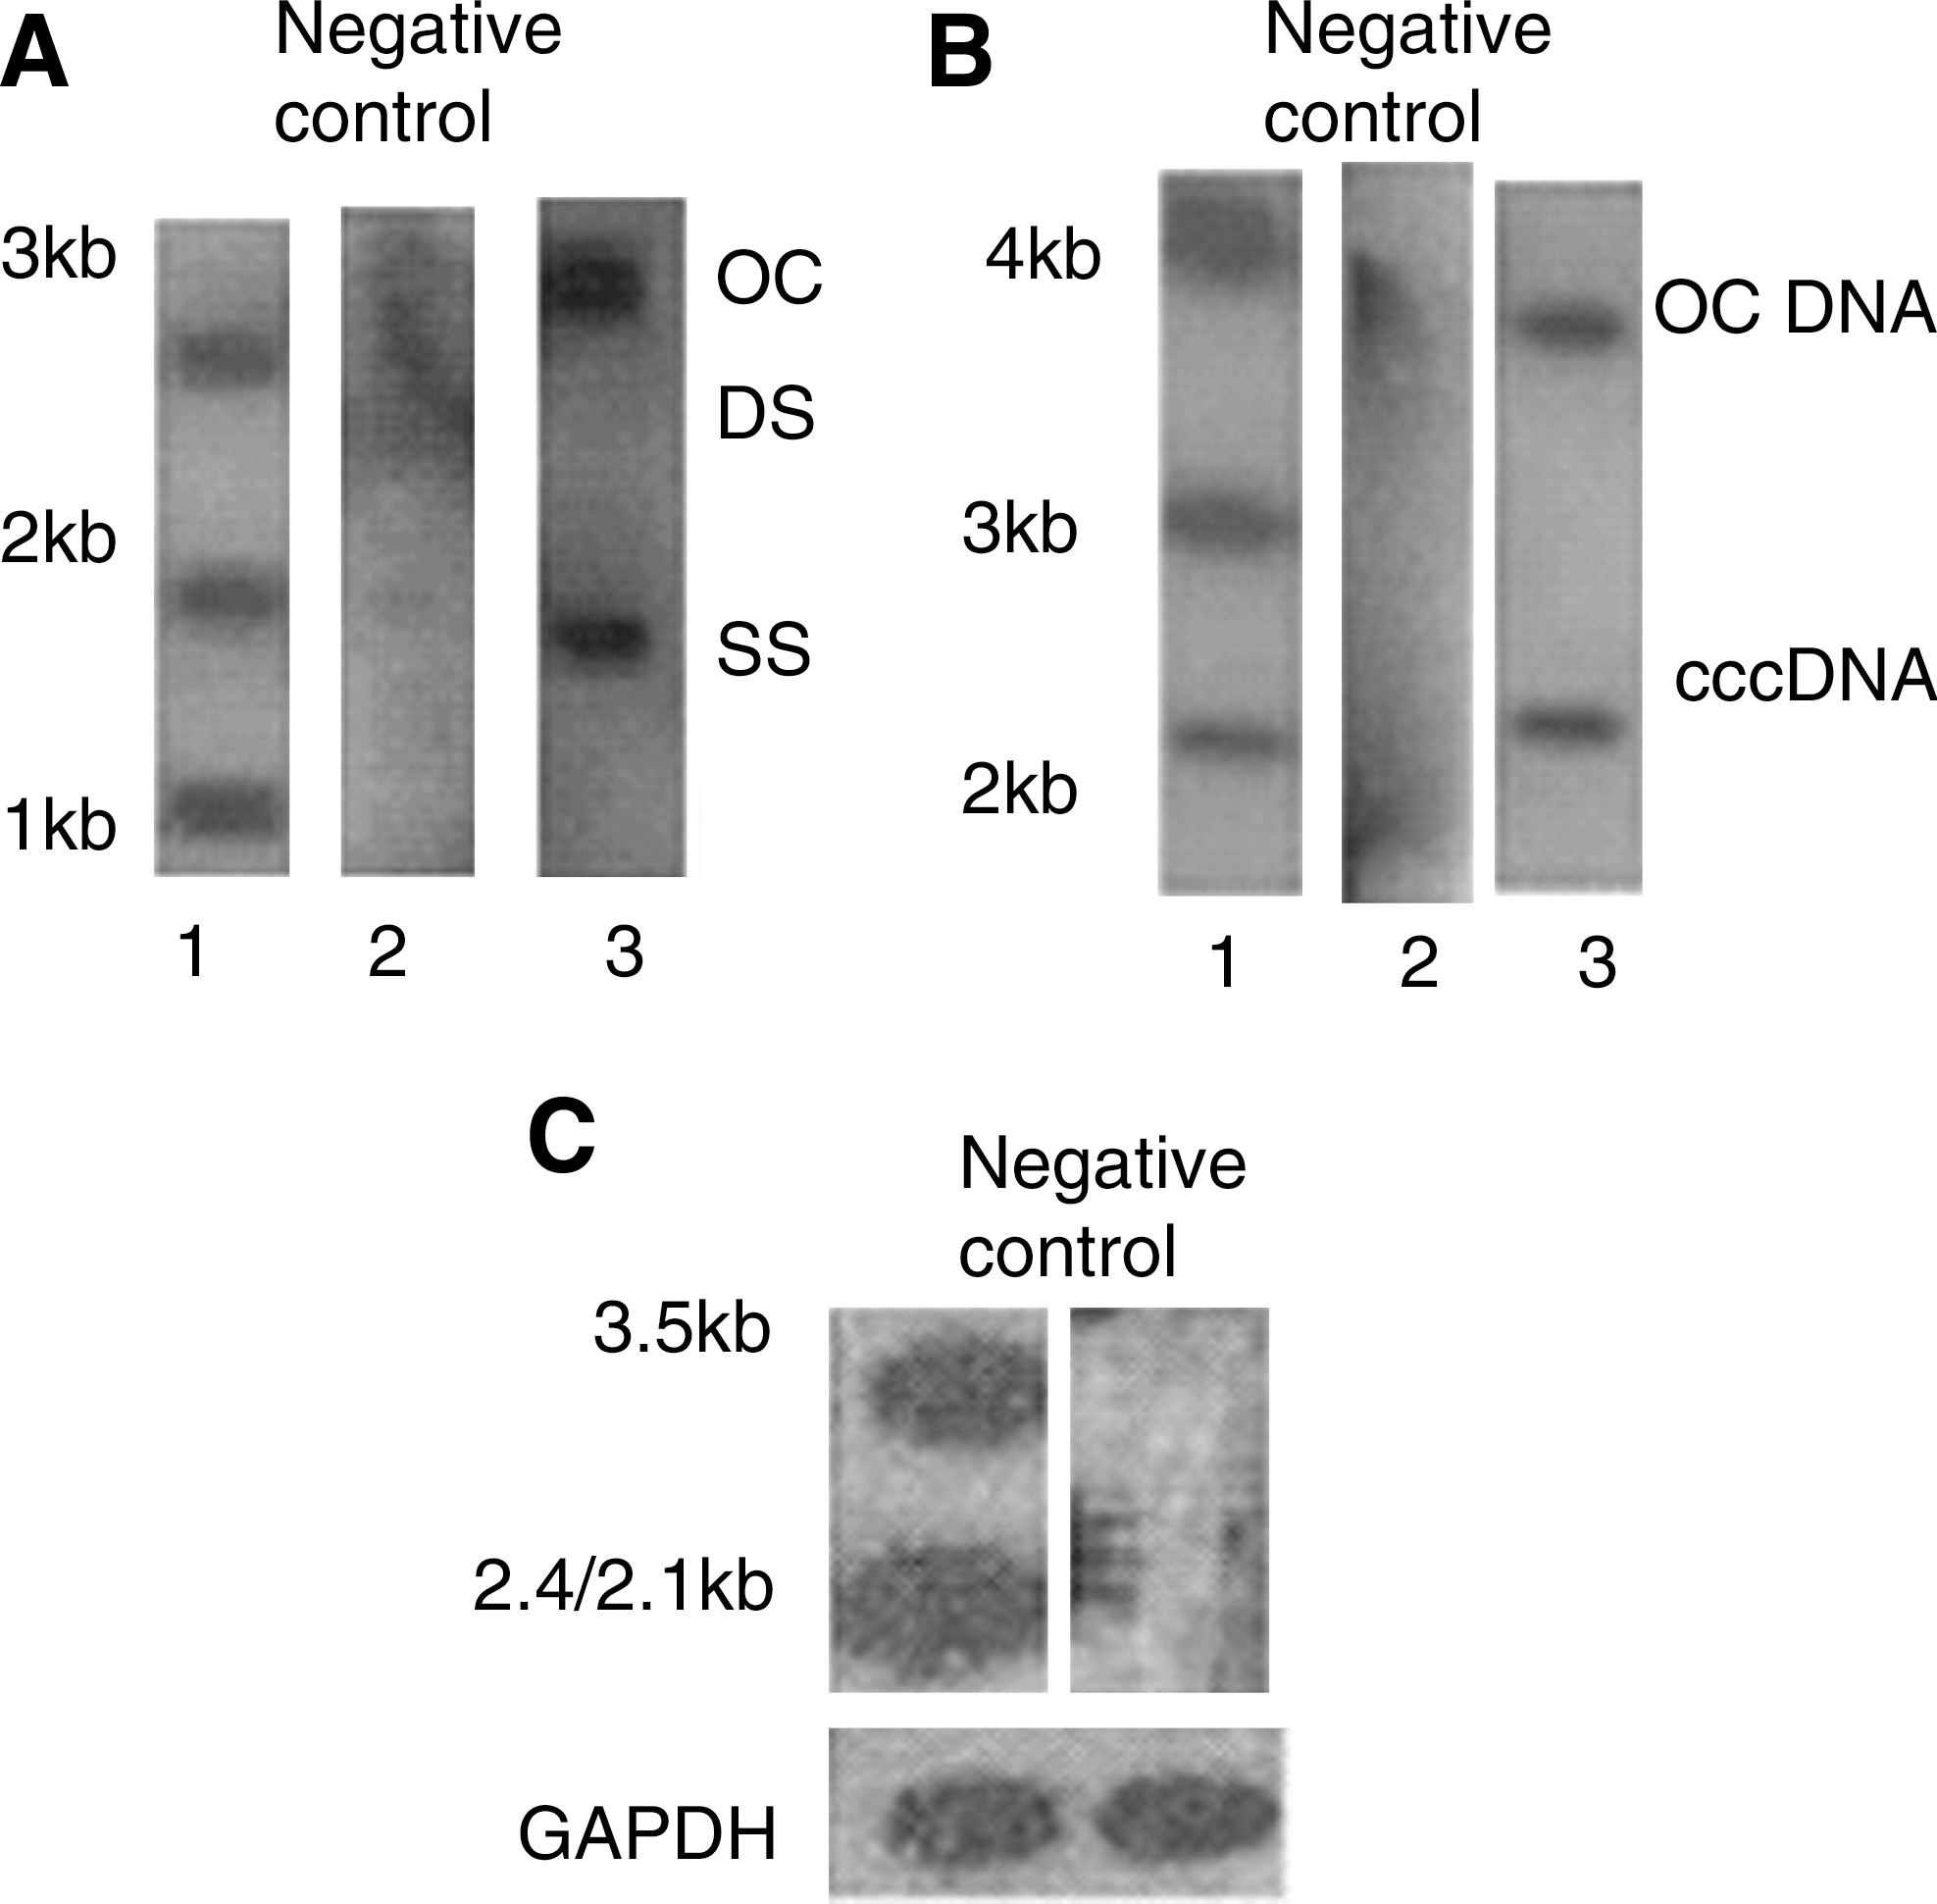
Cytoplasmic HBV DNA, nuclear HBV cccDNA, and total RNA extracted from HepG2 cells 48 h after transfection with linear HBV DNA were detected by Southern and Northern blots. HBV replicative intermediates open circular duplex HBV DNA, single strand HBV DNA DNA, and double strand HBV DNA are seen in Figure 2A, cccDNA in Figure 2B, and HBV specific transcripts 3.5, 2.4, and 2.1 kb in Figure 2C.
Dynamic changes of viral markers in cell culture supernatants
Compared with negative controls, HBsAg and HBeAg viral markers generated by HBV replication were detected in cell culture supernatants at 12 h post-transfection. At 48 h after transfection, the secretion of HBsAg and HBeAg significantly increased, but by 72 h there was little detectable in the supernatant as shown in Table 1. The results demonstrated that transfection of linear HBV DNA with sticky ends into HepG2 cells can start a complete viral replication cycle and generate HBV replicative intermediates, specific transcripts, and viral proteins HBsAg and HBeAg, representing a cell culture model of HBV replication.
HBsAg, hepatitis B surface antigen; HBeAg, hepatitis B e antigen; OD, optical density.
Dynamic changes in HBV DNA levels in HepG2 cells
Cytoplasmic HBV DNA was extracted from HepG2 cells at 12, 24, 48, and 72 h after transfection with linear HBV DNA and quantified by real-time PCR. As shown in Figure 3, cytoplasmic HBV DNA levels were 23.6 ± 2.2 copies/cell at 12 h after transfection, increasing and reaching a peak of 40.7 ± 3 copies/cell at 48 h. Then, levels gradually declined to 19.3 ± 1.1 copies/cell by 72 h (Fig. 3A).
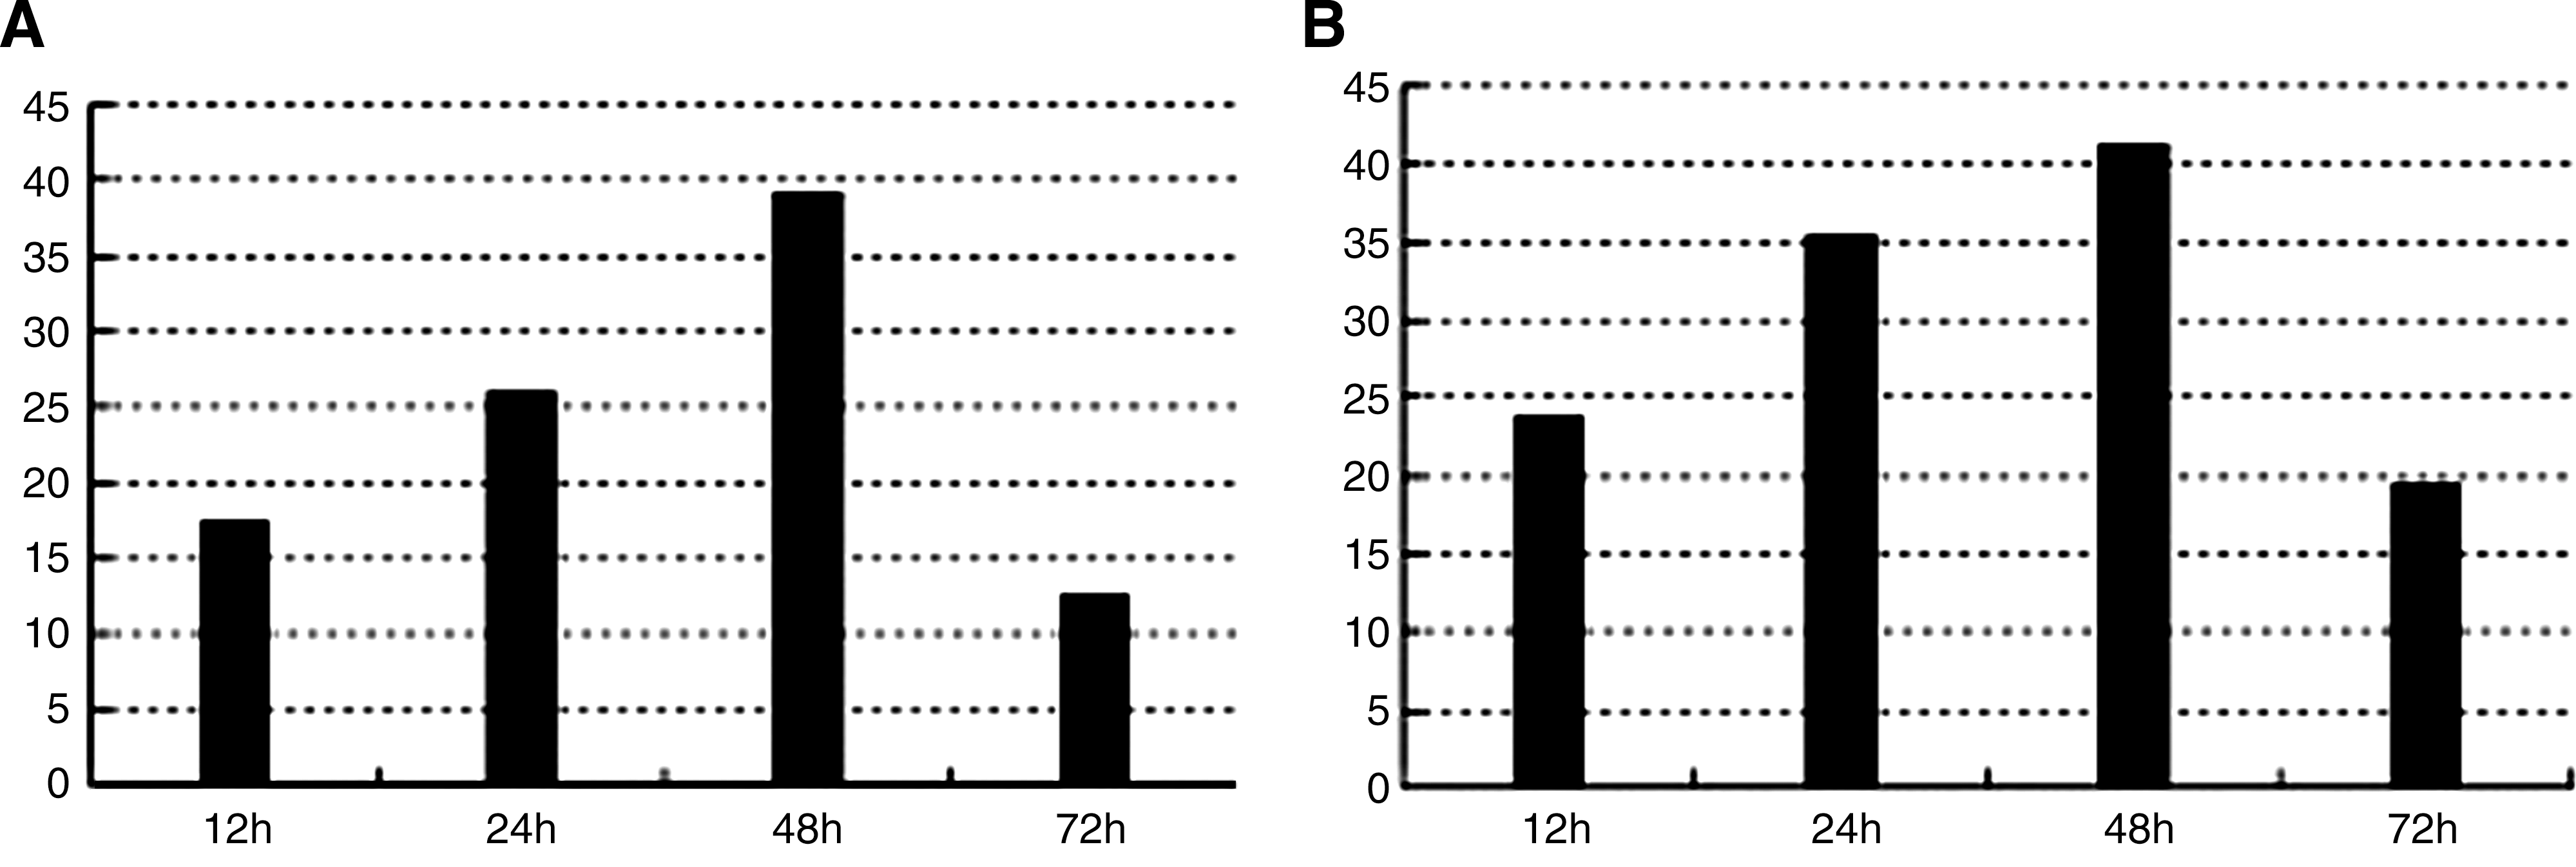
Figure 3B shows that levels of cccDNA were 17.4 ± 1.3 copies/cell in nuclei at 12 h post-transfection, reaching the highest levels of 39.5 ± 4.2 copies/cell between 24 and 48 h. Levels of cccDNA decreased by 72 h post-transfection to 12.8 ± 2.2 copies/cell, p < 0.05.
cccDNA-bound H3 histones are acetylated, phosphorylated, and methylated in cell culture
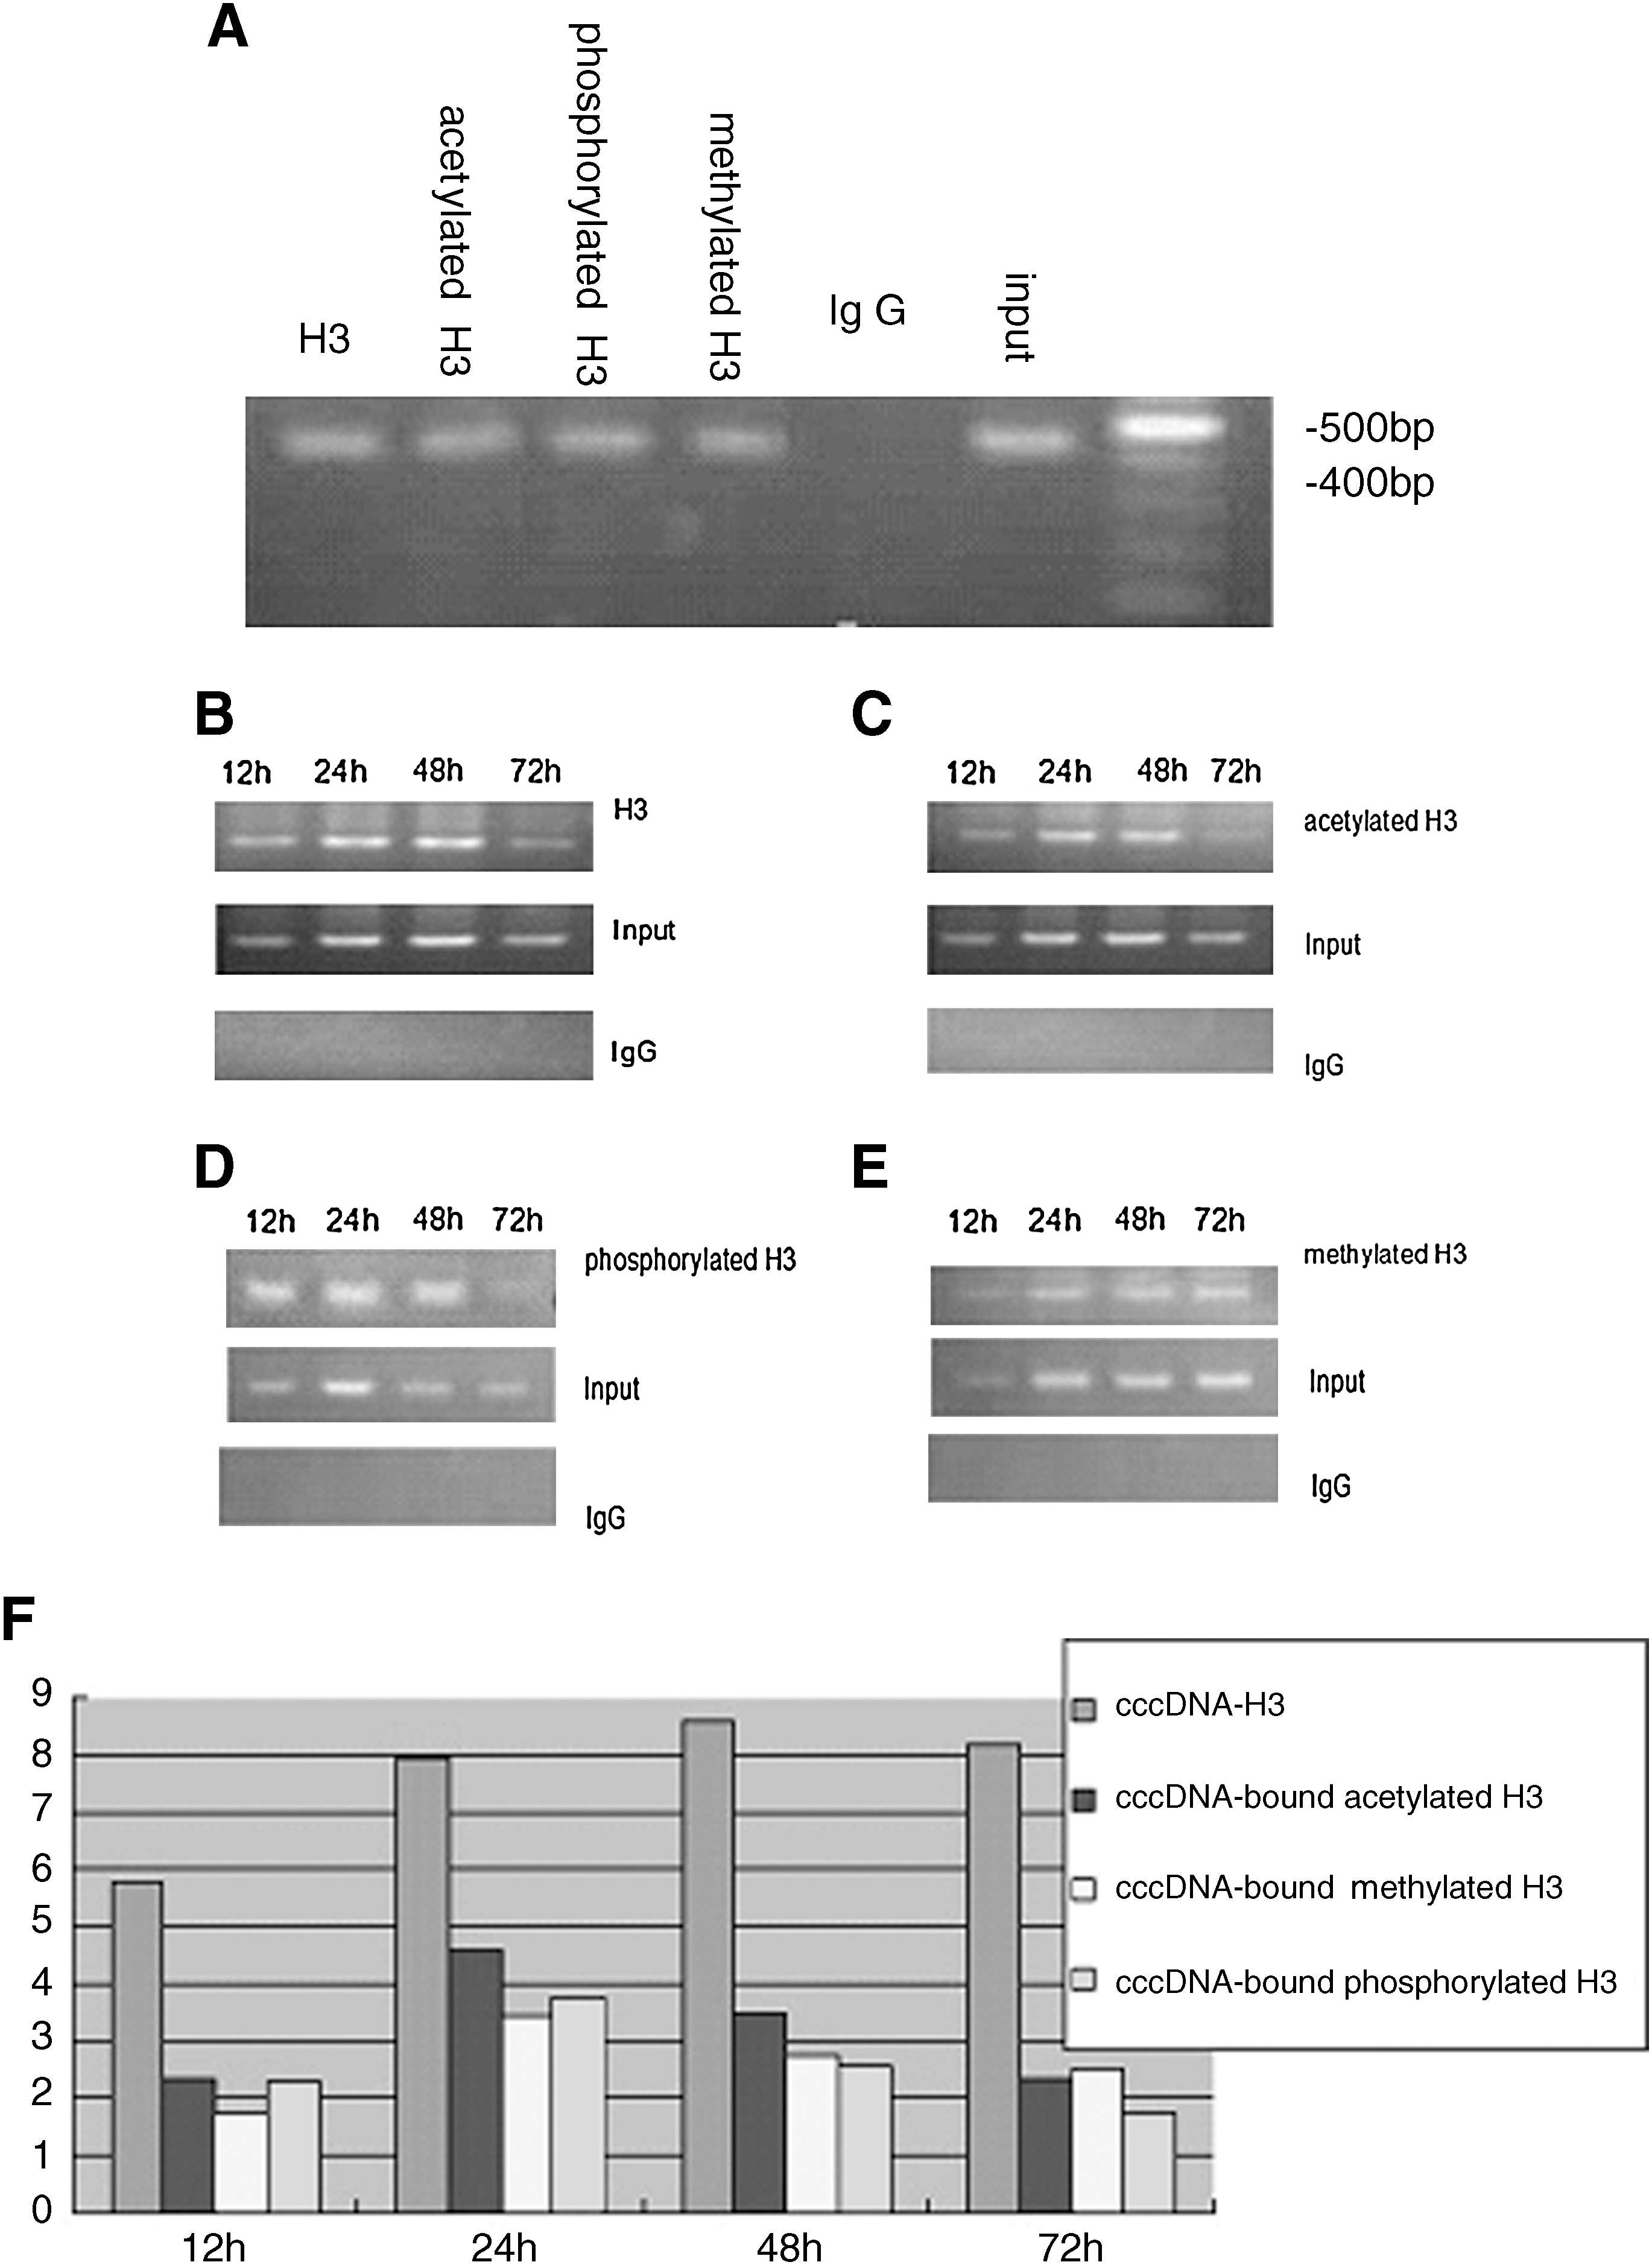
After amplification and quantification of immunoprecipitated cccDNA by PCR and real-time PCR, nuclear cccDNA generated by HBV replication in cells was shown to bind to H3 histones forming part of an HBV minichromosome. In addition, a more important discovery was that during the process of HBV replication, cccDNA-bound H3 histones were not only acetylated but also phosphorylated and mono-methylated. Figure 4 shows the results of ChIP assays of HepG2 HBV-transfected cells at 12, 24, 48, and 72 h post-transfection. Phosphorylation and methylation modifications of cccDNA-bound H3 histones occurred in HepG2 cells, and the extent of both modifications tended to increase between 24 and 48 h after transfection. The levels of cccDNA-bound acetylated and phosphorylated H3 histones decreased markedly (p < 0.05), but the levels of methylated histones were stable through 48 h.
The relationship between the levels of HBV replication and the modification status of cccDNA-bound H3 histones
H3 histones from HBV minichromosomes were found to be acetylated, phosphorylated, and methylated in HepG2 cells containing replicating HBV. The levels of the modified cccDNA-bound H3 histones were different at each time point of transfection. There appeared to be a relationship between the dynamic changes of the three kinds of modified H3 histones and HBV replication levels at various time points. At 12 h after transfection, replication of HBV and the generation of cytoplasmic DNA and nuclear cccDNA occurred, whereas cccDNA-bound H3 histones were being modified by acetylation, phosphorylation, and methylation. The values in units of % input DNA were 2.34 ± 0.49, 2.29 ± 0.42, 1.72 ± 0.24, respectively. Between 24 and 48 h, when the levels of HBV replication reached a plateau, the acetylation, phosphorylation, and methylation of cccDNA-bound H3 histones increased to varying degrees and peaked at 8.58 ± 1.1, 4.61 ± 0.75, and 3.43 ± 0.64, in units of % input DNA, respectively (all p < 0.05). The levels of HBV replication declined notably to 19.3 ± 1.1 copies/cell at 72 h. However, the methylation status of cccDNA-bound H3 histones did not change appreciably at 72 h, the values in units of % input DNA were 2.73 ± 0.55/2.52 ± 0.51 in units of % input DNA at 48, 72 h respectively, p > 0.05. Both the acetylation and phosphorylation of cccDNA-bound H3 histones decreased to 2.33 ± 0.43 and 1.72 ± 0.25 in units of % input DNA, respectively (p < 0.05). These results indicated that the levels of HBV replication paralleled the acetylation, phosphorylation, and methylation of cccDNA-bound H3 histones. At present, we have no data on whether the phosphorylation and methylation modifications of the HBV minichromosome directly regulate HBV replication. However, the data clearly show an association between levels of modified histones and levels of HBV DNA.
Discussion
At present, the construction of cell models of HBV replication has been mostly based on eukaryotic expression plasmids. However, since plasmids themselves are double-stranded closed circular DNA, they can form chromatin-like structures in cells. These structures can interfere with research on HBV minichromosome remodeling. The linear monomeric HBV genomes with SapI sticky ends do not contain any base sequence other than that from HBV DNA and the recognition site, so the cutting site of the SapI restriction enzyme is unique. These features ensured that a full- length HBV genome was obtained after digestion of the pUC19-HBV1.0 integrated plasmid with SapI. The use of linear monomeric DNA for transfection is a better simulation of HBV minichromosome formation in a natural HBV infection process, because it avoids interference from plasmid minichromosome structures. After transfection, the linear HBV monomers undergo spontaneous circularization, serving as a template for cccDNA to start a complete viral replication cycle and express the viral proteins (Gunther et al., 1995). Gunther et al. had transfected monomeric linear full-length HBV genomes with SapI sticky ends, repeat HBV genomes into eukaryotic cells, demonstrating virus production.
Transcription of the pregenome RNA from cccDNA in the nucleus is the key step for genome amplification, ultimately determining the efficiency of HBV replication. Persistent HBV infection requires a steady-state population of transcriptionally active cccDNA molecules to ensure a stable source of pregenome RNA for replication and the templates for mRNA synthesis and viral production (Spencer et al., 2003; Ganem and Alfred, 2004). Although the cccDNA content in liver cells in natural infections has been reported to be low (5–50 copies per cell), it is very important for establishing and maintaining HBV replication (Masona et al., 1998). Only by clearing cccDNA can the HBV carrier state be completely eliminated, which is the ultimate goal of antiviral treatment (Seeger and Mason, 2000). It has also been shown that cccDNA is relatively insensitive to antiviral drugs. Further, persistent generation of cccDNA is the main cause of rebound of viral replication after stopping the antiviral treatment (Keasler et al., 2007). Many studies have shown that the activity of cccDNA is regulated by epigenetics events such as the acetylation status of cccDNA-bound H3 histones, which then influences its transcription and HBV replication. Pollicino et al. (2006) have shown that when class I/II histone deacetylase inhibitors increased acetylation levels of cccDNA-bound H3/H4 histones lysines 9 and 14, levels of HBV replication were significantly elevated, indicating that the acetylation status of HBV cccDNA-bound histones can regulate HBV replication, and this regulation directly affected the levels of cccDNA. This provided new insight into the molecular mechanisms of HBV replication (Tuttleman et al., 1986; Pollicino et al., 2006). In support of these previous results, our ChIP assays combined with real-time PCR and provided information on the dynamic post-translational changes of cccDNA-bound H3 histones in HepG2 cells (Stoll-Becker et al., 1997). The ChIP technology is the only way to study the interaction between DNA and protein in vivo (Kuo and Allis, 1999). In our study, this technique combined with real-time PCR, using selective primers (p23, P24), specificity of probes, and HBV cccDNA that had been treated with plasmid-safe DNase, and served to ensure the specificity and accuracy of our study.
The methylation of histones at particular amino acid residues has been shown to enhance (e.g., H3-K4) or repress (e.g., H3-K9, H3-K27) gene transcription (Swigut and Wysockal, 2007). Acetylation of histones has been associated with a variety of effects including converting areas of chromatin from dense to loose structures, exposing some genes for transcription, and enhancing expression. Acetylation effects are usually temporary (Levrero et al., 2009), whereas effects of methylation of histones are usually more stable, especially tri-methylation (Peterson and Laniel, 2004). The latter is regarded as a factor that influences long-term epigenetic memory (Wang et al., 2007). Methylation and acetylation are always mutually exclusive. Mono-methylation and di-methylation of H3-K9 are often found in silent areas of chromosomes, whereas tri-methylation of H3-K9 accumulates in the heterochromatins around centromeres (Berger, 2007). Various degrees of methylation can be found in different heterochromatin domains. Although the methylation of histone lysine 4 has been shown to stimulate gene expression, the main effect of methylation of histone lysine is on chromatin condensation and suppression of gene expression. Moreover, histone methylation is closely related to histone acetylation. For example, after deacetylation of H3-K9, H3-K9 can be methylated at the same position in the presence of histone methyltransferase, which produces a binding site for HP1 or other transcription inhibitory proteins (Jackson et al., 2002).
Although there is much evidence that the phosphorylation of histones mainly affects gene transcription relative to signal transduction pathways, both extracellular signal-regulated kinase (ERK)- mitogen-activated protein kinase (MAPK) and p38MAPK pathway can induce histone H3 phosphorylation. Some studies have revealed that rapid phosphorylation usually accompanies the activation of early action genes like c-fos and c-jun (Cheung et al., 2000; Salvador et al., 2001; Nowak and Corces, 2004), and after stimulating the ERK-MAPK pathway, the activation of c-fos is involved in phosphorylation of histone H3. In addition, the various histone modifications are not independent. There are certain inter-restrictive and cooperative relationships between the modifications. For example, the phosphorylation of H3-Ser10 can weaken the methylation of H3-K9, and the acetylation of H3-K9 and/or H3-K14 is capable of inhibiting the methylation of H3-Ser10 (Rea et al., 2000; Wang et al., 2001). The effect of histone lysine methylation on gene expression can either promote or inhibit gene expression depending on which amino acid residues are modified. For instance, methylation of histones H3-lysine 4 can activate gene expression (Liang et al., 2004; Schubeler et al., 2004). Similarly, the phosphorylation of H3-Ser10 also plays a crucial role in activating gene transcription in eukaryotes. This may explain why levels of phosphorylated and methylated H3 histone bound to cccDNA paralleled viral replication levels (Nowak and Corces, 2004). Further study is required to ascertain whether histone lysine demethylase (class LSD1/BHC110 and jumonji) has the ability to regulate the cccDNA transcription to control HBV replication by lowering the levels of H3 histone methylation (Klose and Zhang, 2007; Shi and Hetstine, 2007) or changing the phosphorylation status of HBV minichromosomes. Future research is planned to explore the relationships between acetylation, phosphorylation, and methylation modifications of cccDNA-bound H3 histones. In this regard, our results provide an experimental and theoretical basis for the use of cccDNA and viral minichromosomes as the targets of future antiviral treatment.
Footnotes
Acknowledgments
Our study was supported by grants from The National Natural Science Foundation of China (Grant No.: 30872249). We thank MedjadenBioscience Limited for assistance in the preparation of this manuscript.
Disclosure Statement
No competing financial interests exist. And there was no conflict of interest in the study.
References
Supplementary Material
Please find the following supplemental material available below.
For Open Access articles published under a Creative Commons License, all supplemental material carries the same license as the article it is associated with.
For non-Open Access articles published, all supplemental material carries a non-exclusive license, and permission requests for re-use of supplemental material or any part of supplemental material shall be sent directly to the copyright owner as specified in the copyright notice associated with the article.