
Abstract
Here we determined the mitochondrial genome sequence of a notorious pest, the diamondback moth Plutella xylostella (Lepidoptera: Yponomeutoidea: Plutellidae). The mitochondrial genome contains 37 typical animal mitochondrial genes and an A+T-rich region. The gene arrangement is identical to that of other ditrysian lepidopteran mitochondrial genomes, but different from the ancestral gene arrangement in the non-ditrysian Hepialidae of Lepidoptera. The start codon of the cox1 gene is CGA, which is dissimilar to its homologs in most other insects. In Lepidoptera, cox1 and cox2 have low nucleotide diversities, while the nad6, nad2, and nad3 genes are highly variable. Phylogenetic analyses uncovered the reciprocal monophyly of Ditrysia, Apoditrysia, Obtectomera, and Macrolepidoptera, and the placement of the Hesperiidae within Papilionoidea. Our analyses suggest that the complete mitochondrial genome sequences are a promising marker toward fully resolving the phylogenetic relationships within Lepidoptera.
Introduction
Lepidoptera is one of the most species-rich and widely distributed insect orders, the members of which function as herbivores, pollinators, and prey. This order also constitutes one of the most damaging groups of pests to agriculture overall. Current classifications divide the order Lepidoptera into four suborders (Kristensen, 1984), with Glossata, the most advanced suborder, containing more than 99 percent of all Lepidoptera. Among the major clades of Glossata, Ditrysia contains advanced moths and butterflies and includes 98 percent of all Lepidoptera (Minet, 1991). The understanding of the phylogenetic relationships among Lepidoptera is essential to study this important insect order and will contribute meaningful information that can be used in the reconstruction of the tree of life. Presently, the phylogenetic relationships among the non-ditrysian lineages of Lepidoptera is well accepted (Nielsen and Kristensen, 1996), while the internal relationships among the major groups of Ditrysia are still controversial, although effort has been made using morphological and molecular characters (Kristensen et al., 2007; Regier et al., 2009). Within Ditrysia, three clades, that is, Apoditrysia, Obtectomera, and Macrolepidoptera have been recognized. The most authoritative phylogenetic analyses on the major groups of Ditrysia pointed out that further gene and taxon sampling are needed to strongly resolve individual deeper nodes (Regier et al., 2009; Mutanen et al., 2010). The early radiations of ditrysian superfamilies are likely to have been rapid (Kristensen et al., 2007). Thus, the resolution of its phylogenetic relationships will most likely require accurate analytical methods and many genes to provide sufficiently powerful information. Complete mitochondrial genome sequences have proved to be a powerful tool for the construction of high-level phylogenetic relationships in Lepidoptera (Hong et al., 2008; Li et al., 2010; Kim et al., 2011). However, no mitochondrial genomes have been sequenced from the family Plutellidae.
Here we determined the representative mitochondrial genome sequence of Plutellidae from a notorious pest, the diamondback moth Plutella xylostella. Subsequently, the phylogenetic relationships among major lineages of the advanced moths and butterflies were reconstructed using the complete mitochondrial genome sequences.
Materials and Methods
Specimens, DNA extraction, PCR amplification, and sequencing
P. xylostella specimens were obtained from a strain reared in the Laboratory of Integrated Pest Management, Beijing Academy of Agriculture and Forestry Sciences. Total genomic DNA was extracted from a single fourth instar larva using the DNeasy tissue kit according to the manufacturer's protocol (Qiagen). Nine primer pairs, which were either universal for insect mitochondrial genes or modified specifically for lepidopteran mitochondrial genes, were used according to previous studies (Simon et al., 1994; Simon et al., 2006). The regions of the nine amplified sequences were cox1-cox2, cox2-nad3, nad3-nad5, nad5-nad4, nad4-cob, cob-rrnL, rrnL-rrnS, rrnS-trnY, and trnI-cox1 (Supplementary Table S1; Supplementary Data are available online at
Genome annotation and secondary structure prediction
The tRNA searches were carried out with the tRNAscan-SE search server (Lowe and Eddy, 1997). All of the 22 typical animal mitochondrial tRNA genes were identified using Mito/Chloroplast as the source along with the Invertebrate Mito genetic code. Protein-coding genes were initially identified using BLAST searches in GenBank and subsequently by alignment with the genes of other lepidopteran insects. The boundary regions of rrnL are located downstream of the 5′ end of trnL1 and upstream of the 3′ end of trnV. The 3′ region of rrnS is located downstream of trnV, and the 5′ region is determined by alignment with genes of other lepidopteran insects. The rRNA structures were constructed by comparison with those in other insects (Cannone et al., 2002). All secondary structures were drawn in XRNA (developed by B. Weiser and available at
Evolutionary analysis of protein-coding genes in Lepidoptera
The relative synonymous codon usage (RSCU) values were calculated with the MEGA 5 program (Tamura et al., 2011) for each protein-coding gene, excluding the start and stop codons. The nucleotide diversity (Pi) and the Jukes and Cantor-corrected nucleotide diversity [Pi(JC)] were calculated by the software package DnaSP 4.0 (Rozas et al., 2003). The nucleotide compositional heterogeneity across lepidopteran species was estimated by self-organizing clustering and analysis of heterogeneity (Jermiin et al., 2004) implemented in SeqVis v1.4 (Ho et al., 2006).
The level of saturation in the first, second, and third codon positions was separately analyzed using scatter plot graphics, comparing the uncorrected p-distances with the distances calculated by applying the best-fit evolutionary model (GTR+G+I) selected by the jModeltest2 (Posada, 2009). All distances were calculated with PAUP*4.0 b10 (Swofford, 2002).
Phylogenetic inference
The mitochondrial genome sequences used in this study were downloaded from GenBank. The classification of Lepidoptera was based on van Nieukerken et al., (2011). In total, 32 lepidopteran mitochondrial genomes, representing 32 species, 9 superfamilies, and 17 families, were used in our phylogenetic analysis. Two non-ditrysians species from the family of Hepialidae were used as outgroup taxa (Table 1).
The nucleotide sequence alignment of the protein-coding genes was inferred individually from amino acid alignment using MUSCLE with default parameters implemented in MEGA5 (Edgar, 2004; Tamura et al., 2011). Multiple alignment of each gene was analyzed with the Gblocks program (Castresana, 2000) to remove problematic regions under a relaxed approach (Talavera and Castresana, 2007) (Minimum number of sequences for a conserved position=17, minimum number of sequence for a flank position=27, maximum number of contiguous nonconserved positions=8, minimum number of a block=10, allowed gap positions=with half) and the kind of data by codon for DNA sequences. All of the protein-coding genes were concatenated following their ancestral order in the insect mitochondrial genomes.
Four datasets were employed in the phylogenetic analyses: the nucleotide sequences of the first and second codon positions (P12), all codon positions (P123), the first and second codon positions, and the RY-coded (purines coded by R and pyrimidines coded by Y) third codon position (P12RY3), and amino acid sequences (aa) of all protein-coding genes. The data of nucleotide sequences were partitioned based on the first, second, and third codon positions.
The phylogenetic analyses were performed using the Bayesian inference method implemented in MrBayes v3.2 (Ronquist et al., 2012). The models of DNA substitution were estimated in jModeltest2 (Posada, 2009). A general time-reversible model with gamma distribution plus a proportion of invariant sites (GTR+G+I) was used for the four-state nucleotide sequences, and a two-state substitution model with gamma distribution plus a proportion of invariant sites (I+G) was used for the RY-coded third codon position. The models of amino acid substitution were estimated in ProtTest v 2.4 (Abascal et al., 2005). The MtArt model was used for amino acid sequences with all parameters estimated. All Bayesian analyses were performed with four independent Markov chains run for 3,000,000 metropolis-coupled MCMC generations with tree sampling every 100 generations and a burn-in of 2500 trees. Convergence of independent runs was checked with the software Tracer v1.4. The phylogenetic trees were viewed and edited in the Figtree v1.4 (Rambaut, 2012).
Results and Discussion
Sequencing and structure of P. xylostella mitochondrial genome
In total, 16,079 bp of the P. xylostella mitochondrial genome sequence were determined, including all typical animal mitochondrial genes (13 protein-coding genes, two rRNA, and 22 tRNA genes) (GenBank accession No. JF911819). This is the first reported mitochondrial genome sequence from the family Plutellidae. However, we could not successfully sequence the complete A+T-rich region. Initially, a segment of approximately 3000 bp was amplified, including a partial region of the 5′ end of rrnS, an A+T-rich region, and a partial region of trnM. The sequencing reaction of this 3000-bp segment from the 3′ end succeeded, while it failed from the 5′ end after 340 bp because of a poly-T stretch. Further sequencing of this segment by primer walking from the sequenced region of the 5′ end could not be performed. Because of the high A+T content, there is no proper region that could be used for the design of a sequencing primer in this region. In total, 981 bp of the A+T-rich region was sequenced, leaving a 2000-bp A+T-rich region undetermined. Therefore, the A+T-rich region of the P. xylostella sequence is approximately 3000 bp long. The failure to sequence the entire A+T-rich region is a common issue occurring in the investigation of animal mitochondrial genomes because of their extremely high A+T content, stable stem-and-loop structures, and the presence of repeat sequences (Castro and Dowton, 2005; Castro et al., 2006; Cameron et al., 2008; Wei et al., 2010b).
All of the 37 genes and the A+T-rich region are arranged as in most previously reported lepidopteran mitochondrial genomes, in which trnM is shuffled from 3′ downstream of trnQ to 5′ upstream of trnI compared to the hypothesized ancestral arrangement pattern of insects (Fig. 1). The rearrangement of trnM was presumed to be a synapomorphic character in lepidopteran mitochondrial genomes (Kim et al., 2006; Liao et al., 2010). However, it should be noted that most of the previously sequenced mitochondrial genomes in Lepidoptera are restricted in to the clade of Ditrysia. A recent study on the ghost moths, from non-ditrysian lineage Hepialoidea, revealed the ancestral arrangement of trnI-trnQ-trnM in this group (Cao et al., 2012).
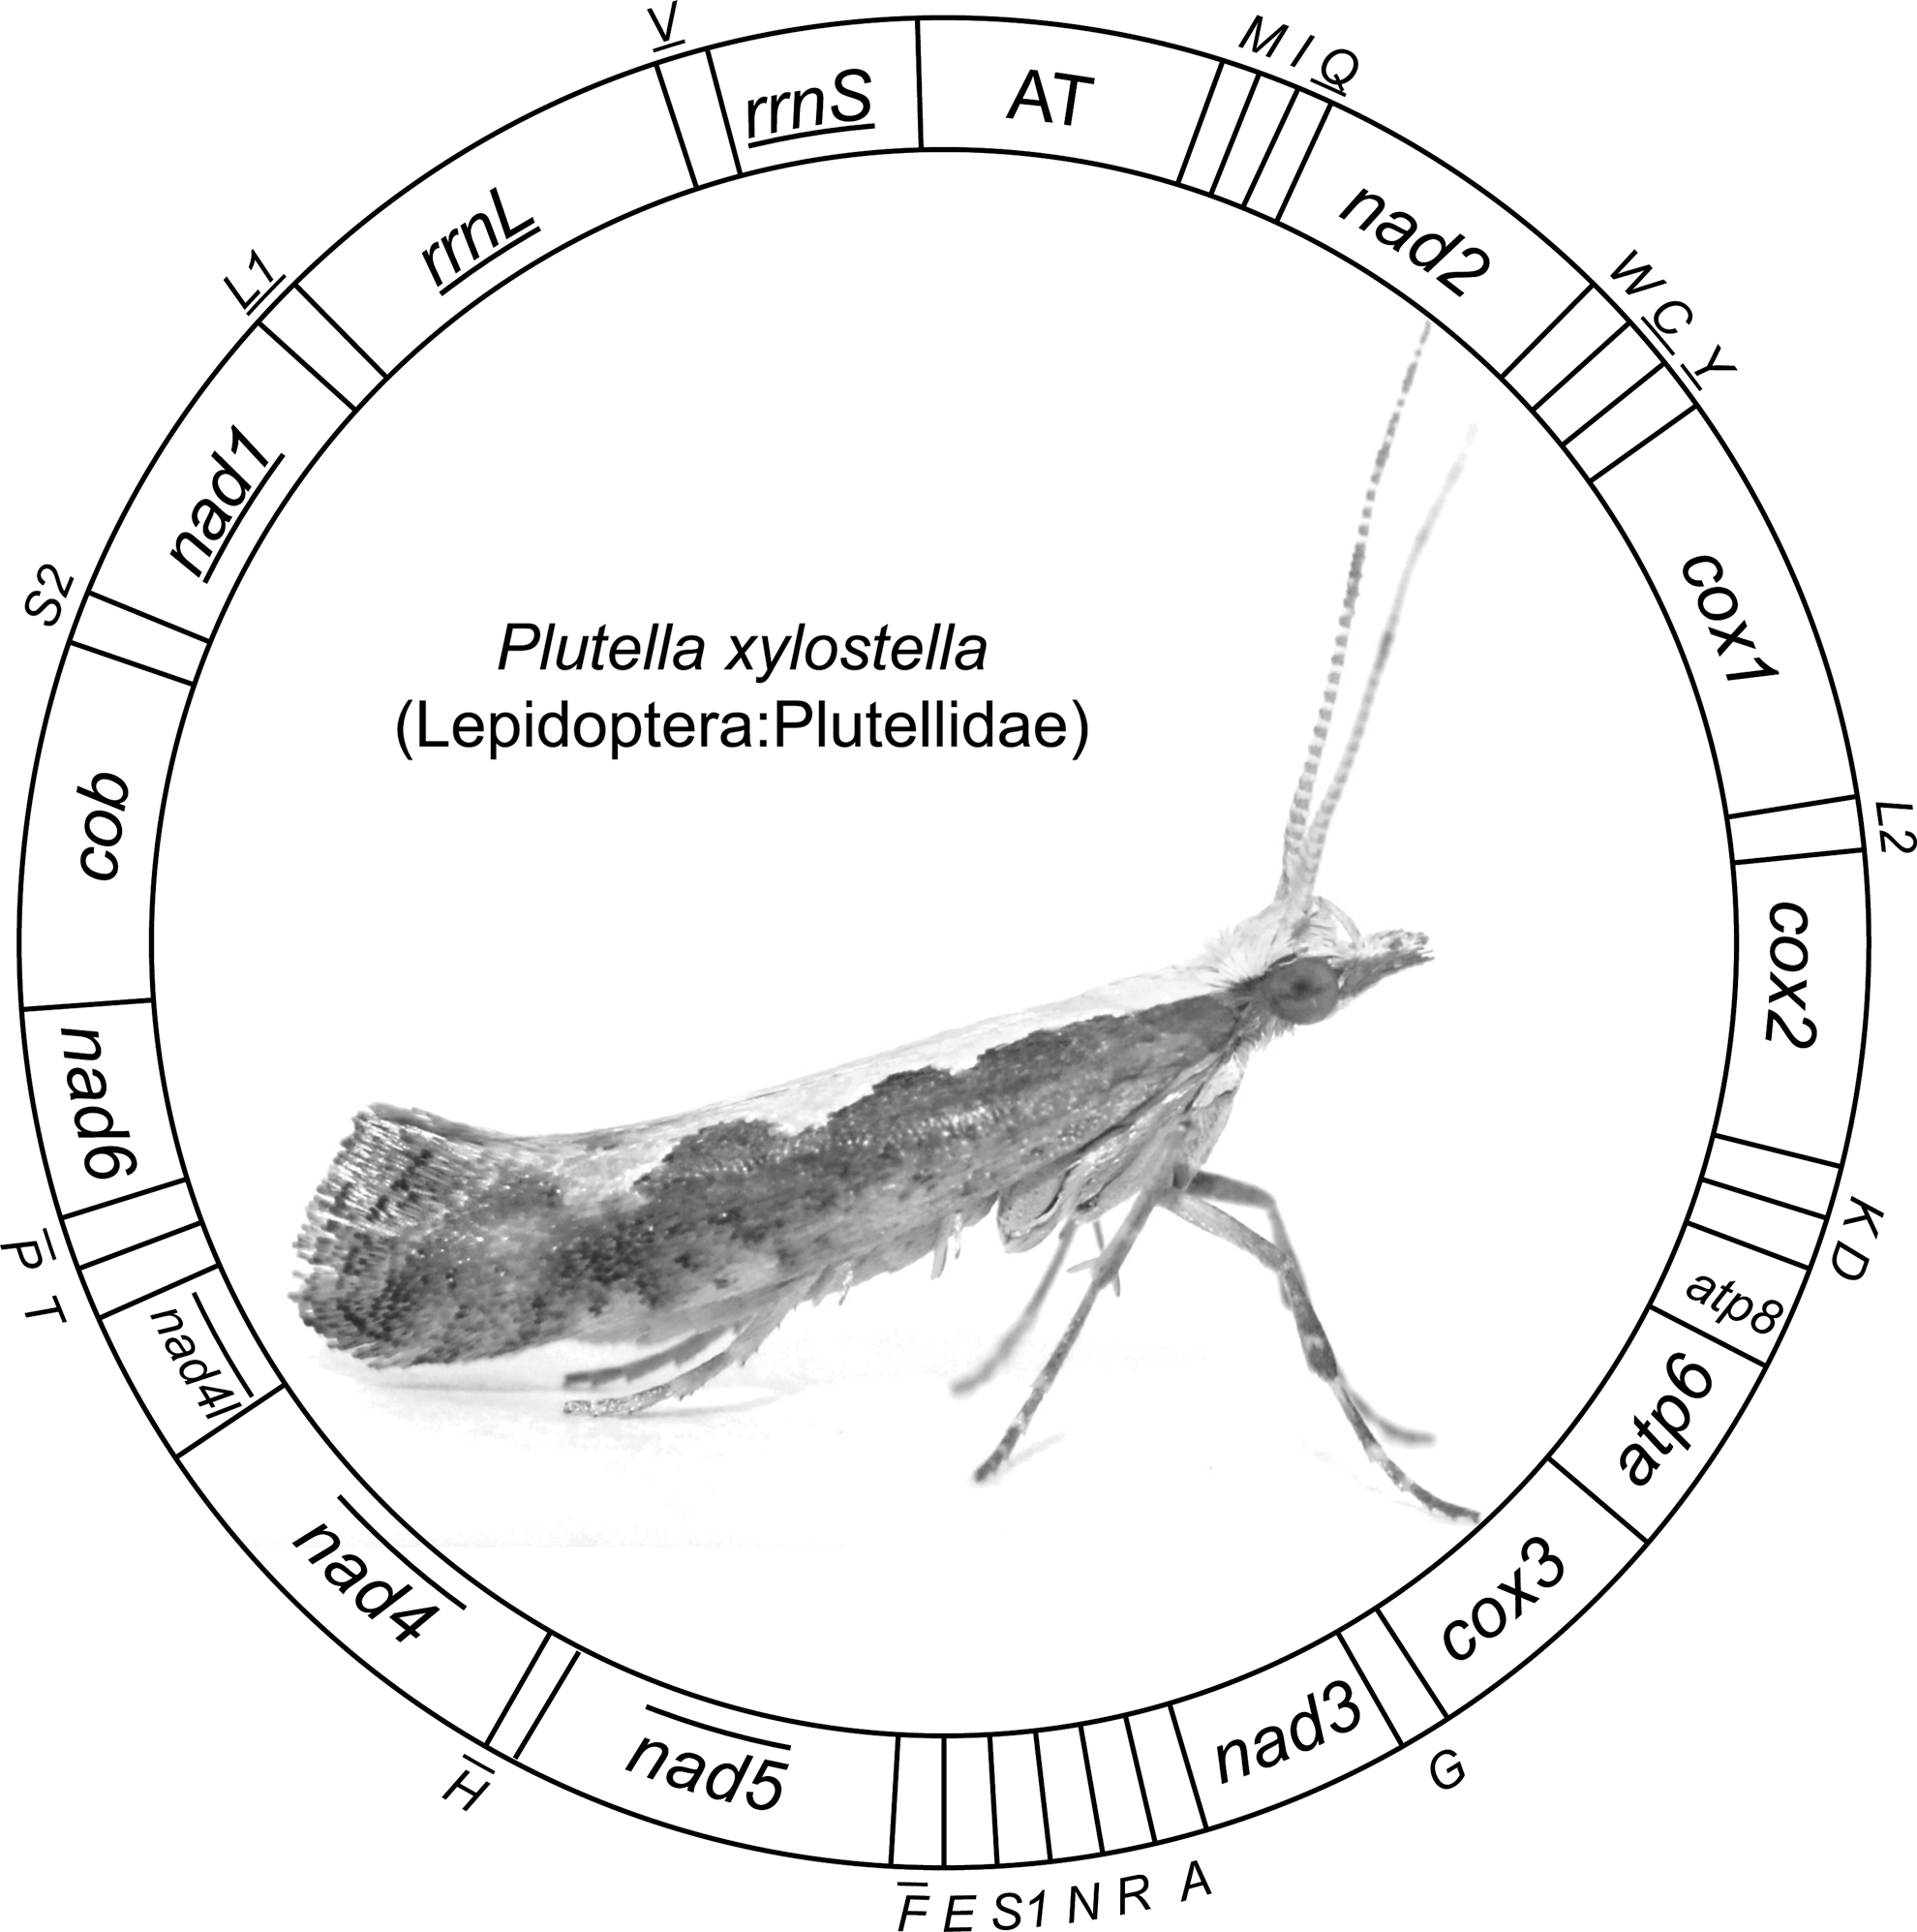
Gene arrangement pattern of the Plutella xylostella mitochondrial genome. The cox1, cox2, and cox3 labels refer to the cytochrome oxidase subunits, cob refers to cytochrome b, nad1-nad6 refer to NADH dehydrogenase components, and rrnL and rrnS refer to ribosomal RNAs. The transfer RNA genes are denoted by their one-letter symbol according to the IPUC-IUB single-letter amino acid codes. L1, L2, S1, and S2 denote tRNALeu(CUN), tRNALeu(UUR), tRNASer(AGY), and tRNASer(UCN), respectively. AT indicates the A+T-rich region. The gene names with lines indicate that the genes are coded on the minority strand, while those without lines are on the majority strand.
There are a total of 21 overlapping nucleotides, with the lengths of the overlapping sequences ranging from 1–8 bp, between neighboring genes in six locations, while there are a total of 296-bp intergenic nucleotides in 17 locations, with the length of the intergenic spacers ranging from 1–54 bp, excluding the A+T-rich region (Table 2).
IN, intergenic nucleotides; +, the gene coded on majority strand; −, the gene coded on minority strand.
rRNA genes
In the P. xylostella mitochondrial genome, rrnL is located between trnL1 and trnV, and rrnS is located between trnV and the A+T-rich region as in most insect mitochondrial genomes (Wolstenholme, 1992). The length of rrnL is 1379 bp, while the length of rrnS is 783 bp. Both rrnL and rrnS conform to the secondary structure models proposed for these genes from other insects (Cameron and Whiting, 2008; Wei et al., 2009; Wei et al., 2010c; Gong et al., 2011). Forty-nine helices belonging to six domains are present in the rrnL secondary structure of P. xylostella (Fig. 2), and a total of 29 helices belonging to three domains are present in rrnS, as in of other insects (Cameron and Whiting, 2008; Wei et al., 2009; Wei et al., 2010c; Gong et al., 2011) (Fig. 3).
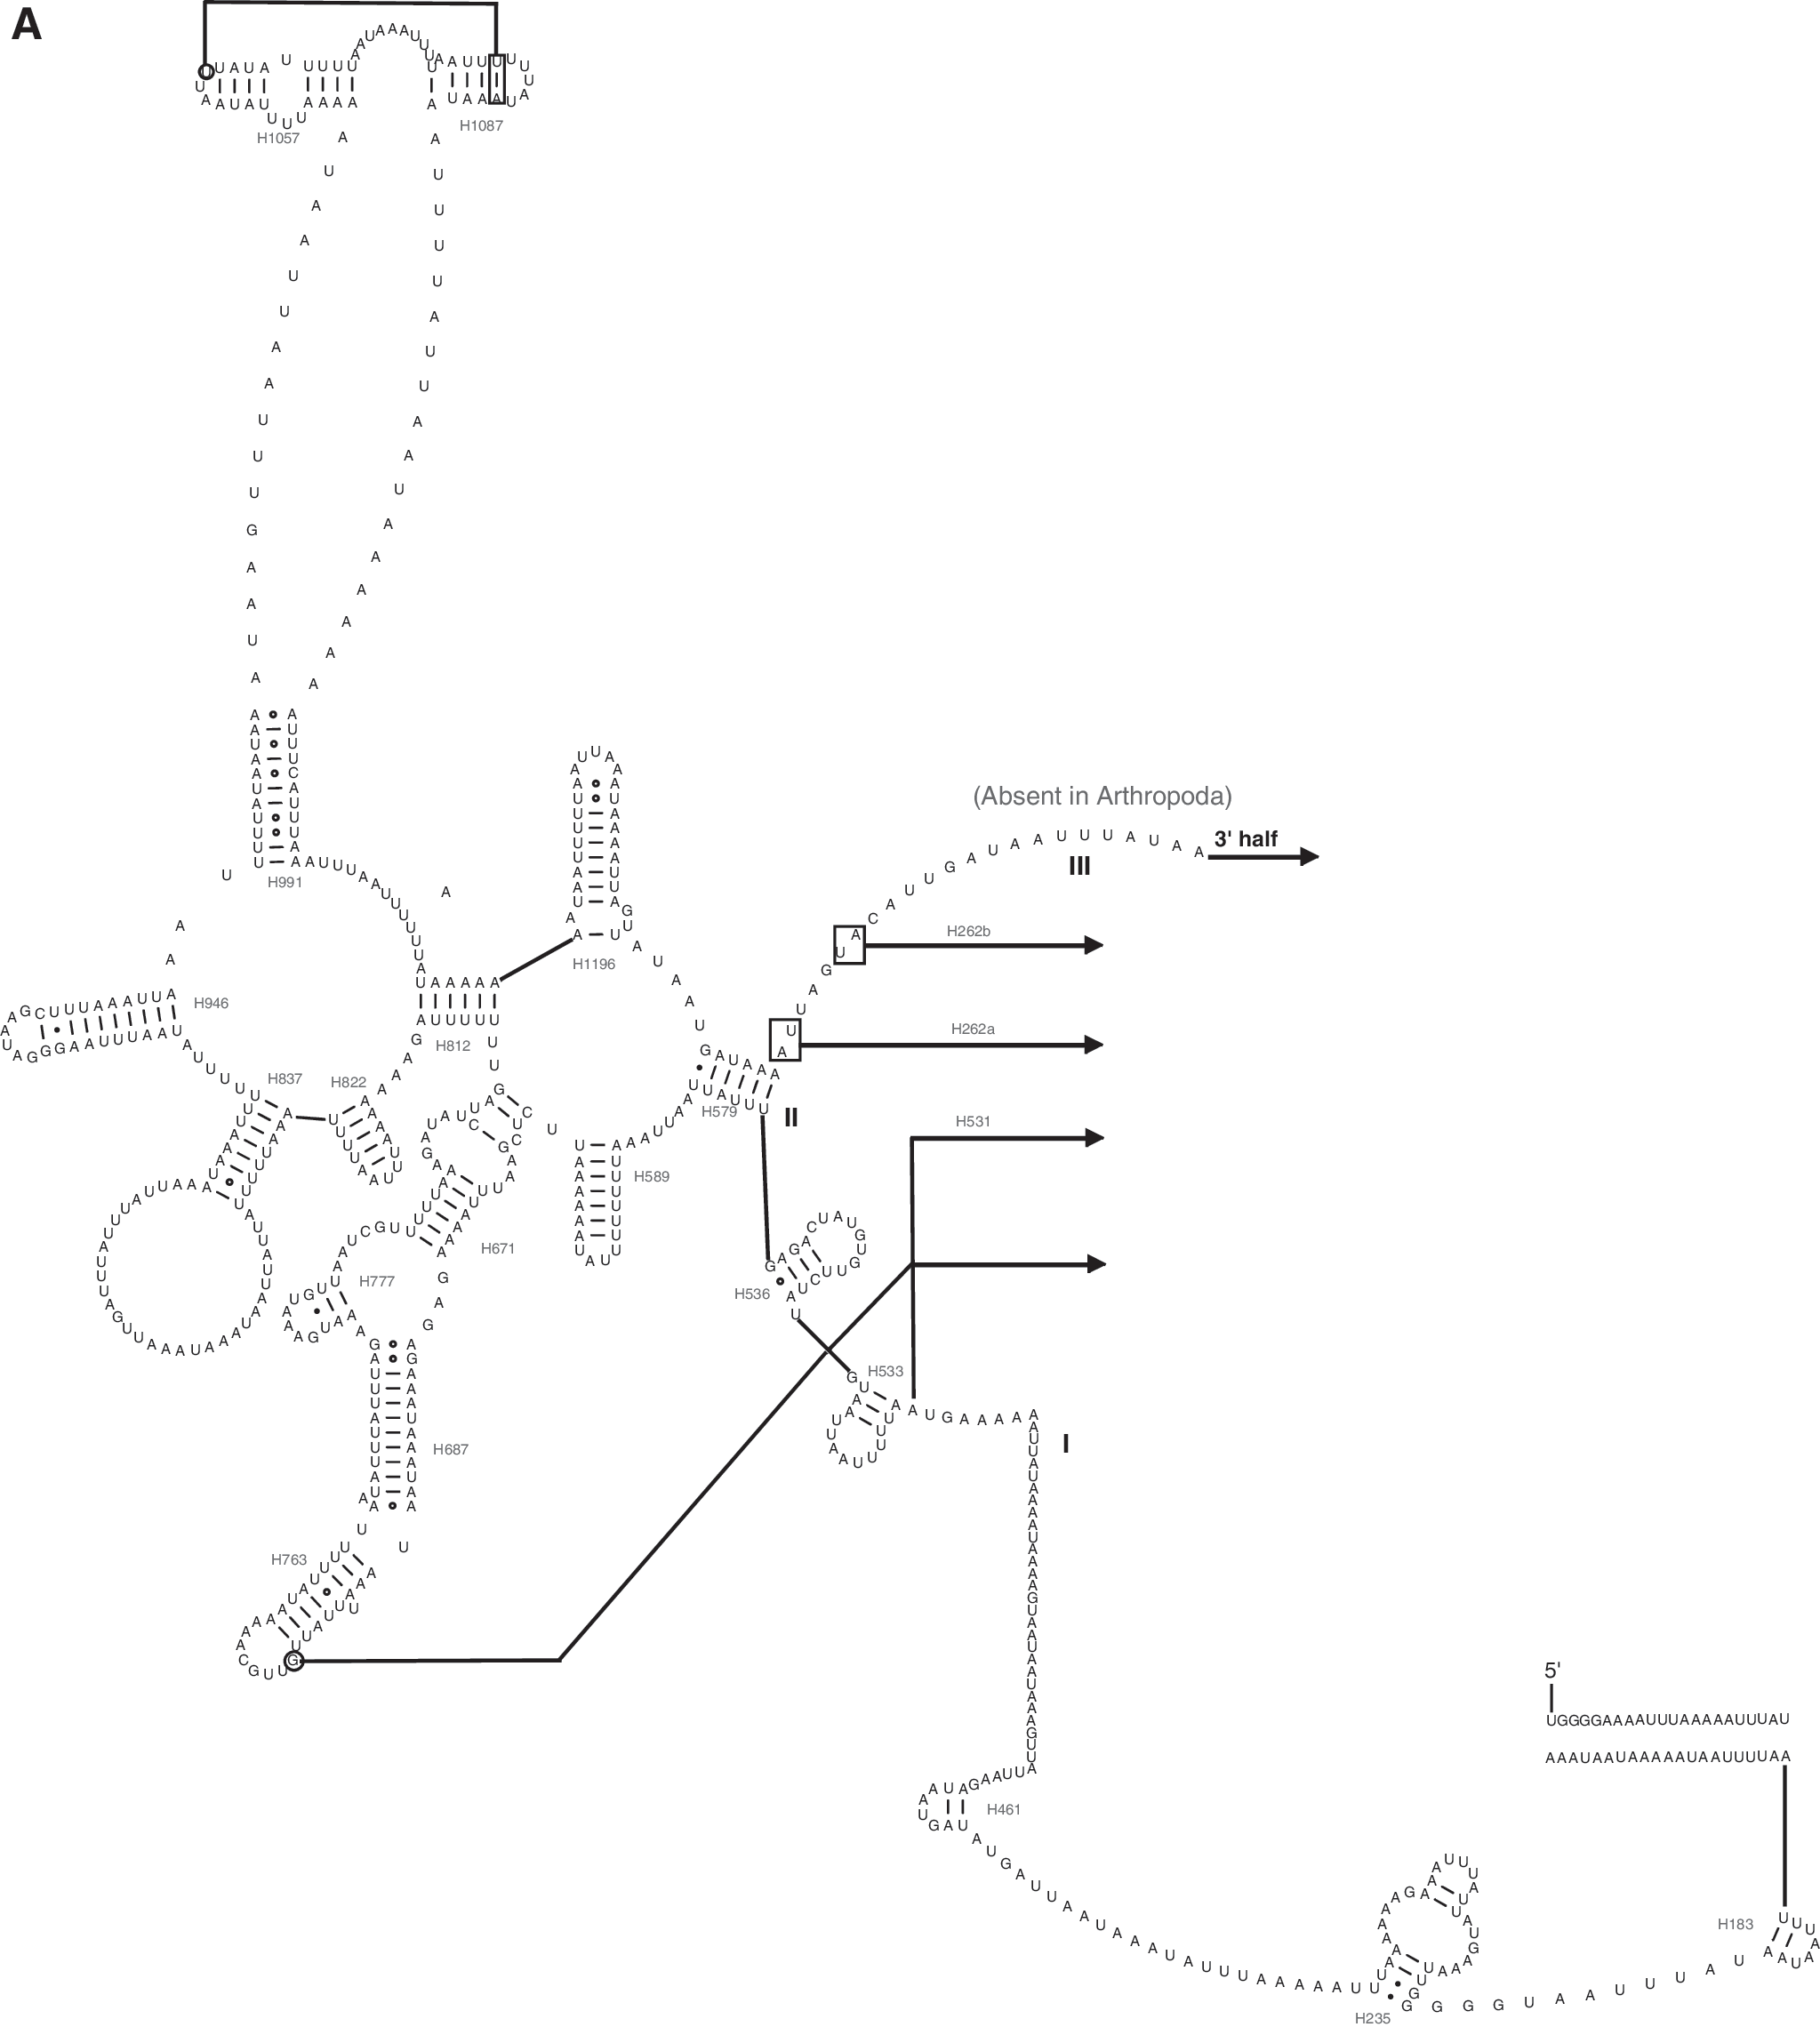
Predicted rrnL secondary structure in the P. xylostella mitochondrial genome. Tertiary interactions and base triples are connected by continuous lines. Base pairing is indicated as follows: Watson–Crick pairs by lines, wobble GU pairs by dots, and other noncanonical pairs by circles.
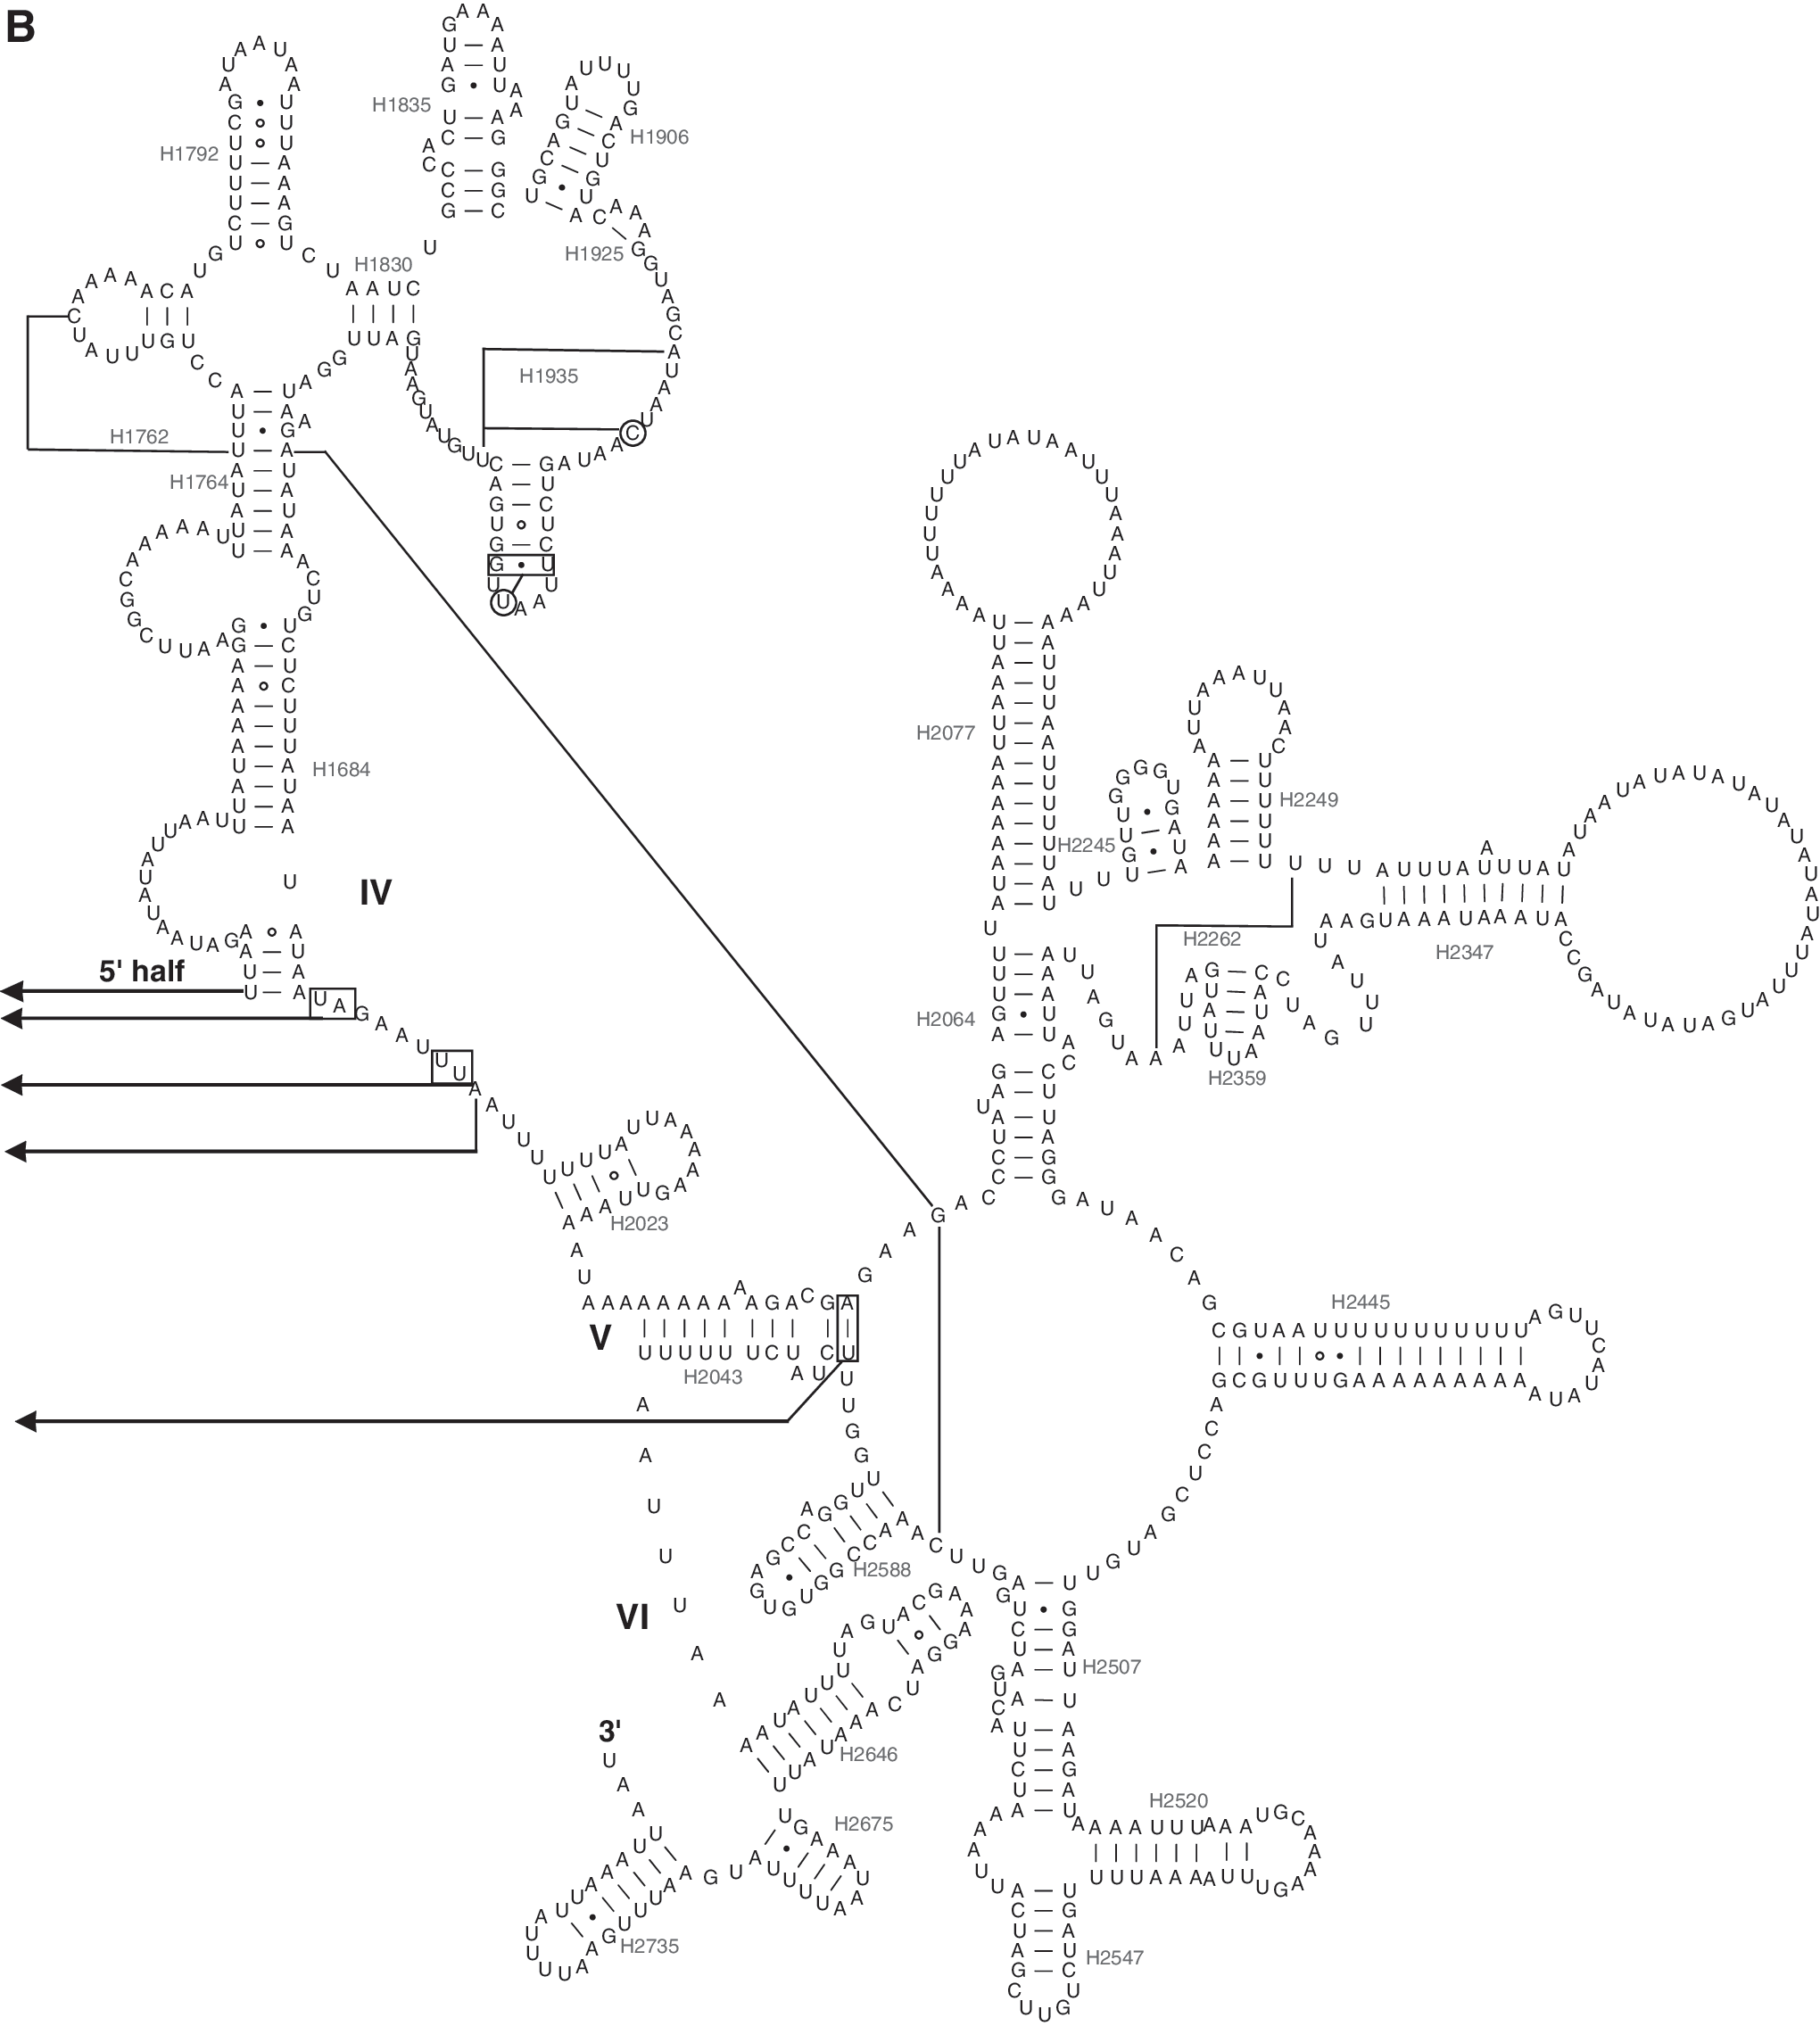
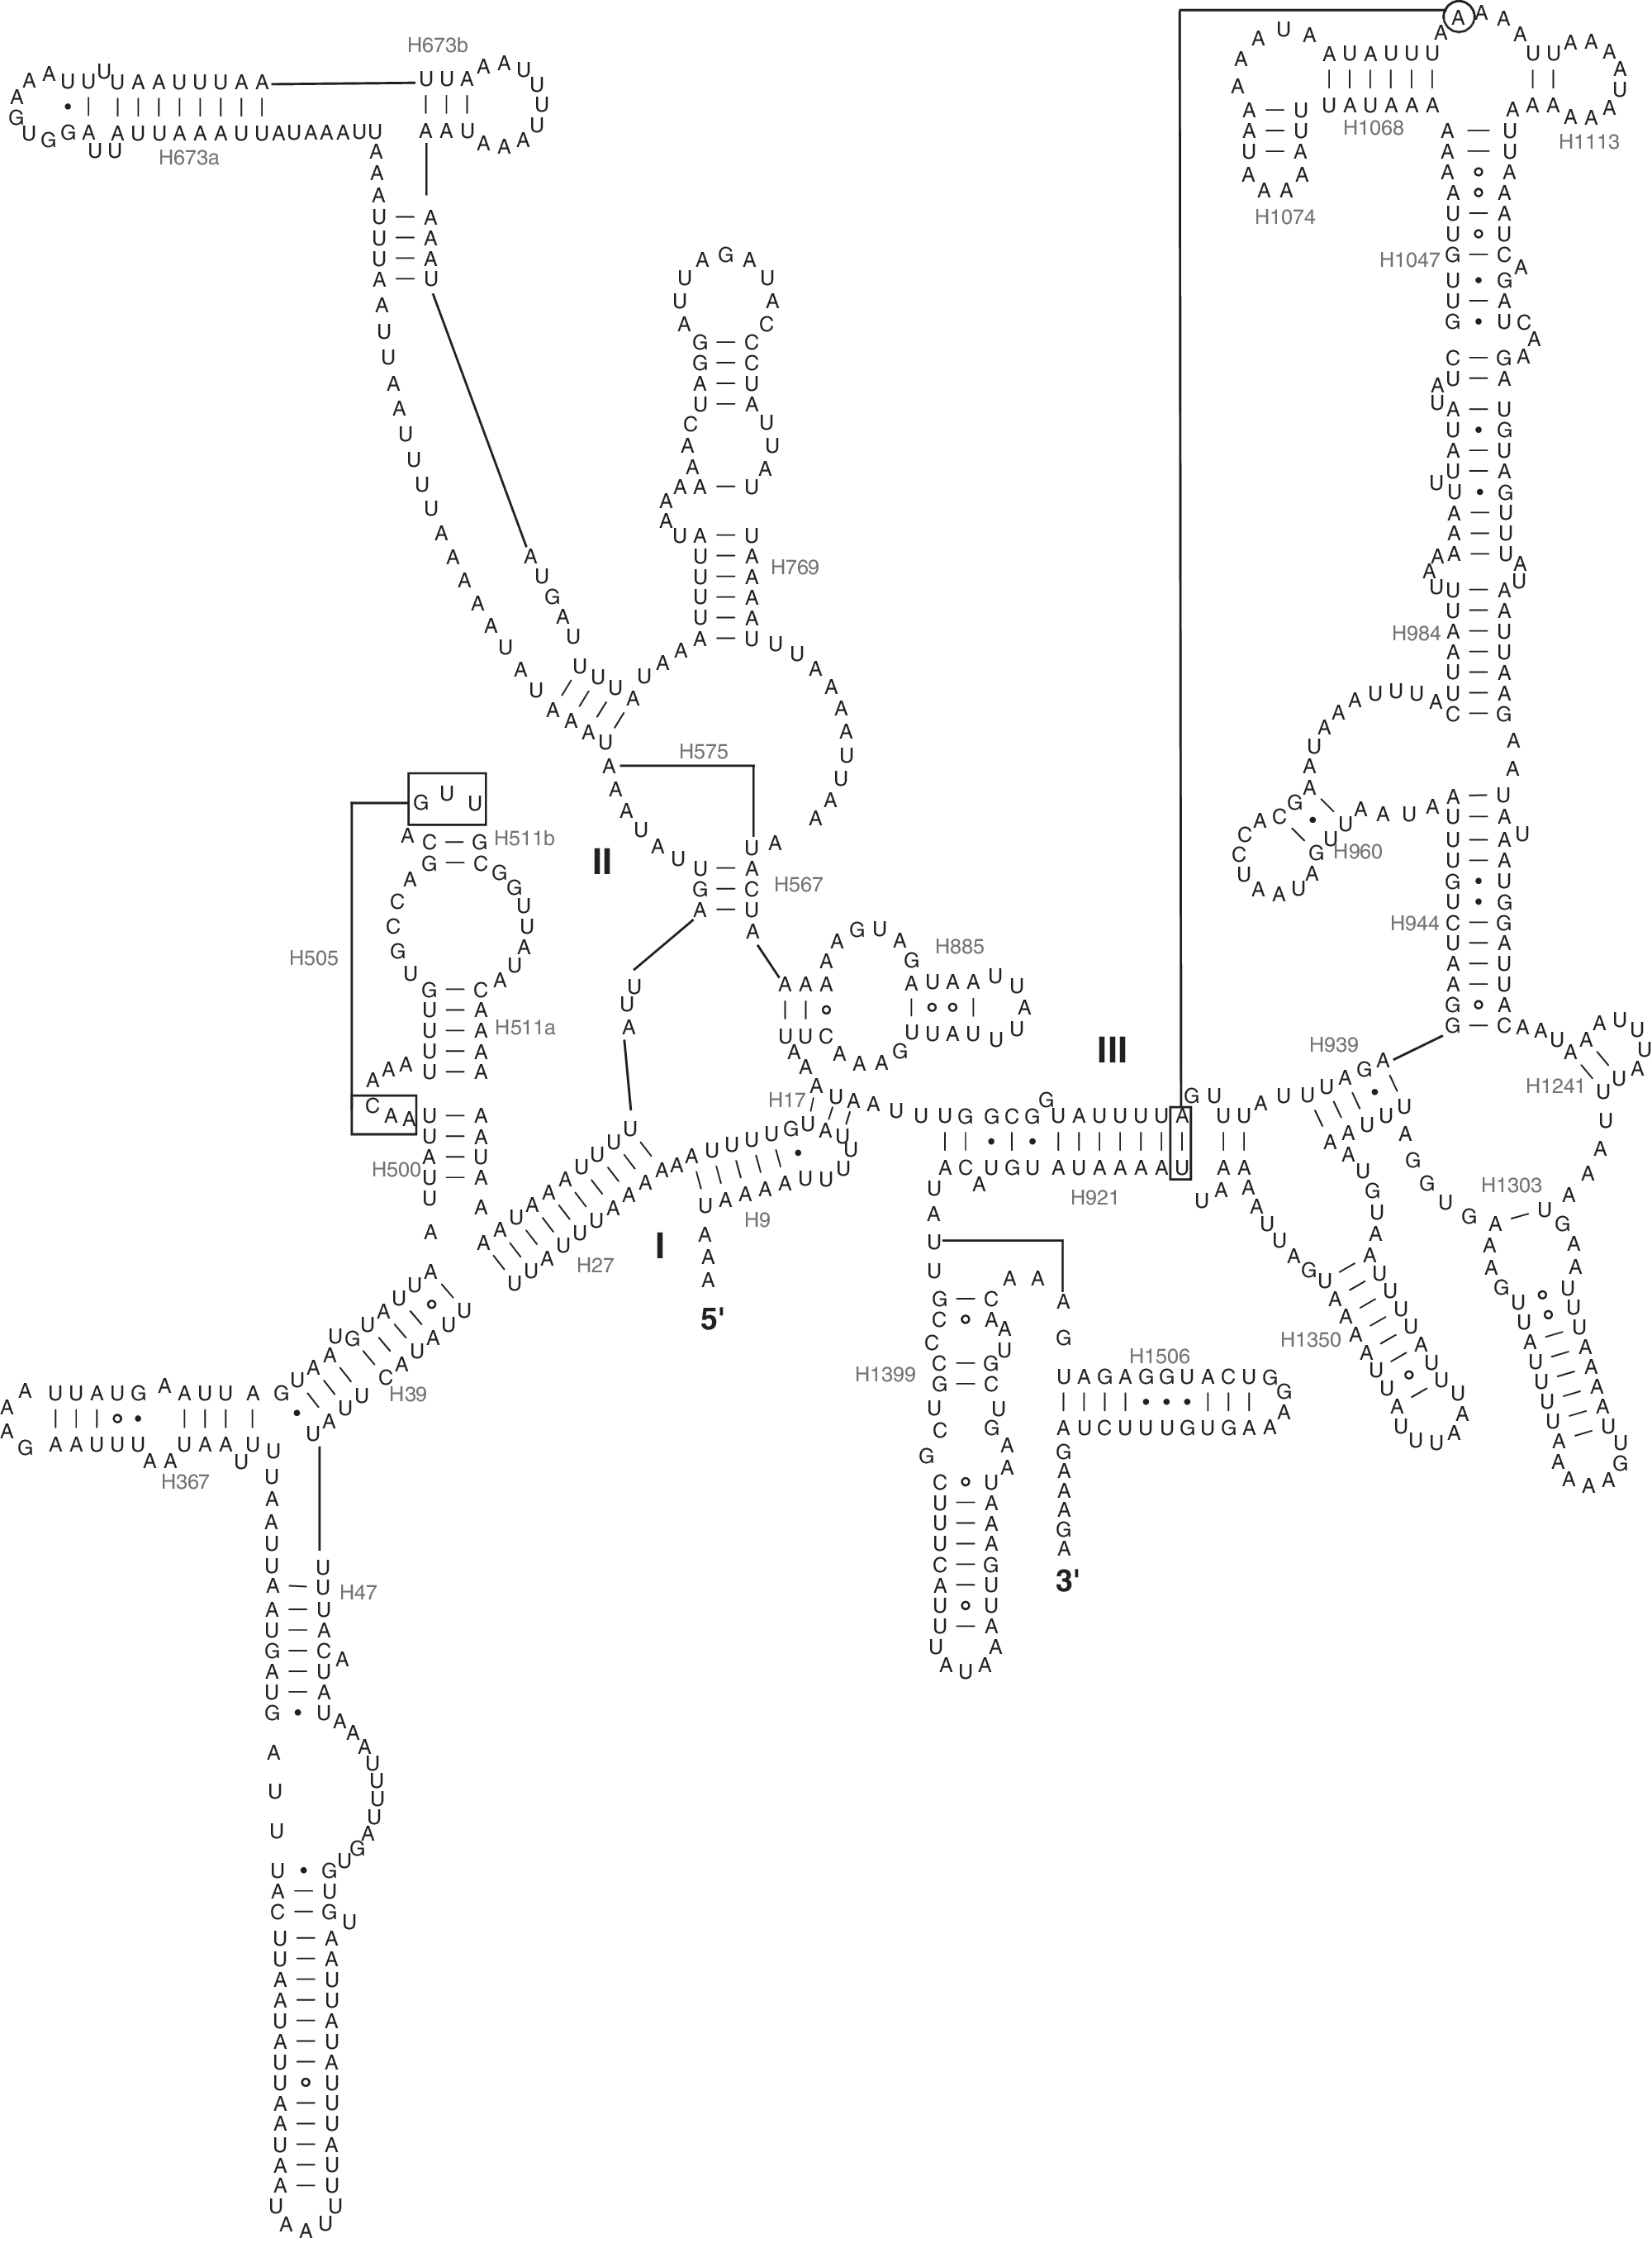
Predicted rrnS secondary structure in the P. xylostella mitochondrial genome. Symbols are as in Fig. 2.
tRNA genes
The lengths of the tRNA genes range from 65 to 71 bp. All of the tRNA genes have a typical cloverleaf structure (Fig. 4). The trnL1 gene has a longer variable loop, 9 bp, compared to the other tRNAs, in which the length of the variable loop varies between 4 and 6 bp. Long variable loops in tRNA genes have been reported in Hymenoptera (Wei et al., 2009). D-stem pairings of trnS1 are frequently absent in many sequenced insect mitochondrial genomes (Feng et al., 2010; Wei et al., 2010c). Thus, the secondary structure of trnS1 usually cannot be identified and folded using conventional tRNA search methods such as tRNAscan-SE (Sheffield et al., 2008). In P. xylostella, trnS1 could be identified with tRNAscan-SE. The anticodons for all of the tRNA genes are identical to their counterparts in most other published insect mitochondrial genomes.
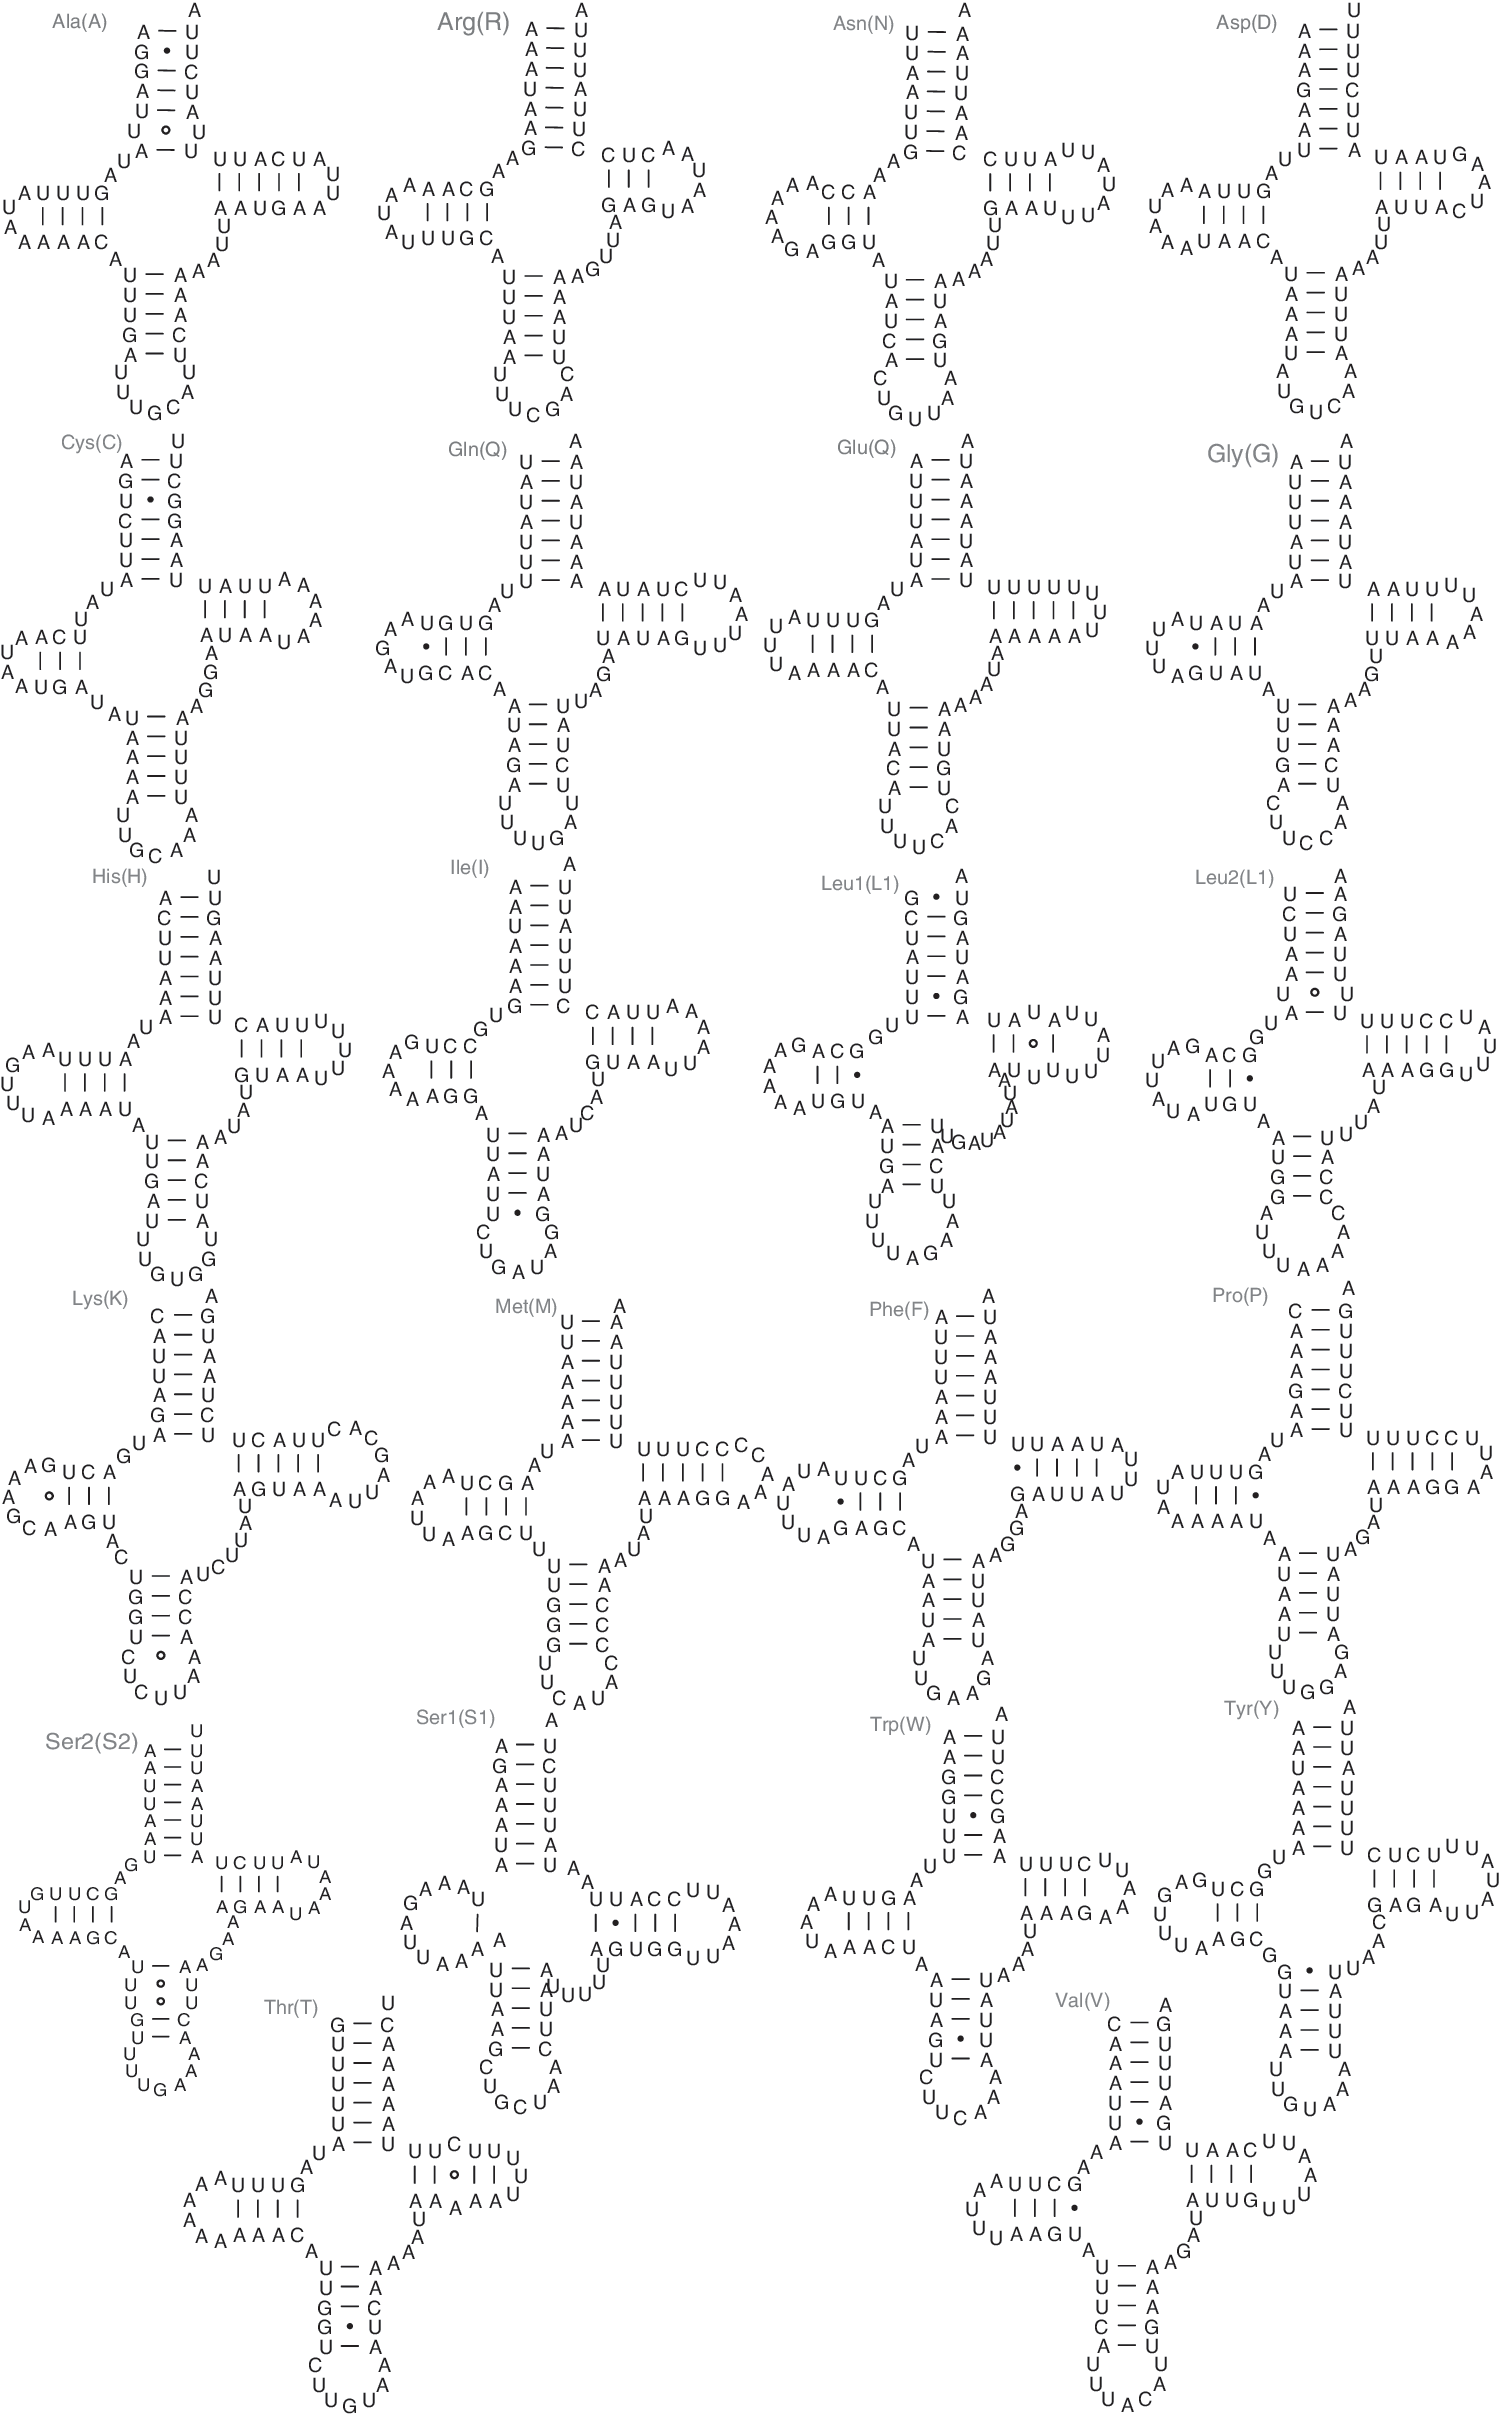
Predicted secondary structures for the 22 typical tRNA genes of the P. xylostella mitochondrial genome. Symbols are as in Fig. 2.
In the mitochondrial tRNA genes, noncanonical pairs were common in the secondary structures. There are 18 wobble G–U, five U–U, one A–G, and two A–C pairs present in the 22 tRNA secondary structures.
A+T-rich region
In insect mitochondrial genomes, the longest noncoding region is usually the A+T-rich region, located between rrnS and the trnI-trnQ-trnM cluster, though exceptions exist, such as in Hymenoptera (Wei et al., 2009; Wei et al., 2010b). This region is high in the A+T content and frequently contains repeat sequences. Because there are essential regulatory elements for transcription and replication in this area, it is also called the control region (Zhang and Hewitt, 1997). In the P. xylostella mitochondrial genome, the predicted A+T-rich region is approximately 3000 bp long, and is among the longest A+T-rich regions in insect mitochondrial genomes (Zhang and Hewitt, 1997; Wei et al., 2009). The presently determined A+T-rich region in the P. xylostella mitochondrial genome is 981 bp long; 88 bp are located adjacent to rrnS, and 893 bp are located adjacent to trnM. In total, 91.64% of the nucleotides are A and T. Seven repeat sequences of TTATGTAAATATTTAAATTA TATATAAAA and two long repeat sequences of 160 bp are present in the A+T-rich region. The latter is composed of three repeat sequences and a 73-bp sequence. Five conserved elements that might be involved in genome replication and transcription were found in the A+T-rich region: a poly-T stretch at the 5′ end of the A+T-rich region, which may be involved in the control of transcription and/or replication initiation; a [TA(A)]n-like stretch following the poly-T stretch; a stem and loop structure, which may be associated with the second strand-replication origin; a TATA motif and a G (A)nT motif flanking the stem and loop structure; and a G+A-rich sequence downstream of the stem and loop structure (Zhang and Hewitt, 1997) (Fig. 5).
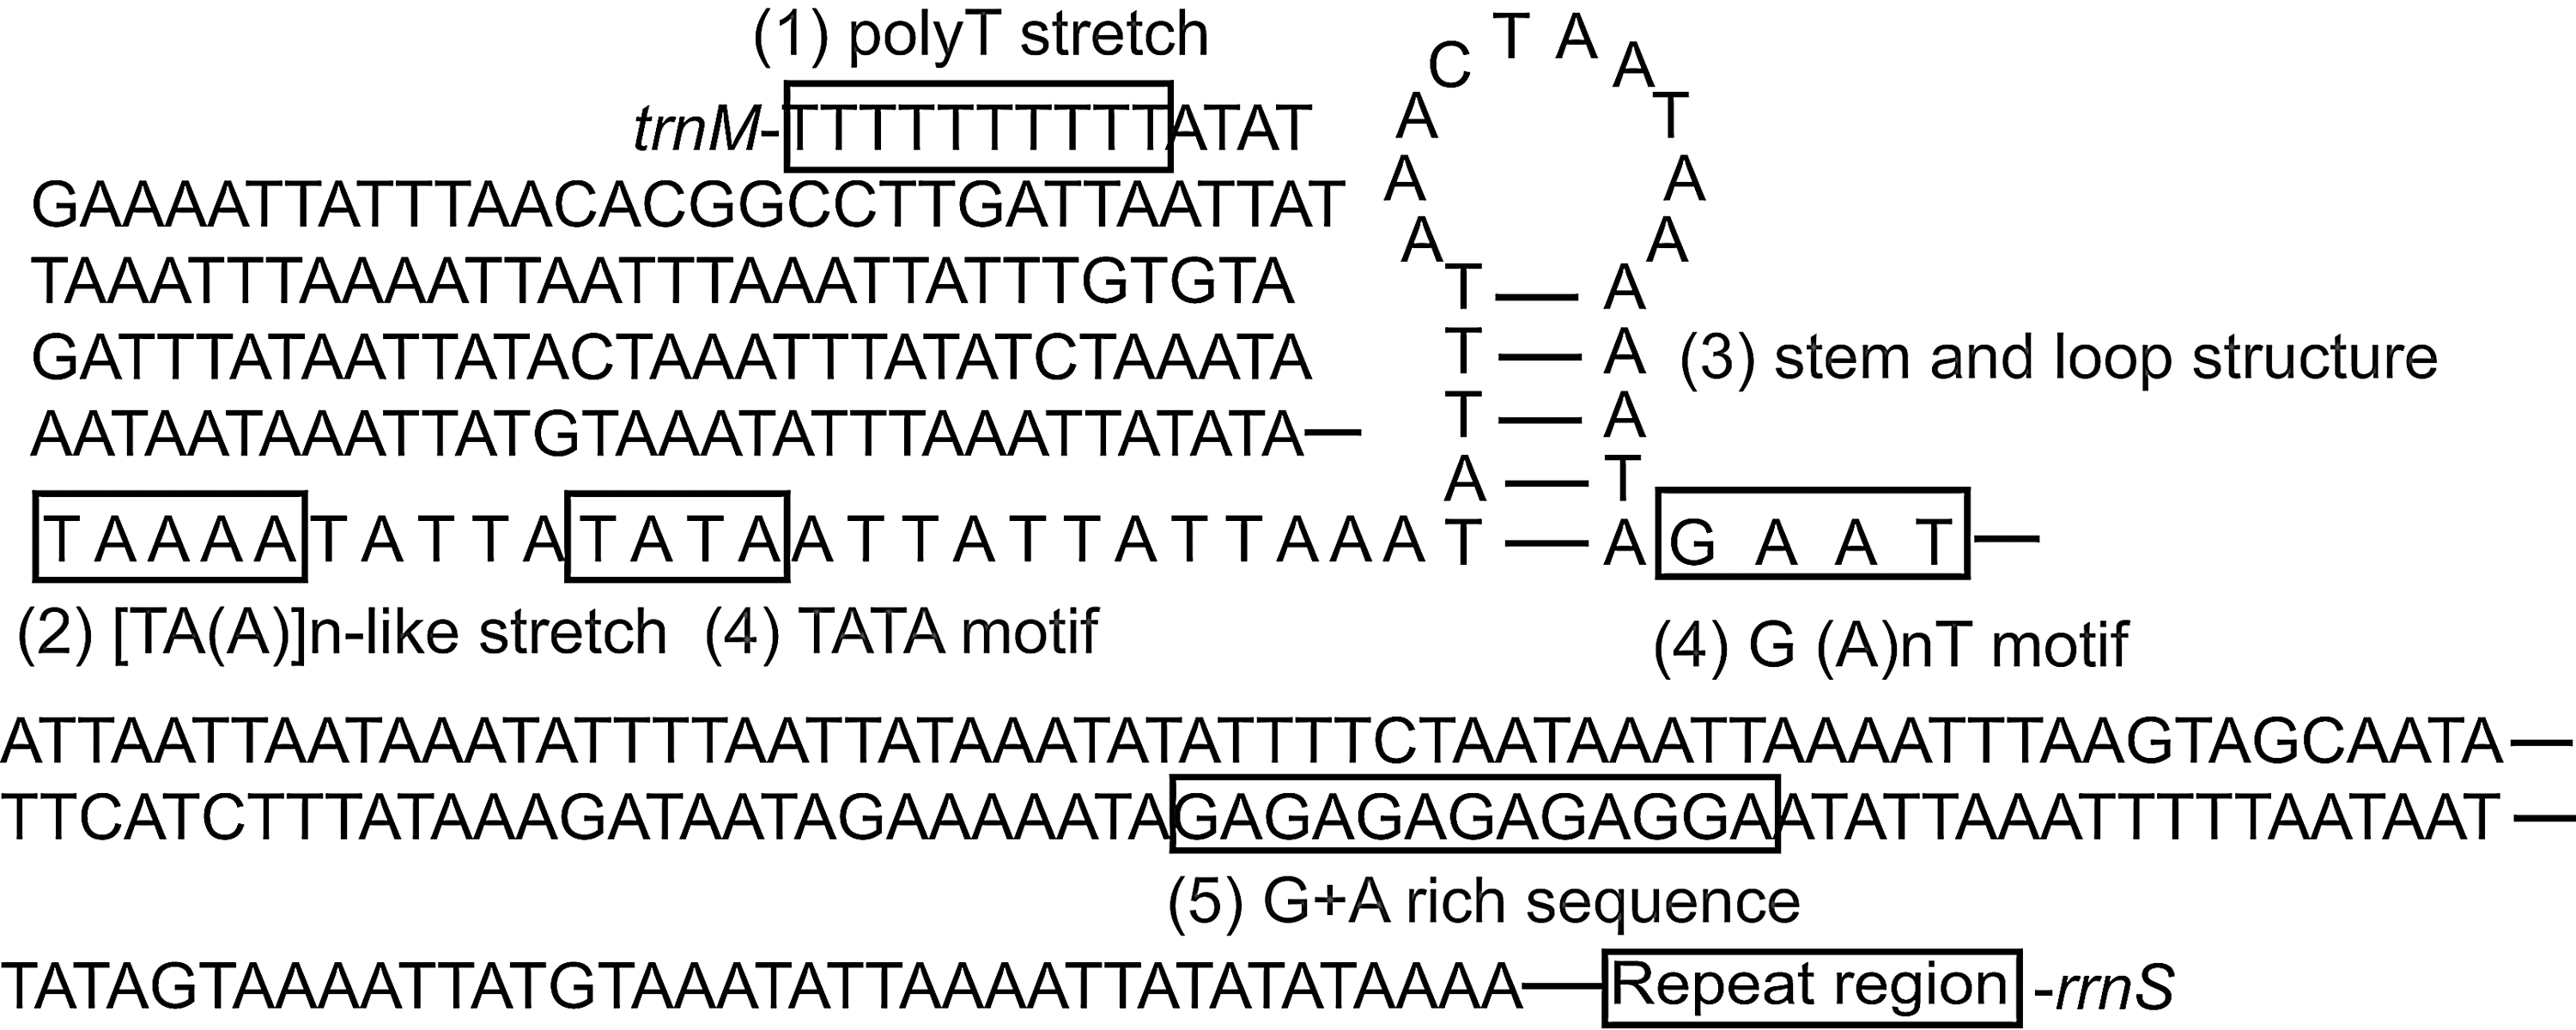
Structural elements of the A+T-rich region of the P. xylostella mitochondrial genome.
Protein-coding genes
In the P. xylostella mitochondrial genome, 12 protein-coding genes start with ATN codons (four with ATT, one with ATC, and seven with ATG). The cox1 gene uses an unusual CGA start codon. The incomplete stop codon T was assigned for nad2, cox1, cox2, and nad4, and the incomplete stop codon TA was assigned for nad5. The other eight protein-coding genes use the typical stop codon TAA. These incomplete stop codons are common in metazoan mitochondrial genes (Wei et al., 2009; Liao et al., 2010). All of the protein-coding genes contain more T than A. Among the protein-coding genes, those coded on the majority strand contain more C than G, while those coded on the minority strand show less C than G (Table 3). This is congruent with the observation of skewed values in insect mitochondrial genomes (Hassanin, 2006; Wei et al., 2010a). The RSCU revealed a biased usage of A and T nucleotides (Table 4). UUA(Leu), AUU(Ile), UUU(Phe), and AUA(Met) are the most frequently used codons, as in other insects (Wei et al., 2009; Liao et al., 2010).
RSCU, relative synonymous codon usage.
Comparative analysis of the protein-coding genes in Ditrysia
In the ditrysian mitochondrial genomes, the A+T content of all protein-coding regions ranged from 77.1% to 82.8%. The difference of A+T content among species is less than that in Hymenoptera (Wei et al., 2010c). However, the A+T content varied greatly among different genes. The atp8 and nad6 genes show a high A+T content, while cox1 and cox3 show a relatively low A+T content. All of the protein-coding genes have a negative AT skew. Genes coded on the majority strand have a negative GC skew, while genes coded on the minority strand have a positive GC skew (Table 5), as previously reported in insect mitochondrial genomes (Wei et al., 2010a).
The RSCU values were usually calculated for all of the protein-coding genes of one mitochondrial genome. Here we compared the RSCU among 13 protein-coding genes calculated from the ditrysian mitochondrial genomes (Fig. 6). A/T-rich codons are preferred in all of the protein-coding genes. TTR codons (code for Leu2) are more frequently used than CTN codons (code for Leu1). TCN codons (code for Ser2) are more frequently used than AGN codons (code for Ser1). In nad1, nad4, nad4l, and nad5, GGG is more frequently present compared to other genes. In nad2 and nad3, C-rich codons are more frequent than in other genes.
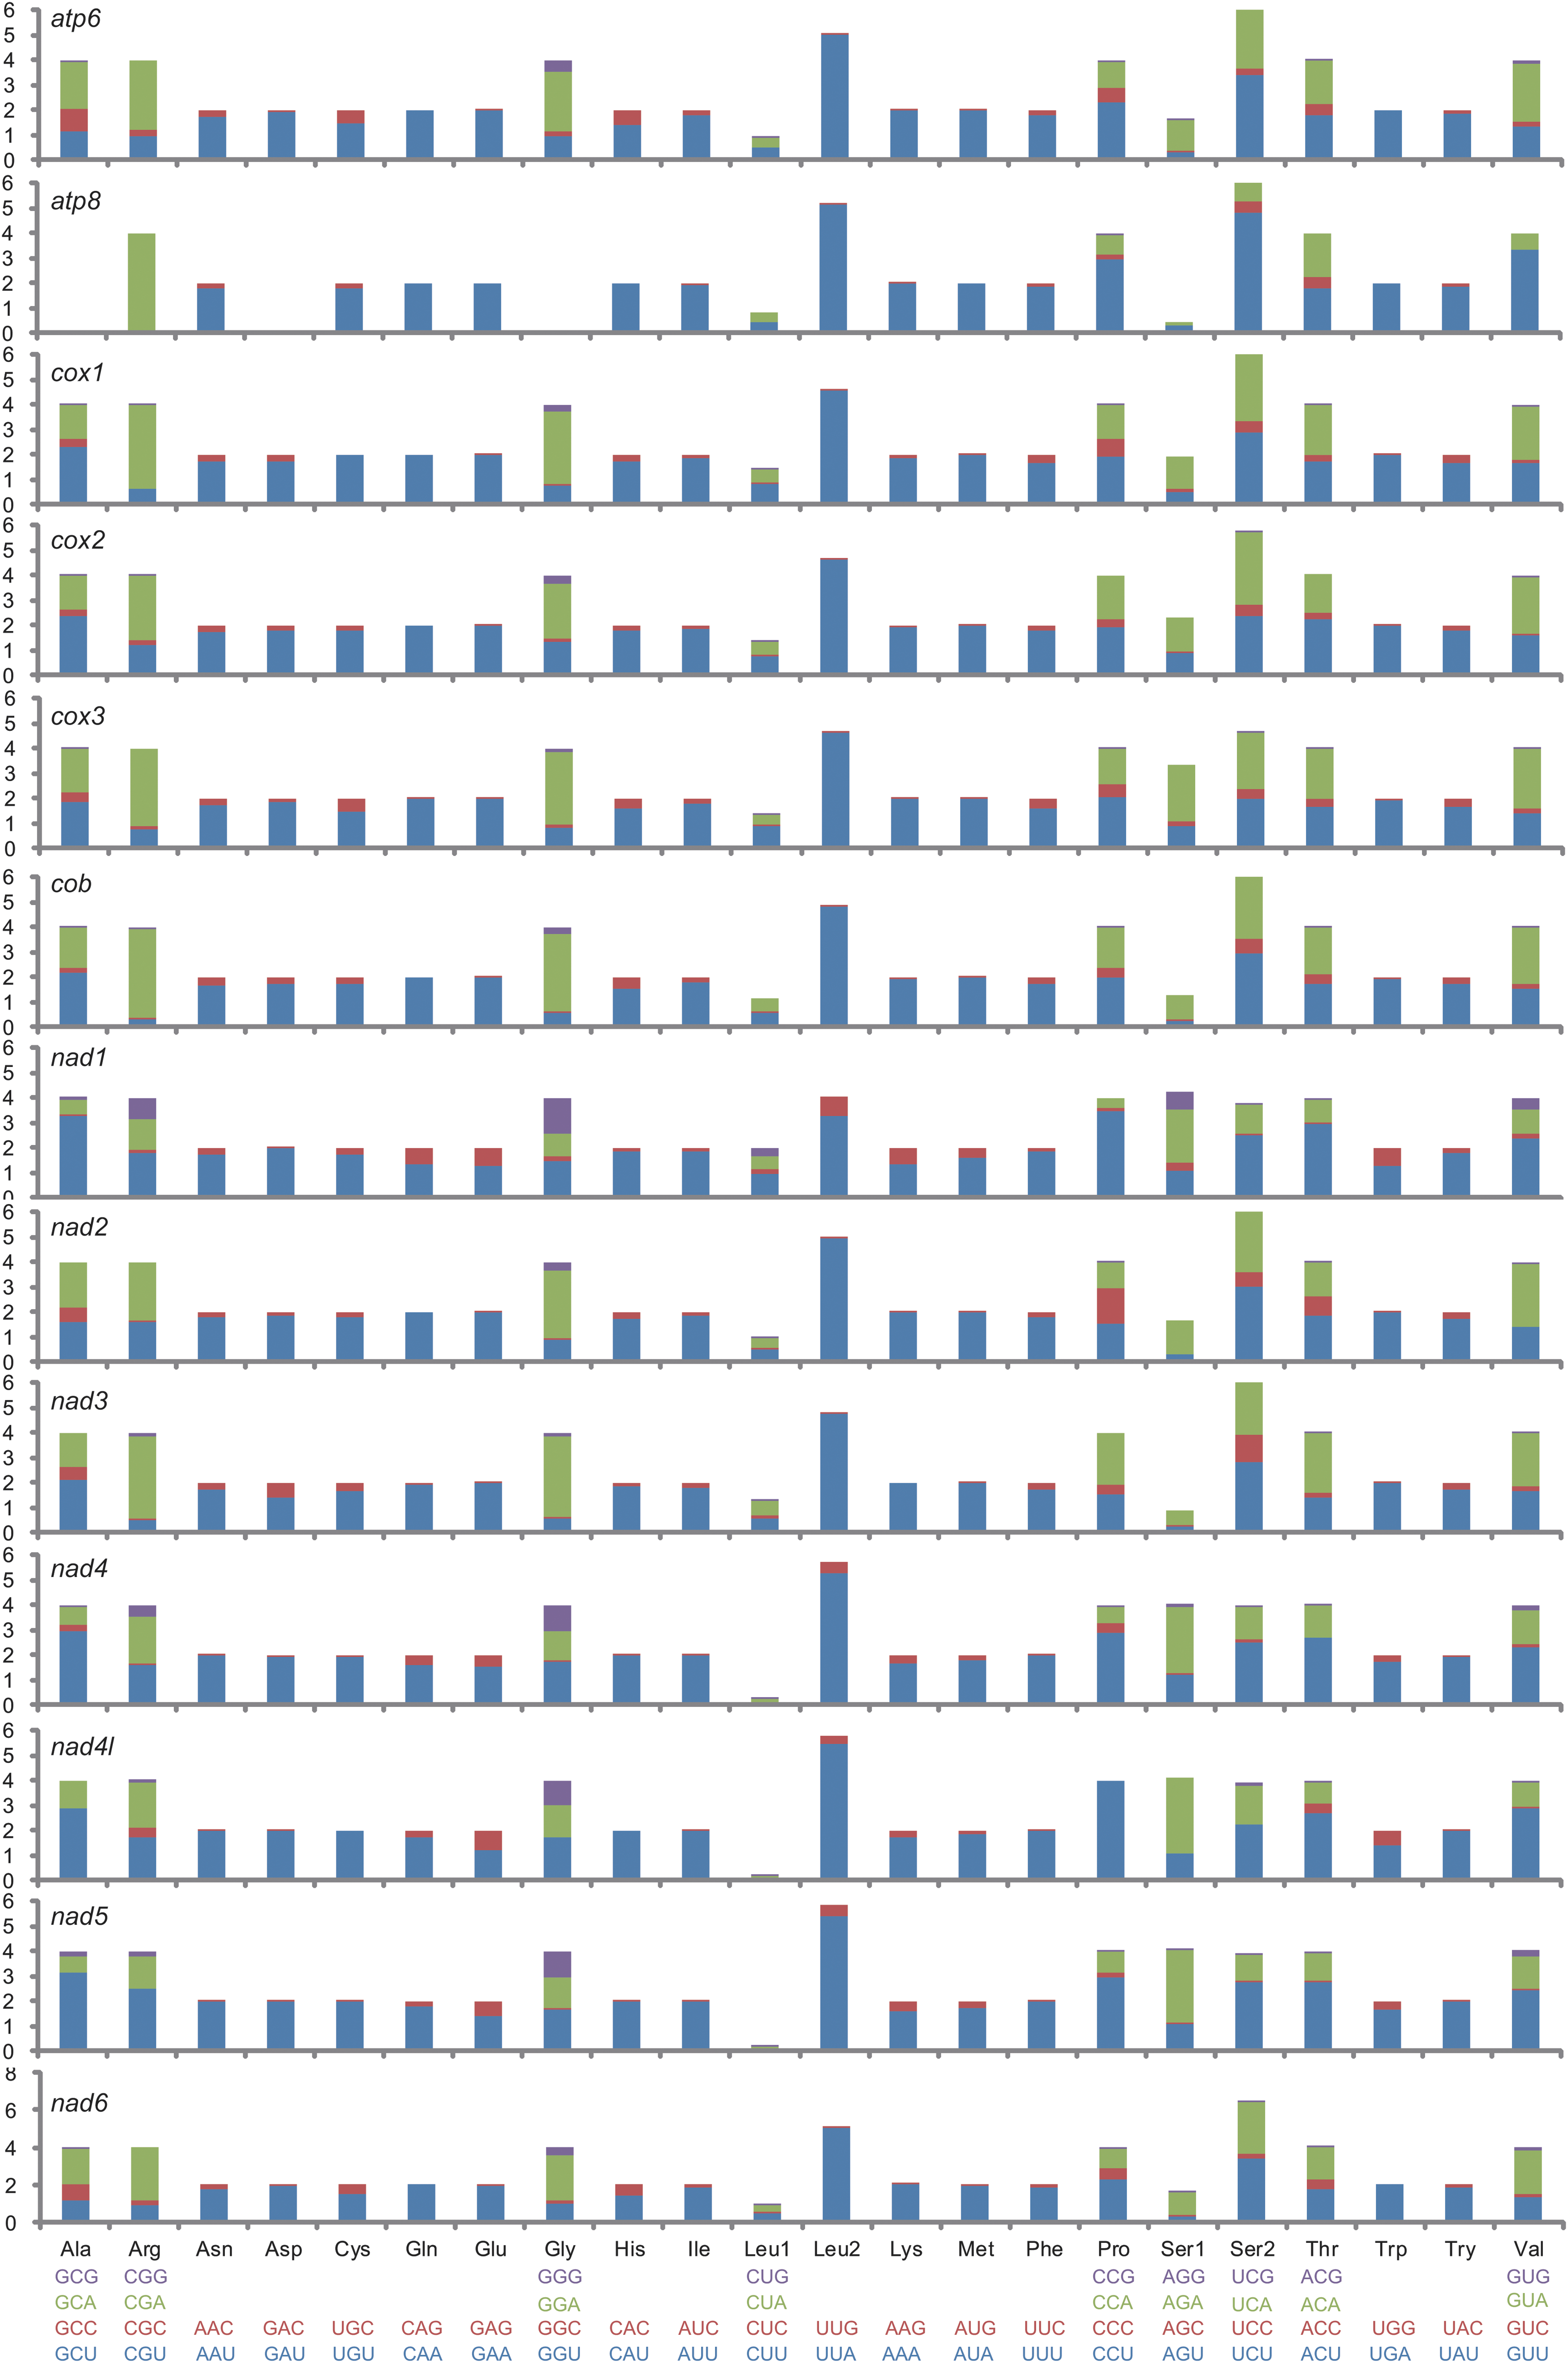
Relative synonymous codon usage of individual protein-coding genes in all analyzed lepidopteran mitochondrial genomes.
Biases in nucleotide composition across species were analyzed based on self-organizing clustering and analysis of heterogeneity. The nucleotide composition is homogeneous across the species for 13 concatenated protein-coding genes as well as for the first and second codon positions. The second codon position is the most homogeneous, while the third codon position is the most divergent. Sequences from Ochrogaster lunifer and Hipparchia autonoe are the most divergent species in the first, third, and all codon positions, although the differences are not statistically significant.
The nucleotide diversity (Pi) and Jukes and Cantor-corrected nucleotide diversity [Pi(JC)] were calculated for each protein-coding gene using the gene sequences of all presently sequenced lepidopteran mitochondrial genomes (Fig. 7).The cox1 and cox2 have low nucleotide diversities, while the nad6, nad2, and nad3 genes are highly variable. This is congruent with the analysis of size, proportion of variable, and phylogenetically informative sites among eight lepidopteran species (Cameron and Whiting, 2008).
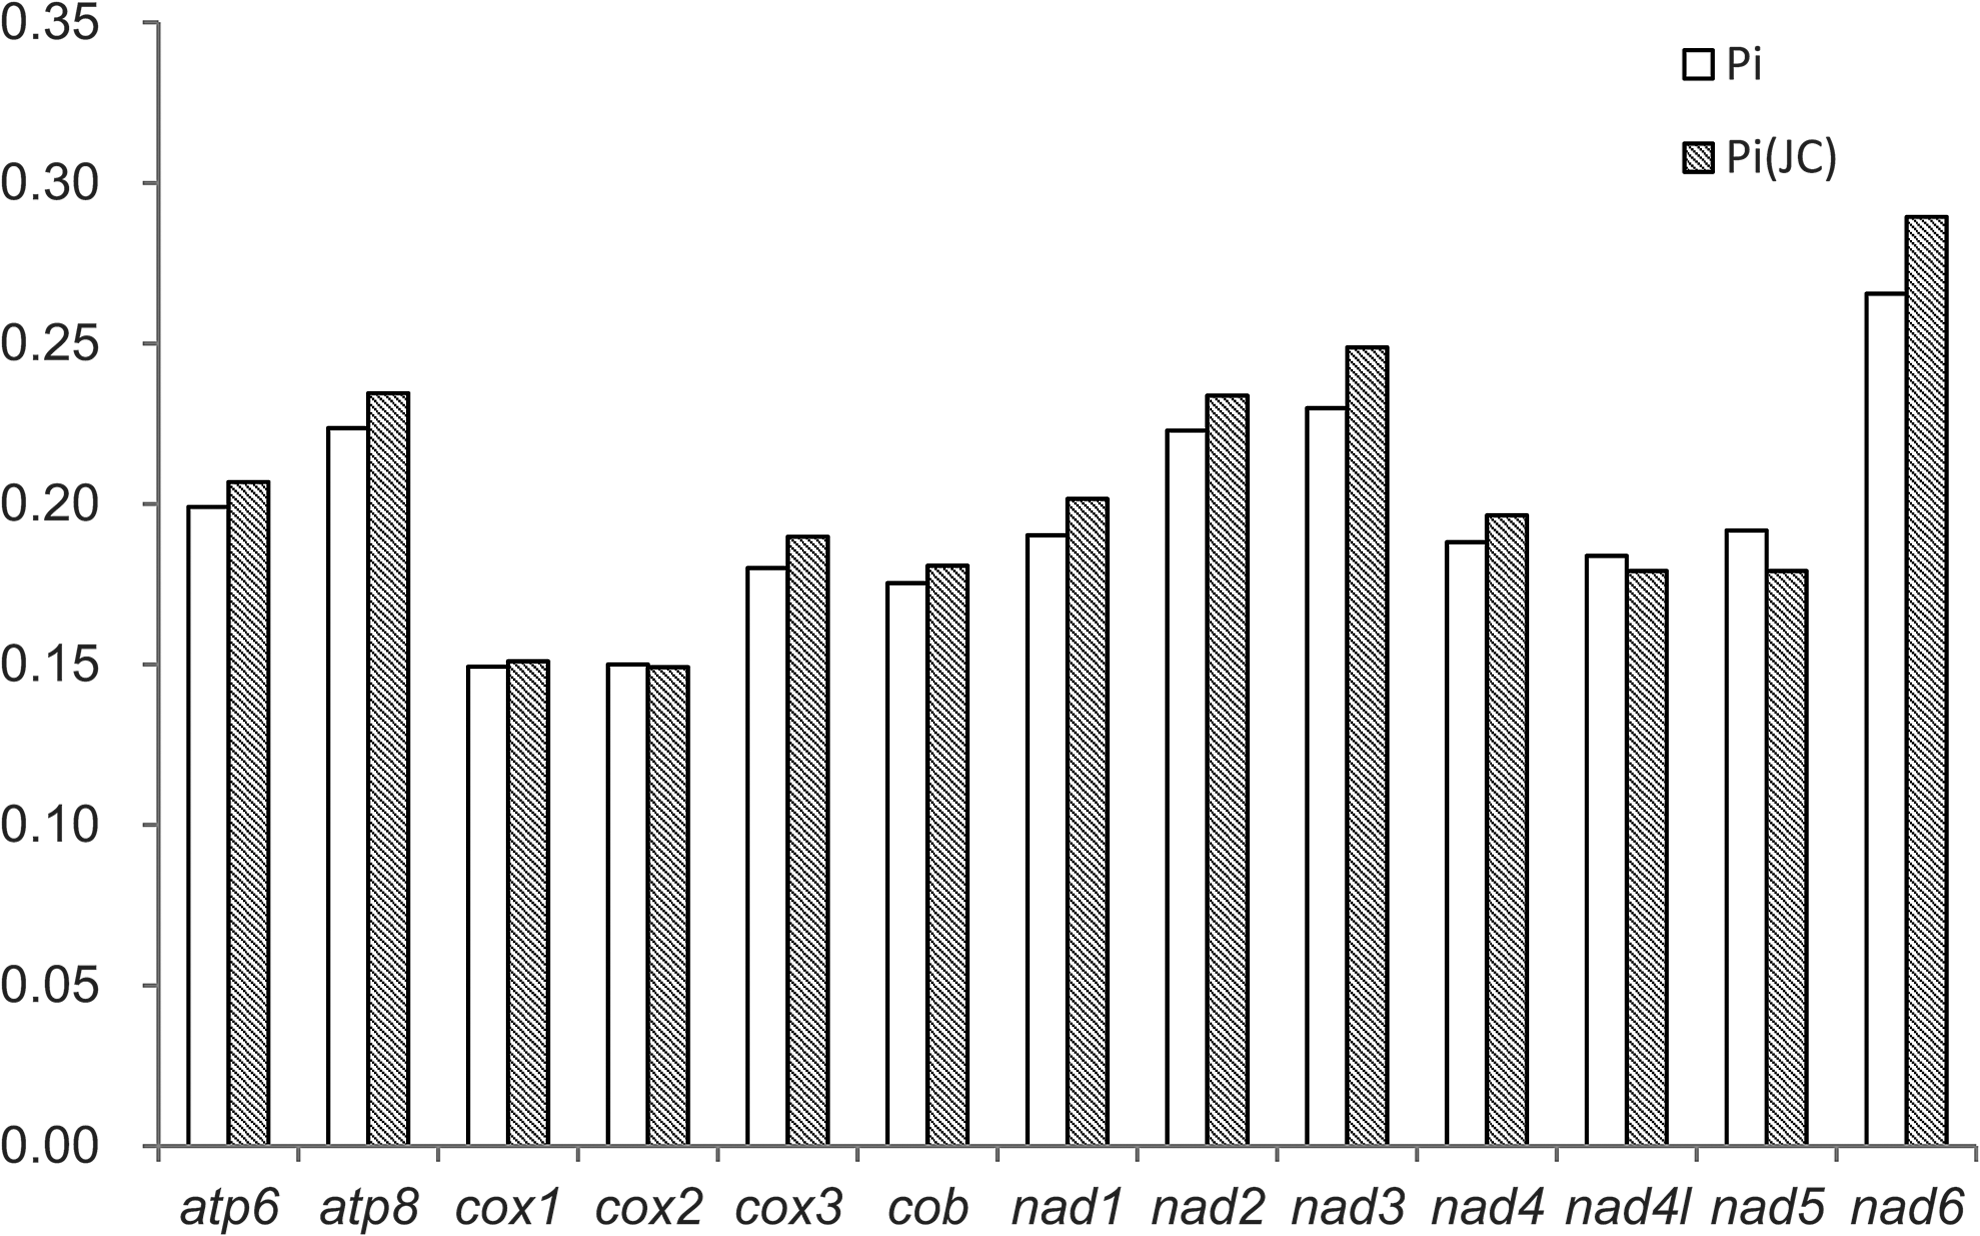
Nucleotide diversity of each protein-coding gene in Lepidoptera. Pi, nucleotide diversity; Pi(JC), Jukes and Cantor-corrected nucleotide diversity.
In the absence of saturation in the nucleotide substitution process, GTR+G+I distances coincide with p-distances; conversely, GTR+G+I distances are larger than p-distances when the level of saturation increases. Our analysis indicated the multiple substitutions in the third codon position of the lepidopteran mitochondrial protein-coding genes (Fig. 8).
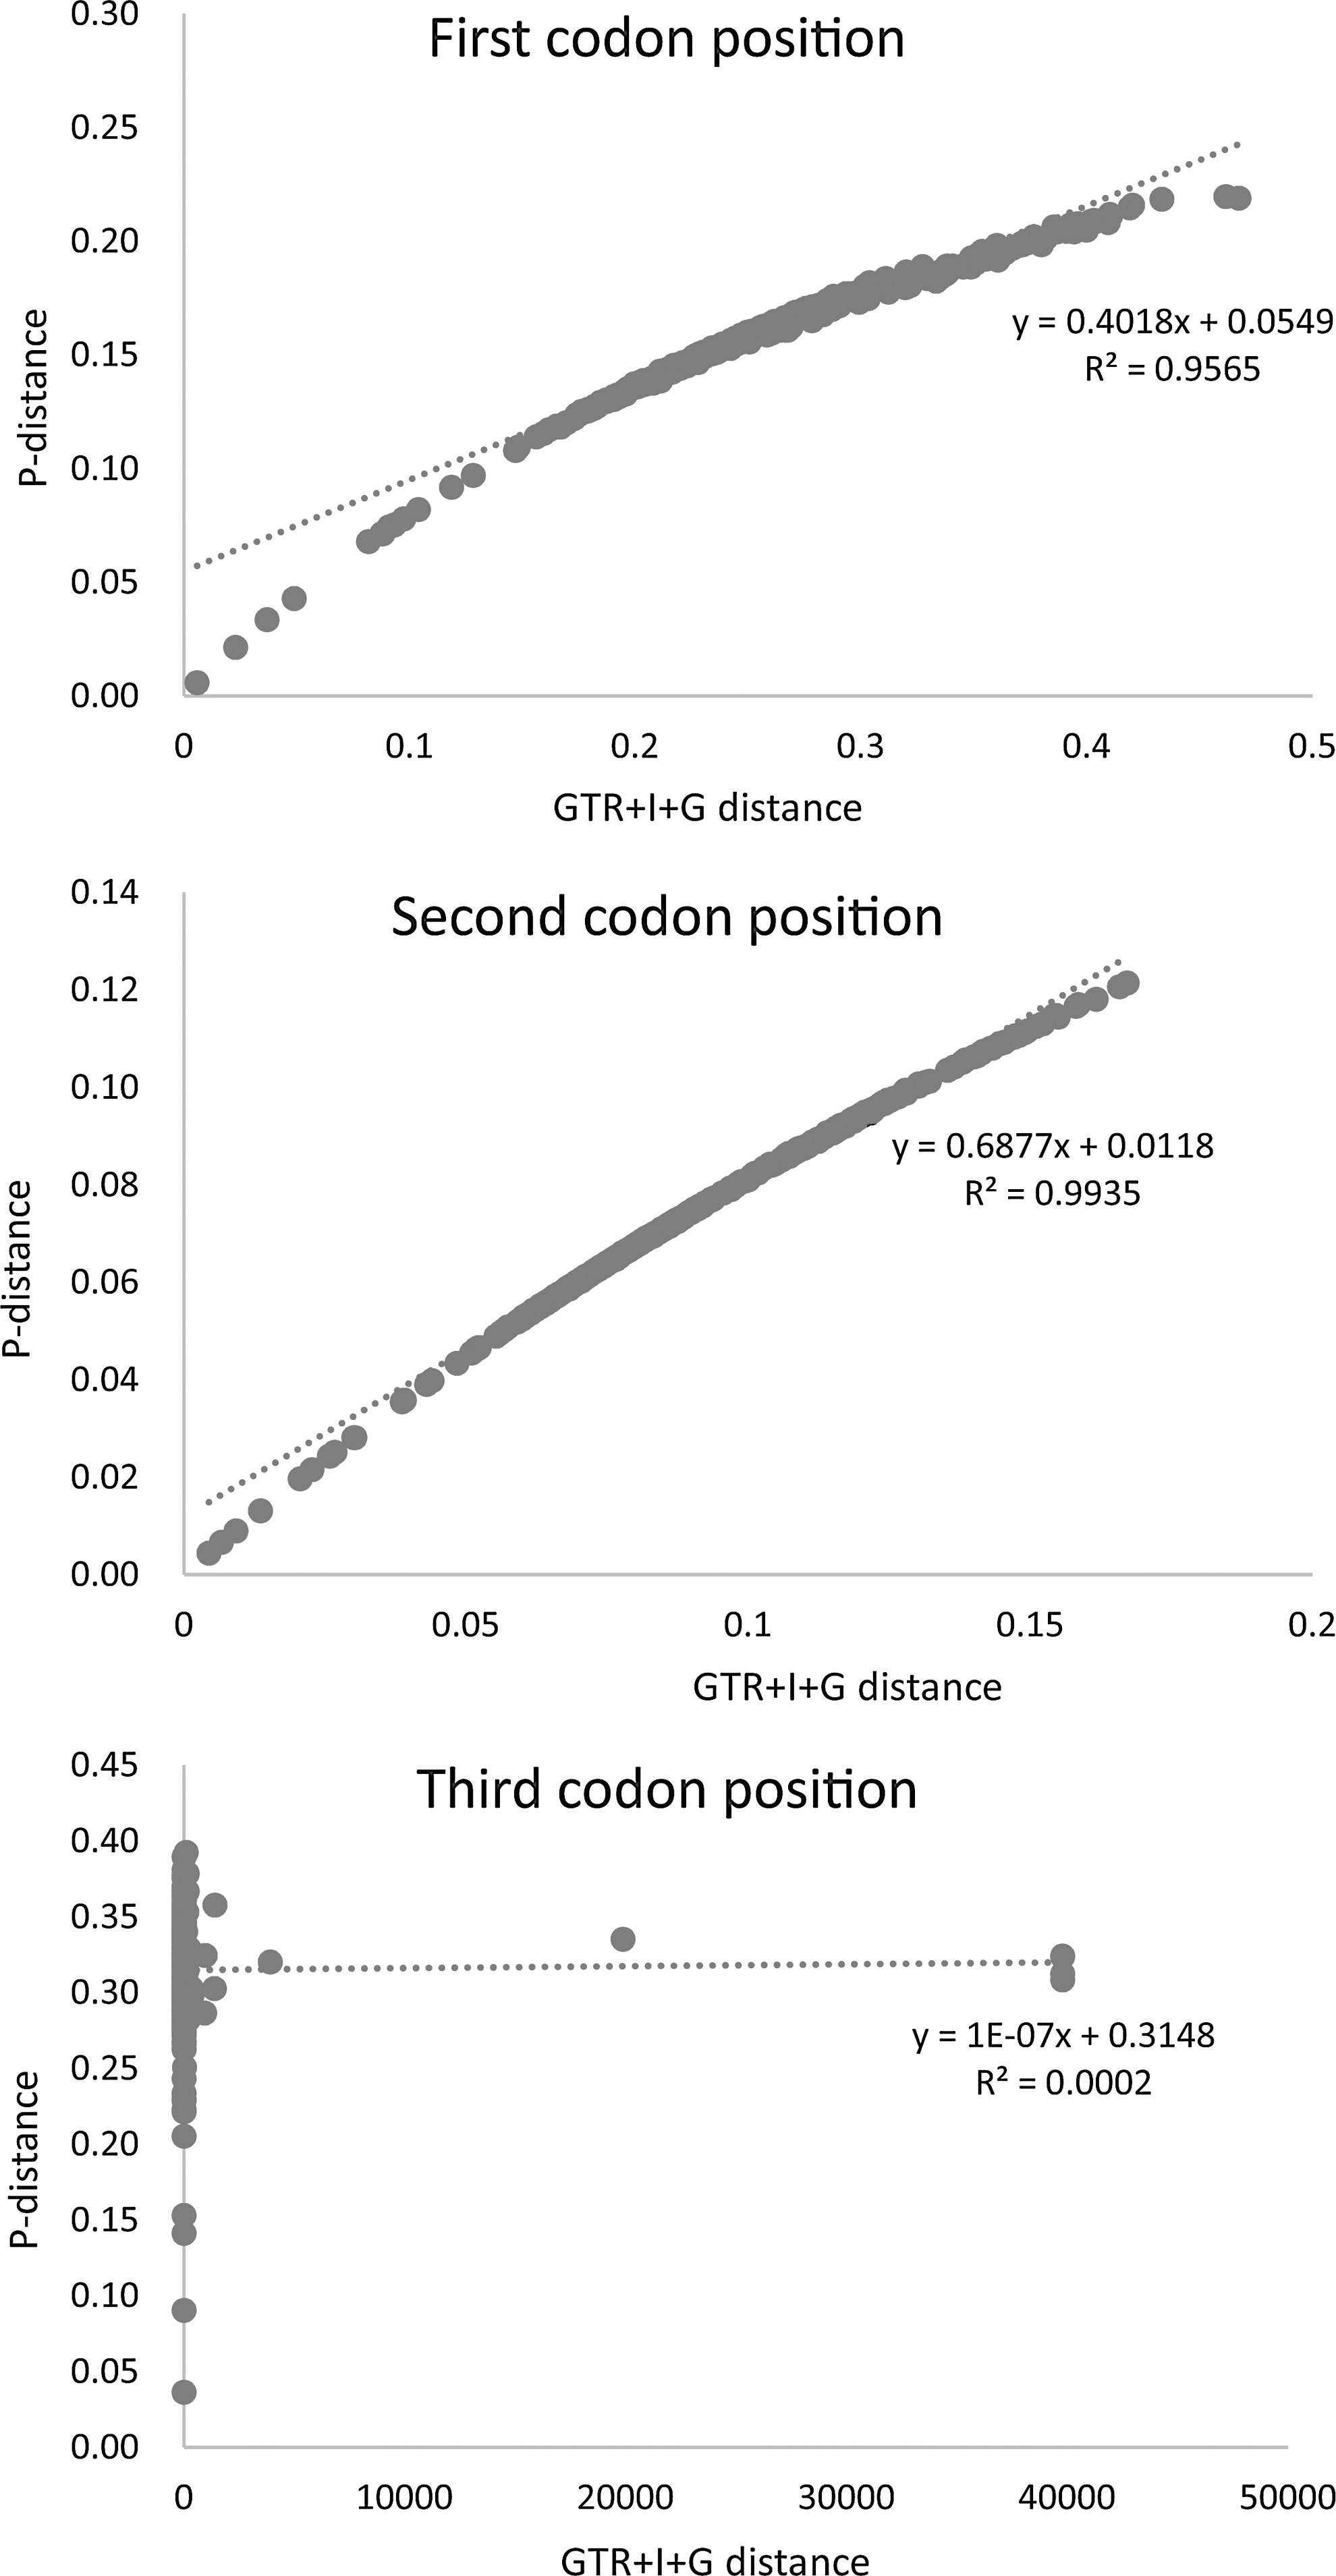
Scatter plot graphics performed to test the saturation of the nucleotide substitution process in the first, second, and third codon positions of the 13 mitochondrial protein-coding genes in Lepidoptera.
Phylogeny of Lepidoptera using mitochondrial genome sequences
Previous studies showed that the Bayesian inference method always generates a reliable tree topology when 13 mitochondrial protein-coding genes are used (Dowton et al., 2009a; Gotzek et al., 2010). Therefore, in our analysis, Bayesian inference was used with different data partitions of 13 concatenated protein-coding gene sequences to test the utility of the mitochondrial genome sequences in describing the high-level phylogeny of Lepidoptera. Among the four different data matrixes, the amino acid sequences outperformed nucleotide sequences, as demonstrated in other studies of higher level phylogeny of insects (Talavera and Vila, 2011).
The clades of Ditrysia (including Yponomeutoidea, Tortricoidea, Papilionoidea, Pyraloidea, Noctuoidea, Geometroidea, and Bombycoidea here), Apoditrysia (including Tortricoidea, Papilionoidea, Pyraloidea, Noctuoidea, Geometroidea, and Bombycoidea here), Obtectomera (including Papilionoidea, Pyraloidea, Noctuoidea, Geometroidea, and Bombycoidea here), and Macroheterocera (including Noctuoidea, Geometroidea, and Bombycoidea here) were all recovered in our analysis (Fig. 9), as in the recent comprehensive study of the Lepidoptera classification (van Nieukerken et al., 2011).
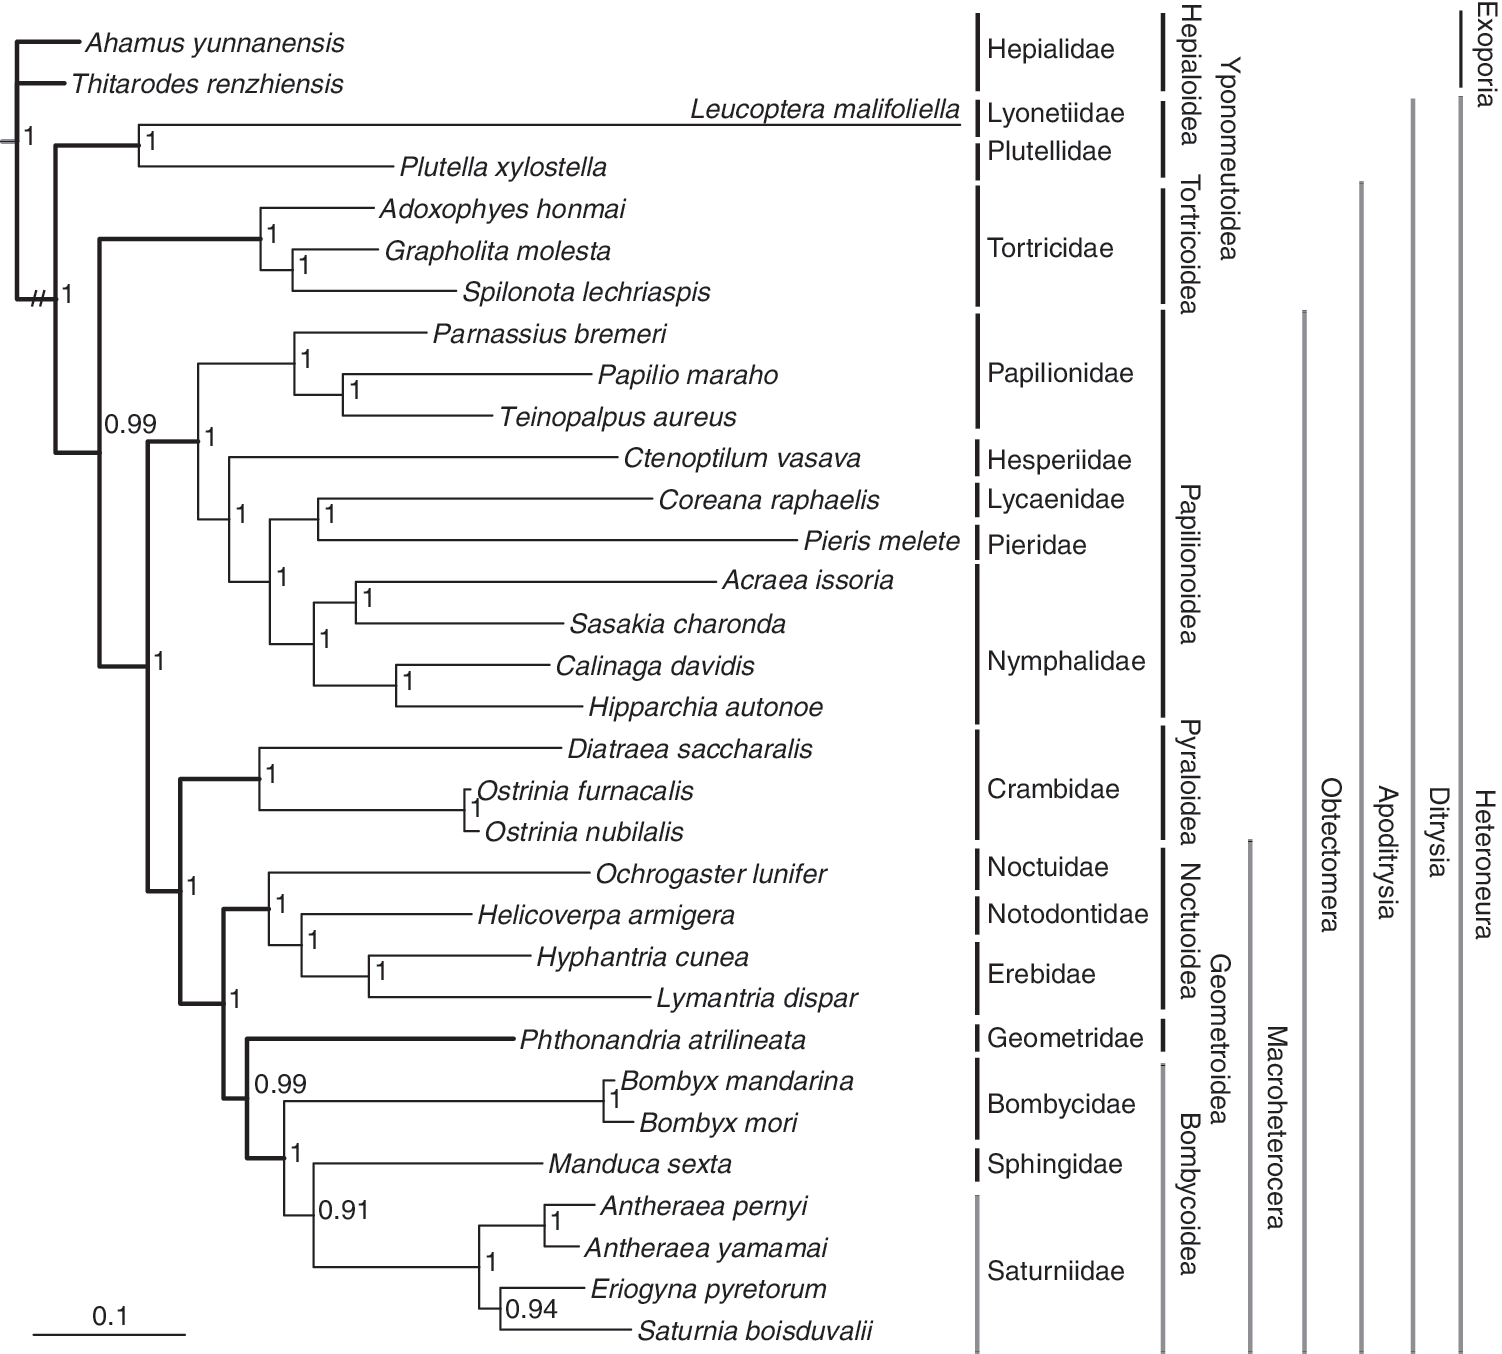
Bayesian phylogenetic tree of Lepidoptera based on the amino acid sequences of 13 mitochondrial protein-coding genes. The numbers near the nodes are posterior probabilities inferred from amino acid sequences of the 13 protein-coding genes by the Bayesian inference method.
Among the representative superfamilies of Ditrysia used in our analysis, four superfamilies, that is, Yponomeutoidea, Bombycoidea, Noctuoidea, and Papilionoidea, include more than one representative family. All of these superfamilies were shown to be monophyletic except for the Papilionoidea. Traditionally, Hesperiidae (skippers) are usually placed in their own super family Hesperioidea, while all other butterflies (Papilionidae, Pieridae, Lycaenidae, and Nymphalidae) are placed in Papilionoidea (Wahlberg et al., 2005). Our results suggest that Papilionidae is a sister group to Hesperioidea and all other butterflies ([Lycaenidae+Pieridae]+Nymphalidae). A similar result was reported in several studies based on morphological characters, nuclear genes, and mitochondrial genome sequences (Regier et al., 2009; Mutanen et al., 2010; Hao et al., 2012; Heikkilä et al., 2012).
The four superfamilies, that is, Papilionoidea, Noctuoidea, Bombycoidea, and Geometroidea, used in this study are traditionally considered to be a group of Macrolepidoptera (Minet, 1991). In our analysis, Macrolepidoptera was shown to be paraphyletic. Bombycoidea and Geometroidea are sister groups, and then sisters to Noctuoidea. However, Papilionoidea is sister to the clade of (Pyraloidea+[Noctuoidea+(Bombycoidea+Geometroidea)]). Our analysis is consistent with the present studies on the higher level phylogeny of Lepidoptera (Mutanen et al., 2010; van Nieukerken et al., 2011)
Most of the previously postulated phylogenetic relationships of the Ditrysia cladogram were based on morphology (Minet, 1991). However, morphological knowledge usually contains considerable homoplasic noise, which limits its value for making biological inferences (Kristensen et al., 2007). The phylogenetic relationships among the family and superfamily levels were studied using the period gene, and it was found that node support for some families and all larger taxonomic units was uniformly low, and the recovery of weakly supported groups proved sensitive to the analytical parameters used (Regier et al., 1998). Five protein-coding nuclear genes were used to resolve the relationships among the 27 superfamilies and 55 families of Ditrysia, which generated the same topology as our analysis (Regier et al., 2009). However, most of the relationships among superfamilies in Regier et al., (2009) are weakly supported. Our analysis indicates that the complete mitochondrial genome sequence could robustly resolve the relationships at the family and superfamily level of Ditrysia, suggesting that the complete mitochondrial genome is a promising molecular tool for constructing the tree of Lepidoptera.
Conclusions
In this study, we reported the first representative mitochondrial genome sequence of the family Plutellidae. The general features of this mitochondrial genome are similar to those in previous reports of other ditrysian lepidopteran species. A comparative analysis of the protein-coding genes within Ditrysia indicated that cox1 and cox2 have low nucleotide diversities, while the nad6, nad2, and nad3 genes are highly variable. The demonstrated utility of complete mitochondrial genome sequences in phylogenetic analysis generates robust relationships among major lineages of Ditrysia, suggesting that mitochondrial genomes are likely to be a promising tool for systematics in Lepidoptera.
Footnotes
Acknowledgments
Funding for this study was provided jointly by the National Science Foundation of China (No. 31101661), National Basic Research Program of China (2013CB127600), Beijing New Star Program on Science and Technology (2010B027), Special Fund for the Promotion and Innovation of Beijing Academy of Agriculture and Forestry Sciences (KJCX201104009), and the Beijing Excellent Talents Program (2010D002020000010).
Disclosure Statement
No competing financial interests exist.
References
Supplementary Material
Please find the following supplemental material available below.
For Open Access articles published under a Creative Commons License, all supplemental material carries the same license as the article it is associated with.
For non-Open Access articles published, all supplemental material carries a non-exclusive license, and permission requests for re-use of supplemental material or any part of supplemental material shall be sent directly to the copyright owner as specified in the copyright notice associated with the article.