
Abstract
Although propofol exerts toxic effects on the developing central nervous system (CNS), it remains a first-choice anesthetic in the pediatric population. Astrocytes represent a major glial cell population whose role in CNS development is widely appreciated and that has been recently shown to be mediated in large part by microRNAs (miRNAs). In contrast, relatively little is known about the roles of miRNAs in developing astrocytes during propofol treatment. Here, miRNA microarray was used to profile fluctuations in miRNA expression in immature hippocampal astrocytes in response to propofol treatment, and results were subsequently validated using quantitative real-time polymerase chain reaction. Predictive analysis of genes targeted by propofol-regulated miRNAs indicated enrichment of genes in the gene ontology (GO) nervous system development and differentiation category, and in the Kyoto encyclopedia of genes and genomes (KEGG) apoptotic pathway category. A total of 24 (10 short-term dosage and 14 long-term dosage) miRNAs were significantly regulated, one of which was rno-miR-665. Ectopic overexpression and silencing of rno-miR-665 demonstrated its role in the neurotoxic effects of propofol on hippocampal immature astrocytes. We present evidence that the role of rno-miR-665 in anesthesia-induced disturbances in astroglia development may involve direct downregulation of the anti-apoptotic gene Bcl2l1, and subsequent increased caspase-3-mediated apoptosis. Our results shed light on the anesthetic mechanism of propofol and have implications for its use in the clinical setting.
Introduction
P
Post-transcriptional regulation of gene expression is a well-characterized regulatory mechanism in CNS development and physiology. microRNAs (miRNAs) are short (20–23 bases) regulatory RNAs that mediate target sequence-specific mRNA degradation (Guo et al., 2010) or repression of mRNA translation (Bartel, 2009) in a variety of organ systems, including the CNS (Smirnova et al., 2005). Moreover, the spatial expression patterns of miRNAs are consistent with their roles in the development of specific CNS structures and functional regions (Kloosterman et al., 2005; Ason et al., 2006), including the hippocampus, which is involved in behavior and learning performance in both humans and animals. Furthermore, miRNAs are known to support processes as diverse as neurogenesis, neuronal differentiation, apoptosis, and aging, and they have been implicated in neurodegeneration and neuronal disorders (Li and Jin, 2010; Slezak-Prochazka et al., 2010).
Given their broad functional roles in the CNS, we hypothesized that regulation of the expression of miRNAs might be involved in the mechanism of action of propofol in developing astrocytes. miRNA microchip technology provides for simultaneous detection of the global expression of several hundred miRNAs in a single sample, and it has been previously used to characterize the miRNA transcriptomic signatures of anesthetic agents in the liver (Ishikawa et al., 2012) and hippocampus (Goto et al., 2014). Here, we used miRNA microchips and quantitative real-time polymerase chain reaction (qRT-PCR) to characterize the effect of low- and high-dosage propofol on miRNA expression patterns in primary cultures of hippocampal astrocytes isolated from immature rats.
Materials and Methods
Ethics statement
Healthy P7 Sprague–Dawley rats were obtained from the Laboratory Animal Center of China Medical University. All experimental animal procedures were approved by the Ethics Review Committee for Animal Experimentation of the China Medical University and were in compliance with the Guide for the Care and Use of Laboratory Animals (U.S. National Institutes of Health publication No. 85–23, National Academy Press, Washington DC, revised 1996).
Primary cultures of astrocytes
After being deeply anesthetized with Halothane™, the neonatal rats were sacrificed by decapitation and bilateral hippocampi, freed of meninges and vessels, and isolated in their entirety under sterile conditions within 2 min of death. The tissues were dissected into Hanks' balanced salt solution (HBSS; Beyotime Institute of Biotechnology), after which additional HBSS was added to the tube to a final volume of 10 mL. Then, 0.5 mL trypsin (0.125%) was then added, followed by incubation in a 37°C water bath for 15 min.
Hippocampal cells were washed in Dulbecco's modified Eagles medium (DMEM; Whitaker Bioproducts) with 20% fetal bovine serum (FBS; Invitrogen, Life Technologies) to stop trypsin activity. Dissociated cells were centrifuged, resuspended in DMEM supplemented with 20% FBS, 10% Ham's F12 with glutamine (Whitaker Bioproducts), and 50 U/mL penicillin streptomycin (Sigma-Aldrich). The suspended cells were then layered in 0.1 μg/L poly-L-lysine-coated (Sigma-Aldrich) flasks and incubated in a 5% CO2-95% air humidified atmosphere, with a change of medium 24 h later and then every 2 days thereafter. At confluence (8–10 days), flasks were shaken at 200 rpm for 16 h at 37°C. After removal of microglia and oligodendrocytes, the astrocytes were trypsinized, resuspended, and seeded on six well plates for experiments.
All experiments were performed after confirmation of immunofluorescent staining against the glial fibrillary acidic protein antibody (GFAP; Sigma-Aldrich). Cultured cells were fixed with 4% paraformaldehyde and blocked with 0.5%Triton X-100 for 20 min. After multiple rinses in phosphate-buffered saline (PBS), cells were immunostained using antibodies against GFAP (1:200, Sigma-Aldrich) and incubated overnight at 4°C. After rinsing thrice in PBS, sections were incubated with secondary antibody, goat-anti-rabbit-IgG (1:200; Vector) for 2 h at room temperature. The sections were incubated with avidin-biotin-peroxidase (ABC) solution for another 30 min, and they were then counterstained in 3,3′- diaminobenzidine tetrahydrochloride (DAB) for 5 min.
Drug treatment and MTT assay
Pure propofol (2,6-diisopropylphenol) was obtained from AstraZeneca, and the intralipid (20% emulsion, phospholipid-stabilized soybean oil) was obtained from Sigma-Aldrich. Hippocampal astrocyte primary cultures were treated with propofol (0 [control], 0.9, 10, 20, or 50 μg/mL, respectively, diluted with intralipid) for 1 or 48 h. To monitor astrocyte viability, 3-(4,5-Dimethyl-thiazol-2-yl)-2, 5-diphenyltetrazolium bromide (MTT) tests were performed according to standard laboratory protocols.
Cells (1000) were plated in each well of a 96-well plate in triplicate. Twenty microliters 0.2 mg/mL MTT (Sigma) were added into each microwell containing propofol-treated or control cells. After incubation with MTT, the cells were carefully lysed in 200 μL dimethyl sulfoxide (DMSO; Sigma) and the optical density (OD) of each well was measured with a 96-well plate spectrophotometer reader (Thermo Fisher Scientific) at 490 nm. Cell viability (%) was calculated according to the formula: (ODsample − ODblank)/(ODcontrol − ODblank)×100. The samples consisted of wells with treated cells, the blanks consisted of wells without cells, and the controls consisted of wells with untreated cells. Furthermore, the cells transfected with miRNA mimic, inhibitor in propofol-treated groups underwent MTT assay 48 h after transfection. All experiments were carried in triplicate, and average values were calculated.
Total RNA extraction and μParaflo miRNA microarray procedures
Total RNA was extracted using Trizol Reagent (Invitrogen). Samples were quality checked using a NanoDrop ND1000 Spectrophotometer (Thermo Fisher Scientific) and an Agilent 2100 Bioanalyzer (Agilent Technologies). Microarray assay was performed using a service provider (LC Sciences). Between 4 and 8 μg, starting total RNA were 3′-extended using poly (A) polymerase, after which an oligonucleotide tag was ligated to the poly (A) tail for subsequent fluorescent dye staining. Hybridization was performed overnight on a μParaflo microfluidic chip using a microcirculation pump (Atactic Technologies, Inc.) (Gao et al., 2004).
For microfluidic chips, each detection probe consisted of a chemically modified nucleotide coding sequence complementary to specific target miRNA (all 727 rat miRNAs listed in the Sanger miRNA miRBase, Release 20.0,
After RNA hybridization, tag conjugating Cy3 dye was circulated through the microfluidic chip. Fluorescence images were collected using an axon GenePix 4000B Microarray laser scanner (Molecular Devices), after which images were digitized using Array-Pro image analysis software (Media Cybernetics). Microarray hybridizations were performed in duplicate for all samples. Each miRNA was analyzed 4 times, and the controls were repeated 4 to 20 times.
Statistical analysis of miRNA microarray data
The microarray image was converted to spot intensity values using Scanner Control Software Rev. 7.0 (Agilent Technologies). The average values of the replicate spots of each miRNA were analyzed by first subtracting the background and then normalizing the signals using a locally weighted regression and smoothing scatterplots (LOWESS) filter for further analysis (Bolstad et al., 2003). Detectable miRNAs were selected based on the following criteria: signal intensity higher than 3× (background standard deviation); spot CV <0.5 (coefficient of variation [CV]=standard deviation/signal intensity). Differences between groups were determined by Student's t-test. Benjamini–Hochberg correction was performed to identify the false discovery rate. Experiments were carried out in triplicate, and a p<0.1 was considered statistically significant.
miRNA target prediction
miRNAs that were significantly (p<0.05) differentially expressed and that had a high expression signal (>500) were selected for target prediction. For cross-validation, we used three frequently used programs, namely, TargetScan (
Gene ontology and Kyoto encyclopedia of genes and genomes analysis
Predicted gene targets were analyzed with respect to gene ontology (GO;
Quantitative real-time polymerase chain reaction
Quantitative real-time polymerase chain reaction (qRT-PCR) validation was carried out on miRNAs satisfying the following criteria in the microarray analysis: signal >500, p<0.05, and |log2| ratio ≥1. Total RNA was isolated as described earlier.
qRT-PCRs were carried out in an ABI PRISM® 7900HT fluorescence quantitative PCR instrument (Applied Biosystems). A single-stranded cDNA for a specific miRNA was synthesized using PrimeScript® RT Kit (TaKaRa, Biotech Co., Ltd). The reverse transcription reaction mixture contained 250 ng of total RNA, 1.0 μL 5× PrimeScript Buffer, 0.6 μL Rnase free ddH2O, 0.4 μL PrimeScript reverse transcription (RT) enzyme mix I, and 0.5 μL RT primer; was incubated at 42°C for 15 min followed by 85°C for 5 s; and was finally held at 4°C.
Real-time PCR amplification was performed using Platinum® SYBR® Green qPCR SuperMix-UDG (Invitrogen). Briefly, the PCR reaction mixture contained 0.5 μL RT product, 8.7 μL ddH2O, 10 μL 2× SYBR Green Mix with ROX, and 0.8 μL primer mix (10 μM). The reactions were incubated in a 96-well plate at 50°C for 2 min, 95°C for 2 min, followed by 40 cycles of 95°C for 15 s and 60°C for 30 s. The primers were designed using Primer Premier 5.0 (ABI). The sequences are as follows: RT primer for rno-miR-3473: 5′-GTCGTATCCAGTGCAGGGTCCGAGGTATTCGCACTGGATACGACTAGCCA-3′, PCR primer for rno-miR-3473: 5′-GCGGTGGTCTAGGGCTGG-3′ (forward), 5′-CGCAGGGTCCGAGGTATTC-3′ (reverse). RT primer for rno-miR-665: 5′
miRNA mimic and inhibitor transfection
Astrocytes were plated into a 24-well plate until the confluency reached 30–50%. Rno-miR-665 mimic (5′-CAGCAGCACACUGUGGUUUGU-3′; 3′-AGGGACCUCAGCCUCCUGGUUU-5′), mimic-negative control (NC) (5′-UUCUCCGAACGUGUCACGUTT-3′; 3′-ACGUGACACGUUCGGAGAATT-5′), inhibitor (5′-UAAGGGACCUCAGCCUCCUGGU-3′), inhibitor-NC (5′-CAGUACUUUUGUGUAGUACAA-3′) were individually diluted in Lipofectamine™ 2000 (Invitrogen) and incubated for 5 min. After incubation for 6 h, the transfection efficiency was assessed by rno-miR-665 mimic/inhibitor-NC, which was labeled with the green fluorescence FAM (6-carboxy-fluorescein) under a fluorescent microscope (Nikon). The following procedures (qRT-PCR and western blot) were carried out after 2 days. Samples of the transfected cells were subjected to functional analyses in propofol-treated astrocytes.
qRT-PCR
Using the methods referred to earlier, astrocytes were prepared for qRT-PCR assay of rno-miR-665 and Bcl2l1 after transfection. Primer for Bcl2l1 was 5′-GGACAGCATATCAGAGCTTTGAACA-3′ (forward), 5′-TTGTCTACGCTTTCCACGCA-3′ (reverse). The expression level was normalized to β-actin. The primer for β-actin was 5′-GGAGATTACTGCCCTGGCTCCTAGC-3′ (forward), 5′-GGCCGGACTCATCGTACTCCTGCTT-3′ (reverse). Each sample was run in triplicate.
Western blot
Protein lysates of astrocytes were obtained using a protein extraction kit (Pierce) according to the manufacturer's instructions. All proteins were separated by 10% sodium dodecyl sulfate-denatured polyacrylamide gel electrophoresis and subsequently transferred to polyvinylidene fluoride membranes (Bio-Rad). After blocking with 5% nonfat dried milk in Tris (Sigma-Aldrich) -buffered saline containing 0.05% Tween 20 (Sigma-Aldrich), the membranes were incubated with primary antibodies (1: 300; Santa Cruz Biotechnology), and β-actin (1: 500) overnight at 4°C, and then reacted with horseradish peroxidase-conjugated secondary antibody (1:5000; Santa Cruz Biotechnology) at room temperature for 1 h. Three 10-min TBS-Tween washes were performed at 24°C after each incubation. The specific bands were visualized with a UVP Gel imaging system and analyzed by an Image-Pro Plus 6.0 system.
Luciferase reporter gene assay
The putative rno-miR-665 binding site in the Bcl2l1 3′UTR was confirmed by cotransfection of Bcl2l1 3′UTR and rno-miR-665 mimic. 3′UTR of Bcl2l1 was cloned in the pmirGLO-dual-luciferase reporter vector (7350 bp; Promega), with 3 bp mutated substitution (Fig. 6A). The reconstructed plasmid was confirmed by restriction endonuclease digestion and sequencing. Astrocytes were first treated with serum starvation for 1 h and were then gently mixed with a mixture of Lipofectamine 2000 (Invitrogen), 1 μg wild-type (or mutated) 3′UTR of Bcl2l1 (pmirGLO-3′UTR-wt, pmirGLO-3′UTR-mut), and 40 pmol mimic (or negative control reporter [rno-miR-665-NC]). The cultured cells in 24-well plates were divided into six groups: a: (blank) pmirGLO-3′UTR-wt; b: pmirGLO-3′UTR-mut; c: pmirGLO-3′UTR-wt+rno-miR-665 mimic-NC; d: pmirGLO-3′UTR-wt+rno-miR-665 mimic; e: pmirGLO-3′UTR-mut+rno-miR-665 mimic-NC; f: pmirGLO-3′UTR-mut+rno-miR-665 mimic. Cells were incubated at 37°C and 5% CO2-95% air for 48 h post-transfection. Both firefly and Renilla luciferase activities were measured and calculated by normalizing firefly luciferase activity with Renilla luciferase activity.
Flow cytometry
Cells were washed twice in cold PBS and gently suspended in 100 μL of annexin V incubation reagent; then, 5 μL PI was added for necrotic cells, using FITC-labeled Annexin V (BD Biosciences) according to the manufacturer's instructions. Each group was measured using flow cytometry (FACSCanto™ II; BD Biosciences) in triplicate.
Statistical analysis
An analysis of multiple-comparison procedures was performed by one-way analysis of variance and Bonferroni post hoc test using SPSS 16.0 software (IBM). Both P<0.1 for analysis of microarray data and p<0.05 for target genes were regarded as statistically significant. All results are expressed as mean±SD. Each sample was run in triplicate.
Results
Primary cultured astrocytes
The primary hippocampal astrocytes were isolated and succesfully immunostained for GFAP, an unequivocal marker for astrocytes (Bignami and Dahl, 1977; Valentino et al., 1983) (Supplementary Fig. S1; Supplementary Data are available online at
Titration of cell viability in propofol-treated primary cultured immature rat astrocytes
We first performed MTT assays to determine the survival of astrocytes in the presence of varying durations of exposure to, and concentrations of, propofol (Fig. 1). The intralipid solvent of the propofol used in this study exerted no significant influence on cell viability (data not shown). Cell viability was significantly decreased in the presence of 10, 20, and 50 μg/mL propofol after 1 h of exposure and, in addition to these concentrations, at 0.9 μg/mL after 48 h of exposure. Subsequent microarray experiments were carried out on cells exposed to either 10 μg/mL propofol×1 h (group A, short-term) or 0.9 μg/mL propofol×48 h (group B, long-term). Furthermore, a propofol concentration of 10 μg/mL, which significantly reduced cell viability after both short-term and long-term exposure, was selected for further in-depth functional studies on rno-miR-665.
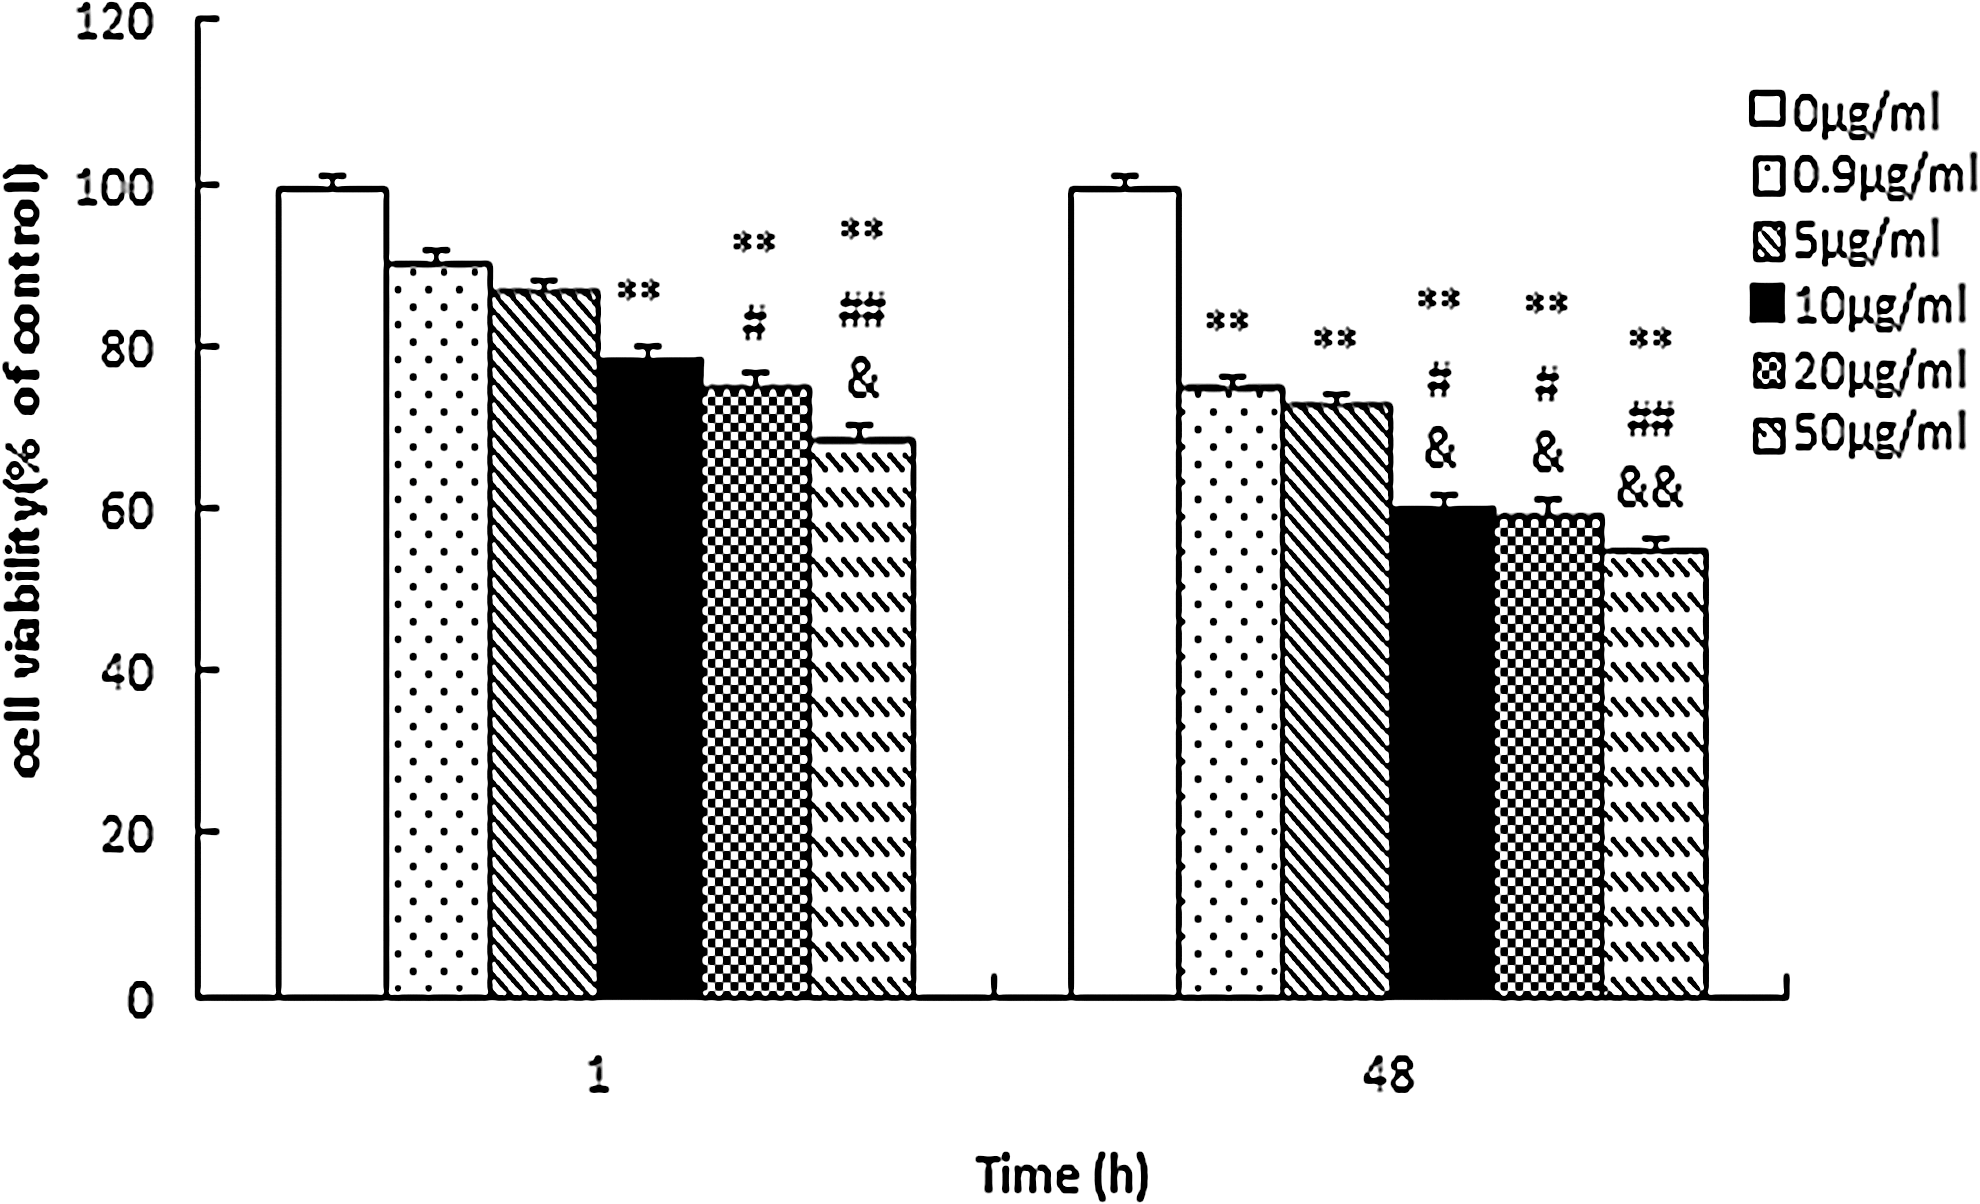
Dose-dependent effects of short-term (1 h) or long-term (48 h) propofol exposure on the viability of developing astrocytes. Astrocytes were treated with propofol (0.9, 5, 10, 20, and 50 μg/mL) for 1 or 48 h, and cell viability was monitored by MTT at 490 nm. Values represent means±SD (n=8 for all groups). (**p<0.01 vs. control group; # p<0.05, ## p<0.01 vs. propofol 0.9 μg/mL group; & p<0.05, && p<0.01 vs. propofol 5 μg/mL group).
Regulation of astrocyte miRNA expression patterns by propofol
The ratio of absorbance (A) 260 to 280 nm (A260/A280) of all samples was in the range of 1.8–2.2, indicating a high purity of obtained total RNA. The RNA integrity number of ≥7.0 and capillary electrophoresis showed clear 28S rRNA and 18S rRNA bands (Supplementary Fig. S2), which were taken to indicate that samples had no obvious degradation.
A total of 727 rat miRNAs were screened using the microfluidic chip, of which 162 were detectable in the control group (group O), 95 in group A, and 126 in group B. These results indicated that propofol had an overall repressive effect on miRNA expression in the astrocytes. Compared with group O, 46 miRNAs were significantly differentially expressed after propofol treatment (p<0.1), including both signal >500 and signal <500 (Fig. 2). The analysis of the miRNAs whose signal >500 revealed that 24 miRNAs were selected for follow-up analysis (Table 1). Of these, 10 miRNAs were differentially expressed in group A and 14 miRNAs were differentially expressed in group B. Two miRNAs (rno-miR-378a-3p, rno-miR-665) were upregulated in both groups, while three (rno-miR-146b-5p, rno-miR-221-3p, and rno-miR-222-3p) were downregulated in both groups.
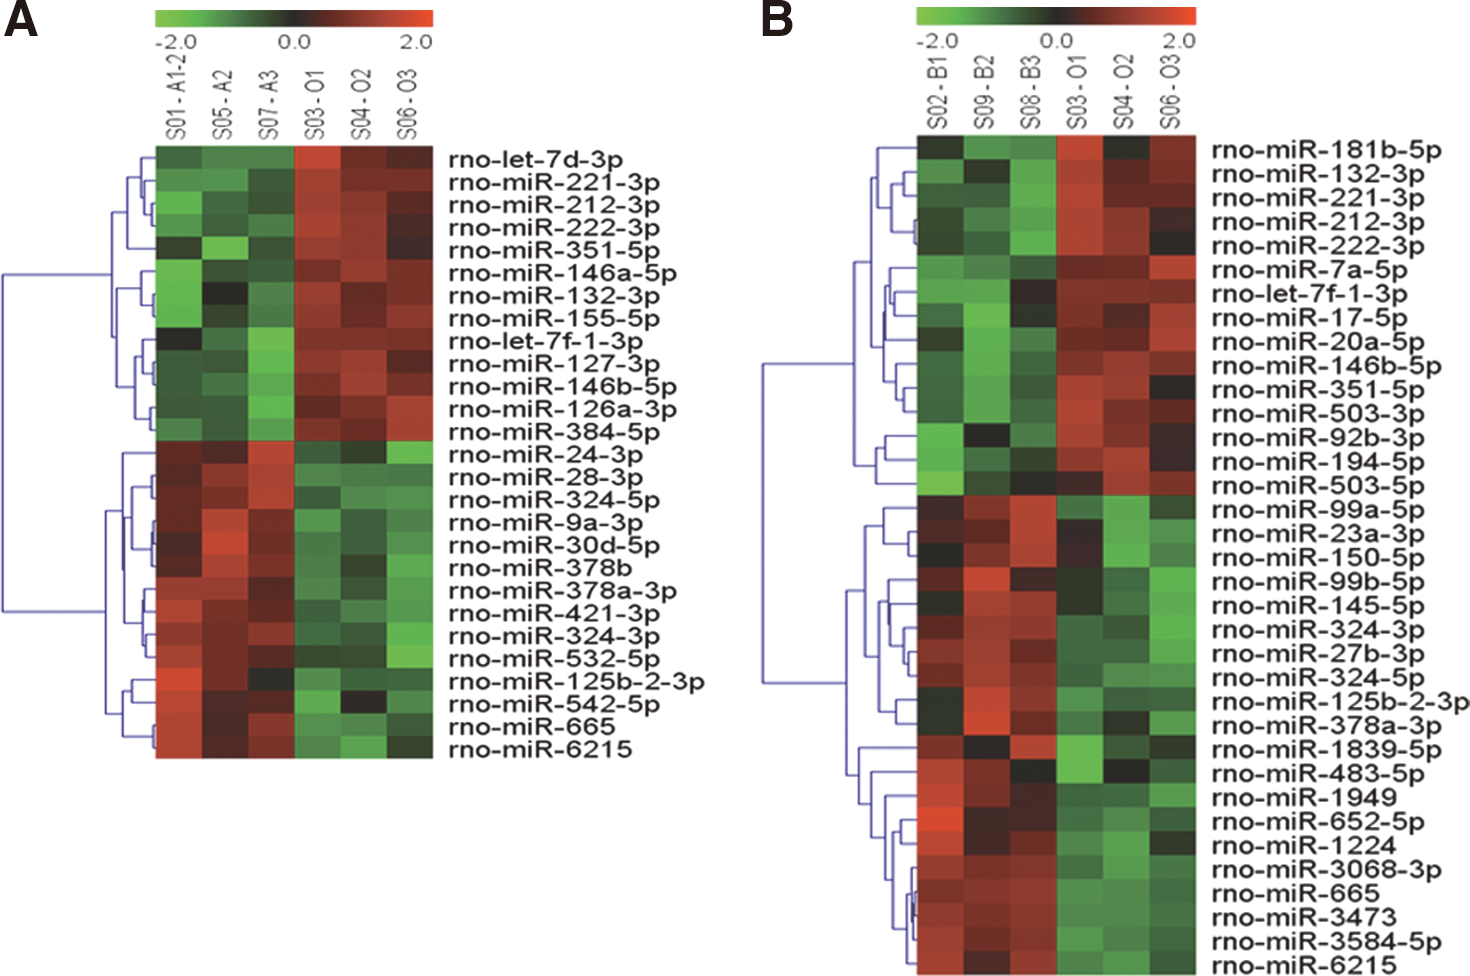
Unsupervised hierarchical cluster analysis of miRNAs differentially expressed in response to propofol based on their relative expression levels. The dendrogram on the left of the heat map orders miRNAs into groups based on the divergence of miRNA expression values among the samples. Columns correspond to samples and are labeled to indicate miRNA expression values in the triplicate samples. Each row corresponds to an individual miRNA sequence. The colors display miRNAs expression variance: red indicates a higher gene expression, green indicates lower expression, and black indicates the median value. The samples are separated into the three main groups: the control group, the group A (propofol 10 μg/mL anesthesia 1 h), and the group B (propofol 0.9 μg/mL anesthesia 48 h).
miRNAs were sorted according to their differential p-values. The ratio of detected signals (control and treated) was calculated and expressed in log2 scale (balanced) for each miRNA. After propofol application, the expression of 15 miRNAs was significantly increased and nine were significantly reduced. miRNAs in bold were regulated in common between the two different propofol treatment conditions. Group O (O1–O3): control groups; group A (A1–A3): astrocytes were treated with 10 μg/mL propofol for 1 h; group B (B1–B3): astrocytes were treated with 0.9 μg/mL propofol for 48 h.
GO analysis of target genes of differentially expressed miRNAs
GO analysis of the predicted target genes of propfol-regulated miRNAs indicated significant enrichment of genes involved in processes related to CNS development, including neuron projection morphogenesis, neuron projection development, and astrocyte differentiation (Supplementary Table S1). GOstat software analysis of biological processes associated with the target genes of selected differentially regulated miRNAs (Supplementary Table S2) indicated that differentially expressed miRNAs targeted anti-apoptotic or proliferation-related genes. Similarly, KEGG analysis of predicted target genes of the differentially expressed miRNAs using the Database for Annotation, Visualization, and Integrated Discovery (DAVID;
Networks
Next, we used Cytoscape to integrate miRNA target gene interaction networks related to the previously predicted CNS development pathway (Supplementary Fig. S3) and found that a variety of miRNAs, including the upregulated miRNAs rno-miR-665 and rno-miR-328a-5p, had prominent predicted roles in CNS development.
Verification of microarray results by qRT-PCR
We next carried out qRT-PCR validation of four miRNAs selected from those that were differentially expressed by microarray, namely, rno-miR-3473, rno-miR-665, rno-miR-378a-3p, and rno-miR-503-5p. The expression level of these miRNAs was normalized to U87. As anticipated, the results of the qRT-PCR analysis (Fig. 3) were consistent with those of the microarray analysis shown in Figure 2.
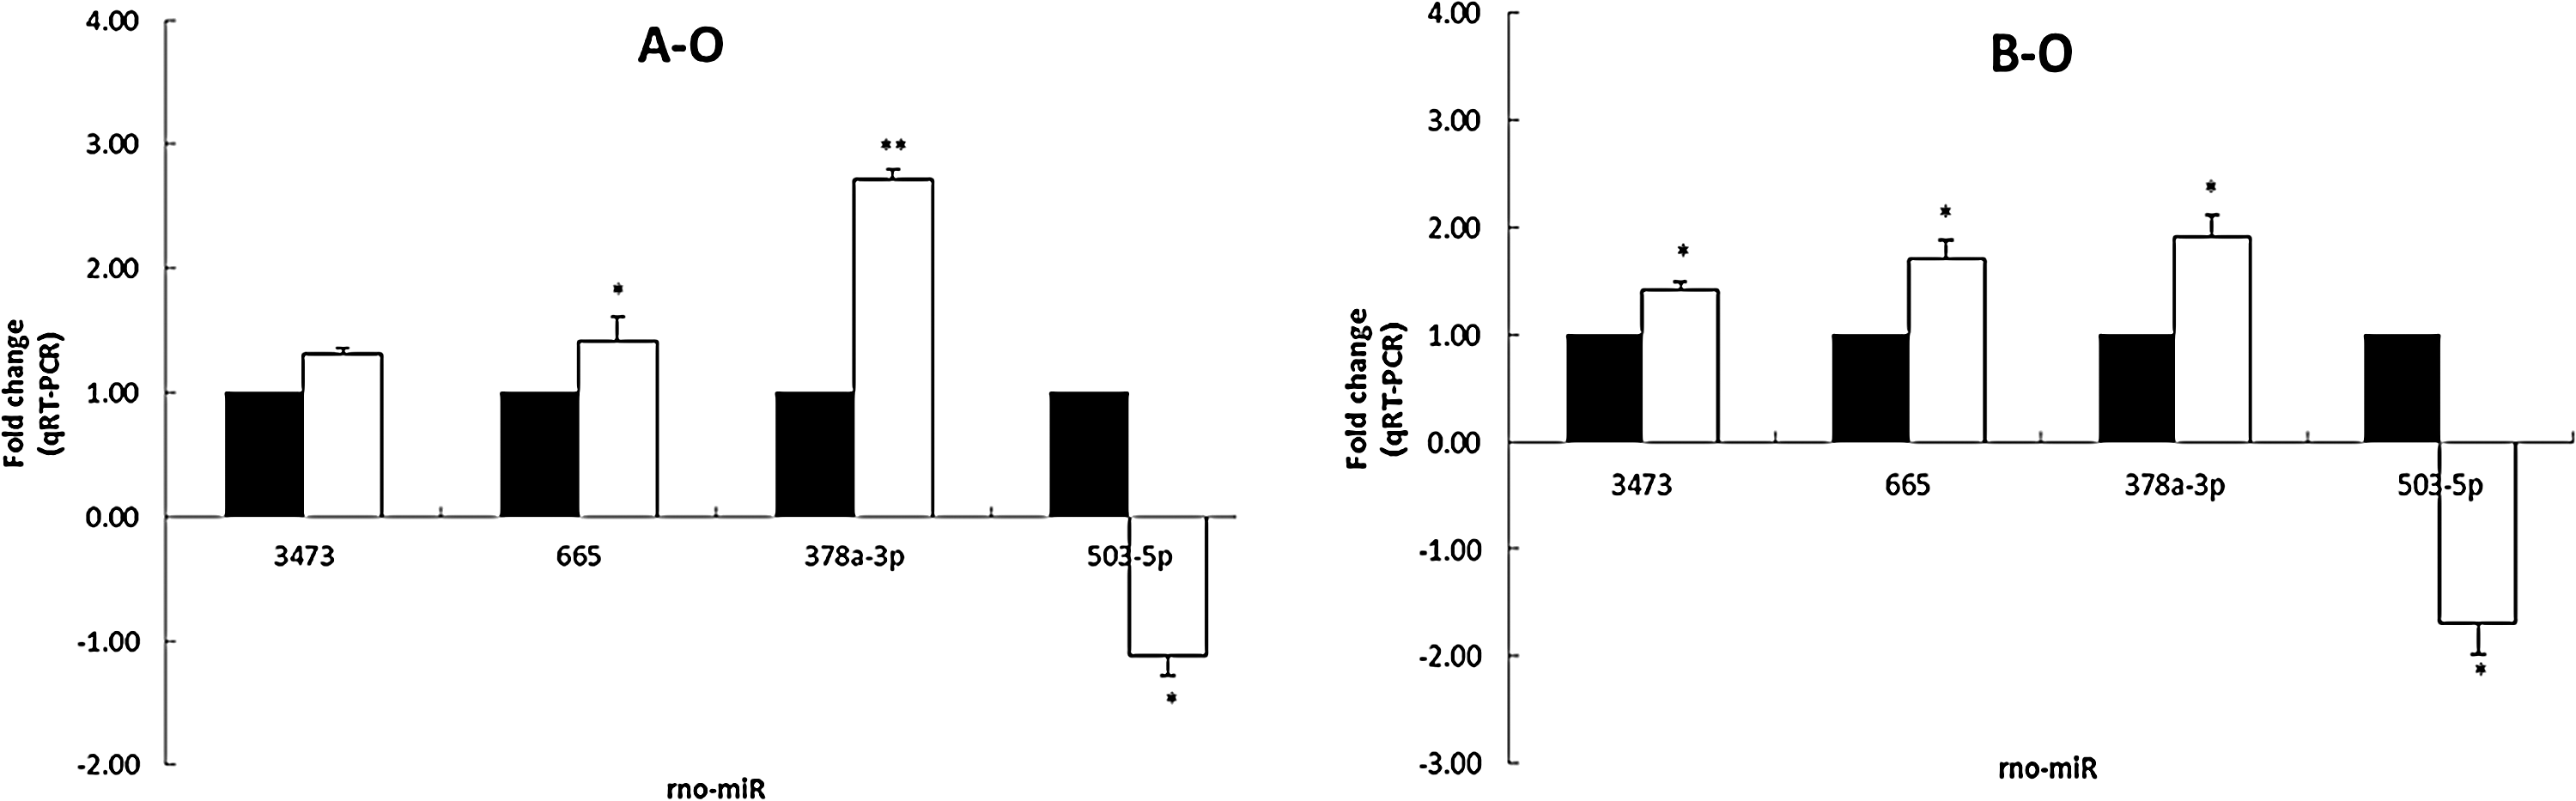
Validation of miRNA array-predicted changes of selected miRNAs by SYBR Green I qRT-PCR. The miRNA cycle threshold values were normalized to U87; each is expressed as fold change (white bars) relative to cells transfected with negative control (whose value was fixed arbitrarily to 1; black bars). The relative abundance of each miRNA was calculated using the comparative cycle threshold (2−▵▵Ct) method. Results represent the mean of three independent biological experiments performed in triplicate, which are consistent with the results of microarray analysis (n=8). *p<0.05, **p<0.01 versus control group. qRT-PCR, quantitative real-time polymerase chain reaction.
Regulation of rno-miR-665 expression by transfection with mimic or inhibitor in propofol-treated astrocytes
A comparison of the miRNAs dysregulated in the A and B microarray groups as described earlier indicated that an miRNA upregulated in both groups, rno-miR-665, was predicted by three algorithms to bind with 3′UTR of Bcl2l1 (Bcl-xl), an anti-apoptotic member of the Bcl-2 family. Members of this family play important roles in modulating neurocyte survival during mammalian CNS development (Boise et al., 1993), although the physiological basis of these properties is not fully understood (Levine et al., 2008). Accordingly, identifying the manner in which Bcl2l1 is regulated in immature astrocytes is an important goal.
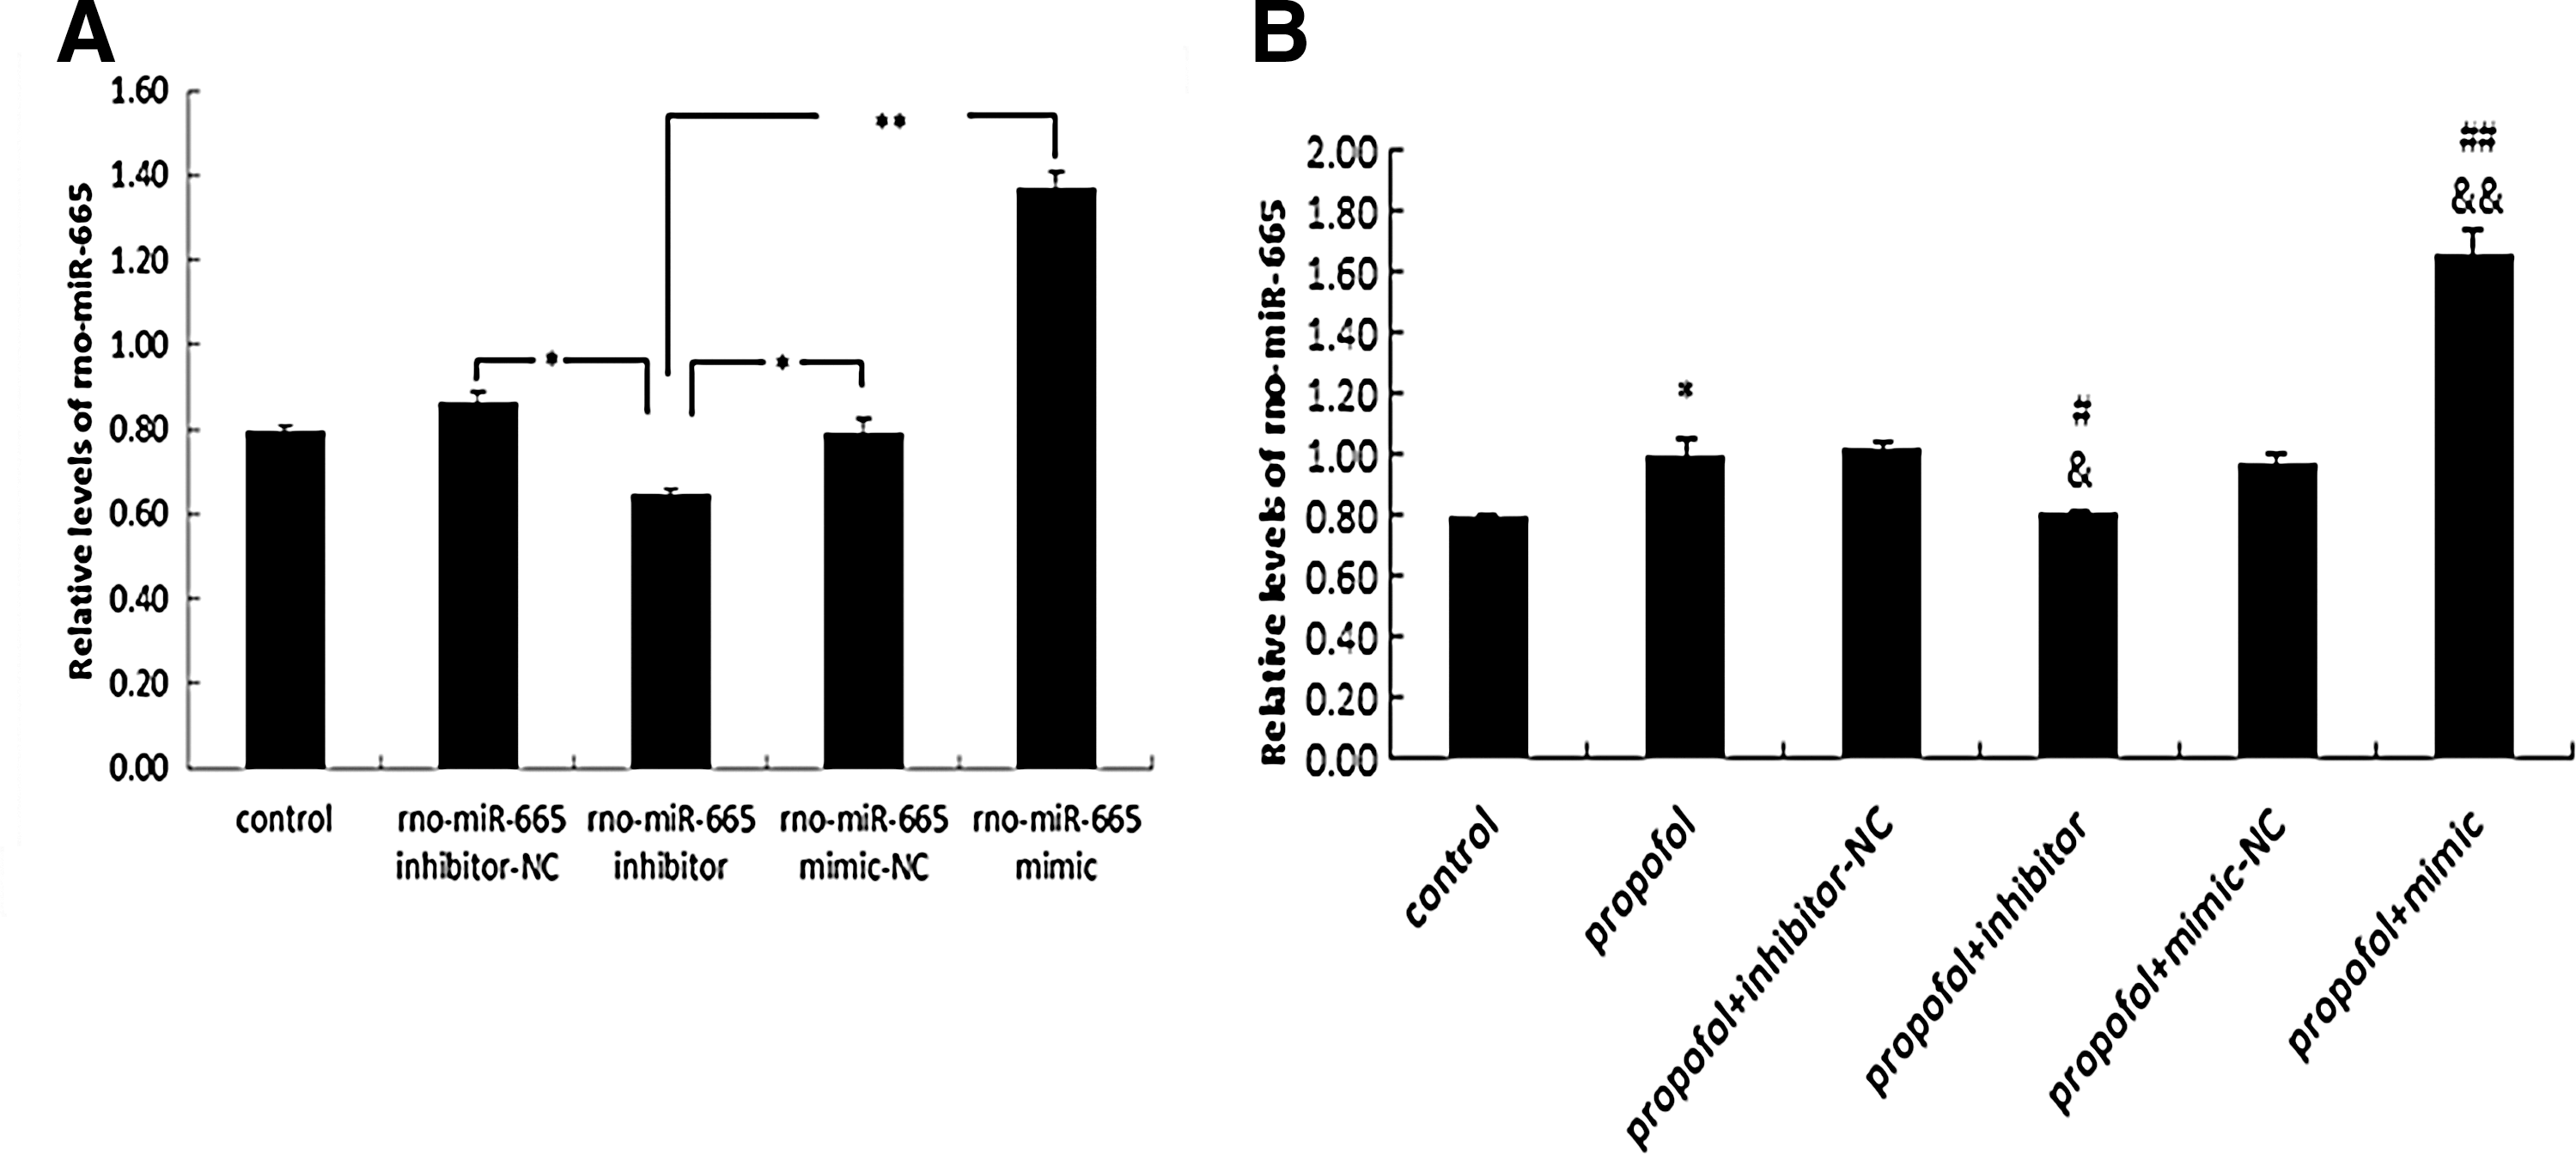
Rno-miR-665 was found to be expressed at elevated levels in immature hippocampal astrocytes after propofol 10 μg/mL×1 h (group A) or 0.9 μg/mL propofol×48 h (group B) (Fig. 3). Moreover, rno-miR-665 expression was significantly up- or downregulated after transfection with rno-miR-665 mimic or inhibitor, indicating that the mimic and inhibitor were efficiently transfected (*p<0.01, **p<0.05) (Fig. 4A). Rno-miR-665 expression was significantly increased after exposure to propofol (10 μg/mL×48 h), as compared with the control group (*p<0.05). Pretreatment with mimic or inhibitor during propofol exposure, respectively, elevated or reduced the expression of rno-miR-665 as compared with propofol-only (# p<0.05, ## p<0.01) and propofol+mimic/inhibitor-NC (& p<0.05, && p<0.01) groups (Fig. 4B).
Propofol stimulates rno-miR-665 ectopic expression in immature astrocytes.
Modulation of Bcl2l1 expression by propofol is mediated by rno-miR-665
qRT-PCR analysis demonstrated that Bcl2l1 mRNA levels were significantly decreased or increased after 48 h of transfection with rno-miR-665 mimic or inhibitor, respectively, validating our earlier prediction of Bcl2l1 as a target of rno-miR-665 in primary astrocytes (*p<0.01, **p<0.05) (Fig. 5A). Compared with the control, Bcl2l1 levels were downregulated by 48 h of treatment with 10 μg/mL propofol (*p<0.05), and they were further repressed after pretreatment with 75 pmol rno-miR-665 mimic as compared with the propofol-only (## p<0.01) and propofol+mimic-NC (&& p<0.01) groups. Moreover, rno-miR-665 inhibitor reversed the effect of propofol on expression of Bcl2l1 mRNA (# p<0.05; & p<0.05) (Fig. 5B).
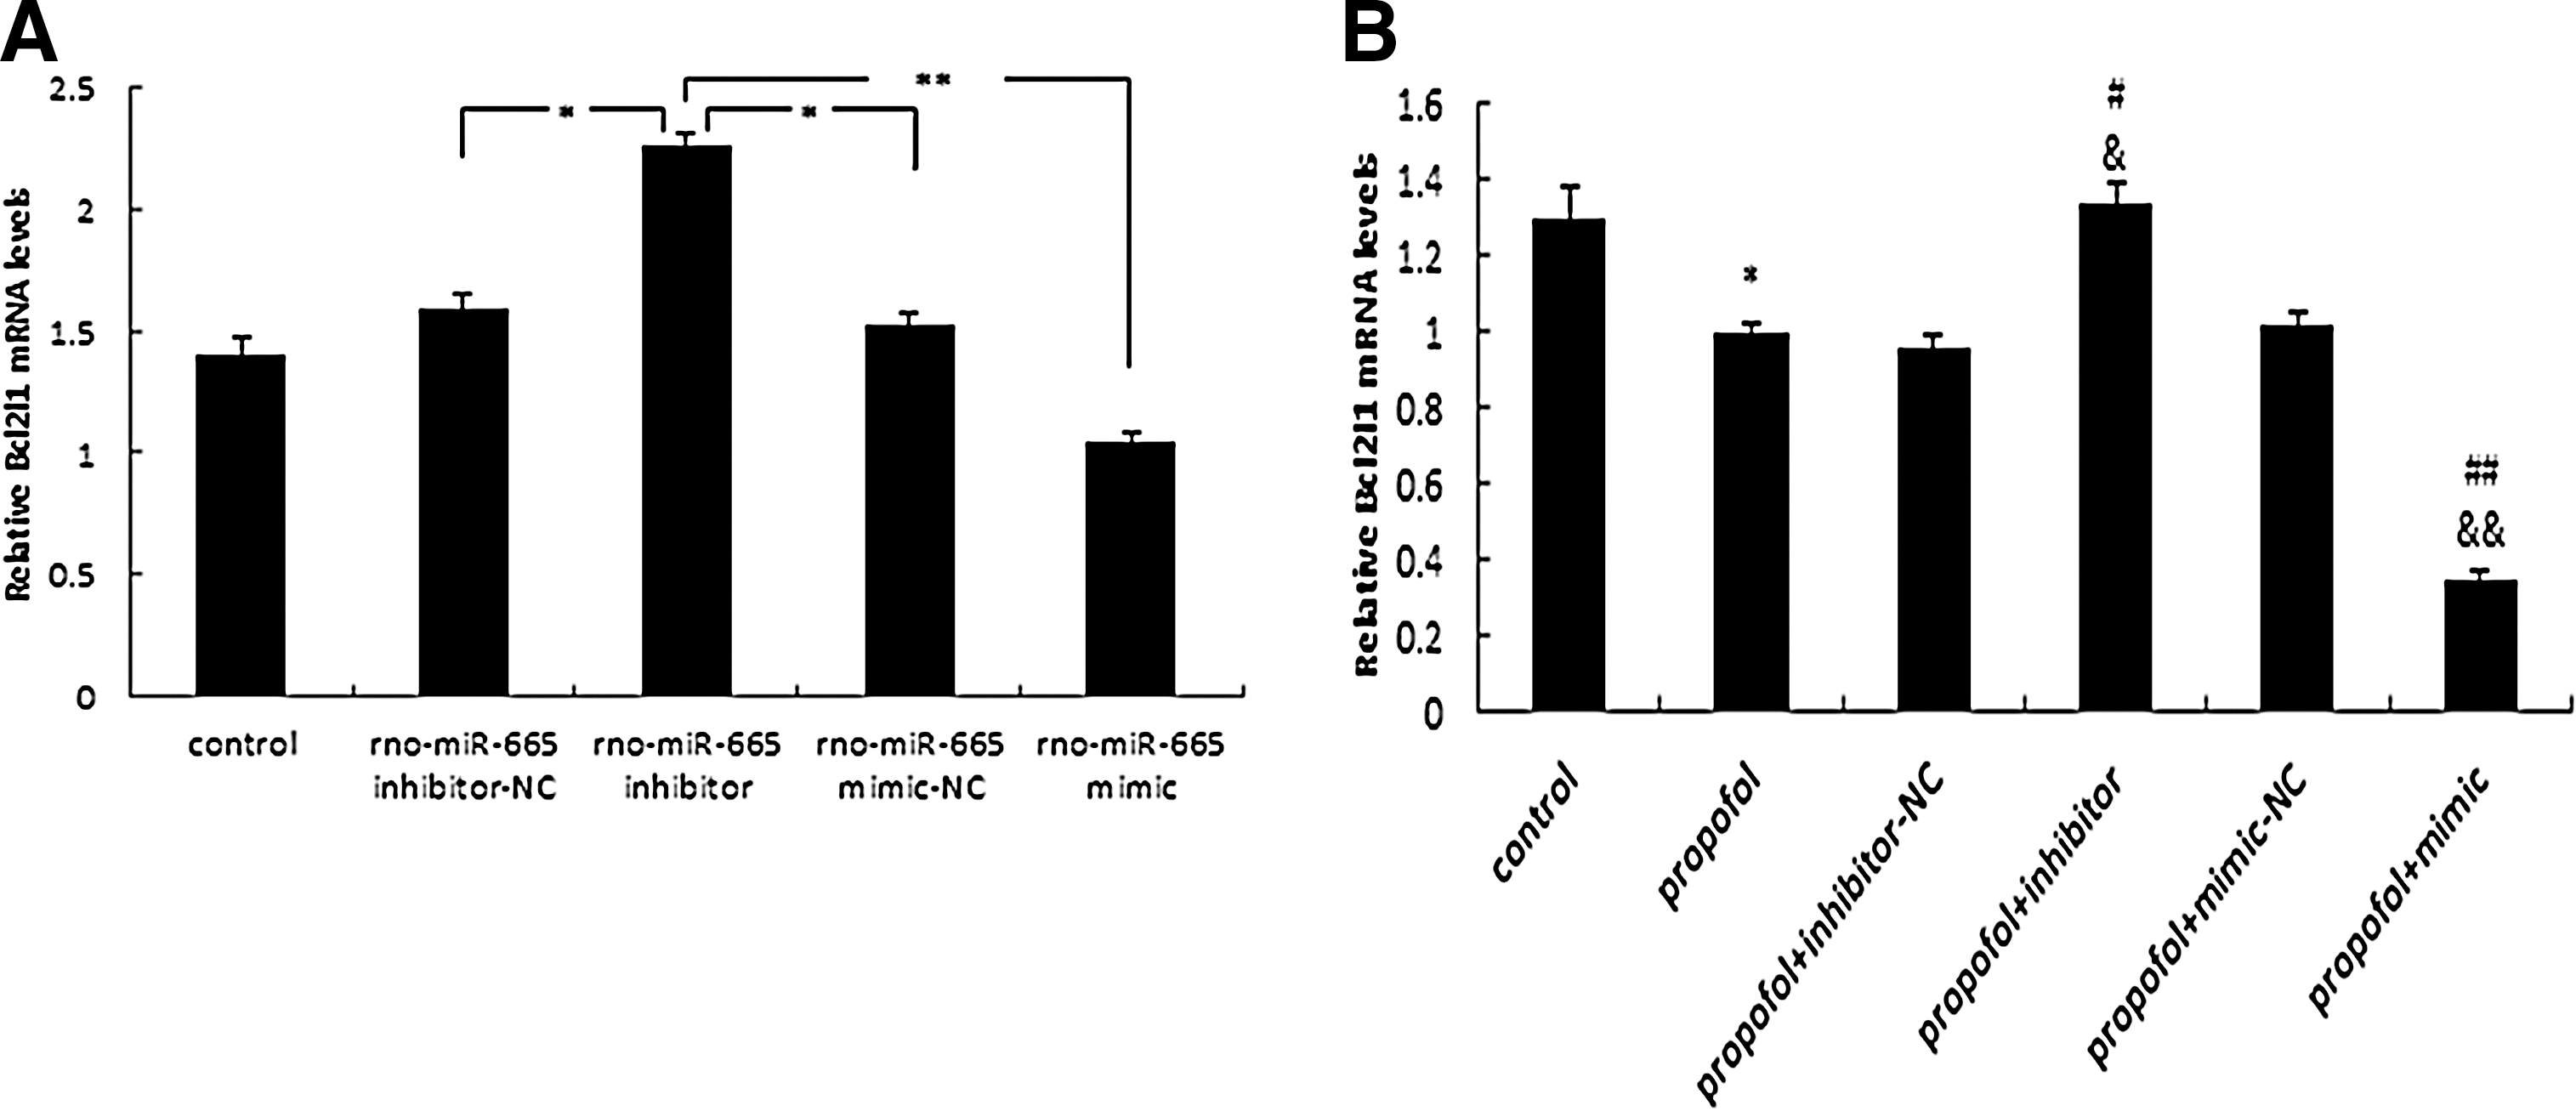
Effect of expression of rno-miR-665 on Bcl2l1 mRNA expression measured by qRT-PCR.
Verification of rno-miR-665 target sites in the 3′UTR of Bcl2l1
The endogenous miRNAs were reported to be effective in inhibiting mRNAs containing the perfect miRNA complementary sites to mediate post-transcriptional repression (Bartel, 2004, 2009). Hence, a luciferase reporter containing Bcl2l1 3′UTR at 3′ end of a Renilla luciferase gene was generated and confirmed by sequencing (Fig. 6A–C). The wild-type or mutant reporter construct was cotransfected with the rno-miR-665 mimic into astrocytes in vitro. As expected, compared with the relative luciferase activity (RLA) of control reporter without an rno-miR-665 target sites (rno-miR-665-mimic-NC) (0.80±0.02), cotransfection of the rno-miR-665 mimic along with the wild-type plasmid led to the significant repression of RLA (**p<0.01), with the value being 0.55±0.03. By contrast, the mismatch plasmid RLA did not decrease when there was overexpression of rno-miR-665 (0.80±0.05) (Fig. 6D). Considered together, based on the perfect complementary sequences on Bcl2l1 3′UTR, rno-miR-665 exhibited effective inhibition of Bcl2l1 expression.
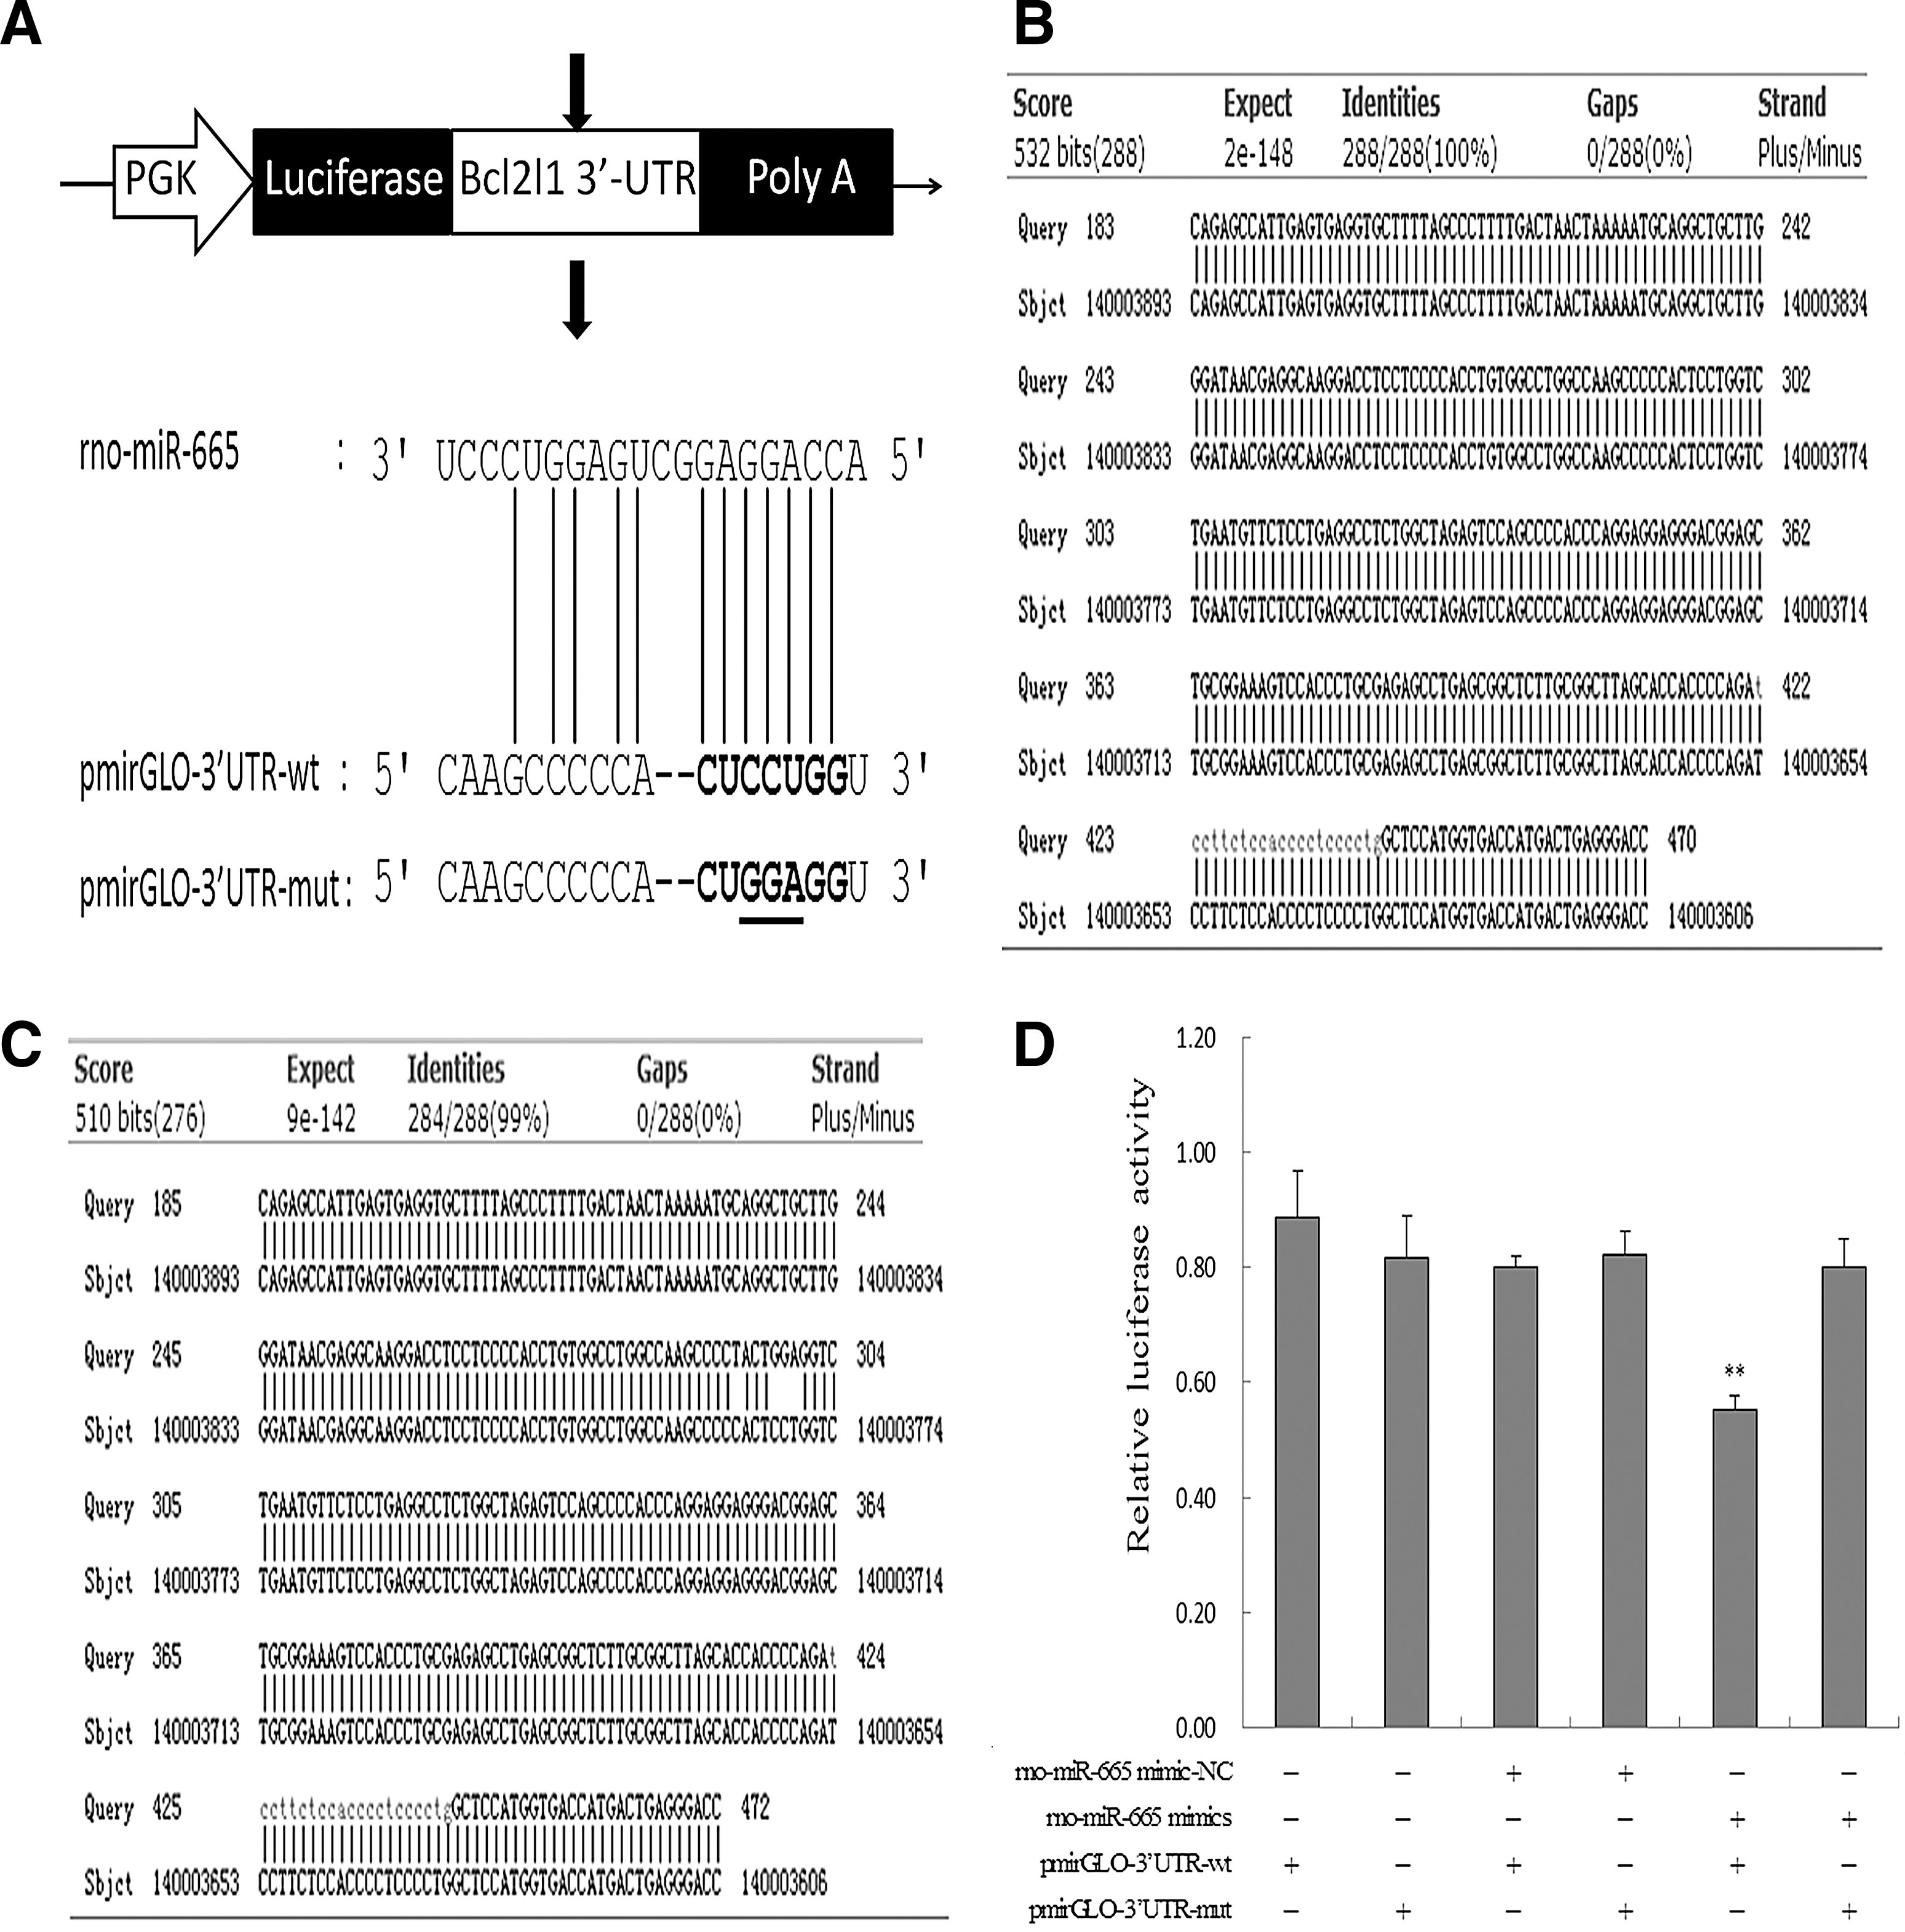
Confirmation of rno-miR-665 target sites cloned into a luciferase reporter containing Bcl2l1 3′UTR.
Modulation of Bcl2l1 and cleaved caspase-3 protein levels by rno-miR-665
Consistent with the observed effects on Bcl21 mRNA levels, propofol (10 μg/mL) significantly repressed Bcl2l1 protein expression after 48 h (*p<0.05). Pretreatment with rno-miR-665 mimic or inhibitor significantly reduced or elevated the expression of Bcl2l1, compared with the propofol-only (## p<0.01) and propofol+mimic/inhibitor-NC (&& p<0.01) groups, respectively.
Caspases are vital regulators of apoptosis and, in particular, cleaved caspase-3 is a marker of apoptosis. Accordingly, we next evaluated the effect of ectopic expression of rno-miR-665 on the apoptosis executor caspase-3 in immature astrocytes. Transfection with rno-miR-665 inhibitor neutralized the stimulatory effect of propofol on cleaved caspase-3 protein levels, whereas rno-miR-665 mimic and propofol increased levels of cleaved caspase-3 in immature astrocytes in a synergistic manner (## p<0.01; && p<0.01) (Fig. 7).
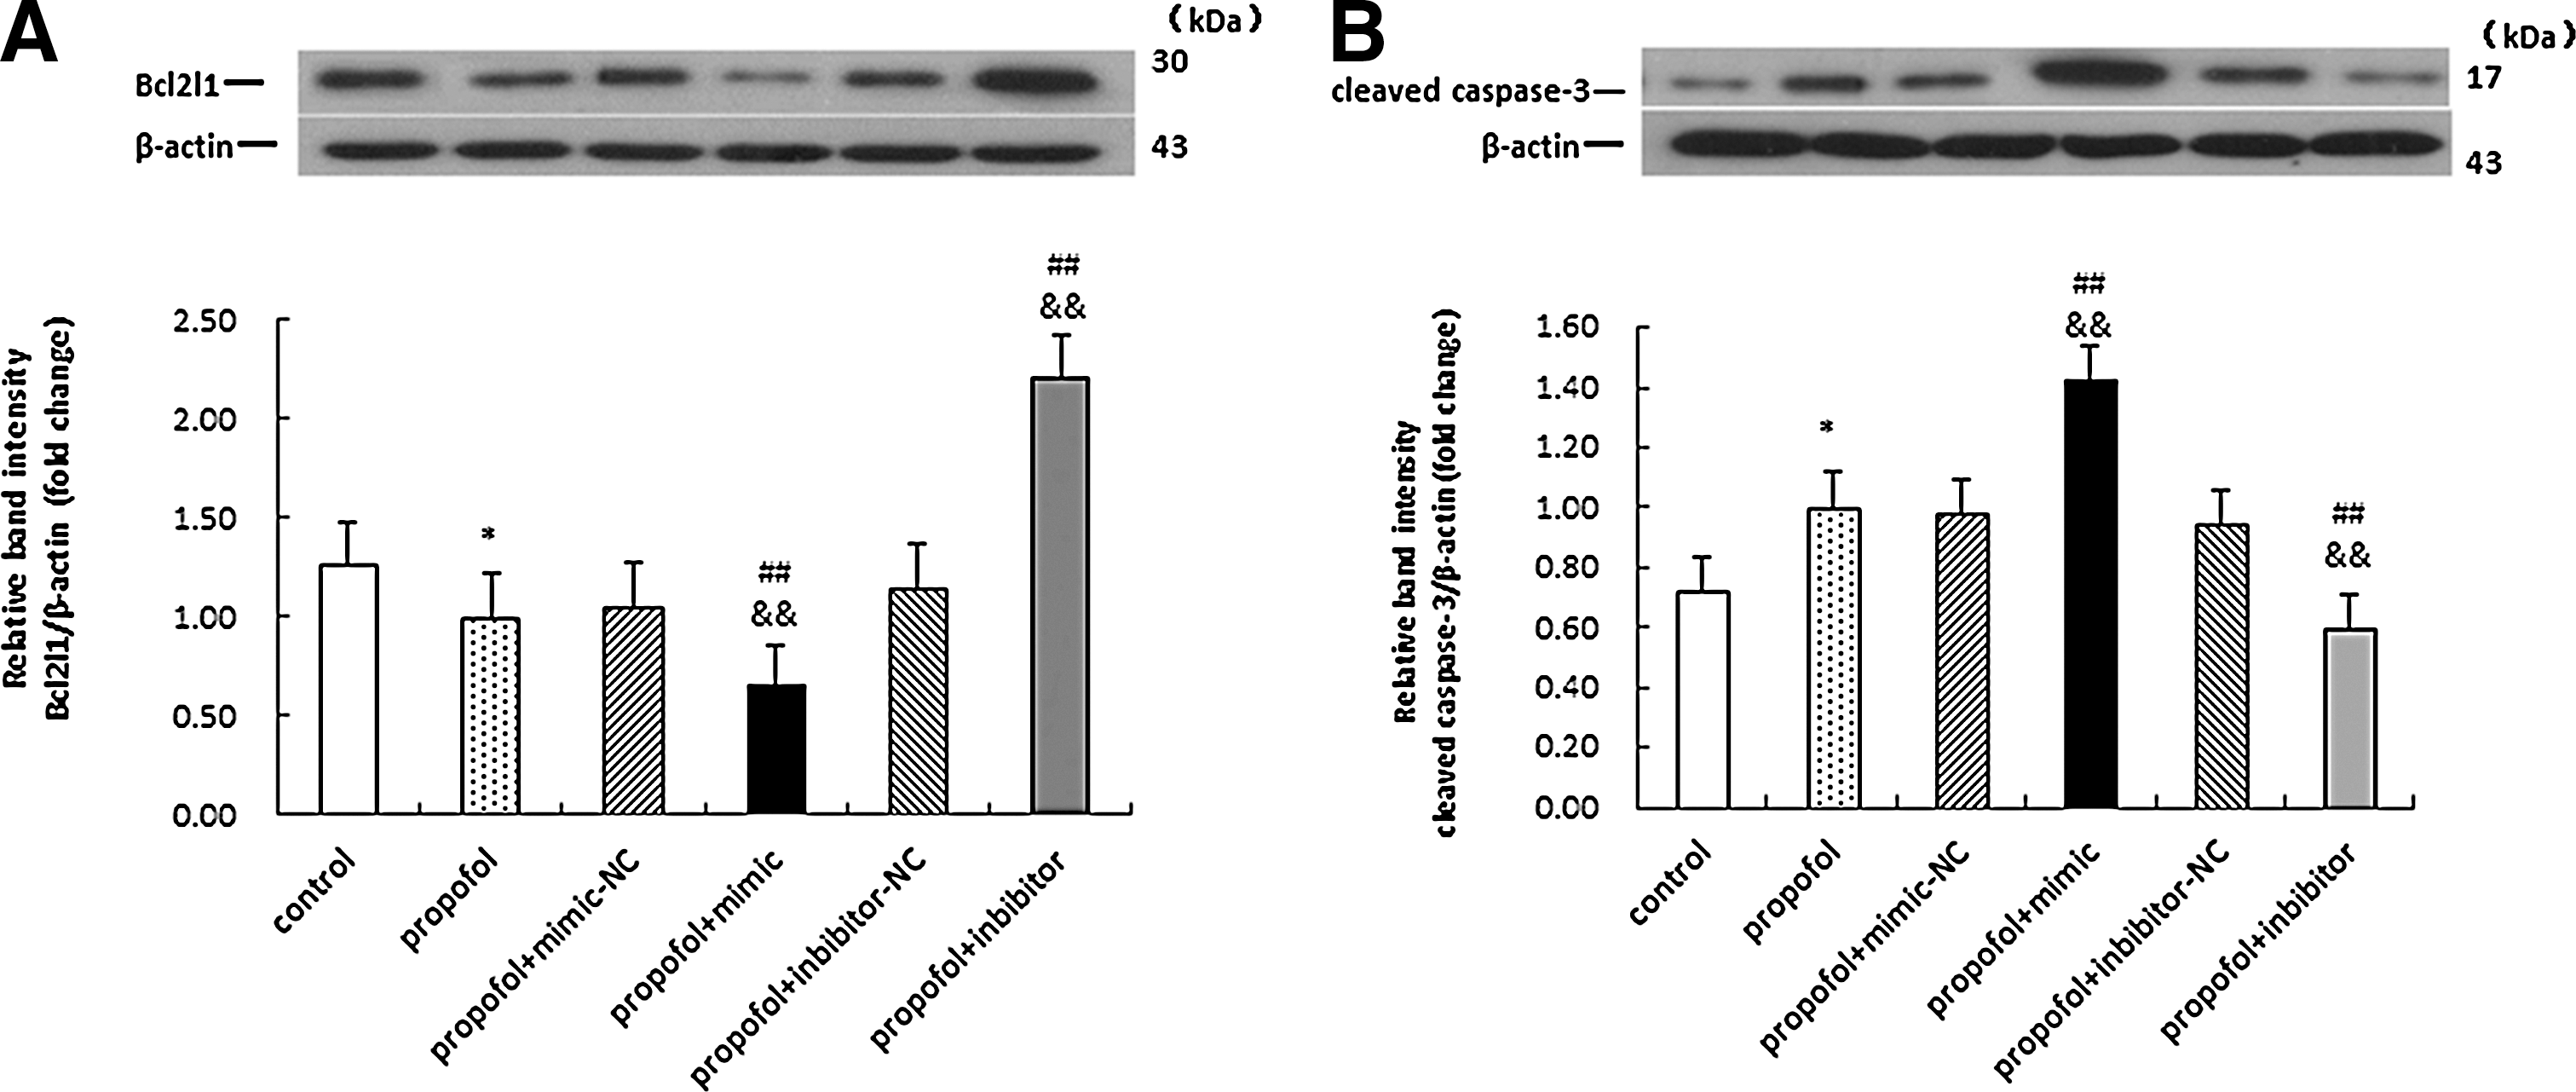
Fluctuations in cleaved caspase-3 and Bcl2l1 protein levels after transfection in propofol-treated developing rat hippocampal astrocytes. The maximal inhibitory effects of Bcl2l1 were identified in the propofol+mimic group by western blot, in addition to the highest levels of cleaved caspase-3 in this group. Both experiments were performed in triplicate independently. The upper panel shows representative immunoblots of
Rno-miR-665 regulates survival of immature astrocytes
Next, we used an MTT assay to evaluate the effect of rno-miR-665 levels on the viability of immature astrocytes after treatment with 10 μg/mL propofol for 48 h. Overexpression of rno-miR-665 further repressed cell viability in propofol-treated cells, whereas cultured astrocyte viability was relieved after transfection with rno-miR-665 inhibitor in propofol-treated cells (## p<0.01; && p<0.01) (Fig. 8).
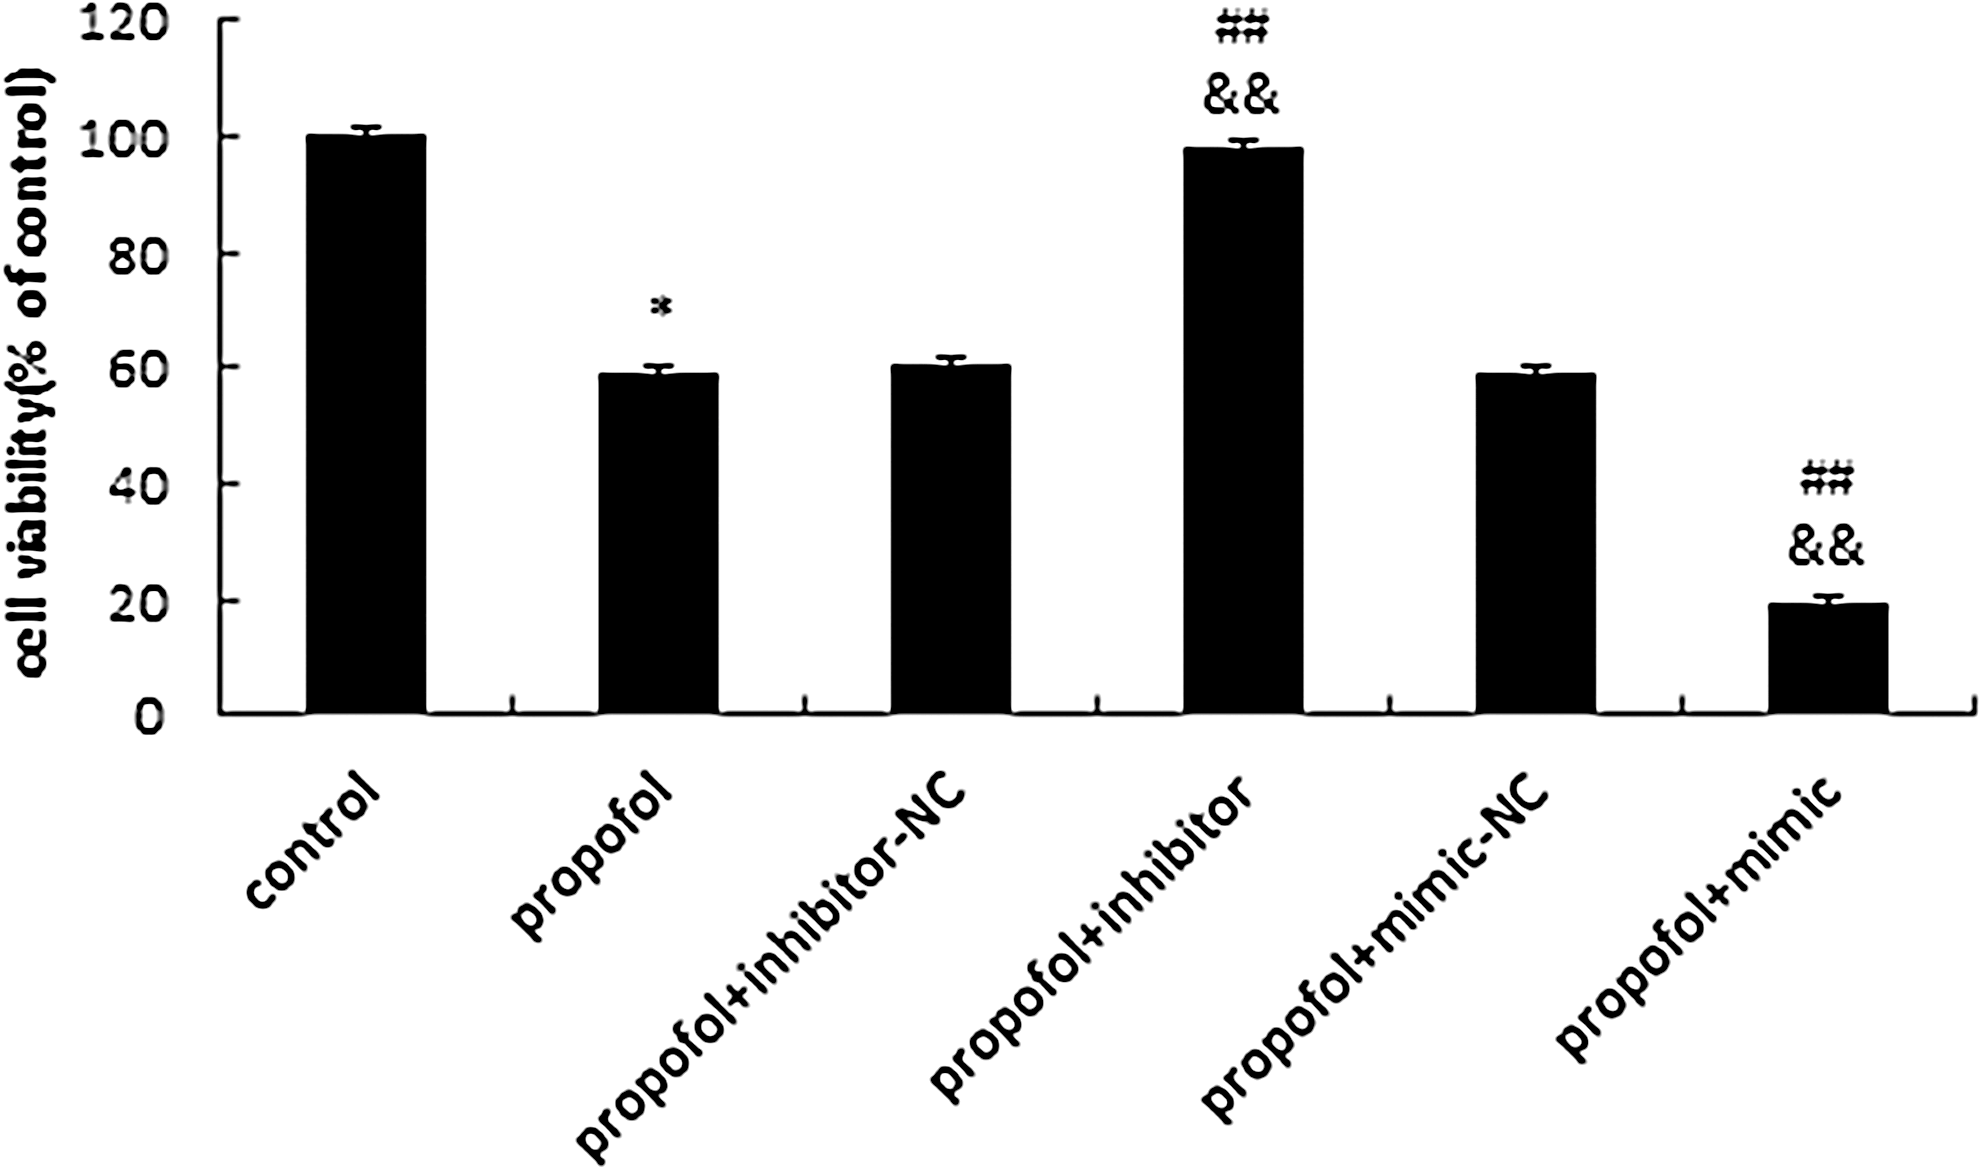
Effects of rno-miR-665 on propofol-induced injury in immature astrocyte. After transfection of rno-miR-665 mimic, rno-miR-665 inhibitor, or NC at a final concentration of 75 pmol for 48 h, transfected astrocytes were exposed to propofol 10 μg/mL for 48 h before undergoing MTT assay. The results showed that propofol remarkably decreased the viability of primary cultured astrocytes (*p<0.05 vs. control group). Rno-miR-665 mimic aggravated cell injury caused by exposure to propofol (48 h 10 μg/mL), whereas rno-miR-665 inhibitor attenuated cell injury after exposure to 10 μg/mL propofol for 48 h (## p<0.01 vs. propofol group; && p<0.01 vs. propofol+mimic/inhibitor-NC group). Values represent means from three separate experiments, and error bars represent SD (n=3).
Analysis of annexin V/PI staining and flow cytometry
Rno-miR-665 mimic increased, and inhibitor decreased, early and late apoptosis at 48 h (*p<0.05) (Fig. 9). We further found that treatment with propofol (10 μg/mL for 48 h) caused a statistically significant increase in the rate of early apoptosis (*p<0.05). Moreover, rno-miR-665 mimic aggravated, and rno-miR-665 inhibitor protected, cell injury induced by propofol. In additio, exposure to a combination of rno-miR-665 mimic and propofol significantly increased the percentage of necrotic cells (## p<0.01). In contrast, rno-miR-665 inhibitor protected against propofol-induced early and late apoptosis (# p<0.05). These results support the hypothesis that propofol has neurotoxic effects in dissociated cell cultures.
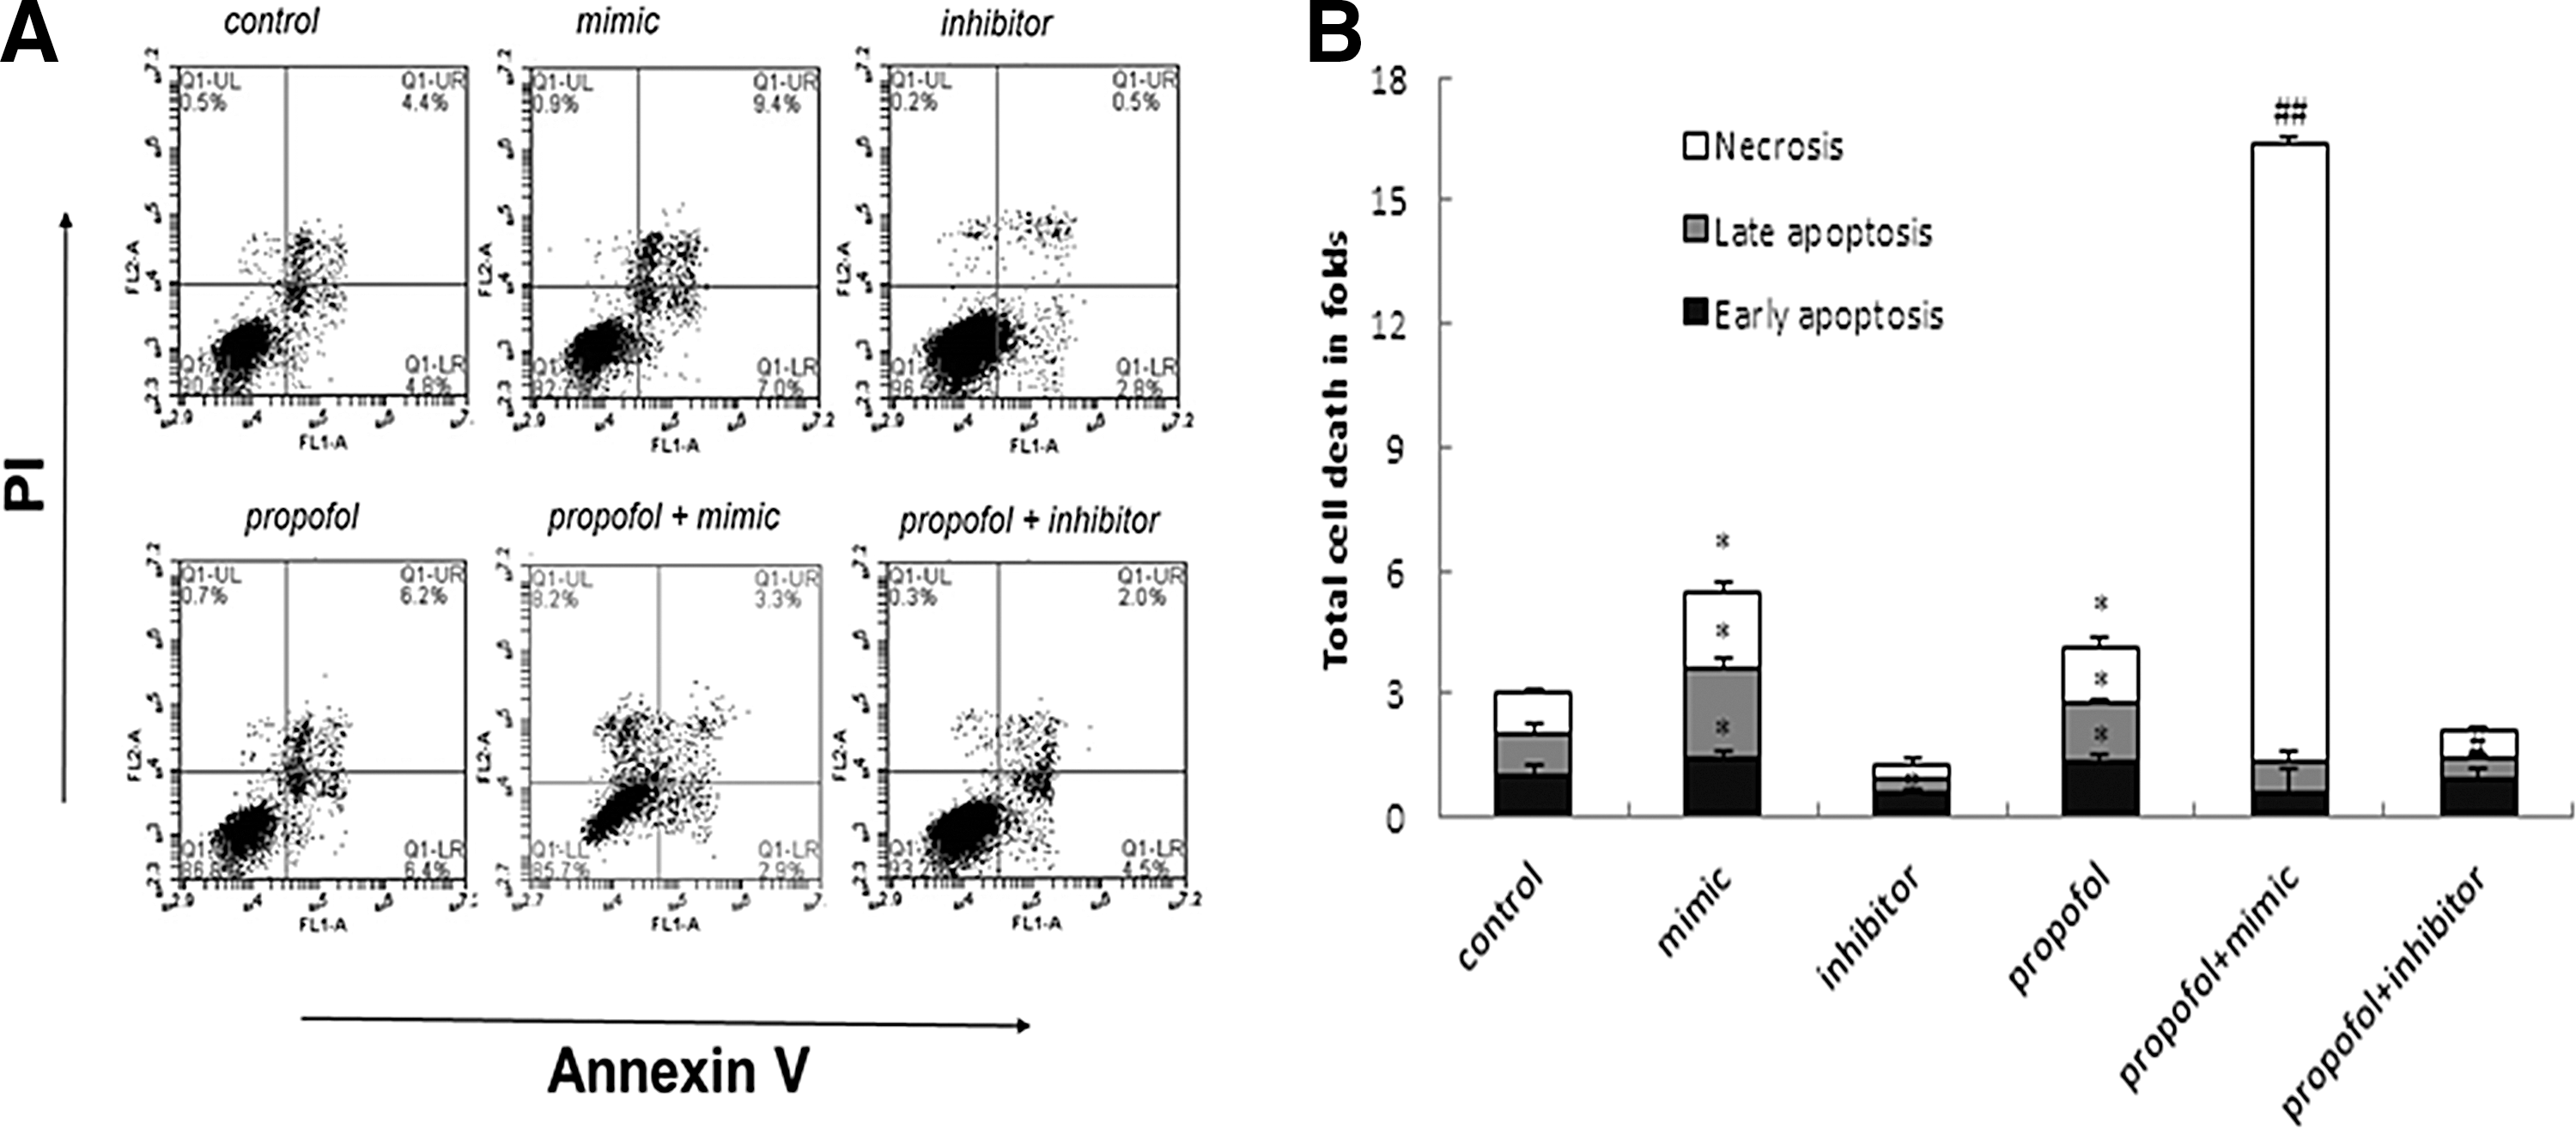
Determination of cell viability by Annexin V/PI staining and flow cytometry.
Discussion
Although propofol has been extensively studied in many pediatric age groups, data from neonates are limited (Allegaert et al., 2007). To explore its development-dependent effects in this study, primary astrocyte cultures were treated with propofol at an immature stage (i.e., at culture day 9). Given that GABAA receptors have been shown to be expressed in astrocytes both in vitro and in vivo (Lunardi et al., 2011), it is important to examine whether general anesthetics, which are known potent modulators of GABAA receptors, can influence astrocyte development. It has been illustrated that anesthesia-induced neurotoxicity of developing astrocytes is closely involved in disturbing proper cytoskeletal development. Moreover, the threshold of the lethal anesthetic dose for immature neurons is known to be smaller than that for developing astrocytes in vitro, indicating that the susceptibility of neurons to anesthetic toxicity is higher than in glial cells. Furthermore, anesthesia-induced death of astrocytes is known to be age dependent, occurring in very immature, but not more mature, cultured astroglia (Lunardi et al., 2011). Although the underlying mechanism is currently unknown, it has been suggested that general anesthetics applied during a critical stage in mammalian brain development might lead to initiation of the death cascade in neurons by depression of neuronal activity (Jevtovic-Todorovic, 2005). Consistent with this, propofol anesthesia has been shown to induce apoptotic cell death of immature neurons in aggregated cell cultures in fetal rat telencephalon (Honegger and Matthieu, 1996). Interestingly, contrary to these results, anesthesia-induced GABAA-receptor activation failed to lead to decreased activity in immature neurons (Ben-Ari et al., 2007). In summary, the mechanism and selectivity of anesthesia-induced neurodegeneration has yet to be investigated.
It has been reported that treatment with propofol (20–100 μg/mL for 3 days) results in dose-dependent cytotoxicity in dissociated cultures of GABAergic cortical neurons, and in glial cells in dissociated neonatal neurocytes (Spahr-Schopfer et al., 2000). The concentrations of propofol used in the present experiment are comparable to serum propofol concentrations used in other studies. Serum concentrations of propofol are typically ∼6 μM during recovery from anesthesia (Kanto, 1988), and they range between 8 and 50 μM during clinical induction of propofol. An experimental levels of 10 μg/mL is comparable with propofol peak levels immediately after injection (Kay et al., 1986). As previously reported, steady-state anesthesia levels of propofol are 2–5 μg/mL in humans and 20–60 μg/mL in animals (Feiner et al., 2005). Our results are consistent with previous reports showing that clinically relevant concentrations of propofol result in cell death of GABAergic neurocytes in neonates (Vutskits et al., 2005). In contrast, aggregating fetal (16 days of gestation) rat brain glial cells have been shown to develop resistance to propofol even at doses of 10 μg/mL (Honegger and Matthieu, 1996), although the reasons for the discrepancy observed still remain unclear. In addition, the brain:blood partition coefficient of propofol is greater than 1.2 in human and animals (Dutta et al., 1998), which is consistent with its lipophilic characteristic. Given its lipophilic nature, propofol concentrations are higher in the brain than in plasma (Riu et al., 2000) and they are comparable to those in cerebrospinal fluid (Jensen et al., 1994). Clinically relevant concentrations of propofol, therefore, likely exert irreversible damage in developing brains, especially in immature astrocytes.
As a short-acting intravenous anesthetics, a bolus dose of propofol will lead to a rapid redistribution and termination of its effects. Neonates in the first week of life are at increased risk of accumulation of propofol during either intermittent bolus or continuous administration (Allegaert et al., 2007). Indeed, we found that both short-term (1 h) and long-term (48 h) exposure to propofol reduced viability of immature primary cultured astrocytes in a dose-dependent manner. In our model, we found that 1 h of exposure to 10 μg/mL propofol was sufficient to exert cytotoxic effects in immature hippocampal astrocytes, and that when the exposure time was increased to 48 h, the lowest cytotoxic dose was 0.9 μg/mL. Although short-term usage is quite similar to the clinical situation, it is insufficient to clarify the latent effects of propofol. In addition, there are relatively few reports of neurotoxicity associated with long-term exposure to propofol. Furthermore, children have been shown to develop neurological disorders after prolonged anesthesia or sedation with propofol clinically. Studies of prolonged effects of peak concentration of propofol, as in this study, are, therefore, more meaningful. Accordingly, we chose long-term (48 h) exposure to 10 μg/mL propofol in subsequent experiments to identify its potential cumulative toxic effects in immature neurocytes.
Astrocytes are the most abundant type of glial cell, and they play active roles in neural function, including providing support for neuronal development or differentiation, maintaining the integrity of the blood–brain barrier and responding to external stimuli (Volterra and Meldolesi, 2005; Barres, 2008), and regulating synapse formation and neuronal survival (Ovanesov et al., 2008). Although the effects of drugs on glial cells have been well characterized, reports of the effects of general anesthetics such as propofol on astrocytes are relatively scarce. We have evaluated the cytotoxic and miRNA transcriptomic effects of the anesthetic propofol on immature rat hippocampal astrocytes in vitro. An increasing number of studies have clarified the properties and functions of astrocytes using primary cultures from neonatal rodent brains. Since it first emerged in 1972 (Booher and Sensenbrenner, 1972), this model has been widely used and identified to be effective in preserving the dominant properties and real functions of normal astrocytes (Kimelberg, 1983). Current knowledge of the molecular difference between primary cultures and the in vivo situation remains inconclusive, however, and a comparative transcriptome analysis of astrocytes both in vitro and in vivo is required. Many astrocyte functions need to be confirmed in vivo, and much work remains to be done in understanding the role of astrocytes in health and disease.
MiRNAs are expressed in a highly region-specific manner in the CNS (Lagos-Quintana et al., 2002; Berezikov et al., 2006; Wheeler et al., 2006). Our transcriptomic analysis of propofol-treated immature rat astrocytes indicated that it significantly alters the expression patterns of a group of miRNAs in astrocytes. Several of these, such as rno-miR-221, rno-miR-222, and rno-miR-378, have been shown to be hippocampus enriched or to have potential roles in learning and memory (Parsons et al., 2008; Preiss et al., 2009). Rno-miR-24-3p may target Ncstn, which has been verified to be expressed in the neuritic plaques that constitute the hallmark lesion in the brains of patients with Alzheimer's disease (Yu et al., 2000; Gu et al., 2003). Moreover, the predicted gene targets of propofol-regulated immature astrocyte miRNAs are involved in CNS development and in signaling pathways related to cell death, synapse function, and neurogenesis. For example, rno-miR-1224 and rno-miR-665 were predicted to, respectively, target Sox10 and Notch1, which support developmental processes by controlling cell fate. Similar functions have been ascribed to Wnt11 and Tle3, the predicted targets of rno-miR-351-5p. Rno-miR-1224 was predicted to target l1cam and Sox10, which participate in the development and maintenance of the CNS, and comparable roles have been assigned to Efnb1 and Utp11l, which were the predicted targets of rno-miR-24-3p.
The developmental period of the rodent brain occurs within the first three postnatal weeks (Ikonomidou, 2011), during which time, as is the case in the brains of other mammals, neurocytes are overproduced and physiologically eliminated. The growth spurts and timing vulnerability periods of the CNS occur between postnatal days 2–7 in rats, which correspond to the human third trimester (Clancy et al., 2007), during which time the susceptibility to various stressors is increased and cell death pathways can be activated (Erecinska et al., 2004). Unfortunately, the studies described earlier did not encompass the glia. Furthermore, in a recent study, Ikonomidou, (2011) showed that the brain growth spurt phase occurs within the first three postnatal weeks in mice and rats, not just in the previous 2 weeks. In support of this, Vutskits et al. (2008) showed that the window of vulnerability to anesthetic is greater than previously believed, extends to at least 20 days, and indeed any stage of life, and is not limited to the brain growth spurt. In this study, we choose 16-day-old astrocytes in vitro for our experiments, supporting the notion that the cultured astrocytes are sensitive to clinically relevant concentrations of propofol beyond the 2 week time point.
To date, there has been a dearth of studies regarding regulation of propofol-mediated neurocyte damage by miRNAs. The results of our microarray analysis indicated that several miRNAs (rno-miR-6216, rno-miR-3584-5p, rno-miR-1224, rno-miR-24-3p, rno-miR-328a-5p, rno-miR-665, rno-miR-214-3p, rno-miR-30c-1-3p, rno-miR-181b-5p, rno-miR-668, rno-miR-351-5p, rno-miR-22-3p, rno-miR-3473, and rno-miR-15b-5p) whose expression was significantly altered by propofol were specifically associated with apoptosis. In addition, GO analysis indicated that two of the differentially expressed miRNAs, rno-miR-1224 and rno-miR-351-5p, were predicted to target the anti-apoptotic genes Stat5a and Vegfa, respectively. Stat3 regulates the expression of genes in response to cell stimuli in processes such as astrogenesis (He et al., 2005) and, therefore, constitutes a potential therapeutic target in cell growth and apoptosis. Using KEGG analysis, we found that many propofol regulated miRNAs were predicted to target genes involved in the MAPK, JAK-STAT, Notch, Wnt, and VEGF signaling pathways, all of which are closely related to apoptosis.
We validated an acute and chronic propofol-regulated target of rno-miR-665 as Bcl2l1 (Bcl-xl), an important anti-apoptotic member of the Bcl-2 gene family that, along with other members of this family, has been shown to localize in the outer membrane of mitochondria (Gross et al., 1999). The constitutive expression of Bcl2l1 in the adult and newborn CNS (Gonzalez-Garcia et al., 1995; Mizuguchi et al., 1996), and extensive neuronal death in the developing CNS of Bcl2l1 null mice (Motoyama et al., 1995) indicates a pivotal role for this gene in normal brain development. In this study, the toxic effect of propofol may be related to disruption of the critical physiological balance of Bcl2l1, leading to induction of caspase 3 levels and loss of astrocytes through increased apoptosis. Interestingly, rno-miR-665 and propofol used singly or in combination have been shown by flow cytometry to significantly increase the necrotic rate of immature hippocampal astrocytes. Necrosis was considered an unregulated event until Yuan and colleagues (Hitomi et al., 2008; Christofferson and Yuan, 2010) demonstrated that, similar to apoptosis, necrosis is a vital cellular death mechanism regulated by an extensive network of genes, and that neurotoxicity was no exception. The programmed necrosis pathway mediates the process that has been termed “necroptosis” and has been verified through numerous lines of evidence (Golstein and Kroemer, 2007; Kroemer et al., 2009). Bmf was identified as the core component of necroptosis (Hitomi et al., 2008), which functions as the inhibitor of antiapoptotic proteins Bcl-2/Bcl-xl and the promoter of necrosis, according to the particular mode of mitohondrial transformation (Puthalakath et al., 2001). Consequently, this pathway might underlie the mechanism by which propofol and rno-miR-665 elevate apoptosis and necrosis of immature astrocytes, as was seen in this study.
In addition to GO and KEGG analysis, we used the bioinformatic tool CytoScape (Smoot et al., 2010) to assemble a putative regulatory network of CNS development-associated miRNAs with the aim of identifying downstream pathways affected by these miRNAs (Supplementary Fig. S3). This open access software platform is helpful in elucidating the miRNAs and experimentally defined up- and downregulated genes in immature astrocytes during the peak period of CNS development.
The drawbacks of our study include its in vitro nature, a single route of drug delivery, and an inability to directly extrapolate our results to humans due to substantial differences in rodent and human physiology. Future studies will address the functional consequences of the modulation by propofol of miRNA expression in astrocytes, and they will extend our analysis to astrocytes in other areas of the brain, as well as to microglia and oligodendrocytes.
Conclusion
Although the clinical significance of our data remains to be determined, our miRNA profiling analysis of immature propofol-treated rat astrocytes is an important step toward the development of safer anesthetic strategies in pediatric medicine. Further studies are needed to evaluate the possible use of miRNAs as biomarkers in cognitive dysfunction and related pathophysiology.
Footnotes
Disclosure Statement
No competing financial interests exist.
References
Supplementary Material
Please find the following supplemental material available below.
For Open Access articles published under a Creative Commons License, all supplemental material carries the same license as the article it is associated with.
For non-Open Access articles published, all supplemental material carries a non-exclusive license, and permission requests for re-use of supplemental material or any part of supplemental material shall be sent directly to the copyright owner as specified in the copyright notice associated with the article.