
Abstract
The phosphatidylethanolamine-binding protein (PEBP) gene family exists in all eukaryote kingdoms, with three subfamilies: FT (FLOWERING LOCUS T)-like, TFL1 (TERMINAL FLOWER 1)-like, and MFT (MOTHER OF FT AND TFL1)-like. FT genes promote flowering, TFL1 genes act as a repressor of the floral transition, and MFT genes have functions in flowering promotion and regulating seed germination. We identified and characterized orthologs of the Arabidopsis FT/TFL1 gene family in petunia to elucidate their expression patterns and evolution. Thirteen FT/TFL1-like genes were isolated from petunia, with the five FT-like genes mainly expressed in leaves. The circadian rhythms of five FT-like genes and PhCO (petunia CONSTANS ortholog) were figured out. The expression of PhFT1 was contrary to that of PhFT2, PhFT3, PhFT4, and PhFT5. PhCO had a circadian clock different from Arabidopsis CO, but coincided with PhFT1; it decreased in daytime and accumulated at night. Two of the FT-like genes with differential circadian rhythm and higher expression levels, PhFT1 and PhFT4, were used to transform Arabidopsis. Eventually, overexpressing PhFT1 strongly delayed flowering, whereas overexpression of PhFT4 produced extremely early-flowering phenotype. Different from previous reports, PhTFL1a, PhTFL1b, and PhTFL1c were relatively highly expressed in roots. Taken together, this study demonstrates that petunia FT-like genes, like FT, are able to respond to photoperiod. The expression pattern of FT/TFL1 gene family in petunia contributes to a new insight into the functional evolution of this gene family.
Introduction
The transition from the vegetative phase to the reproductive phase plays crucial roles in plant development. The initiation of flowering in plants is controlled by endogenous and environmental signals. Several flowering pathways including the photoperiod, vernalization, ambient temperature, plant hormone, and autonomous pathways coordinate flowering time to optimize plant adaptation and reproductive success (Blazquez et al., 2003; Mutasa-Gottgens and Hedden, 2009; Amasino, 2010; Andres and Coupland, 2012). Two important genes downstream of these pathways are FT (FLOWERING LOCUS T) and TFL1 (TERMINAL FLOWER 1) (Wickland and Hanzawa, 2015). FT and TFL1 encode proteins belonging to the phosphatidylethanolamine-binding protein (PEBP) family, which is an ancient protein family found across the biosphere and plays important roles in regulating flowering in plants (Banfield et al., 1998; Hengst et al., 2001).
In Arabidopsis, the FT/TFL1 family includes six members: FT, TSF (TWIN SISTER OF FT), TFL1, BFT (BROTHER OF FT AND TFL1), ATC (ARABIDOPSIS THALIANA CENTRORADIALIS HOMOLOG), and MFT (MOTHER OF FT AND TFL1) (Kobayashi et al., 1999). Phylogenetic analysis has resolved three major clades within this family, namely FT-like, TFL1-like, and MFT-like (Danilevskaya et al., 2008). In general, FT-like genes (FT and TSF) promote flowering, whereas TFL1-like genes (TFL1, BFT, and ATC) inhibit flowering (Bradley et al., 1997; Kardailsky et al., 1999; Kobayashi et al., 1999).
FT is activated by the transcription factor CO (CONSTANS) in leaves, and then FT protein moves from the leaves through the phloem to the shoot apical meristem (SAM) where it binds to the bZIP transcription factor FD to form the FT-FD complex, which regulates the meristem identity genes, such as AP1 (APETALA1) and FUL (FRUITFULL), resulting in flowering induction (Abe et al., 2005; Notaguchi et al., 2008). TSF is similar to FT in terms of protein sequence, induction by CO, binding to FD, and promotion of flowering (Yamaguchi et al., 2005; Jang et al., 2009). In addition to regulating FT, CO is also suggested to induce the expression of TFL1, which represses the expression of several genes downstream of FT such as LFY (LEAFY) and AP1 in the inflorescence meristem (IM) and SAM, perhaps by weakly interacting with FD, and so controls IM identity and delays flowering (Bradley et al., 1997; Ratcliffe et al., 1998, 1999; Hanano and Goto, 2011).
BFT also shares high sequence similarity with FT but functions like TFL1, such as inhibiting flowering and maintaining indeterminate growth of the inflorescence (Ratcliffe et al., 1998; Hanano and Goto, 2011). ATC is mainly expressed in vascular tissues of petioles, hypocotyls, and roots, and acts as a systemic floral inhibitor under short day (SD) conditions (Huang et al., 2012). MFT seems to not only function as a flowering activator but also plays a critical role in regulating seed germination through the abscisic acid and gibberellic acid signaling pathways (Yoo et al., 2004; Xi et al., 2010).
At present, most studies have shown that FT homologs induce flowering and TFL1 homologs repress flowering in angiosperms including perennial woody species (Wickland and Hanzawa, 2015).
However, recent studies also found that genes from FT/TFL1 family have other functions in plant development, except for regulating flowering. In grapevine, TFL1A controls branching and fruit density (Wickland and Hanzawa, 2015). In Norway spruce, PaTFL1 participates in cone development, meristem inhibition, and needle formation; PaTFL2 functions in bud set and growth repression (Karlgren et al., 2011, 2013; Klintenas et al., 2012). As for poplar, PtFT1 and PtFT2 play roles in growth cessation and promotion of vegetative growth (Shen et al., 2011). The onion FT homologs AcFT1 and AcFT4 control bulb formation (Lee et al., 2013) and potato FT homolog StSP6A controls tuberization (Navarro et al., 2011). Petunia, as a facultative long day (LD,16/8 h, light/dark)) plant, is a good model for the study on gene function with many advantages, such as easy to cultivate and high transformation efficiency.
However, the analysis and function of this family in petunia have never been reported before. A comprehensive functional analysis of this family in petunia may enable us to understand the expression of PEBP family in petunia and establish a foundation for further study.
In this study, we isolated 13 genes from petunia that are highly similar to Arabidopsis FT/TFL1 family genes. To figure out the mechanism for floral bud formation and transition from vegetative growth to reproductive growth in petunia, we analyzed the expression patterns of petunia FT/TFL1 genes in different tissues and organs. The circadian rhythms of five FT-like genes were analyzed and two of the FT-like genes were transformed to Arabidopsis to identify their functions.
Materials and Methods
Plant materials and growth conditions
Petunia axillaris, Petunia inflata, Petunia hybrida line “W115 (Mitchell Diploid)”, and Arabidopsis thaliana Col-0 were used in this study. Their seeds were sown in pots with a commercial planting soil and incubated in the climate incubator with temperature maintained at 25°C ± 2°C under a photoperiod regime of 16 h light and 8 h dark. The light intensity of the climate incubator was 12,000 lux. After germination in the climate incubator, the petunia plants were grown in green house at the Huazhong Agriculture University, Wuhan, China, from March to July. The W115 plants, used for circadian rhythms, stayed in the climate incubator already described for 6 weeks. Arabidopsis plants were grown under LD conditions (16/8 h, light/dark) in a growth chamber with temperature controlled at 21–22°C.
For real-time quantitative PCR (qRT-PCR), various tissues including roots, stems, leaves, axillary bud, inflorescence, flower buds (0.5 cm), fruits (20 days after pollination), and seeds were collected from petunia plants. To get the circadian rhythms of FT-like genes, we extracted RNA from the leaves of 6-week-old W115 seedlings grown in LD condition (16 h light). All samples were quickly frozen in liquid nitrogen and stored at −80°C until used. Escherichia coli strain DH5α was used to carry coding sequences of petunia FT/TFL1 genes. Agrobacterium tumefaciens strain GV3101 was used for transformation of Arabidopsis.
Identification and cloning of Petunia FT/TFL1 genes
The FT/TFL1 family members of Petunia were identified by BLAST and tBLASTn searching the genome databases of P. axillaris and P. inflata in Sol Genomics Network (
Total RNA was extracted from samples of diverse tissues including roots, stems, leaves, axillary buds, inflorescences, flower buds, fruits, and seeds. Total RNA was isolated using a PLANTpure RNA Extraction kit (Aidlab, China) following the manufacturer's instructions. RNA of roots, stems, fruits, and seeds was extracted using the CTAB method (Li et al., 2008). RNA quality and concentration were checked on a 1% agarose gel and by NanoDrop (Thermo Fisher Scientific, Finland).
Two micrograms RNA was used in process of cDNA synthesis (Takara, Japan), the products were diluted 1:20, and 1 μL cDNA dilutent was used in PCR with 2× High-Fidelity Master Mix DNA Polymerase (Tsingke, China). The PCR was for 4 min at 94°C, followed by 32–35 cycles at 94°C for 30 s, 55–60°C for 30 s, 72°C for 1–3 min, and 72°C for 10 min for a final extension. The PCR products were purified with Axyprep DNA Gel Extraction Kit (Axygen), then inserted into pMD18-T (Takara) and transformed into E. coli DH5α, and for every gene, three positive clones were selected randomly for sequencing analysis (Augct, China).
Gene structure analysis
To analyze the genomic structure of these genes, we used the coding sequences of petunia FT/TFL1 genes to search the genomic DNA (gDNA) sequences from P. inflata and P. axillaris (Bombarely et al., 2016). We used Gene Structure Display Server 2.0 to predict the exon–intron structures and locations in the downloaded genomic sequences of each FT/TFL1 family genes.
Multiple sequence alignment and phylogenetic analysis
The amino acid sequences of the FT/TFL1 proteins in 7 plant species representing different evolutionary clades were downloaded from NCBI or Phytozome, including 2 Selaginella moellendorfii protein sequences, 4 Physcomitrella patens protein sequences, 8 Picea abies protein sequences, 19 Sorghum bicolor protein sequences, 6 Arabidopsis protein sequences, 12 tomato protein sequences, and 13 tobacco protein sequences. The sequence ID of used proteins is showed in Fig. 1.

Phylogenetic analysis of the FT/TFL1 protein sequences from petunia W115 and other species. Parameters for phylogenetic tree construction: ML, JTT model, gamma-distributed rates, partial deletion (95%) of gaps, bootstrap = 100. FT, FLOWERING LOCUS T; JTT, Jones–Taylor–Thornton; ML, maximum likelihood; TFL1, TERMINAL FLOWER 1. Color images are available online.
Amino acid sequences were aligned by using ClustalW software with Gonnet protein weight matrix (Thompson et al., 1997). To determine the amino acid identities, sequences from the alignment were pairwise compared by using DNAMAN V6 software. A maximum likelihood phylogenetic tree of the complete amino acid sequences was generated with MEGA 5.0 (Tamura et al., 2011), using the Jones–Taylor–Thornton model with gamma-distributed rates, partial deletion (95%) of gaps, and 100 bootstrap replicates. Tree was visualized with iTOL.
Gene expression analysis by quantitative RT-PCR
Total RNA was extracted from tissues already mentioned and the first-strand cDNA was synthesized with a PrimeScript® RT Reagent Kit with gDNA Eraser (Takara, Dalian, China) according to the manufacturer's instructions. Transcript levels were then determined by qRT-PCR using the 7500 Real-Time PCR System (Applied Biosystems, Foster City, CA) and SYBR® Premix Ex Taq™ II (TaKaRa, Dalin, China). Gene-specific primers for the qRT-PCR (Supplementary Table S2) were designed by the Primer 5.0 software to amplify products between 90 and 300 bp in size.
The reactions were prepared in the solution with total volume of 10 μL, which contained 1 μL of template (∼50 ng), 0.2 μL of each amplification primer (10 μM), 5 μL of 2× SYBR Premix Ex Taq, and 3.6 μL of dd H2O. The following standard thermal profile was used for all PCRs: 95°C for 2 min, 40 cycles of 95°C for 5 s, 60°C for 34 s, 95°C for 15 s, 60°C for 1 min, and 95°C for 15 s. Three biological replicates were analyzed. Petunia EF1α (Mallona et al., 2010) was used as the endogenous control for analyzing the expression patterns of FT/TFL1 gene family and PhCO (petunia ortholog of Arabidopsis CONSTANS).
The data were processed by the instrument onboard software Sequence Detector Version 1.3.1 (PE Applied Biosystems) and were transferred to a custom-designed Microsoft Excel macro for further analysis. Relative expression levels of the target genes were determined by the Relative Expression Software Tool (Multiple Condition Solver REST-MCS v2).
Vector construction and Arabidopsis transformation
The coding sequences of PhFT1 and PhFT4 were isolated by PCR, and the products were cloned into the pMD18-T (Takara). 35S::PhFT1 and 35S::PhFT4 were constructed with pCAMBIA2300 vector. We used SalI and EcoRI (Takara) restriction endonucleases to digest pMD18-T carrying PhFT1 or PhFT4 and pCAMBIA2300. T4 DNA ligase (Takara) was used for ligation reaction. Finally, we transformed 35S::PhFT1 and 35S::PhFT4 into Agrobacterium tumefaciens GV3101 by the electroporation method. GV3101 containing 35S::PhFT1 and 35S::PhFT4 was used to transform the Arabidopsis Columbia (Col-0) ecotype using the floral dip method.
After the following surface sterilization, 95% (v/v) ethanol for 2 min, 8% (v/v) sodium hypochlorite solution for 4 min, and then rinsed three times in sterile water, seeds carrying the 35S::PhFT1 or 35S::PhFT4 were germinated on MS plates supplemented with 50 μg/mL kanamycin sulfate plus 25 μg/mL cefotaxime sodium salt (Biosharp, China). The resistant seedlings were transplanted to pots with a commercial planting soil after 15 days on MS plates. The plants were incubated in the climate incubator already described.
Phenotype and transgene expression analysis
The T2 transgenic lines with kanamycin resistance that fitted a segregation ratio of 3:1 were selected to record flowering time. Flowering time was obtained by counting the number of rosette leaves at the appearance of the first floral bud in primary inflorescences. The plants were grown in the climate incubator already described.
To analyze the expression of the transgene in Arabidopsis, we extracted RNA of seedlings (14 days) from both transgenic plants and wild type, then reverse transcribed the RNA with the same reagent kit already described. Arabidopsis EF1α was used as the reference gene and primers used for the detection of PhFT1 and PhFT4 expression levels are listed in Supplementary Table S2.
Statistical analysis was carried out through analysis of variance in IBM SPSS Statistics 22 based on Duncan's multiple range test (p < 0.05).
Results
Identification of Petunia FT/TFL1 genes
To identify potential FT/TFL1-like genes in petunia, protein sequences of FT/TFL1 gene family of Arabidopsis, tobacco, and tomato were used to perform a BLAST survey against the genome database of two Petunia species: P. inflata * and P. axillaris ** (Bombarely et al., 2016) and their transcriptome.
Altogether, 15 genes in FT/TFL1 family were identified in each species (Supplementary Table S3,S4). cDNA reverse transcribed from W115 RNA mixture was used as the template for cloning the full-length FT/TFL1 genes by PCR amplification. As a result, 13 FT/TFL1 genes were isolated, which we named as PhFT1, PhFT2, PhFT3, PhFT4, PhFT5; PhTFL1a, PhTFL1b, PhTFL1c, PhTFL1d, PhBFT1, PhBFT2; PhMFT1, and PhMFT2 (Table 1), according to the closest homologs of genes in Arabidopsis. Two more FT-like genes that were found in the genome database, we named them PiFT6/PaFT6 and PiFT7/PaFT7 temporarily, could not be cloned successfully from W115, although the PiFT7/PaFT7 ortholog could be found in transcriptome data of P. hybrida line “W115” (Supplementary Table S5).
Nomenclature of FT/TFL1 Genes Cloned by Real-Time PCR in Petunia hybrida “W115”
CDS, coding sequence.
Phylogenetic analysis of petunia FT/TFL1 genes
To analyze the phylogenetic relationships of the petunia FT/TFL1 genes and their homologs in other species, we selected FT/TFL1 genes from plant species representing different evolutionary clades: 2 genes in S. moellendorfii, 4 genes in P. patens, 8 genes in P. abies, 19 genes in S. bicolor, 6 genes in Arabidopsis, 12 genes in tomato, and 13 genes in tobacco. A data set of 77 protein sequences including the 13 petunia proteins was built up to construct the phylogenetic tree. As a result, petunia FT/TFL1 proteins were divided into three clades: PhFT1, PhFT2, PhFT3, PhFT4, and PhFT5 belong to FT-like subfamily; PhBFT1, PhBFT2, PhTFL1a, PhTFL1b, PhTFL1c, and PhTFL1d belong to TFL1-like subfamily; PhMFT1 and PhMFT2 belong to MFT-like subfamily (Fig. 1).
FT-like subfamily contains 2 P. abies members (PaFTL1 and PaFTL2), 13 S. bicolor members (SbFT-like, SbHd3A, SbRFT1, SbTSF, SbFTL2, SbFTL3, SbFTL5, SbFTL6, SbFTL8, SbFTL9, SbFTL11, SbFTL12, and SbFTL15), 2 Arabidopsis members (FT and TSF), 4 tomato members (SFT, SP5G, SP5G1, and SP5G2), 5 tobacco members (NsFT2, NsFT3, NsFTL5, NsFTL6, and NsFTL7), and 5 petunia FT-like proteins.
TFL1-like subfamily contains 4 P. abies members (PaFTL3-6), 4 S. bicolor members (SbFTL7, SbFTL10, SbFTL13, and SbFTL14), 3 Arabidopsis members (TFL1, ATC, and BFT), 5 tomato members (SP, SP9D, SlyCEN1.1, SlyCEN1.2, and SlyCEN1.3), 6 tobacco members (NsCET1, NsCET2, NsCET5, NsCET9, NsCET10, and NsCEN4), and 6 petunia proteins.
MFT-like subfamily contains four P. patens members (PpMFT1-4), two S. moellendorfii members (SmMFT1 and SmMFT2), two P. abies members (PaMFT1 and PaMFT2), two S. bicolor members (SbFTL1 and SbFTL4), one Arabidopsis member (MFT), two tomato members (SlyMFT and SP2G), two tobacco members (NsMFTL1 and NsMFTL2), and two petunia members.
Gene structure and sequence feature of Petunia FT/TFL1 genes
Comparison of the cDNA and gDNA sequences in P. inflata and P. axillaris genome database revealed that all 13 genes comprised 4 exons with 3 introns at conserved positions identical to FT/TFL1 genes in other species (Bradley et al., 1997; Guo et al., 2010; Harig et al., 2012; Navarro et al., 2015); however, the introns differed in length. In two species, the full length varied from 848 bp (PaBFT2) to 12,011 bp (PaFT5), and exon 1 varied from 195 bp (PhFT3 and PhMFT2) to 222 bp (PhMFT1), and exon 4 changed from 218 bp (PhTFL1b, PhTFL1c, PhTFL1d, PhBFT1, and PhBFT2) to 233 bp (PhFT2). Exons 2 and 3 were conserved in length with 62 bp and 41 bp, respectively. The exon–intron structures of 13 P. inflata and P. axillaris FT/TFL1 genes are displayed in Figure 2.
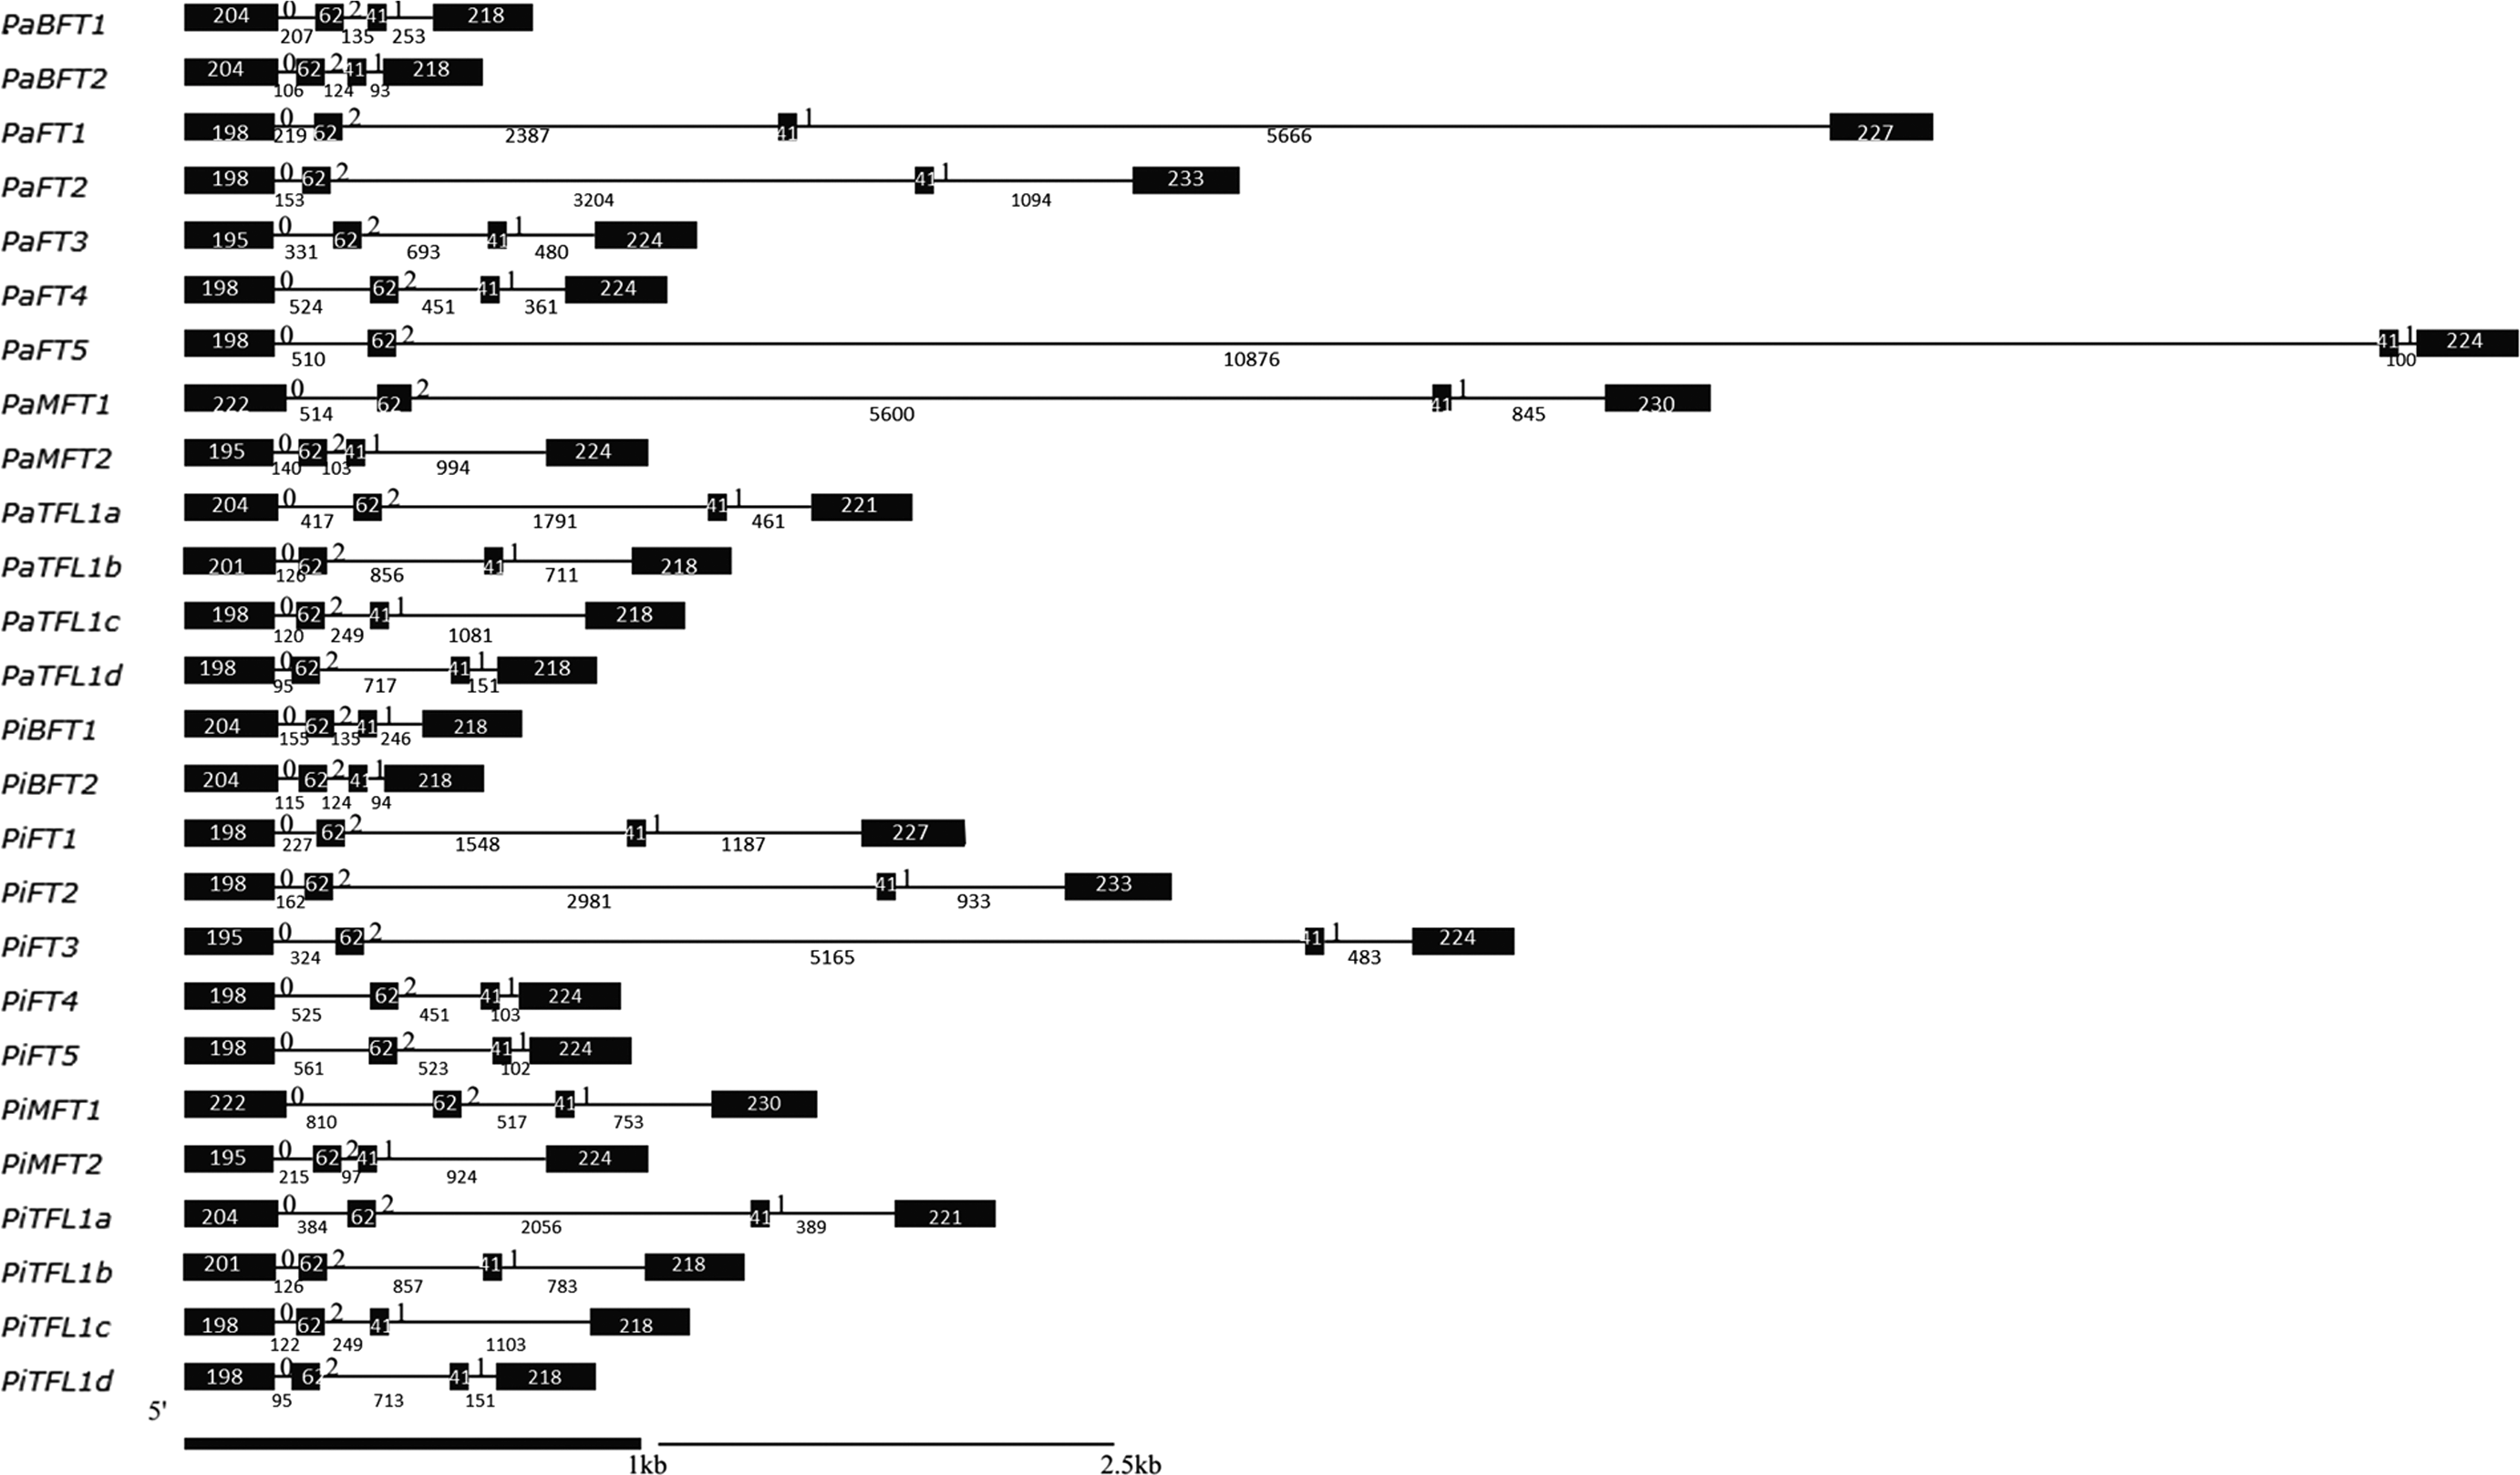
Genomic organization of the FT/TFL1 genes in Pa and Pi. Black boxes represent exons and lines represent introns. The 0, 1, and 2 above the line represent intron phases. Bold line and regular line indicate the scale of exon and intron, respectively. Numbers under the line indicate the length of exons and introns in base pairs. Pa, Petunia axillaris; Pi, Petunia inflata.
Sequence comparison of FT/TFL1 proteins between petunia and Arabidopsis (Fig. 3) indicated that the identity percentage of PhFT1, PhFT2, PhFT3, PhFT4, and PhFT5 to FT is 71%, 75%, 73%, 73%, and 72%, respectively; that of PhTFL1a, PhTFL1b, PhTFL1c, and PhTFL1d to TFL1 is 66%, 67%, 72%, and 72%, respectively; that of PhBFT1 and PhBFT2 to BFT is 66% and 68%, respectively; and that of PhMFT1 and PhMFT2 to MFT is 54% and 72%, respectively.
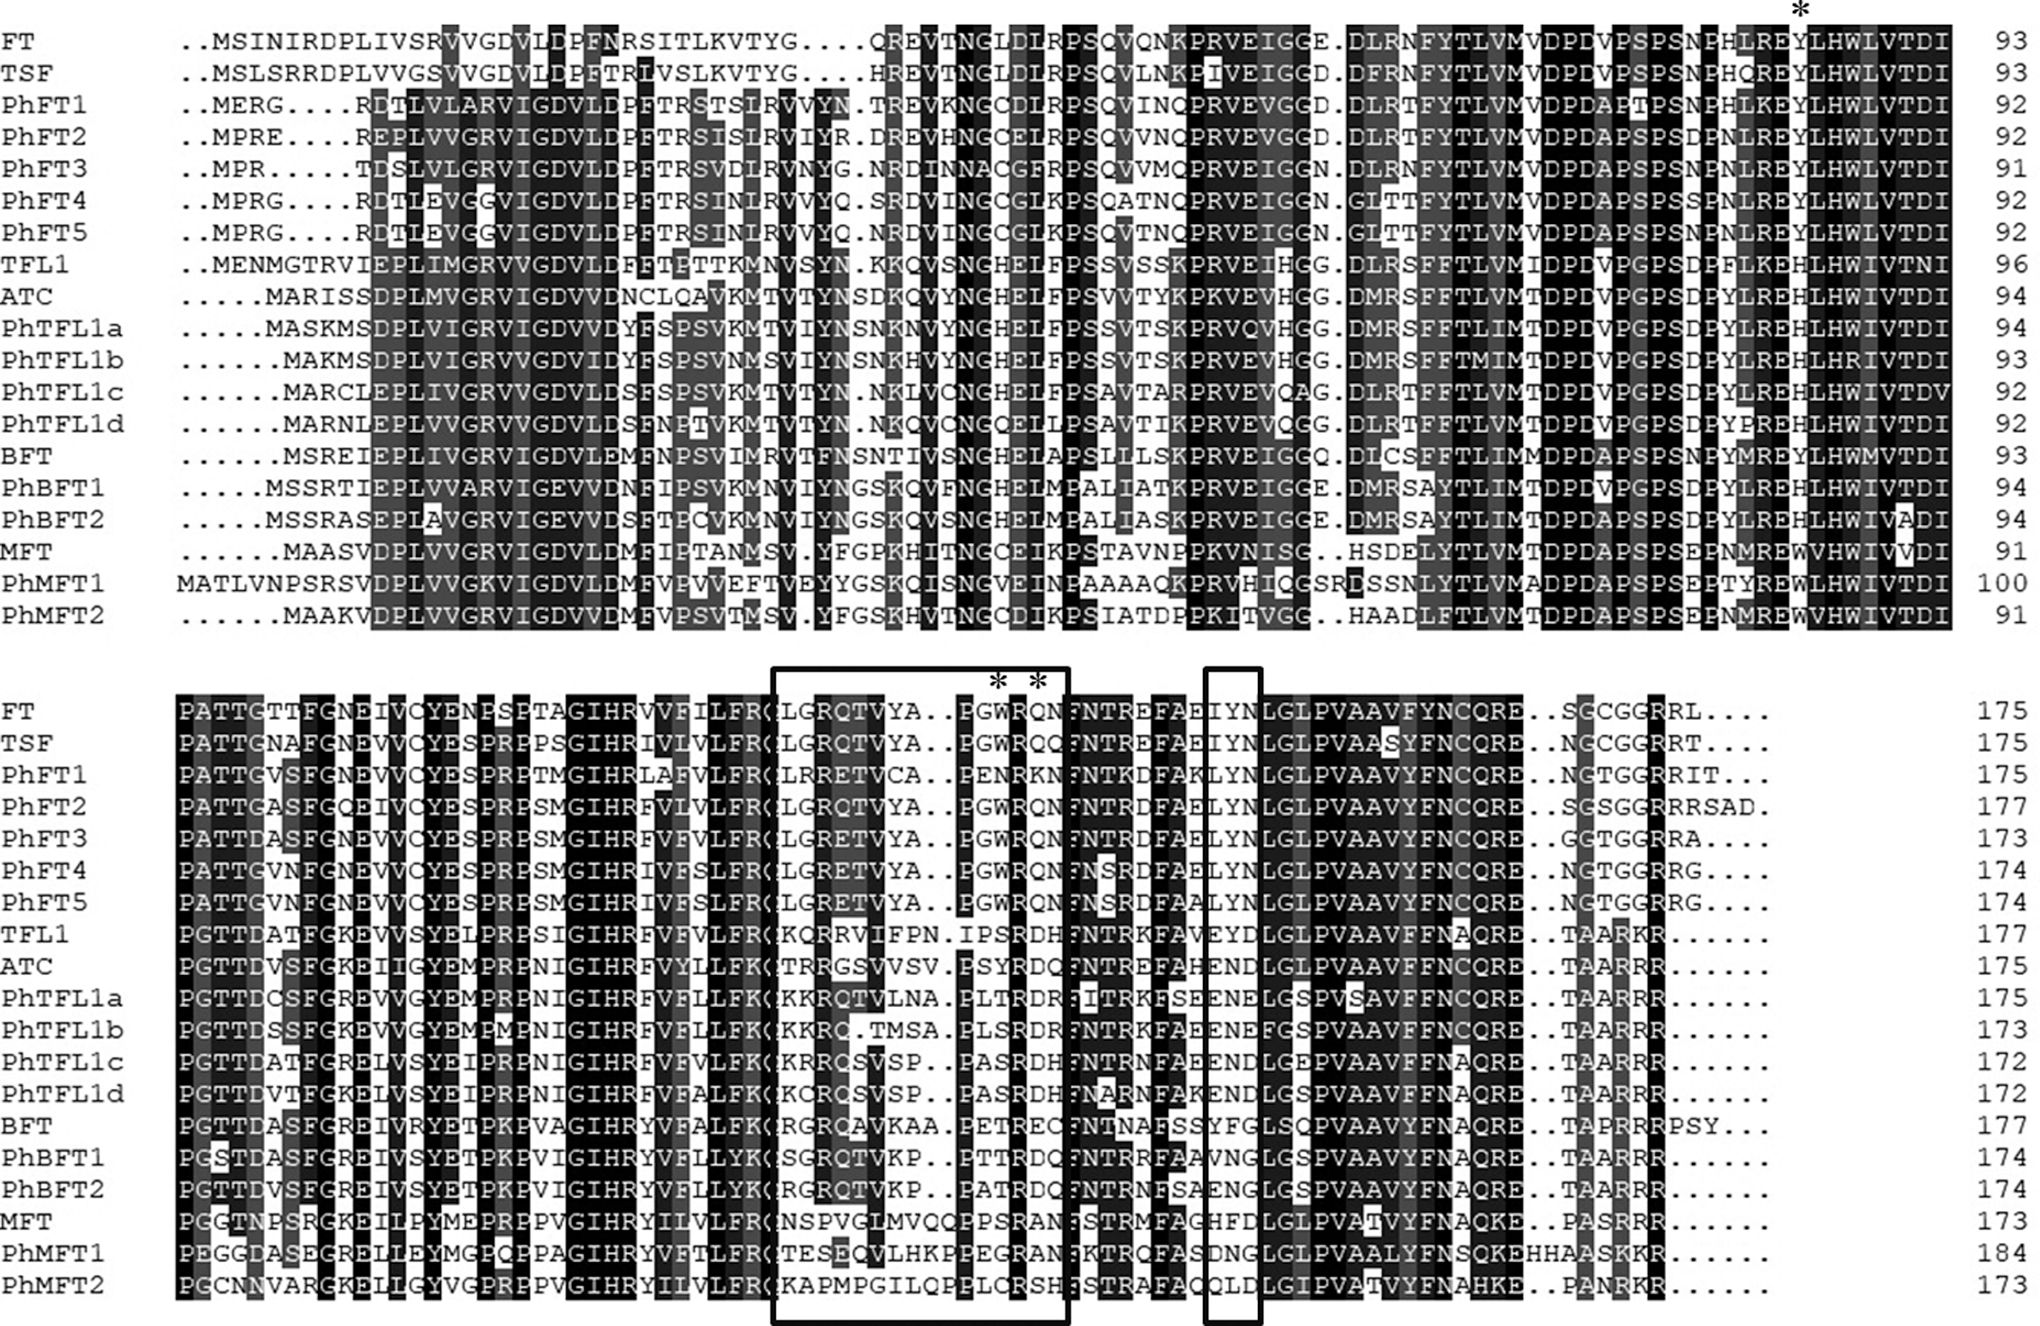
Alignments of the amino acid sequences of the FT/TFL1 proteins in petunia and Arabidopsis. A black background indicates a homology level of 100% and a gray background indicates a homology level between 50% and 100%. The 14-amino acid stretch and the LYN triad identified by Ahn et al. (2006) as diagnostic of true FT genes are indicated in boxes. The asterisks indicate the Tyr85/His88 and Gln140/Asp144 residues distinguishing FT and TFL1 activity (Hanzawa et al., 2005).
PhFT1, PhFT2, PhFT3, PhFT4, and PhFT5 all showed the typical features of the FT-like protein subfamily. This includes the conservation of Tyr85 and Gln140. A Tyr residue in the FT subfamily (Tyr85 in FT) and His residue in the TFL1 subfamily (His88 in TFL1) are highly conserved and indispensable for floral promotion and repression, respectively (Hanzawa et al., 2005). In petunia FT-like proteins, the corresponding residues of Tyr85 in FT were Tyr84 in PhFT1/2/4/5 and Tyr83 in PhFT3, whereas those in petunia TFL1-like proteins were His (Fig. 3). PhBFT1, PhBFT2, PhTFL1a, PhTFL1b, PhTFL1c, and PhTFL1d were classified with Arabidopsis TFL1, ATC, and BFT. All of them bear conserved residues His88 and Asp144 in positions similar to TFL1 and BFT (His85 and Asp140 in PhBFT1 and PhBFT2, His85 and Asp141 in PhTFL1a, and His84 and Asp140 in PhTFL1b, PhTFL1c, and PhTFL1d) (Fig. 3).
Expression patterns of petunia FT/TFL1 genes
To figure out the functions of FT/TFL1 genes in petunia, we used RT-PCR to illustrate their temporal and spatial expression patterns in different tissues and organs.
As a result, PhFT1 was expressed mainly in the leaves and seedlings (4 weeks), whereas low expression was also detected in several reproductive organs, such as the flower buds, inflorescences, and fruits (Fig. 4A). PhFT2 was strongly expressed in stems, almost 10 times of the expression level in leaves, but its expression in leaves was nearly equal to that of PhFT1; PhFT2 was also expressed in a very low level in roots, flower buds, and inflorescences (Fig. 4B). The expression of PhFT3 was very weak in all the tested organs, whether vegetative or reproductive organs (Fig. 4C). PhFT4 was mainly expressed in leaves, followed by low expression in seedlings, inflorescences, and flower buds (Fig. 4D). The expression of PhFT5 was relatively high in leaves and seedlings, with a little in flower buds and stems (Fig. 4E).
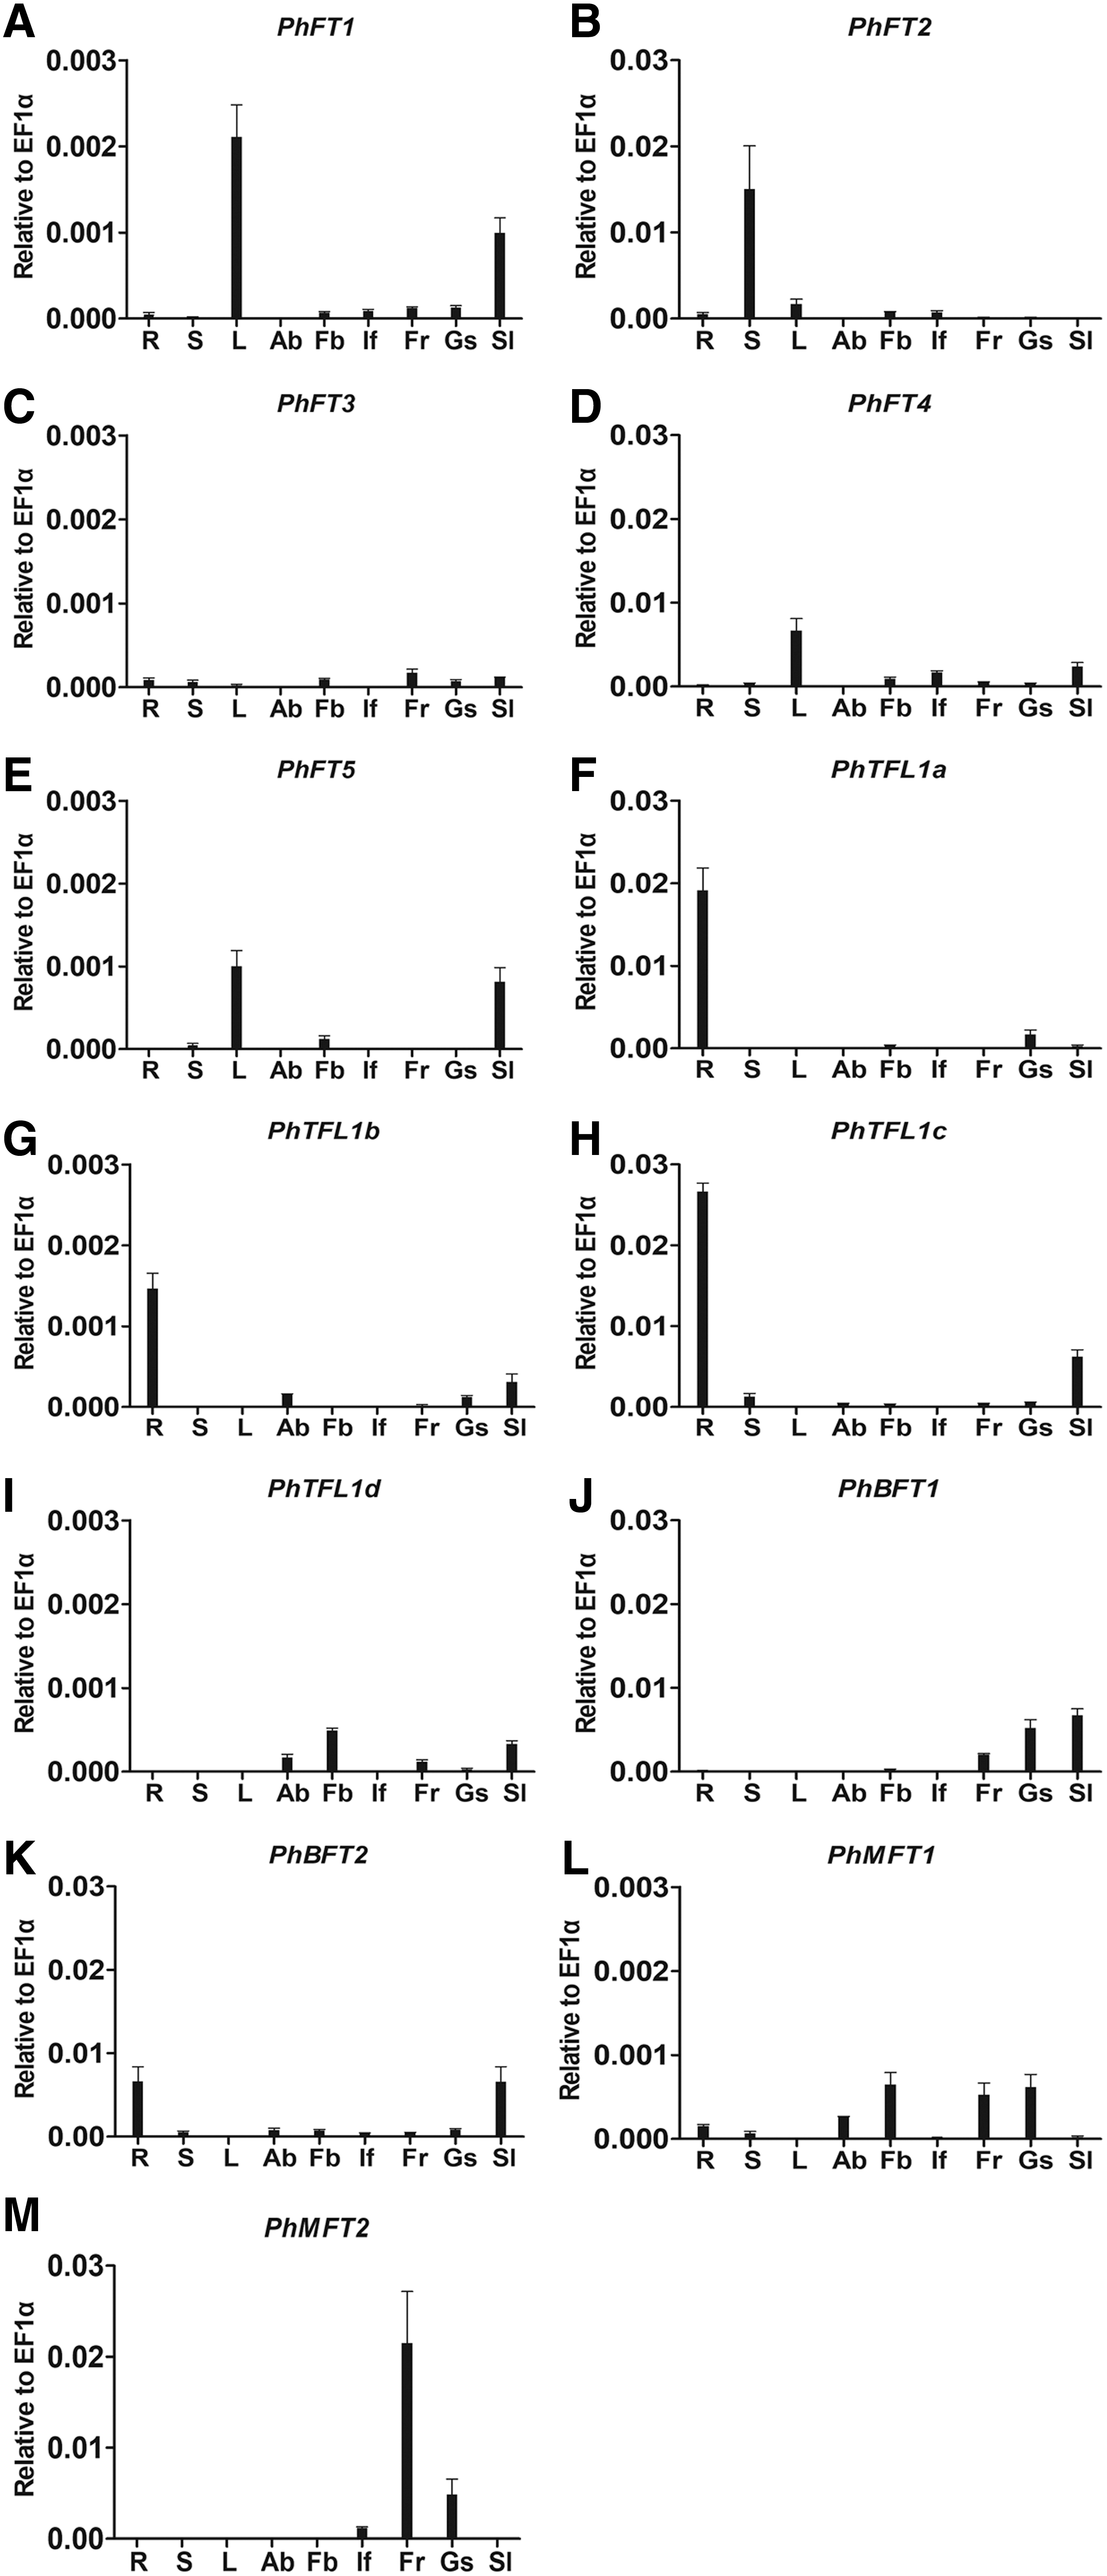
Expression patterns of petunia FT/TFL1 genes in various organs.
In TFL1-like subfamily, PhTFL1a-c showed similar expression characteristics, mainly expressed in roots. In other organs, however, they showed differential patterns. Besides strong expression in roots, PhTFL1a was expressed weakly in seeds (Fig. 4F), whereas PhTFL1c was expressed in seedlings (4 weeks) and a little in stems (Fig. 4H). The expression level of PhTFL1b and PhTFL1d was relatively lower in all tissues, compared with PhTFL1a and PhTFL1c. PhTFL1b was mainly expressed in roots and seedlings; PhTFL1d was expressed in flower buds, seedlings, axillary buds, and fruits (Fig. 4G, I). PhBFT1 and PhBFT2 exhibited different expression patterns but they both reached their highest expression in the seedlings. PhBFT1 was expressed in fruits, seeds, and seedlings; PhBFT2 was significantly expressed in roots and seedlings, similar to the pattern of PhTFL1c (Fig. 4J, K).
PhMFT1 was expressed in most organs, among them, fruits, seeds, and flower buds were the higher organs (Fig. 4L). PhMFT2 reached its highest expression level in the fruits, and a little bit lower in seeds than it in the fruits (Fig. 4M).
Diurnal rhythmic expression patterns of FT-like genes under LD conditions
To investigate the diurnal rhythm in the five PhFT genes and PhCO, we examined their diurnal expression patterns within 48 h (two LD diurnal cycles). As the petunia FT-like genes were expressed mainly in leaf tissue, except for PhFT2, which was expressed strikingly in stem (Fig. 4), we extracted RNA from petunia leaves of 6-week-old seedlings grown in the growth chamber under LD condition (16 h light). Our results revealed that the highest transcript level of PhFT1 was observed at 4 h and 28 h and the lowest level was observed at 16 h and 40 h (Fig. 5A), which was different from the other PhFT genes. The peak level of PhCO was at 4 h and 28 h (same as PhFT1) and the lowest level was at 12 h and 36 h (Fig. 5F). PhFT2-5 showed the highest expression level at 12 h and 36 h and then decreased during the dusk and night (Fig. 5B–E). The expression levels of PhFT1, PhFT4, and PhCO were 10 times higher than those of PhFT2, PhFT3, and PhFT5, among them PhFT2 was the lowest.

Diurnal expression patterns of petunia PhFT-like genes under LD condition.
Overexpression of PhFT1 and PhFT4 affected flowering in Arabidopsis
PhFT1 and PhFT4 showed different mode of circadian rhythm and higher gene expression in leaves, so we constructed expression vector 35S::PhFT1 and 35S::PhFT4, and then transferred to Arabidopsis to verify their functions. Sixteen T1 35S::PhFT1 and 20 T1 35S::PhFT4 individual transgenic plants were obtained by kanamycin-resistance screening. All transgenic T1 plants of 35S::PhFT1 were used to illustrate flowering time and phenotype. For 35S::PhFT4 transgenic plants, 3 individual T2 lines with a 3:1 separation ratio of kanamycin resistance were selected, and 10 individual plants from each line, respectively, were planted for phenotypic observation and data statistics.
The data from 10 T1 transgenic individuals of 35S::PhFT1, T2 progeny (n = 10) from 3 independent lines of 35S::PhFT4, and 10 plants of wild type were recorded and analyzed by SPSS software (Duncan test, p < 0.05).
Under LD condition, wild-type plants initiated flowering when 14.1 ± 1.4 rosette leaves were produced (Fig. 6E); all individuals with the 35S::PhFT1 transgene showed the late flowering phenotype (Fig. 6A), among them, two plants did not produce any flowers and maintained vegetative inflorescence status all the time, with deeper serrated cauline leaves and thicker stems (Fig. 6B, C). The number of rosette leaves in flowering plants was 41.9 ± 24 with significant differences (p < 0.01) compared with wild type (Fig. 6E). The lines carrying 35S::PhFT4 exhibited early flowering phenotype with average 4.3 ± 0.6 rosette leaves that showed significant difference (p < 0.01) from the wild type (Fig. 6D, E). RT-PCR analysis verified that the expression levels of the transgenes were directly related to the strength of phenotype (Fig. 6F).
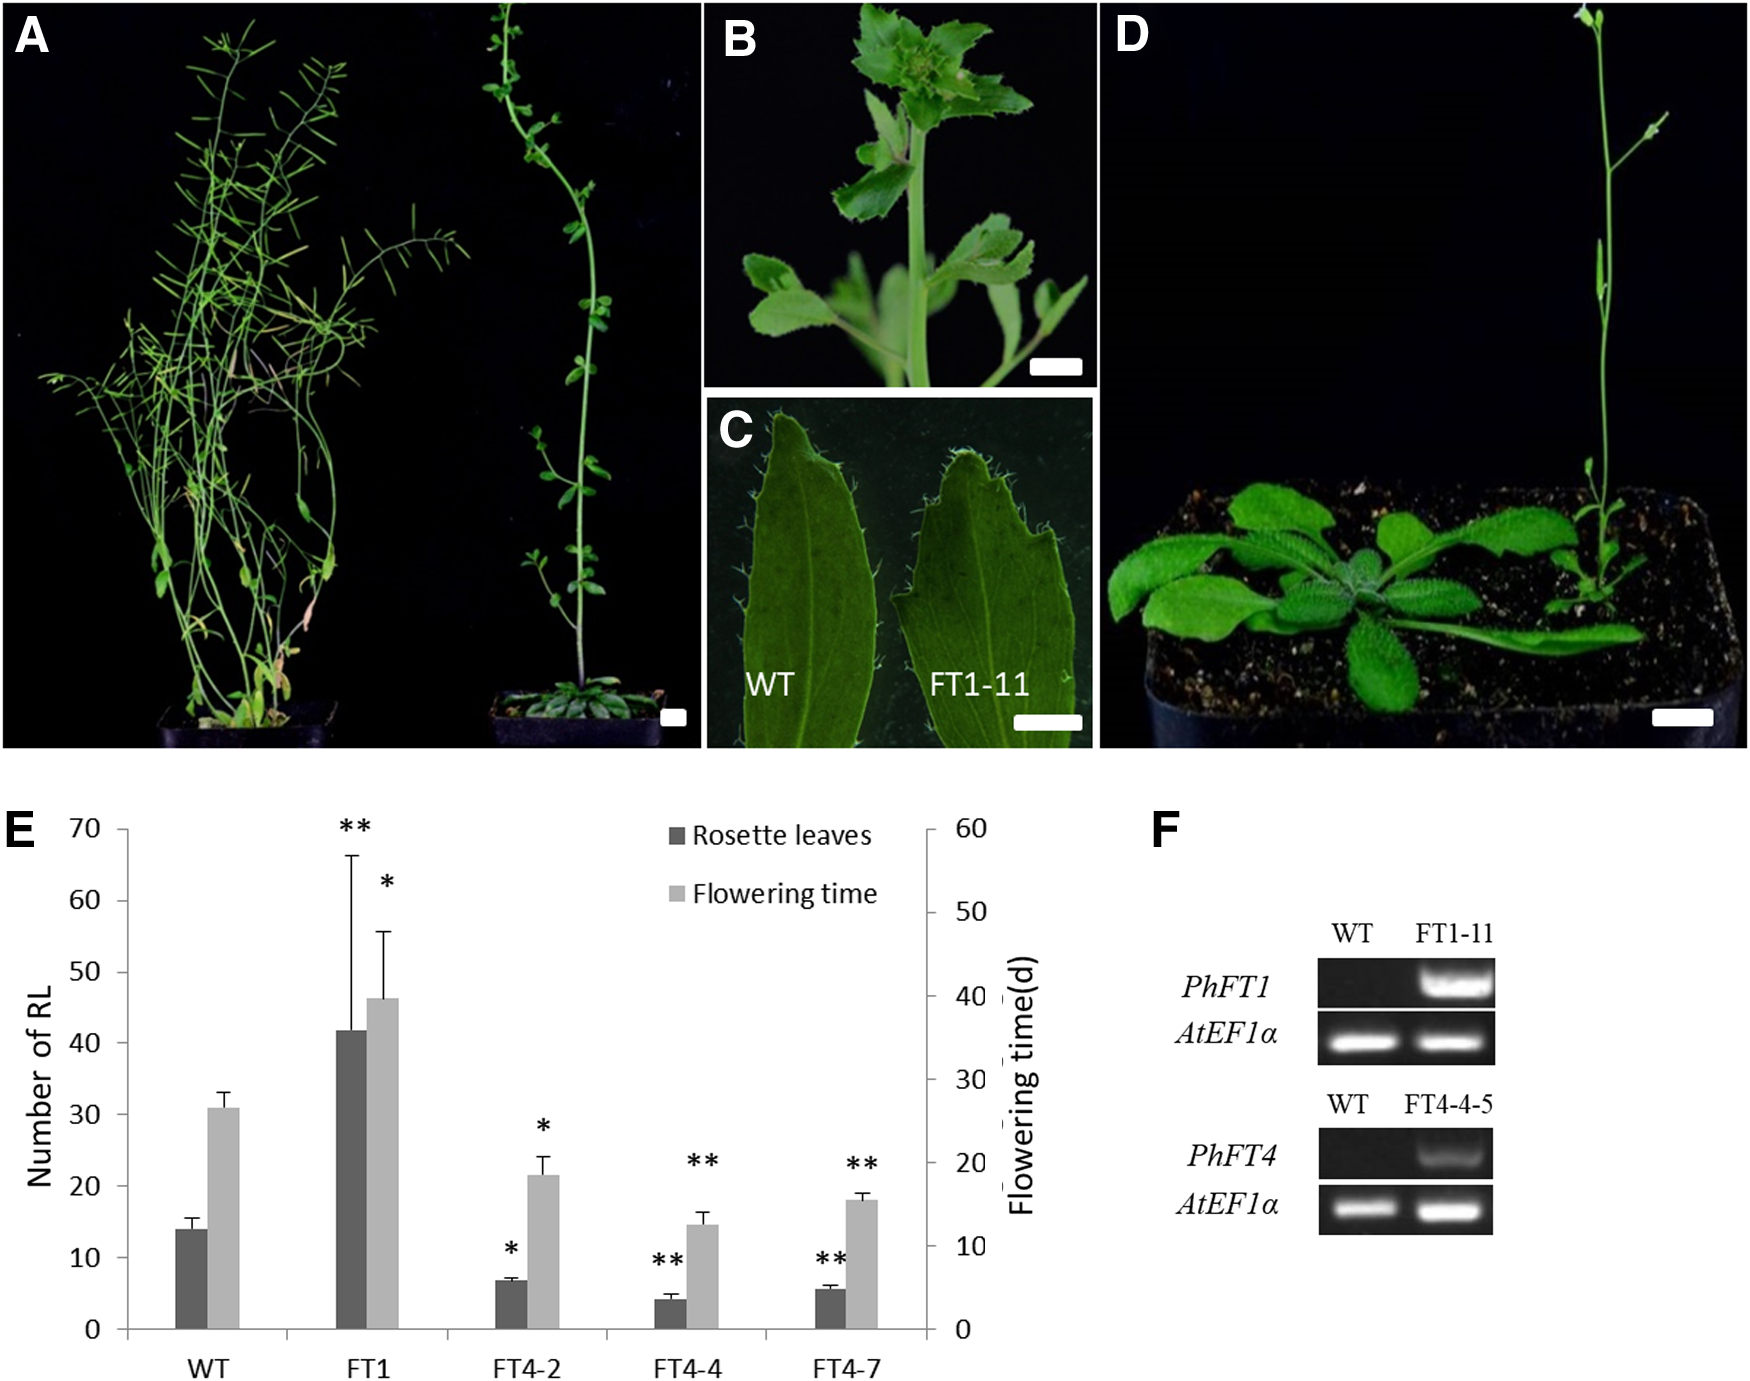
Phenotype of transgenic Arabidopsis lines and expression profiles of the transgenes.
Discussion
Evolution of FT/TFL1 genes in Petunia
In plants, genes of the PEBP family act as potential regulators of the transition from the vegetative to the reproductive phase, and play important roles in plant architecture and seasonal growth adaptation (Henrik et al., 2006; Corbesier et al., 2007). In our study, we identified and characterized the entire PEBP (FT/TFL1) gene family in petunia. The evolutionary relationships of petunia FT/TFL1 members with their homologs in plant species representing different evolutionary clades were analyzed.
Based on the latest explanation, the first duplication event of PEBP family in plants took place after the divergence of P. patens and S. moellendorffii from the common ancestor of seed plants (Liu et al., 2016), which gave rise to the MFT-like and FT/TFL1-like subfamily after different selection of several important amino acids (Wang et al., 2015) (Supplementary Fig. S1). The second duplication resulting in the FT-like and TFL1-like subfamily may also have been occurred before the separation of gymnosperms and angiosperms; afterward, further duplications arose in each clade (Liu et al., 2016). The phylogenetic analysis in our study makes three subfamilies to be identified (MFT-like, FT-like, and TFL1-like), and each subfamily contains at least two gene members from P. abies, a gymnosperm species (Fig. 1), supporting the point that FT-like and TFL1-like clades have been separated in the common ancestor of gymnosperms and angiosperms.
In petunia, at least five FT orthologous genes have been identified, which is different from the status in Arabidopsis (only two members) but similar to the situation in tomato (Cao et al., 2015) and tobacco (Supplementary Table S1). Based on our phylogenetic tree, we can infer that at least three duplications have occurred within the FT-like subfamily in Solanaceae, which, in turn, generated PhFT2/SFT, PhFT3/SP5G, PhFT4/SP5G1, and PhFT1/SP5G2 gene groups (Fig. 1).
For TFL1-like subfamily, there exist five genes in tomato and six genes in both petunia and tobacco, but only three genes in Arabidopsis. Previous studies have identified two extensive duplations within the TFL1-like subfamily occurred in eudicots, producing the TFL1, ATC, and BFT clades (Wang et al., 2015; Liu et al., 2016), which was also undergone for the petunia TFL1-like genes. Furthermore, another duplication seems to have happened in Solanaceae, at least in the genus Petunia and Nicotiana, resulting in two members in each of these clades (Fig. 1).
At least two MFT orthologous genes were found in most species including moss, ferns, gymnosperms, monocots, and eudicots (Fig. 1) (Liu et al., 2016), but only one was found in Arabidopsis, suggesting that extensive and independent duplications exist within the MFT-like subfamily. Two MFT members contained in tomato, petunia, and tobacco indicate one such duplication in Solanaceae.
During plant evolution, the number of genes could be changed through pseudogenization and divergence of function by subfunctionalization or neofunctionalization (Zhou et al., 2018). The number of FT/TFL1 genes in petunia is larger than that in Arabidopsis likely due to the genome tripling in Solanaceae and accelerated gene evolution (Bombarely et al., 2016).
The majority of PEBP genes obtained in petunia share high amino acid sequence similarity and conserved primary structures—four exons and three introns. Exons 2 and 3 were conserved in length with 62 and 41 bp, respectively. The structure is in accordance with all genes examined in other species. This indicates that the structures of FT/TFL1 family genes are conserved during evolution.
Divergent expression patterns of petunia FT/TFL1-like genes
It has been reported that the expression patterns of the three representative PEBP members in Arabidopsis have diverged: FT expression is limited to the vasculature of leaves (Adrian et al., 2010), TFL1 is mainly expressed in young inflorescence tissues (Bradley et al., 1997), and MFT expression gradually increases in germinated seeds (Xi et al., 2010). The temporal and spatial expression analyses by RT-PCR indicated that petunia FT/TFL1 genes have evolved divergent expression patterns: five FT-like genes except PhFT2 were mainly expressed in leaves, all TFL1-like genes except PhTFL1d showed the highest expression in roots, BFT-like genes were prominently expressed in seedlings, and MFT-like genes were primarily expressed in seeds. The expression profiles imply that petunia FT/TFL1 genes may have conserved functions but plays diverse roles in petunia growth and development.
It was reported that FT-like genes regulate flowering in a photoperiod-dependent manner in many species (Kojima et al., 2002; Searle and Coupland, 2004). In Arabidopsis, the expression of FT starts in 4 days after sowing, and under LD conditions, FT and CO expression peaks at the end of the daytime; under SD conditions (8 h light/16 h dark), the expression of CO peaks during the night and FT is not expressed (Searle and Coupland, 2004). Expression levels of NtFT1, NtFT2, and NtFT4 in tobacco and SlSP5G2 and SlSP5G3 in tomato were higher under SD conditions than under LD conditions (Harig et al., 2012; Cao et al., 2015).
In petunia, a FT-like gene PehFT (equal to the PhFT4 in this study) has been reported. Its expression level was shown to decline from the stage of five true leaves under white fluorescent light or blue LEDs in LD conditions, which was defined as 14 h light/8 h dark in this article; in addition, the expression of PehFT responds to photoperiod, it increased after the start of daytime and decreased during night-time under LD conditions, reaching the highest at 8 and 36 h during the first day and second day, respectively (Tsukamoto et al., 2016).
Our results indicated that five petunia FT-like genes and the CO ortholog (PhCO) all show response to photoperiod, but they have different circadian rhythms. PhFT2-5 genes accumulate during daytime (peaks at 12 h at the start of daytime) and decrease during dusk and night, whereas the expression of PhFT1 was contrary to that of PhFT2-5, increasing at dawn and then declining during daytime (Fig. 5). Interestingly, the circadian rhythm of PhCO is consistent with that of PhFT1 (a flowering repressor in petunia) other than PhFT2-5, which is different from the situation in Arabidopsis.
In our study, although petunia FT-like genes were expressed mainly in leaf tissue, their expression level was much lower than reported (Tsukamoto et al., 2016). This might be caused by the sampling stage of the plants, as the plants used for gene expression analysis in our study are at the stage of flowering, which is much later compared with previous studies. In addition, different endogenous reference genes (ACTIN8 vs. EF1α) used for normalization and photoperiod setting (14 h light vs. 16 h light) may also result in the lower expression levels in our study.
Petunia FT-like genes show antagonistic roles in flowering regulation
Based on phylogenetic data, PhFT1, PhFT2, PhFT3, PhFT4, and PhFT5 have been classified as orthologs of FT-like genes. We transferred 35S::PhFT1 and 35S::PhFT4 into Arabidopsis. The results showed that 35S::PhFT1 delays flowering whereas 35S::PhFT4 promotes flowering (Fig. 6). In Arabidopsis, Tyr85/His88 and Gln140/Asp144 are the conserved sites that distinguish the flowering promoting and repressing activity of FT and TFL1 subfamily, respectively (Hanzawa et al., 2005). In petunia, all FT-like proteins have the same amino acids as those in FT protein at these positions (Fig. 3), suggesting that the different functions of PhFT1 and PhFT4 in regulating flowering are not related to these sites.
In previous studies, several FT-like genes have been reported to be involved in flowering repression. In sugar beet, two FT-like genes show antagonistic roles in flowering regulation, with BvFT2 promoting flowering and BvFT1 inhibiting flowering (Pin et al., 2010). There exist two key amino acid residues in the fourth exon of BvFT1 and BvFT2 genes: Y134 and W138 are important to BvFT2 as a promoter of flowering in sugar beet (Pin et al., 2010). In tobacco, the functions of four FT-like genes have been characterized. NtFT4 is a flowering promoter and the two key amino acid residues were the same as those in Arabidopsis FT and BvFT2. Whereas NtFT1-3 acts as floral repressors, and amino acids in 134 and 138 sites were not conserved (Harig et al., 2012).
Through protein sequence alignment, we found that the two sites in PhFT2-5 matched those of Arabidopsis FT and BvFT2, whereas PhFT1 had changed amino acids (C134 and N138), although they are different from the residues in BvFT1 (N134 and Q138) (Supplementary Fig. S2). These results suggest that PhFT1 acts as a suppressor of flowering due to the amino acid changes at 134 and 138 positions. Based on this point, PhFT2, PhFT3, and PhFT5 should be flowering activators in petunia, like PhFT4.
Functional evolution of TFL1/ATC-like genes in petunia
In Arabidopsis, TFL1 delays the flowering transition and promotes indeterminacy of the inflorescence shoot (Bradley et al., 1997); ATC acts as a systemic floral inhibitor under SD conditions (Huang et al., 2012). In Antirrhinum majus, the ATC ortholog CEN (CENTRORADIALIS) is mainly expressed in the IMs and its loss-of-function mutants show the formation of a terminal flower in place of the IM (Bradley et al., 1996).
In addition, there are other expression patterns and functions of TFL1 genes in many different species. The common bean PvTFL1y controls growth habit (Kwak et al., 2012; Repinski et al., 2012), and the pea PsTFL1a maintains indeterminate growth (Foucher et al., 2003).
In potato, StTFL1 is expressed primarily in roots, apical buds, and floral buds, and regulates both flowering and tuberization (Guo et al., 2010). In tomato, the TFL1 ortholog SP9D is expressed predominantly in roots and shoot apex, whereas the ATC ortholog SP (SELF-PRUNING) is expressed mainly in shoot apex and leaves (Carmel-Goren et al., 2003), regulating vegetative to reproductive switching of sympodial meristems (Pnueli et al., 1998). In tobacco, the expression of CET2/4 (ATC orthologs) is restricted to vegetative axillary meristems; no expression of CET1 (ATC ortholog) and CET6 (TFL1 ortholog) could be detected in any tissues by RNA in situ hybridization, but expression of both genes was detected in vegetative and inflorescence shoots by RT-PCR (Amaya et al., 1999); in addition, NsCET1 was proved to act as a mobile molecule that noncell-autonomously inhibits flowering (Huang et al., 2018).
Altogether, these findings imply that the function of TFL1- and ATC-like genes may differentiate during evolution and play roles in multiple development processes.
In our study, four TFL1/ATC-like genes (two TFL1 orthologs and two ATC orthologs) were identified in petunia, three members (PhTFL1a, PhTFL1b, and PhTFL1c) were predominantly expressed in roots (Fig. 4). Petunia is a model plant for forward and reverse genetic analysis, which offers an excellent opportunity to address the phenomena of the restricted expression of PhTFL1a, PhTFL1b, and PhTFL1c in roots. Further experiments need to be carried out to characterize the biological function of each TFL1 genes in petunia.
Conclusion
Thirteen genes of FT/TFL1 family have been cloned from petunia. The FT-like genes were mainly expressed in leaves, and the circadian rhythm of PhFT1 was contrary to that of PhFT2-5, but in accordance with PhCO. Through overexpressing in Arabidopsis, PhFT1 strongly delayed flowering, whereas PhFT4 showed extremely early flowering. PhTFL1a, PhTFL1b, and PhTFL1c were mainly expressed in roots. These results establish a foundation for further studying functional evolution of FT/TFL1 genes in petunia and other species.
Footnotes
Acknowledgments
We thank all colleagues in our laboratory for helping in discussions and technical assistance.
Disclosure Statement
The authors declare no commercial associations that might create a conflict of interest in connection with this study.
Funding Information
This research was funded by the National Natural Science Foundation of China (Grant Nos. 31272206, 31471914, and 31772345).
Supplementary Material
Supplementary Figure S1
Supplementary Figure S2
Supplementary Table S1
Supplementary Table S2
Supplementary Table S3
Supplementary Table S4
Supplementary Table S5
References
Supplementary Material
Please find the following supplemental material available below.
For Open Access articles published under a Creative Commons License, all supplemental material carries the same license as the article it is associated with.
For non-Open Access articles published, all supplemental material carries a non-exclusive license, and permission requests for re-use of supplemental material or any part of supplemental material shall be sent directly to the copyright owner as specified in the copyright notice associated with the article.