
Abstract
Abstract
An integrated Advanced Regional Prediction System–Community Multiscale Air Quality modeling system was employed to investigate the PM10 air pollution issue in Beijing, China, with a focus on assessing contributions from road fugitive dust (RFD). A two-level nested grid domain with spatial resolutions of 12 and 4 km was designed for the study region, and the months of January, April, July, and October in 2006 were taken as target periods for the model simulations. The RFD emission inventory for 2006 base year was developed and provided to the Advanced Regional Prediction System–Community Multiscale Air Quality modeling system to quantitatively assess the PM10 contributions from RFD in Beijing. Further, both baseline and attainment scenarios in 2010 were designed and run to show the RFD impacts on the PM10 air quality in Beijing. Results show that, independent of the total PM10 mass in Beijing, the absolute contribution of RFD to the total PM10 is around 36%. Variations in the PM10 concentrations are mainly caused by regional and local meteorological effects. Based on scenario analysis, if there are no further control measures on the RFD emissions, under the same meteorological conditions of the year 2006, the number of days when Beijing's air quality is at polluted level will increase from 56 days in 2006 to 82 days in 2010 (+21%). On the other hand, when control measures are carried out, the days will decrease from 56 days in 2006 to 45 days in 2010 (−9%), although the number of vehicles and road length will also be increased at that time. It can be concluded that the RFD control might be an effective way to reduce PM pollution in Beijing.
Introduction
Vehicle-induced emissions have been regarded as one of the most important sources of PM10 pollution. In recent studies, Cheng and Chen (2006) found that >40% of the primary particulate emissions in Beijing were due to road traffic. Extensive field studies also found that public streets and highways, as well as roadways at industrial facilities, can be major sources of the atmospheric particulate matter in Beijing (Chen et al., 2005a, 2005b). Various measures such as introducing stricter emission limits and using cleaner fuel have been taken by the municipal government to address this issue. For example, Euro I standards were introduced in 1999, followed by the introduction of Euro II regulations at the beginning of 2004, and the municipal government has adopted National IV emission standards in 2008. Unfortunately, at least till today, no significant decrease has been observed in the total vehicle-induced PM emissions. Naturally, the effects due to vehicle emissions standards are slow because the upgrade of the urban fleet by new vehicles is a slow process. Three facts may account for this: first, the air quality improvements brought about by the tailpipe pollution controls may have been offset partially by the rapid growth of the number of vehicles (e.g., in 2000, there were 1.5 millions of vehicles in Beijing, and the number increased to 2.3 millions in 2004 and 4 millions at the end of 2009). Second, according to the emission inventory provided by BJEPB, the primary particles exhausted by vehicles in Beijing contributed only <11% to the total vehicle-induced PM10 emissions. More than 88% were nontailpipe emissions of mechanically generated particles, among which the road fugitive dust (RFD) was regarded as the major source. Third, few effective measures have been implemented to control the RFD emissions. In 2004, total street area swept in Beijing was 110 million m2, with only 32.5% of mechanized sweeping area, of which most (85.4%) were concentrated in downtown. Therefore, the reduction of total vehicle-induced emissions of particles requires effective controls on RFD emissions. According to the Beijing Air Quality Strategy Study carried out by BJEPB, the relative contributions to the total PM10 mass in Beijing from secondary aerosols are 8.2%, 29.2%, 22.6%, and 22.5% in spring, summer, autumn, and winter seasons, respectively. The average contribution of four seasons is 20.6%, which is relatively much less than the primary particles and will be studied in our future researches. In this article, we only focus on the primary particles.
Up to date, there have been active researches on RFD emissions. For example, Omstedt et al. (2006) developed a model to estimate the vehicle-induced fugitive dust emissions along Swedish roads. Gertler et al. (2006) carried out case studies on the impact of winter road sand/salt and street sweeping on road dust re-entrainment. Norman and Johansson (2006) focused their studies on the measures for reducing road dust emissions from paved roads. Almeida et al. (2006) evaluated the road resuspended dust contribution using the source apportionment method. Size distribution of atmospheric particulate matter at traffic-exposed sites was investigated by Lonati and Giugliano (2006). In China, Li et al. (2004) found that the implementation of advanced street sweepers can effectively reduce the road dust loading. Chen et al. (2005a, 2005b) studied the pollution property of particulates and its affecting factors at the traffic crossing in Beijing. Han et al. (2007) investigated the chemical characteristics of resuspended road dust and its impact on the atmospheric environment in Beijing. Wang et al. (2007) focused their study on the distribution of platinum group elements in road dust in the Beijing metropolitan area. However, most of these studies are limited to the evaluation of emissions only. Few have quantitatively examined the air quality impacts due to RFD (Veranth et al., 2003; Xu et al., 2007). The examination of emission source contribution to urban air quality has been regarded as a crucial component of developing any effective air pollution control management plan (Wang et al., 2005). Therefore, a complete characterization of the contributions of RFD to the ambient PM10 concentrations is necessary. In addition, a number of questions must be answered before seeking any effective RFD pollution control measures in Beijing. In other words, what is the magnitude of the contribution of RFD sources in Beijing to its air quality? How much will RFD affect the air quality in Beijing without considering any future emissions control measures? What are the possible impacts on its air quality by effectively reducing RFD emissions in Beijing? To scientifically answer such question, the use of a comprehensive atmospheric transport model is necessary.
This work characterizes the development of the RFD emission inventory and near-future scenarios in Beijing. The air quality impacts of RFD for both base year and scenarios are evaluated with long-term numerical simulations performed in a state-of-the-science three-dimensional (3D) air quality model. This article is organized with three main sections. The Emission Inventory Development section describes the development of RFD emission inventory for both baseline and attainment scenarios. The Study Area and Modeling Details section presents the modeling details such as the domain, period, meteorology, and chemistry models used. Simulation results of the base case and future scenarios as well as in-depth analysis of air quality impacts of RFD are reported in the Results and Discussions section. The last section summarizes the main conclusions of this study.
Emission Inventory Development
Base year emissions of RFD
A comprehensive evaluation of RFD air quality impacts requires a detailed description of the actual state of the RFD emissions. In this study, a widely used empirical model (AP-42 model) developed by U.S. Environmental Protection Agency was implemented to the calculation of RFD emissions from both paved and unpaved roads in Beijing. Although there is some uncertainty in estimating RFD emissions using this method, it has been widely adopted in both China and abroad (Limpaseni, 2001; Li et al., 2004; Cheng and Chen, 2006).
RFD emissions have been found to vary with the “silt loading” present on the road surface as well as the average weight of vehicles traveling the road. The term silt loading (sL) refers to the mass of silt-size material (≤75 μm in physical diameter) per unit area of the travel surface (AP-42, sixth edition). In this study, 147 valid samples were collected from various types of roads in Beijing. There were 91 samples in urban area, including 20 belt roads, 21 major arterial roads, 25 minor arterial roads, and 25 branch roads. There were 56 samples in remote districts, including 10 national express way, 12 urban roads, 12 county roads, 12 rural roads, and 10 local streets. The sampling and laboratory analysis procedures were carried out in accordance with Appendices C.1 and C.2 of the AP-42 document (EPA, 2006). Table 1 presents the detailed information of these samples.
sL, silt loading.
Besides sL, another important parameter for the AP-42 model is the average weight of the vehicles traveling the road, which can be calculated using the following equation:
where
where EF is the particulate emission factor (having units matching the units of k). k is a constant (function of particle size) in g/VKT (vehicle kilometer traveled); we use the AP-42 document-recommended value, k = 4.6, for PM10 in this study. sL is the road surface silt loading (g m−2);
For vehicles traveling on unpaved surfaces at industrial sites and publicly accessible roads, emissions are estimated from the following equations (AP-42, sixth edition):
where s is the surface material silt content (%), M stands for the surface material moisture content (%), and S is the mean vehicle speed (mph). Readers are referred to the AP-42 document for more detailed information on the science of this empirical model.
Once the emission factors are calculated by the AP-42 model, PM10 emission for a specific road can be calculated by the following formula:
where E is the emission quantity, A stands for the activity level, EF is the emission factor, and ER represents the proportion of emission reduction by all control measures. Next, the RFD PM10 emissions can be estimated with a Geographic Information System (GIS)-based road network database and the vehicle activity level, and then the corresponding emissions are determined for each cell in the computational domain. Figure 1a presents the road network of Beijing, and Fig. 1b depicts the corresponding RFD PM10 emissions in the computational domain in the base year 2006.
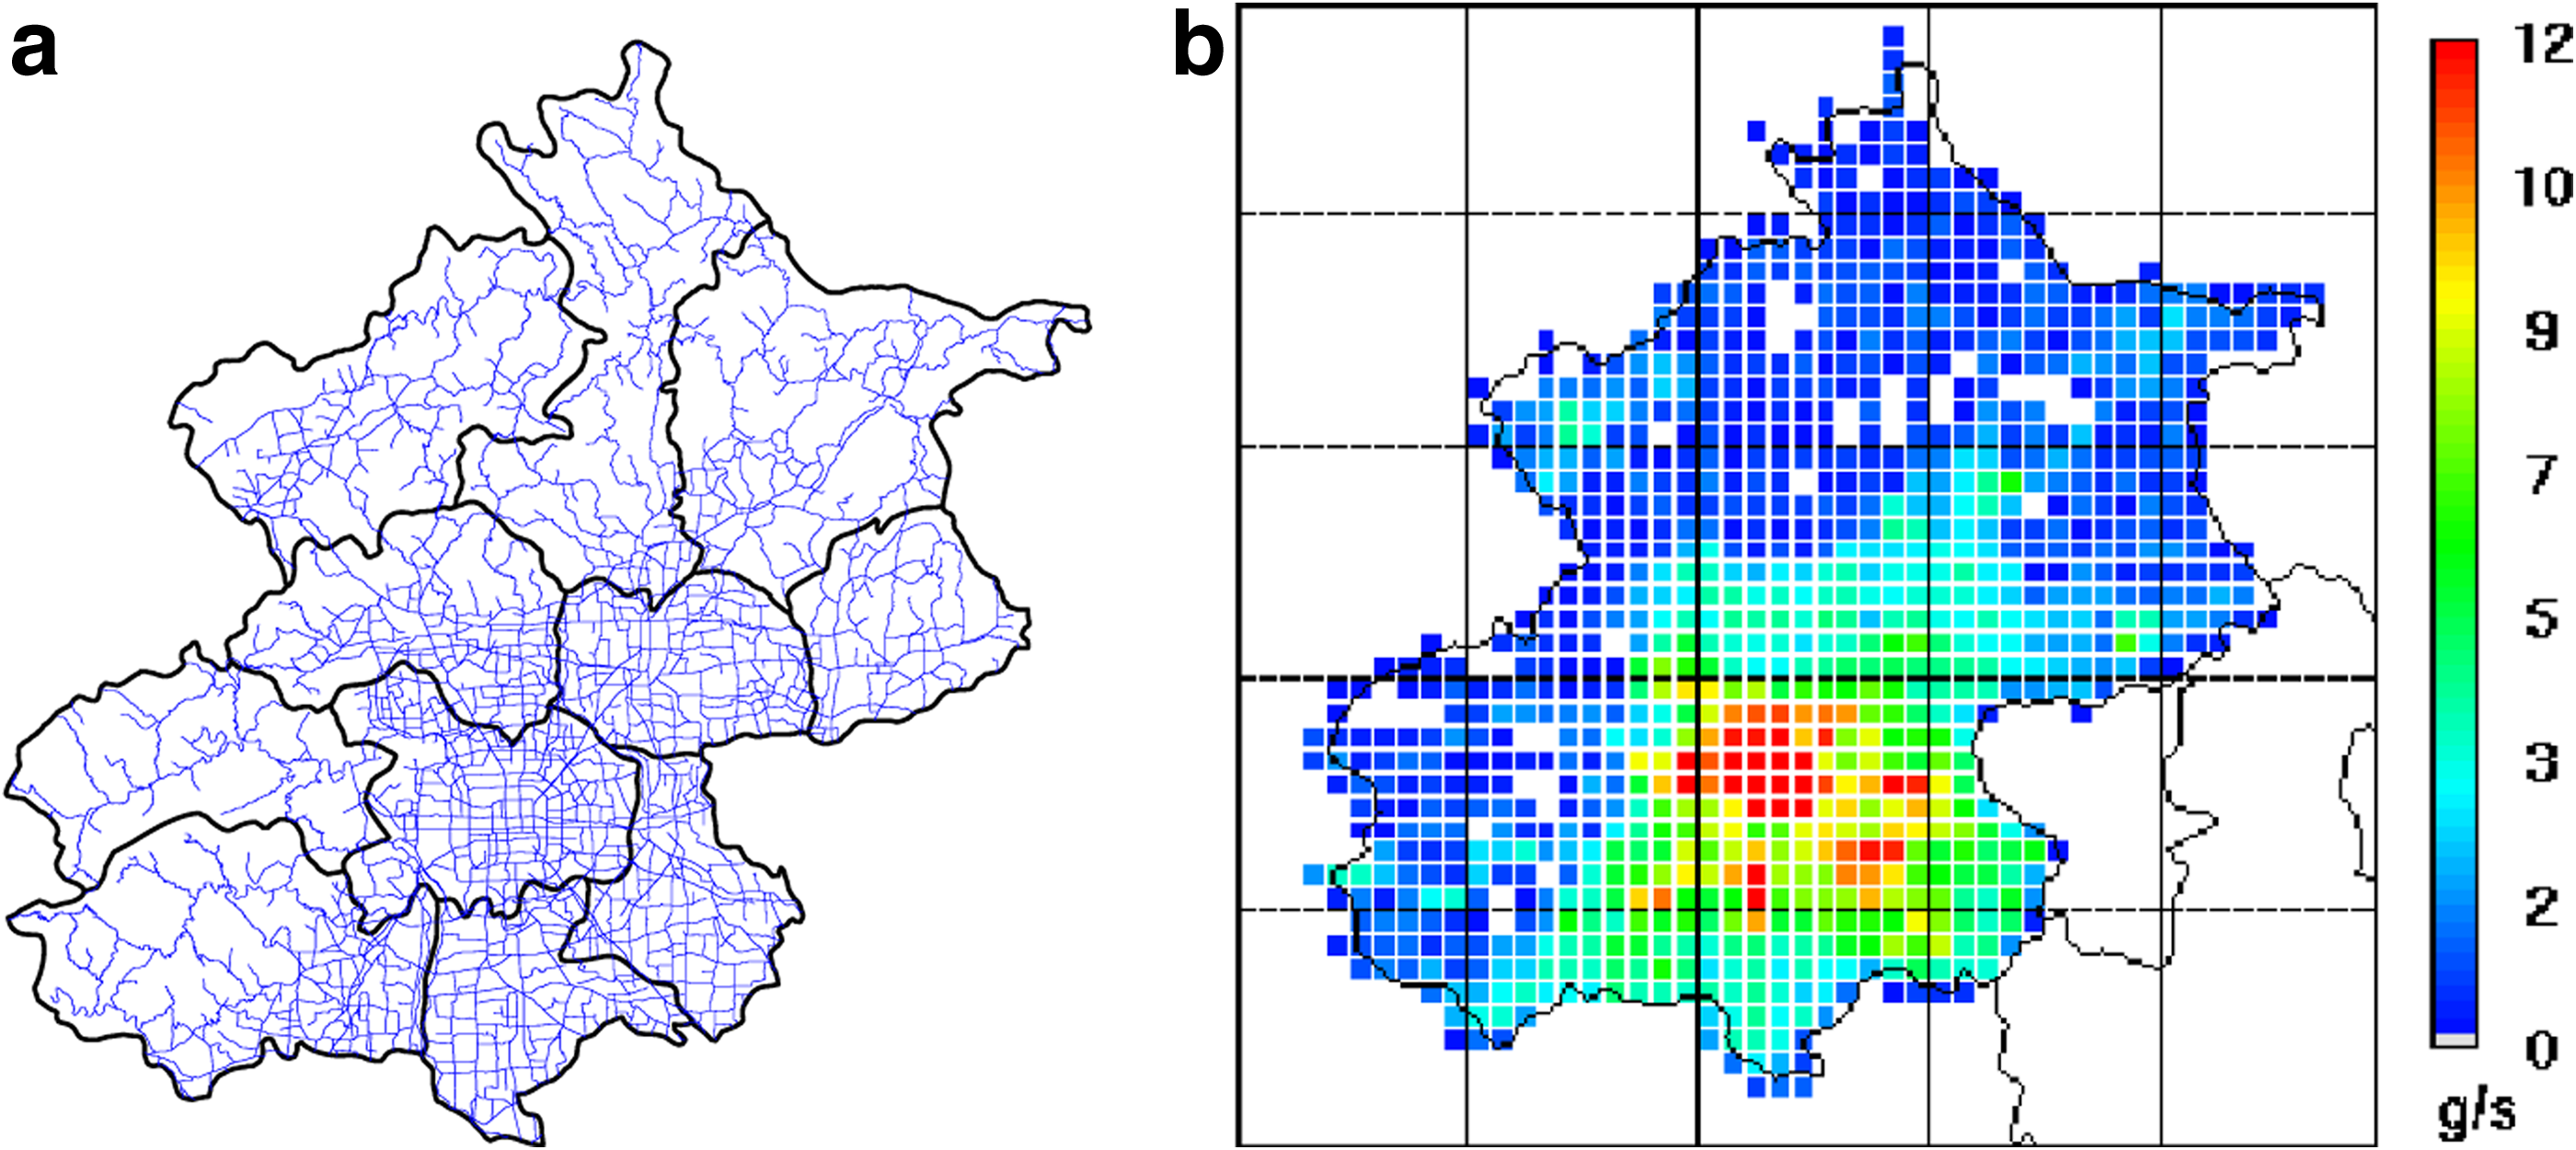
Road network of Beijing
Baseline and attainment scenarios for the year of 2010
Based on the RFD emission inventory in 2006, future scenarios development can be classified into baseline and attainment scenarios. The baseline scenario accounts for the number of vehicles and road length growth in the future, but do not consider any future RFD control measures and the possible minor change in fleet speed. It is estimated that the vehicle fleet will be increased to 3.8 millions in 2010 according to “The Outline of Beijing Municipal Transport Development” released by Beijing Municipal Committee of Transport in 2006 (BMCT, 2006). The attainment scenario, on the other hand, considers all the control measures proposed by the municipal government to accomplish the air quality standards for PM10 by the year 2010. These control measures include roadside vegetation, paving the unpaved roads, covering of loads in trucks, extending the coverage of mechanized/vacuum sweeping area, water flushing, and quick response to the conditions of heavy sL, especially during the dust storm seasons. Under very unfavorable weather conditions for air pollutants dispersion, temporary measures should be introduced to reduce vehicular emissions. This includes suspending constructions on the road, prohibiting vehicles of heavy duty and higher pollution emission to enter the downtown road, and allowing vehicles with even and odd license numbers to hit the roads only on alternate days. Each scenario was then associated to a corresponding emissions inventory, which was provided as input to the computational air quality model. Once these scenarios are constructed, the assessment of RFD air quality impacts relies on these emission inventories. Figure 2 shows the average RFD PM10 emissions of the baseline and attainment scenarios in the computational domain for 2010.
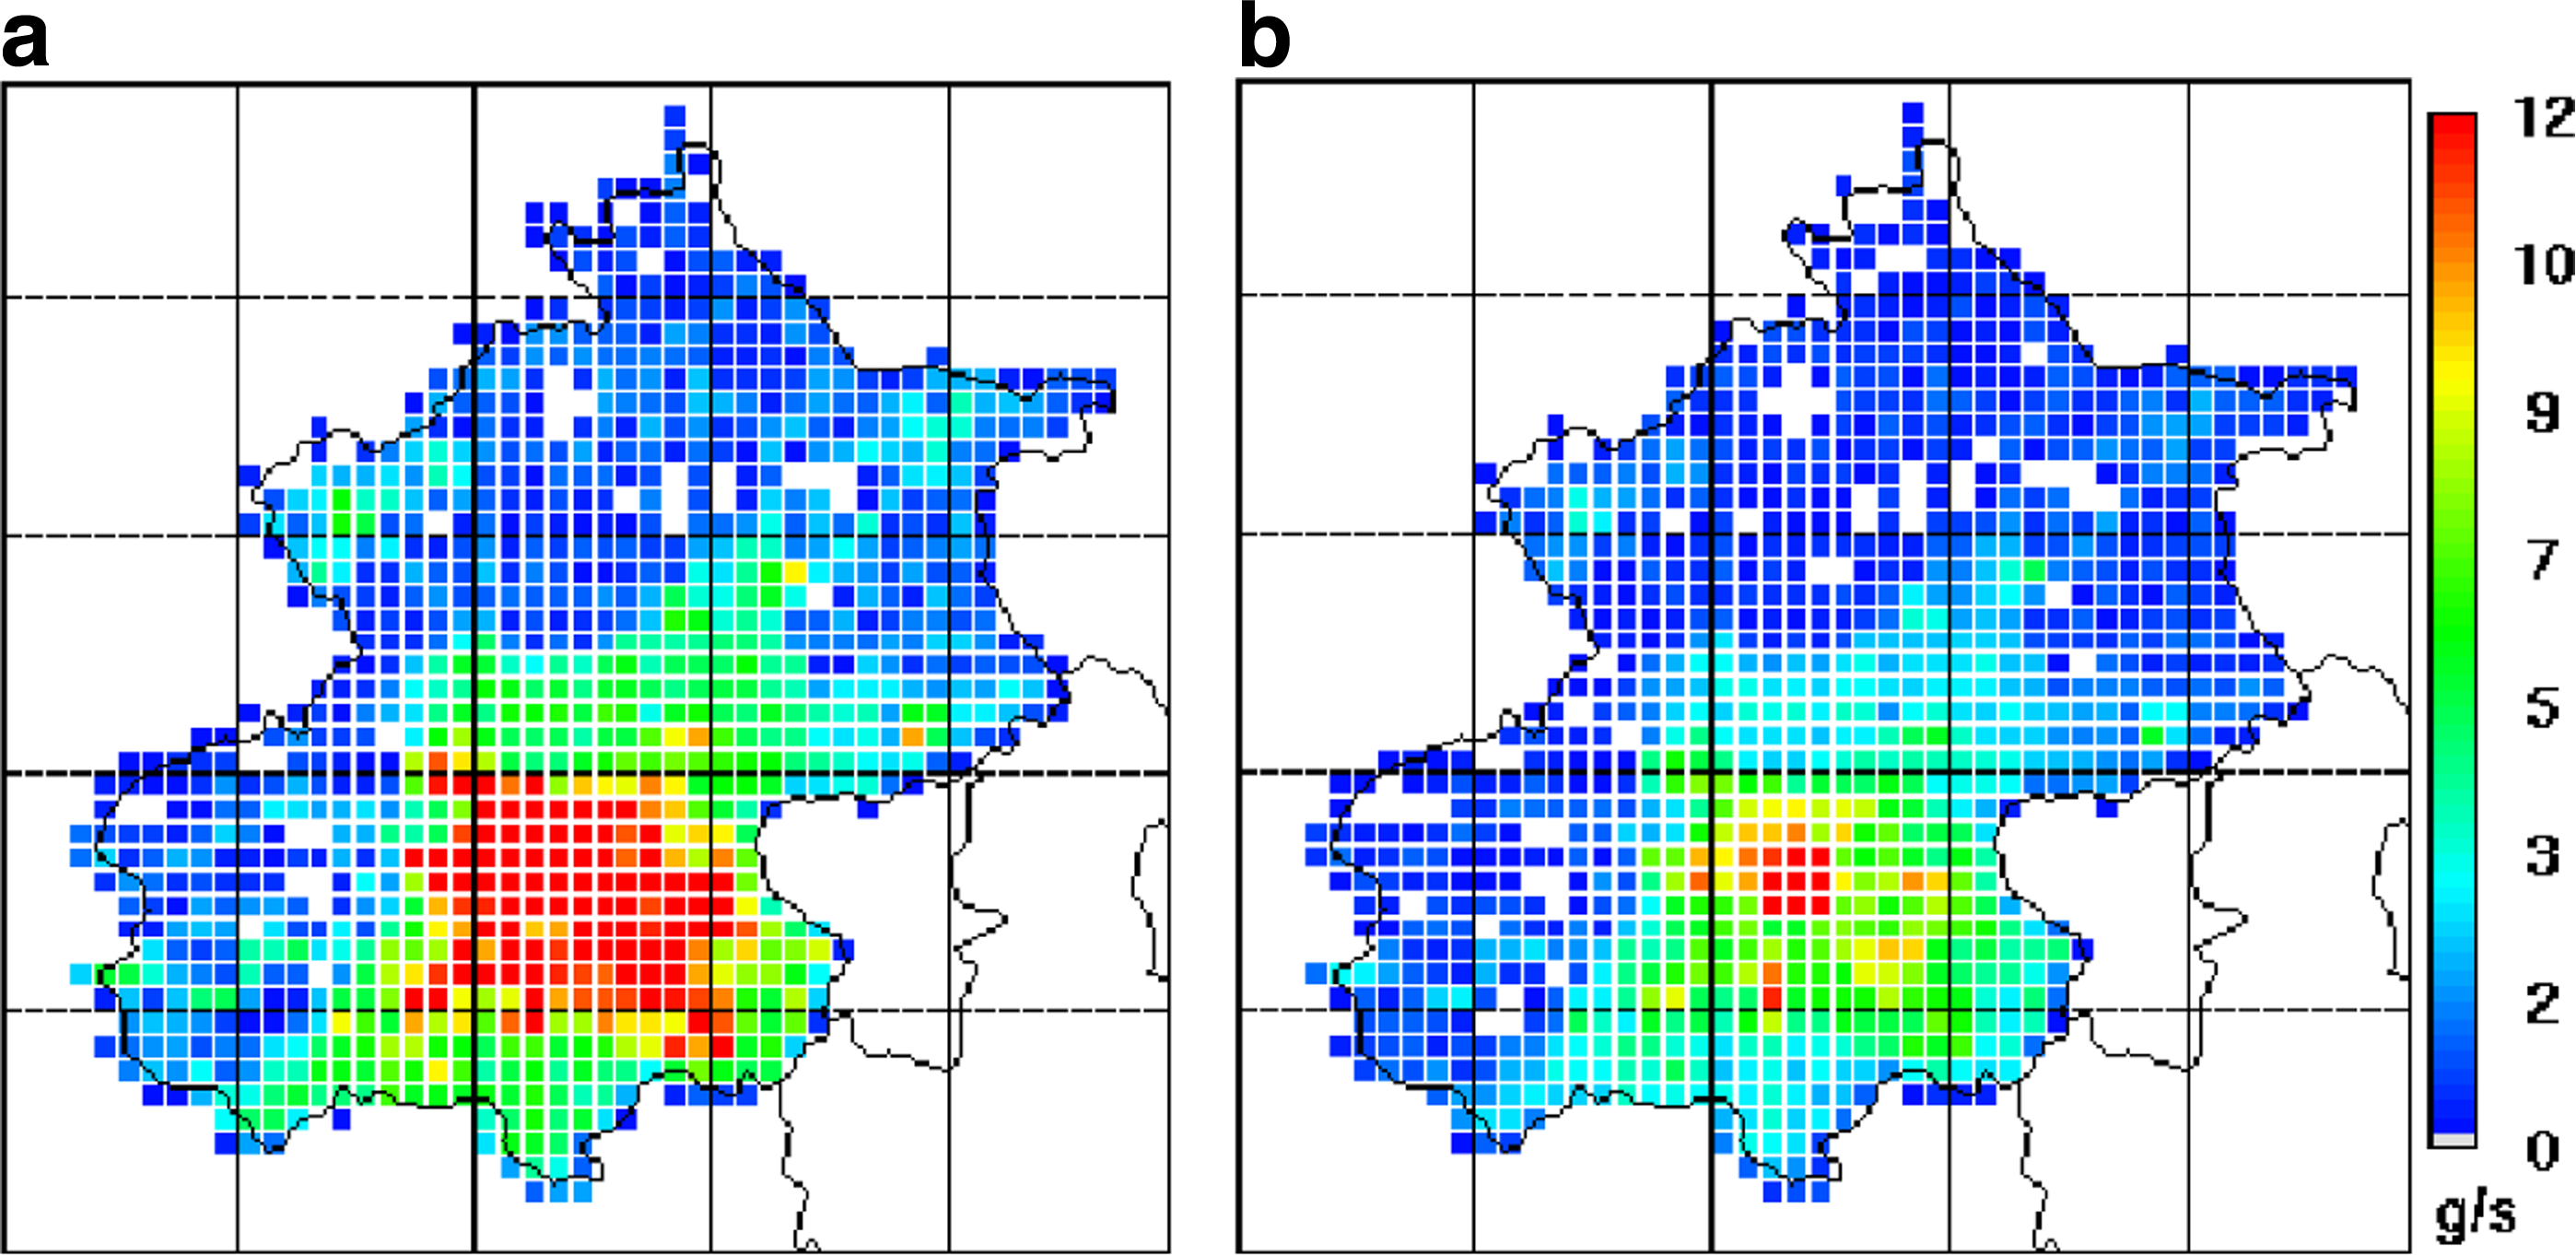
Average RFD PM10 emissions of the baseline and attainment scenarios in the computational domain for the year 2010.
Emissions from other sources
Except for the RFD emissions, emissions from other sources were also used in this study. County-level air pollutants emission inventories were obtained from the environmental protection bureaus of Beijing and the surrounding provinces and were used as a primary dataset for modeling. The NO X emissions and anthropogenic nonmethane volatile organic compounds emissions from surrounding provinces were taken from the emission inventories prepared by Streets et al. (2003). The biogenic volatile organic compounds (VOCs) emission was obtained from Global Emission Inventory Activity (Benkovitz et al., 1995). Figure 3 presents the fractions of each source in Beijing. It can be seen that the point sources (power plants, boilers, and industrial processes) account for only 24% of the total PM10 emissions in Beijing, whereas sources with lower emitting altitudes account for >75% of the total emissions, among which the RFD is the largest sector (39%).
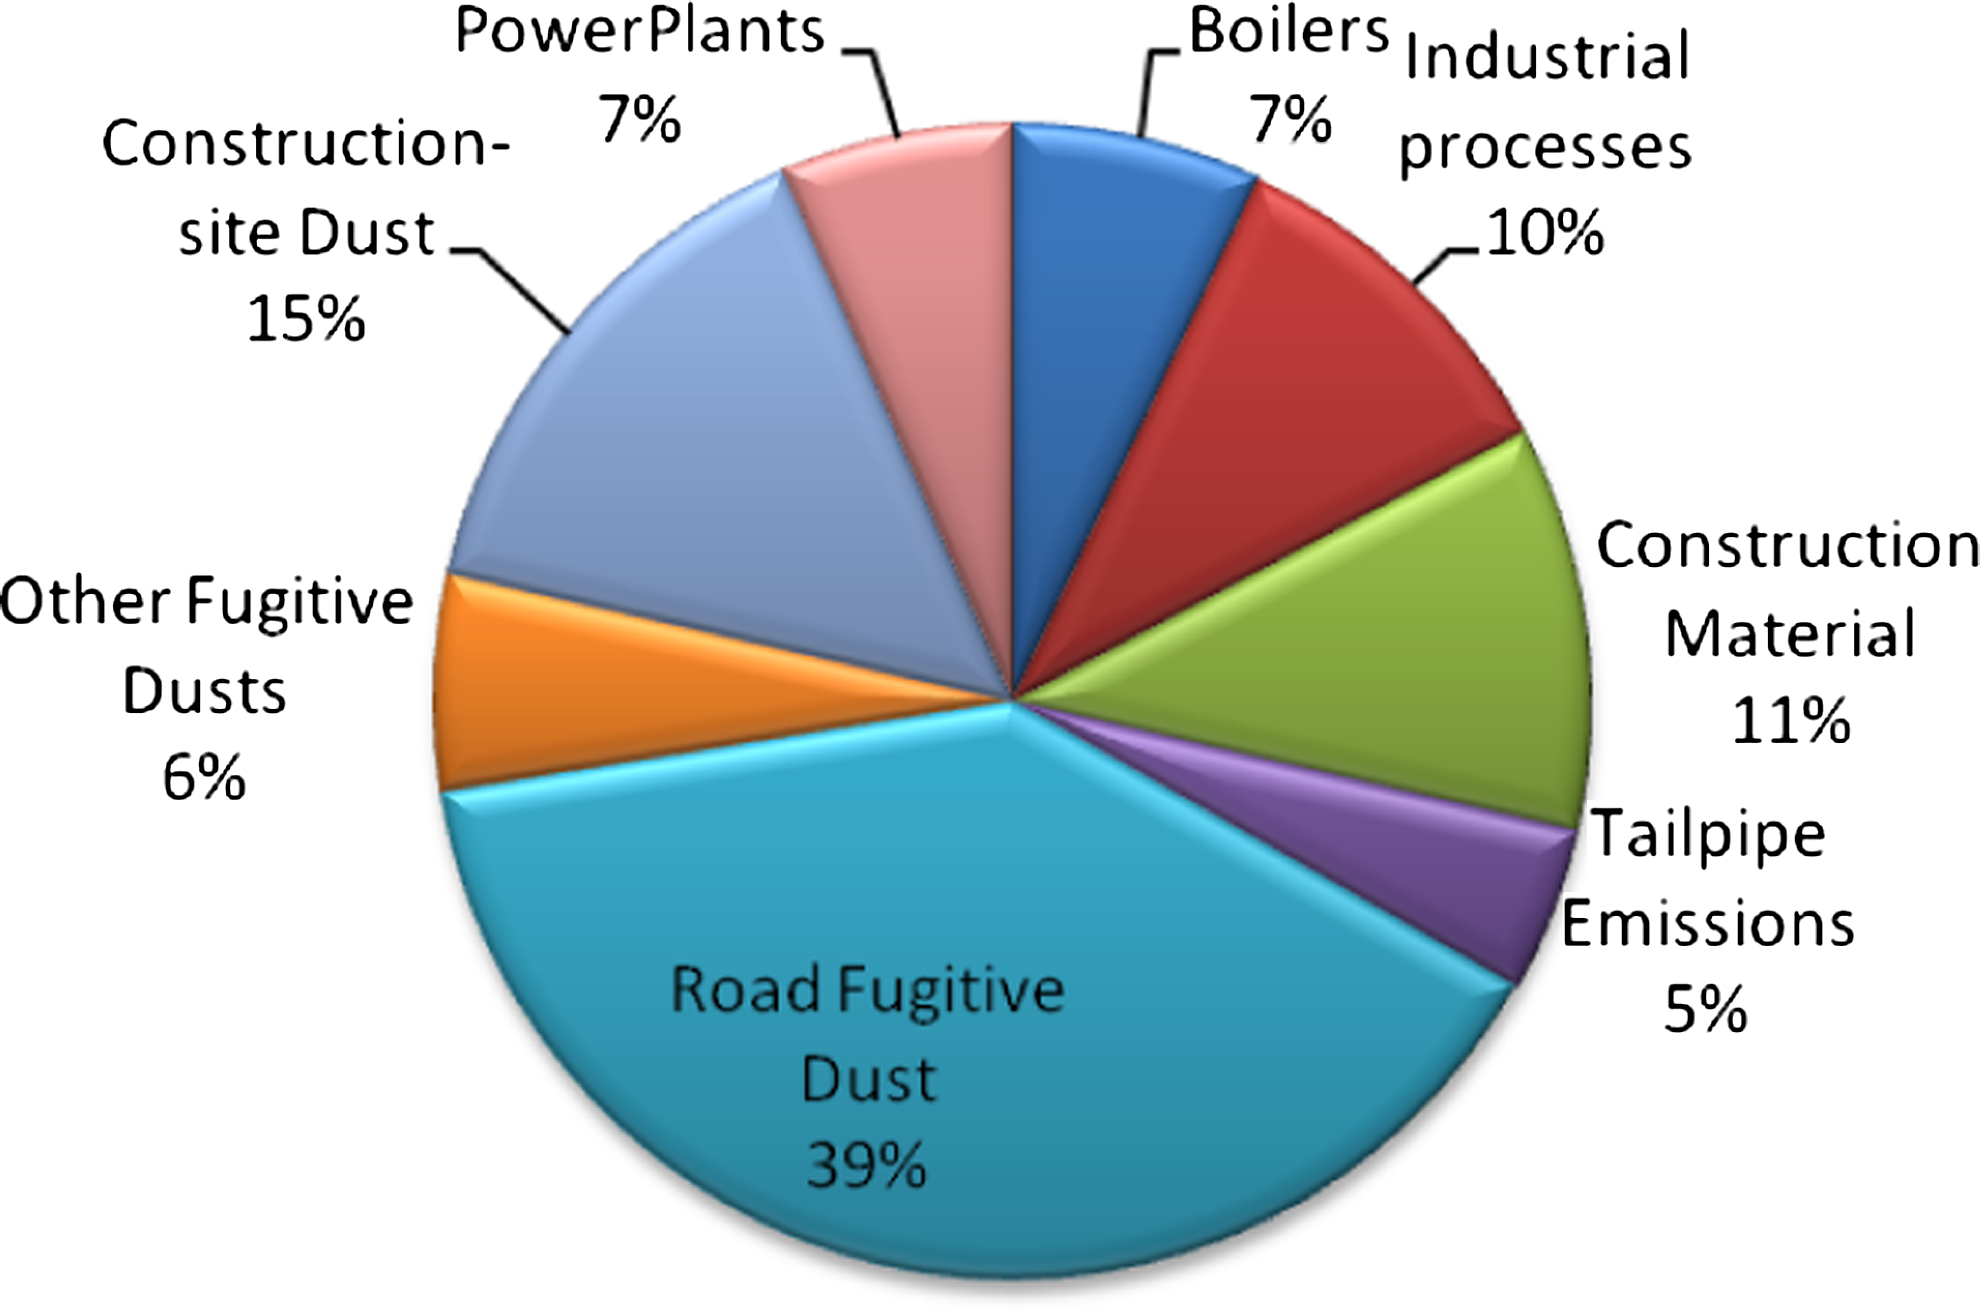
Fractions of PM10 emissions from each source in Beijing.
Study Area and Modeling Details
Beijing covers a total area of 16,807.8 km2, with 62% of the total area being mountainous and other 38% being the plain area. There are 16 subordinate districts and 2 counties within the municipal boundary under the jurisdiction of the Metro Beijing, with a total population of around 16.3 millions in the year of 2008. Beijing is situated at 40°N and 116°E (39°08′–41°05′ N, 115°25′–117°30′ E), with Tianjin City on its eastern border and Hebei Province on the other three sides (Fig. 4).
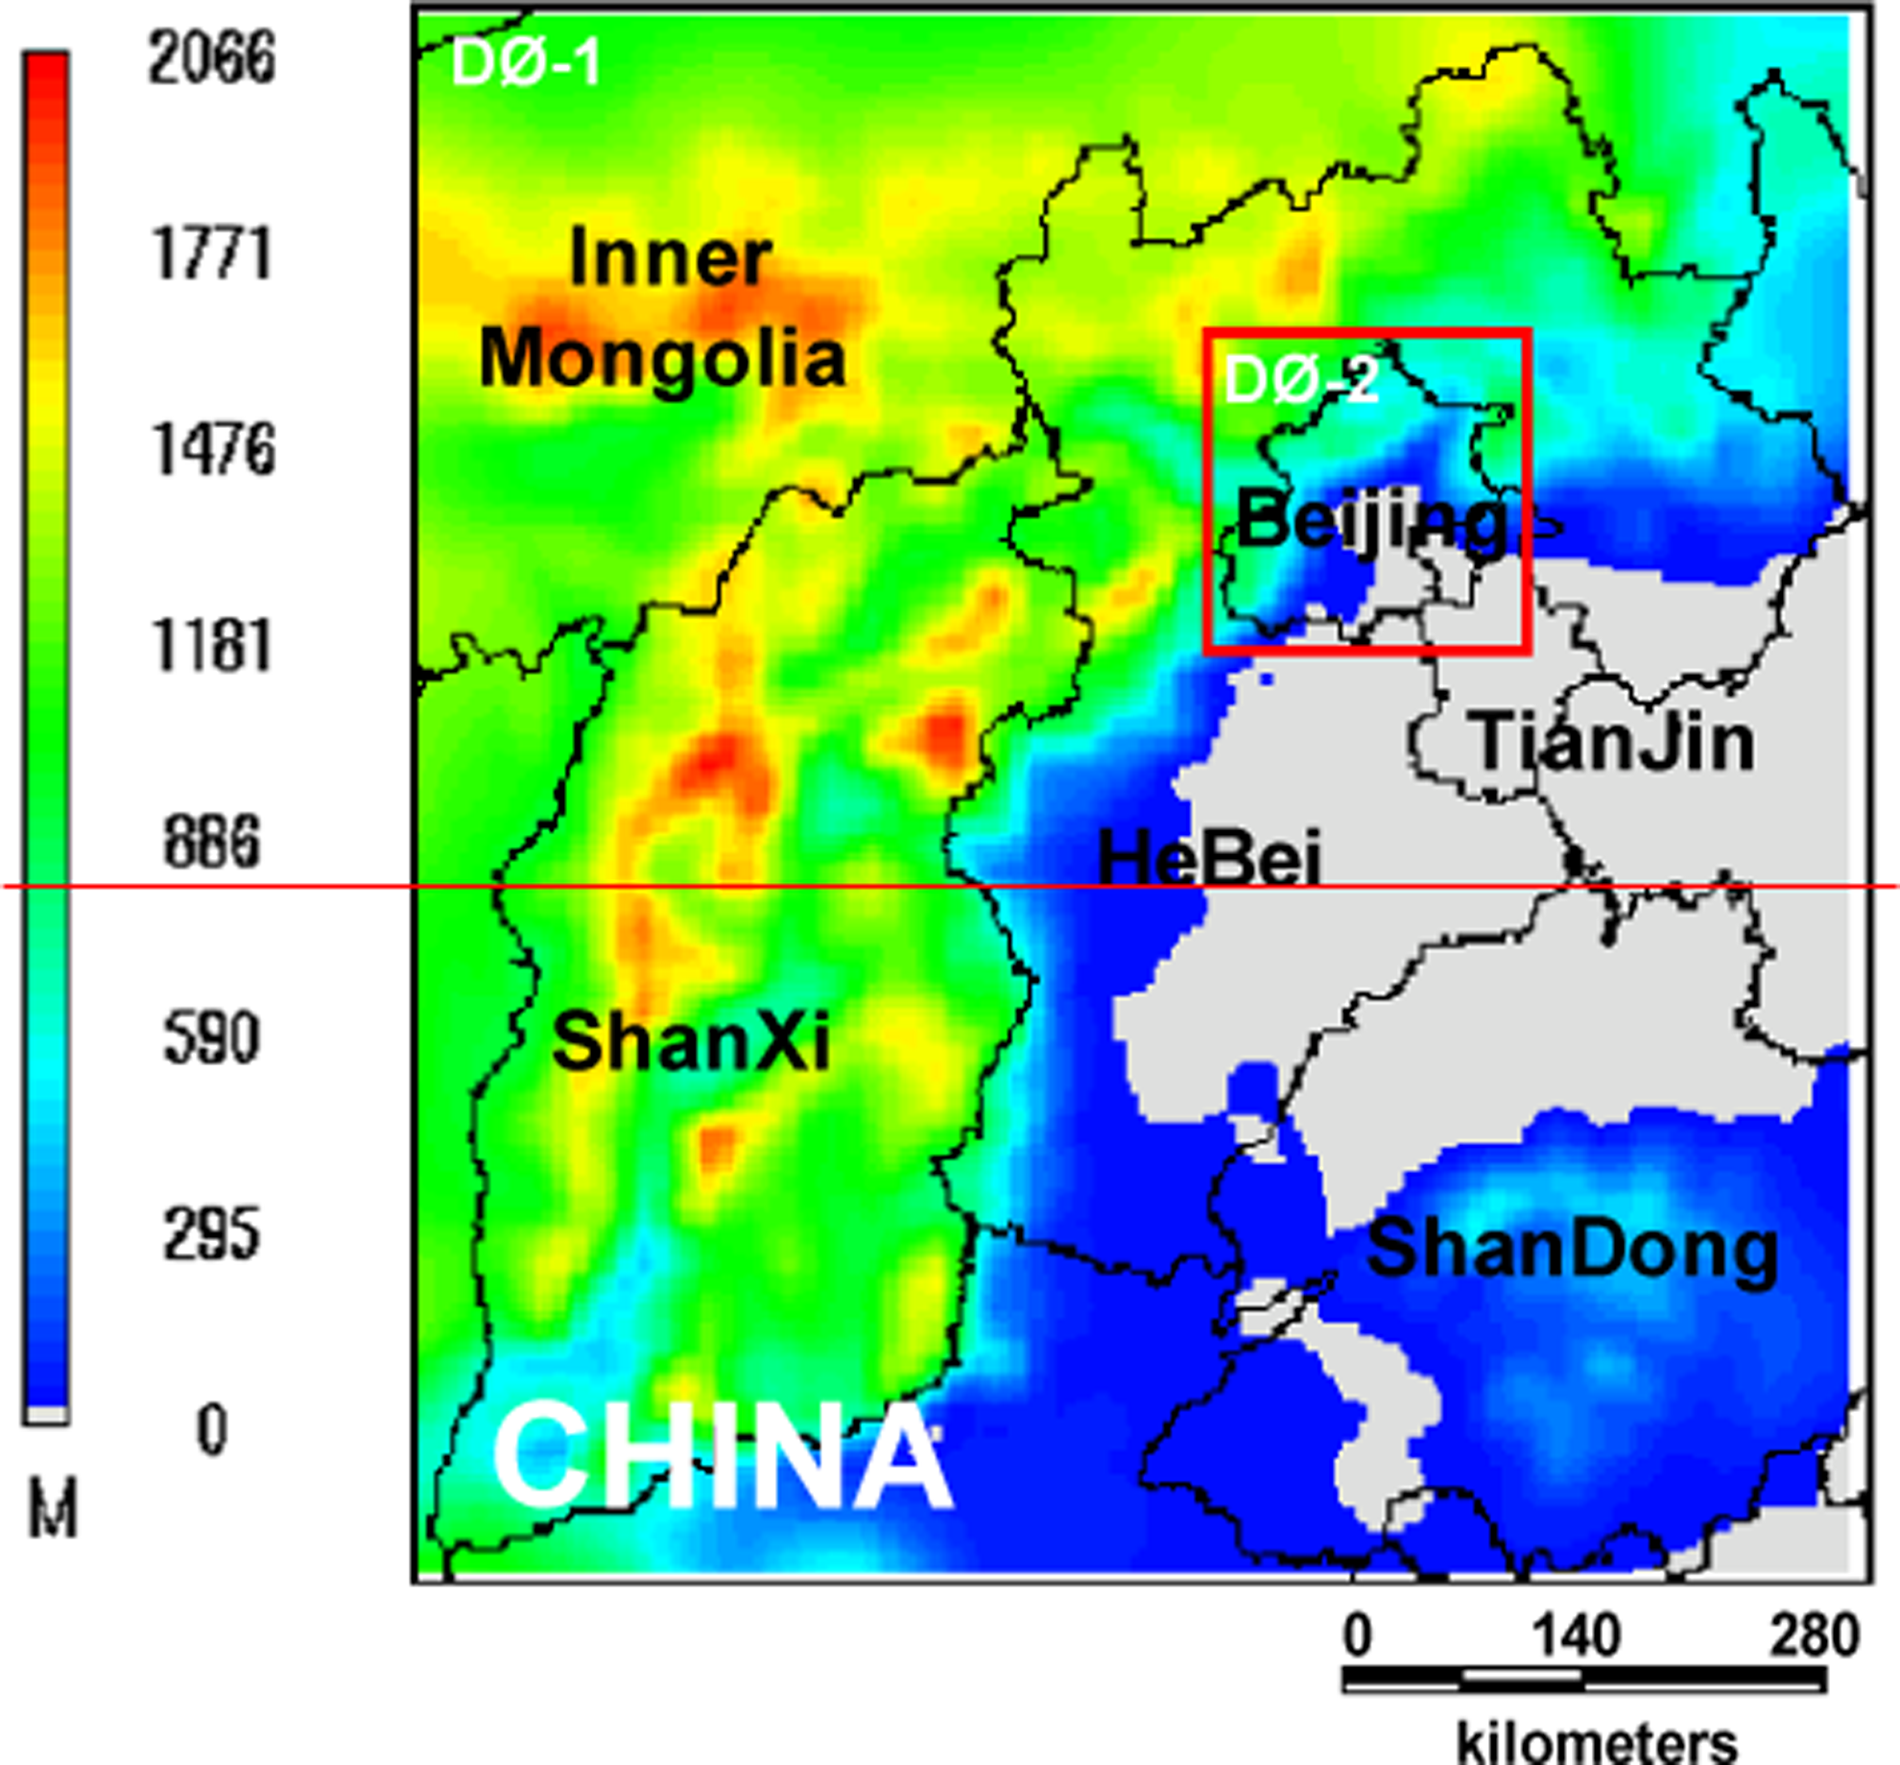
Topographical trend of terrain height for Beijing and surrounding provinces (in meters above mean sea level) and the designed two-level nested domain architecture.
Topographically, Beijing is surrounded by the Yan-Shan and Tai-Hang Mountains, and its air quality is affected by the meteorological conditions both locally and regionally. Such characteristics indicate that the air quality modeling in this region is a challenging problem because of the necessity of considering many small-scale features. It is therefore necessary to implement an advanced and comprehensive modeling system that can examine many small-scale characteristics in the Beijing metropolitan region, while considering the meso-scale background conditions. As a result, a coupling of Community Multiscale Air Quality (CMAQ) model with the Advanced Regional Prediction System (ARPS) meteorological model is proposed in this study.
As a 3D, nonhydrostatic, compressible model in generalized terrain-following coordinates, ARPS was developed by the Center for Analysis and Prediction of Storms at the University of Oklahoma. The model was designed originally to serve as an effective tool for explicit prediction of convective storms and/or weather systems at other scales. More in-depth description of this modeling system can be found in the paper by Xue et al. (2000, 2001). Since its release, the ARPS model has been used world-widely because of its superior performance in calculating high-resolution wind fields and other atmospheric features over complex terrain (Xue et al., 2000; Raderschall et al., 2002).
Models-3/CMAQ is an Eulerian-type air quality model developed by the U.S. Environmental Protection Agency. The Models-3/CMAQ system includes multiple capabilities for simulating concentrations of fine particulate, tropospheric ozone, acid deposition, visibility, and other air pollutants in the context of “one atmospheric” perspective involving complex atmospheric pollutant interactions on regional and urban scales. It simulates various chemical and physical processes that are thought to be important for understanding atmospheric pollutant transformations, transports, and distributions. In this study, CMAQ was configured with the following options: (a) CB-IV speciation with aerosol and aqueous chemistry; (b) the piecewise parabolic method for both horizontal and vertical advection; (c) eddy vertical diffusion; (d) no plume-in-grid; (e) use of the third-generation aerosol model; (f ) use of the second-generation aerosol deposition model; (g) use of RADM cloud model; (h) 12 vertical layers and 4 × 4 km of horizontal grid resolution. The spacing of 12 vertical layers is from tens of meters in the lower levels to thousands of meters at upper layers, and it was unevenly spaced. More detailed descriptions of the scientific mechanisms and implementations of CMAQ can be found in the papers by Byun and Ching (1999) and Byun (1999a, 1999b).
In this article, the 3D meteorological fields required by CMAQ are provided by the ARPS. The 3D first-guess meteorological fields in 2006 for modeling were obtained from the Global Tropospheric Analyses datasets provided by the U.S. National Center for Environmental Prediction and were available every 6 h with 1° × 1° resolution. The data were used as initial conditions. The observational meteorological data in the base year were provided by the China Meteorological Administration, which was available every 3 h for ground surface and every 12 h for soundings. The required topography data were obtained from the Digital Elevation Model from USGS, with a spatial resolution of 30 s, and the land-use data were also obtained from the USGS's 1-km NOAA/AVHRR satellite datasets.
In this study, the ARPS model was configured to run on a two-level nested domain, but only the inner domain outputs were provided to the CMAQ model. Figure 4 shows the nested computational domain. The outer domain (Do-1) has a grid resolution of 12 km by 12 km covering Beijing and most areas of its surrounding provinces and has been set up with a dimension of 70 × 76 grid cells; the inner domain (Do-2) has a spatial resolution of 4 km by 4 km and a dimension of 49 × 49 grid cells covering the entire Beijing metropolitan region. It should be noted that the computation domain of ARPS is 5 grids lager than CMAQ's on each side, that is, the Do-2 of ARPS covers 59 × 59 grid cells. In the following sections, the discussions were focused on the inner domain (Do-2) for CMAQ, and all scenarios are simulated under the same meteorological conditions of this domain.
Results and Discussions
Model evaluation
The CMAQ modeling system has been used extensively to investigate the formation of particulate matter in Beijing area. In this study, the performance of the integrated modeling system was evaluated and quantified statistically by the scatter plots diagram. The scatter diagram was obtained through plotting pairs of simulated versus measured PM10 concentrations on an x–y ordinate. Data from seven monitoring stations depicted in Fig. 5 were averaged and used for this purpose. The seven-station-averaged scatter plots of simulated versus observed daily PM10 concentration are presented in Fig. 6 for the four target months in 2006. The results show that mean of the monitoring is 121.8 μg m−3, mean of the modeling is 101.3 μg m−3, RMSE is 85.1 μg m−3, and the correlation is 0.74. The value 85.1 of RMSE is similar to previous findings (RMSE: 86.7 μg m−3) on the ARPS–CMAQ model evaluation issues in Beijing (Chen et al., 2008; Cheng and Chen, 2006).
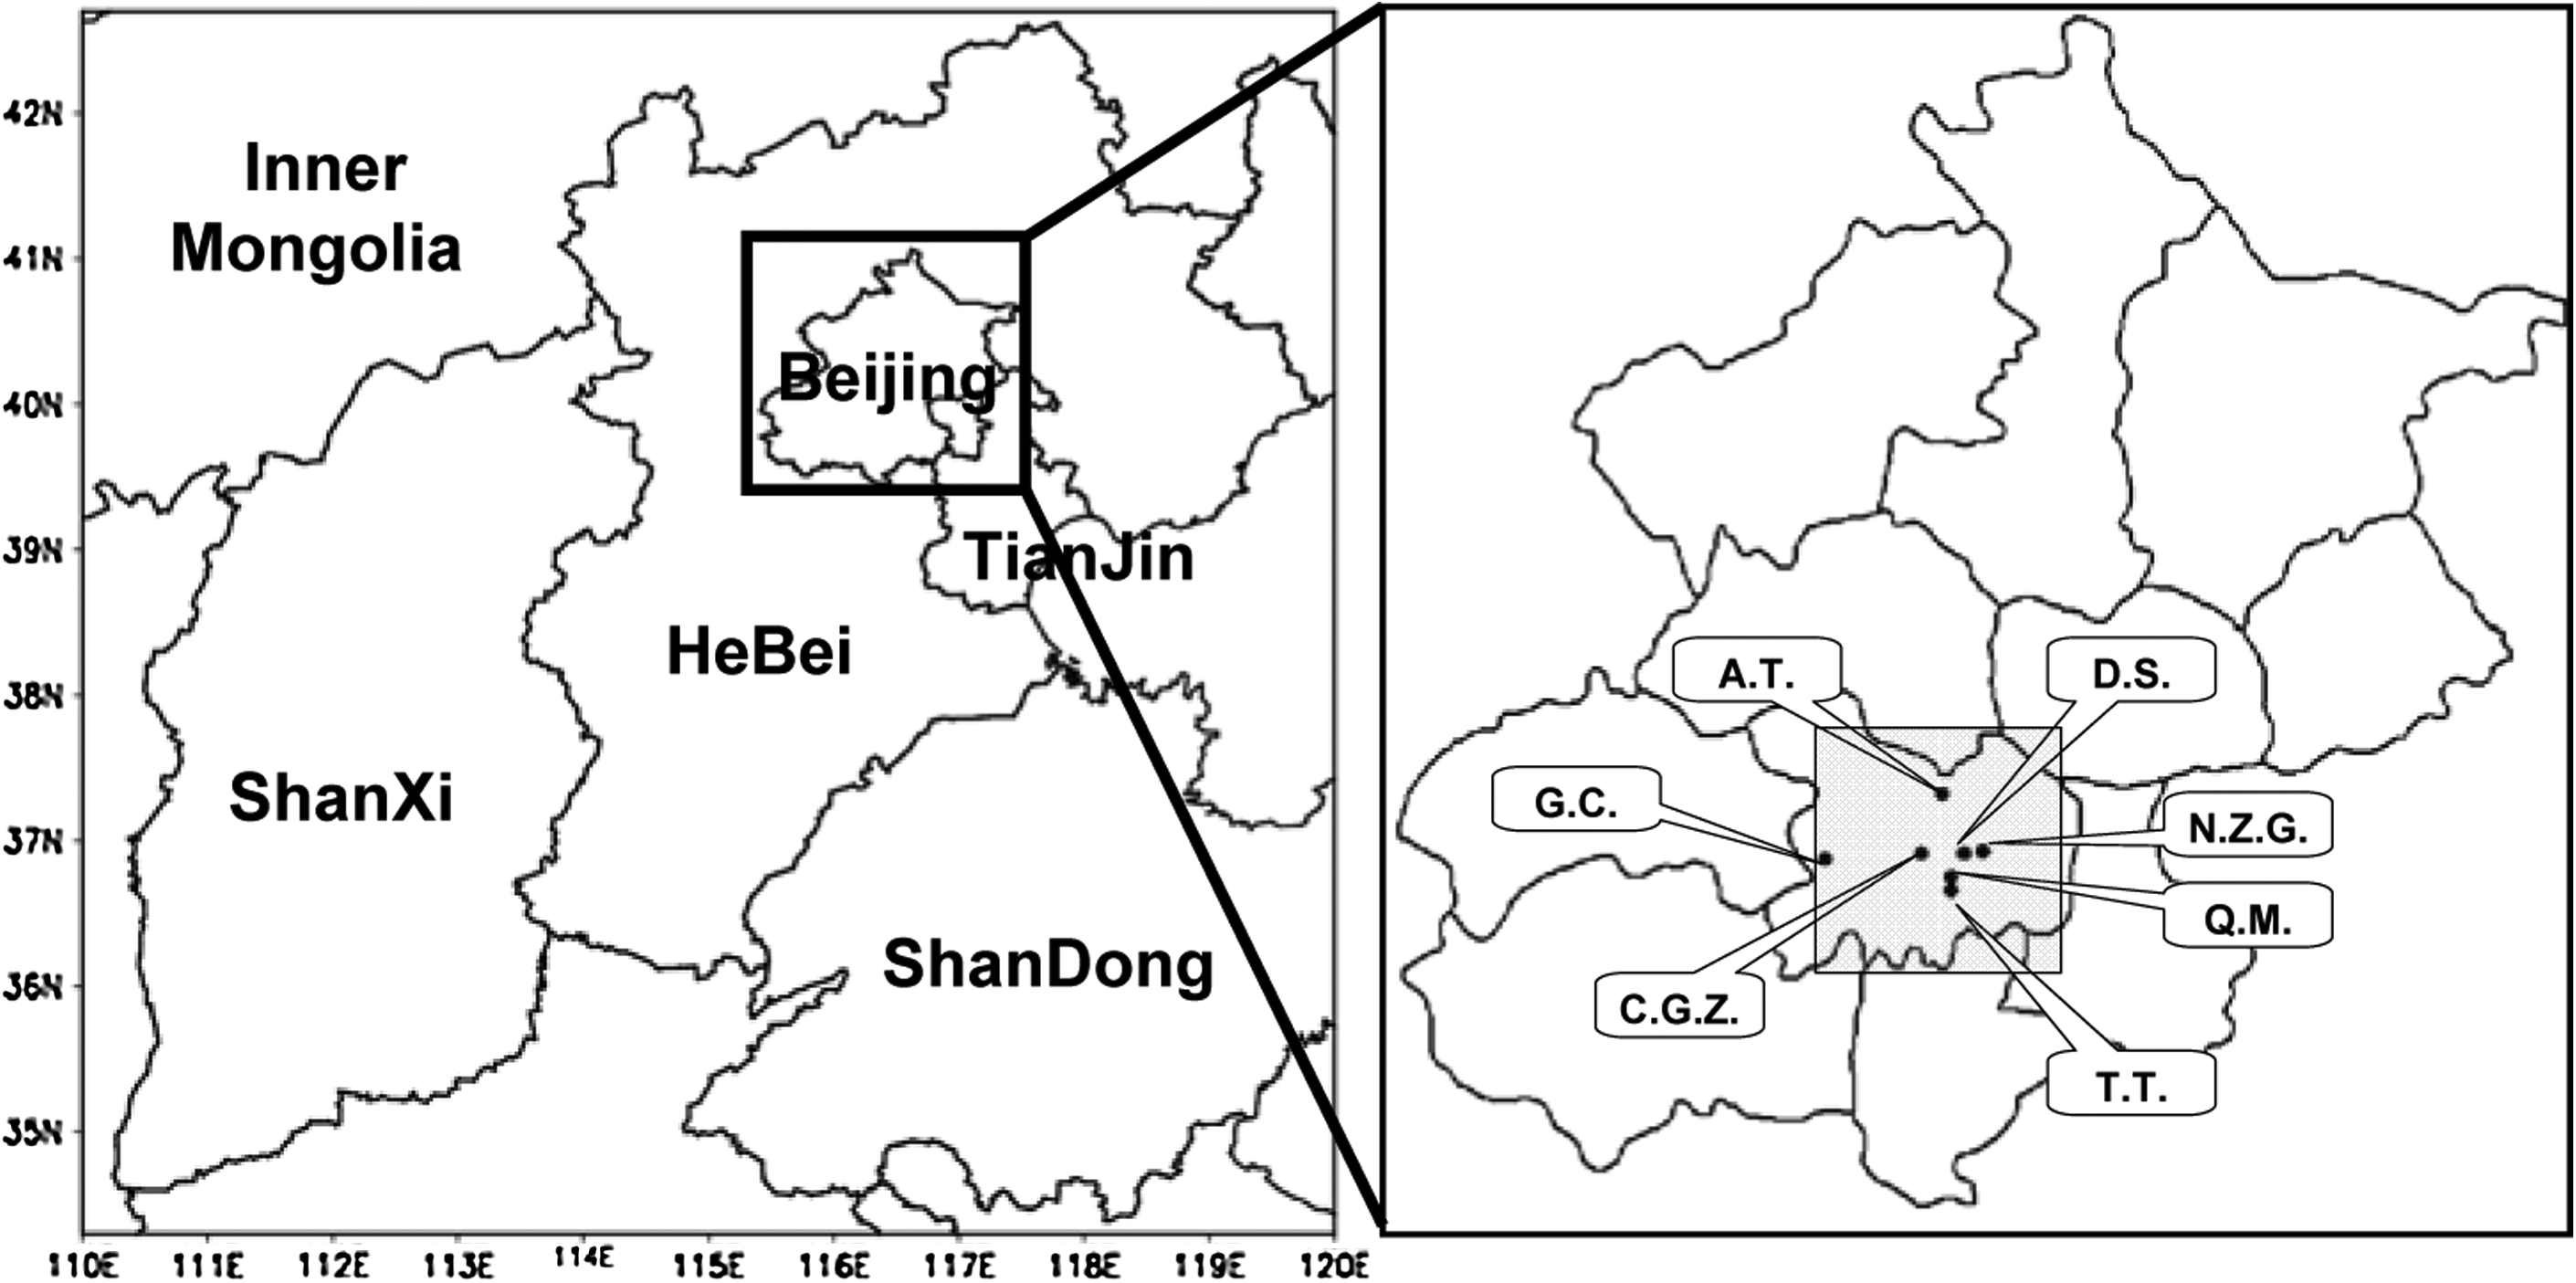
Seven selected monitoring stations in Beijing.
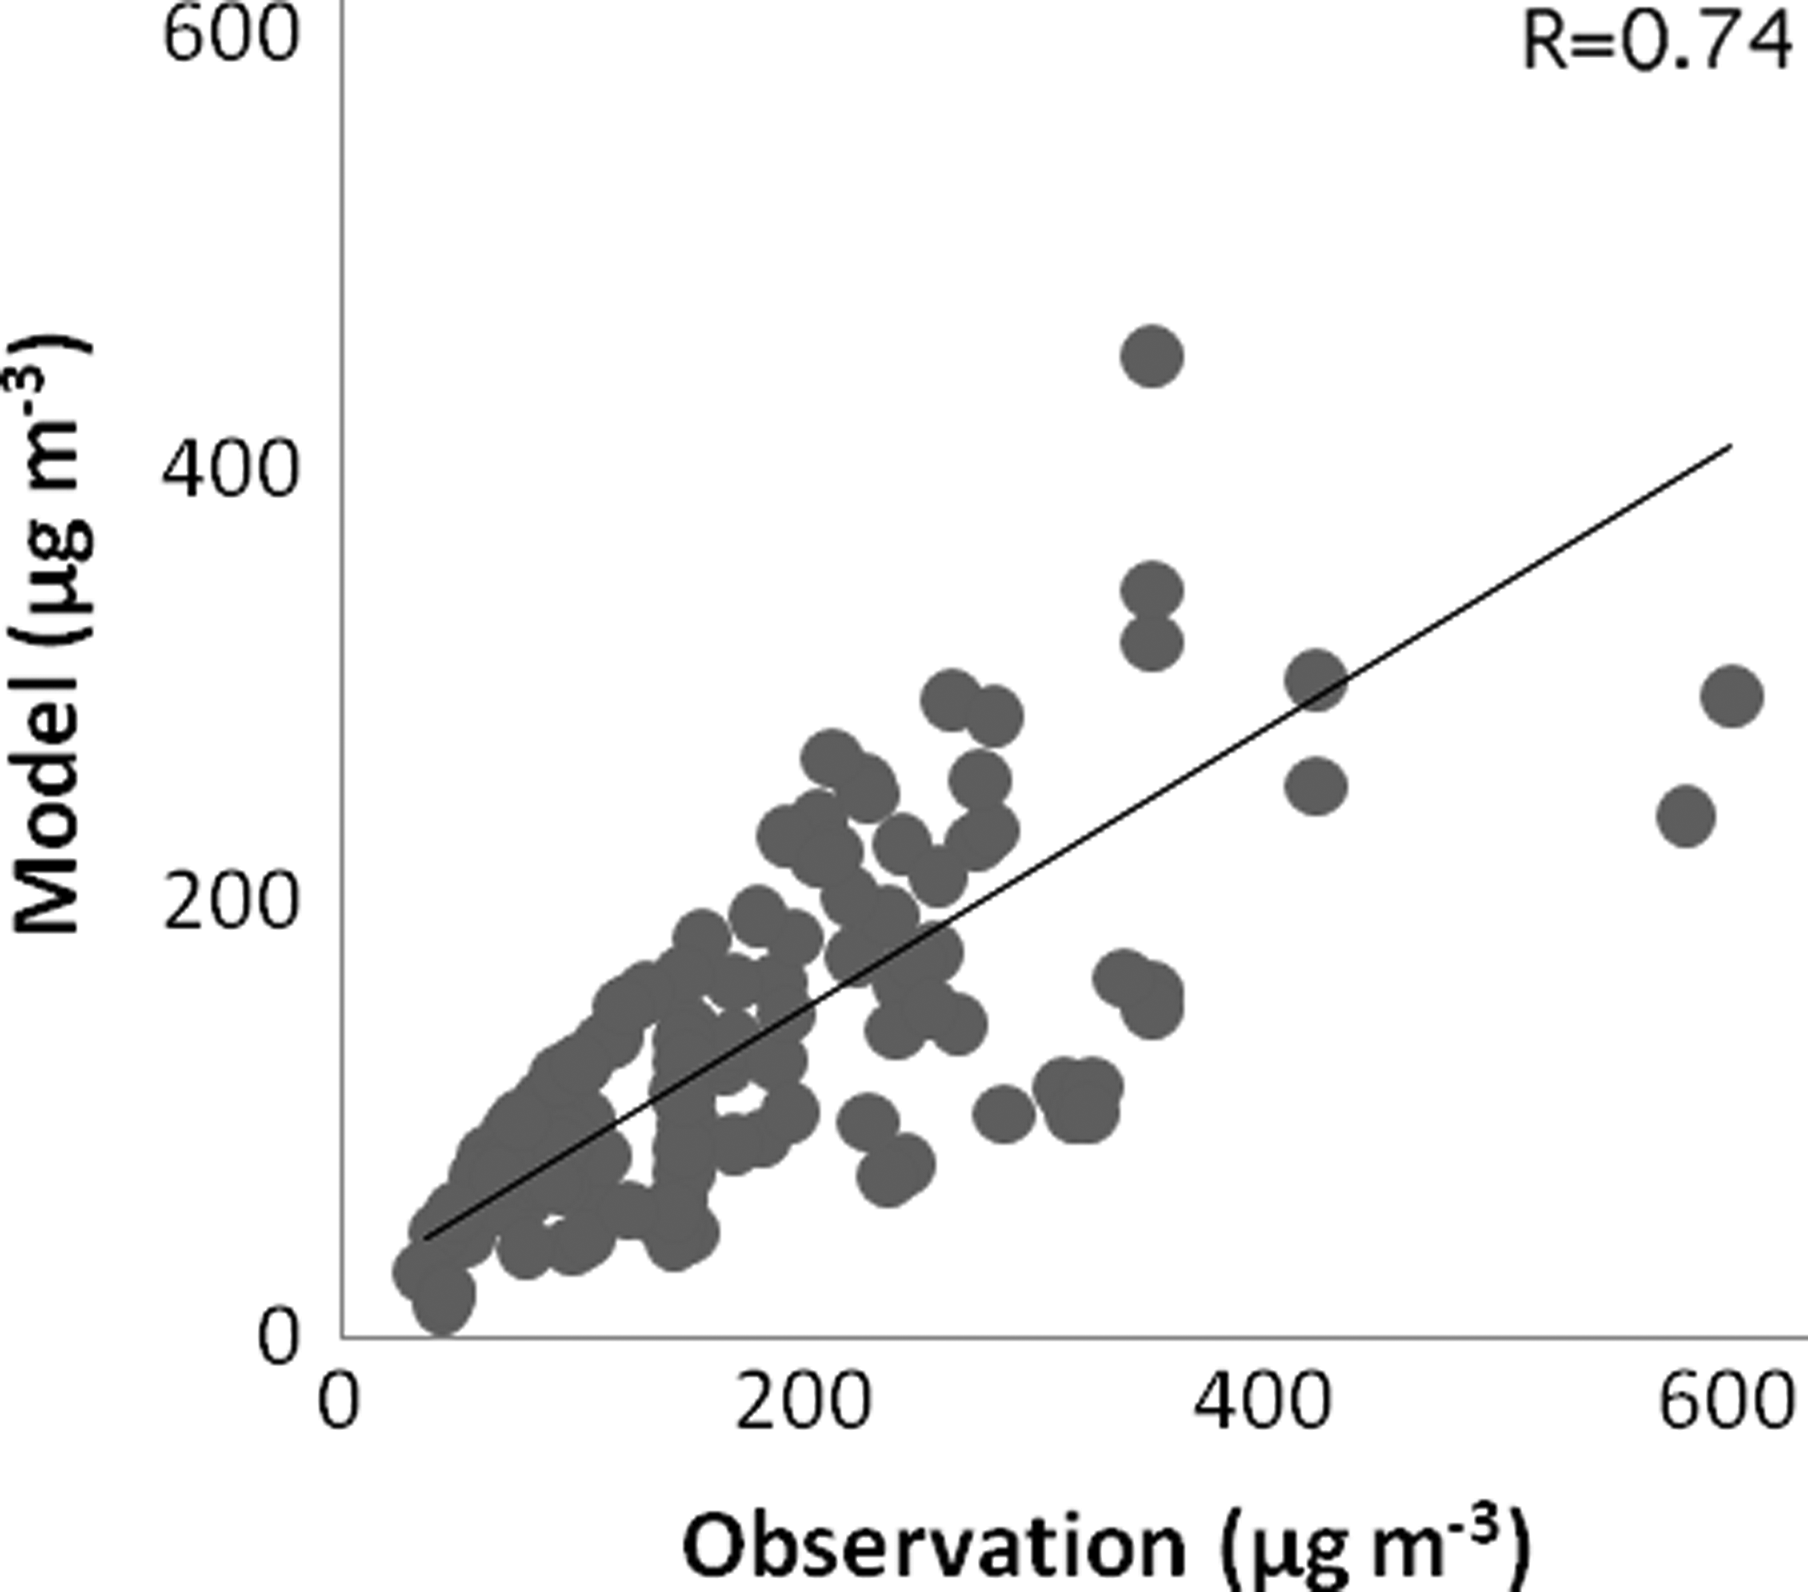
Scatter plots of simulated versus observed PM10 concentration for the target months in 2006.
Simulation results and discussions
According to the National Ambient Air Quality Standard of China, PM10 standard is divided into four segments: 0–50 μg m−3 for Class I level (representing “best to good” air quality), 50–150 μg m−3 for Class II level (representing “acceptable to lightly polluted” air quality), 150–250 μg m−3 for Class III level (representing “lightly to heavily polluted” air quality), and above 250 μg m−3 for Class IV level (representing “very heavily polluted” air quality). Figure 7 presents the daily PM10 observations and the model-derived RFD contributions at Beijing in 2006.
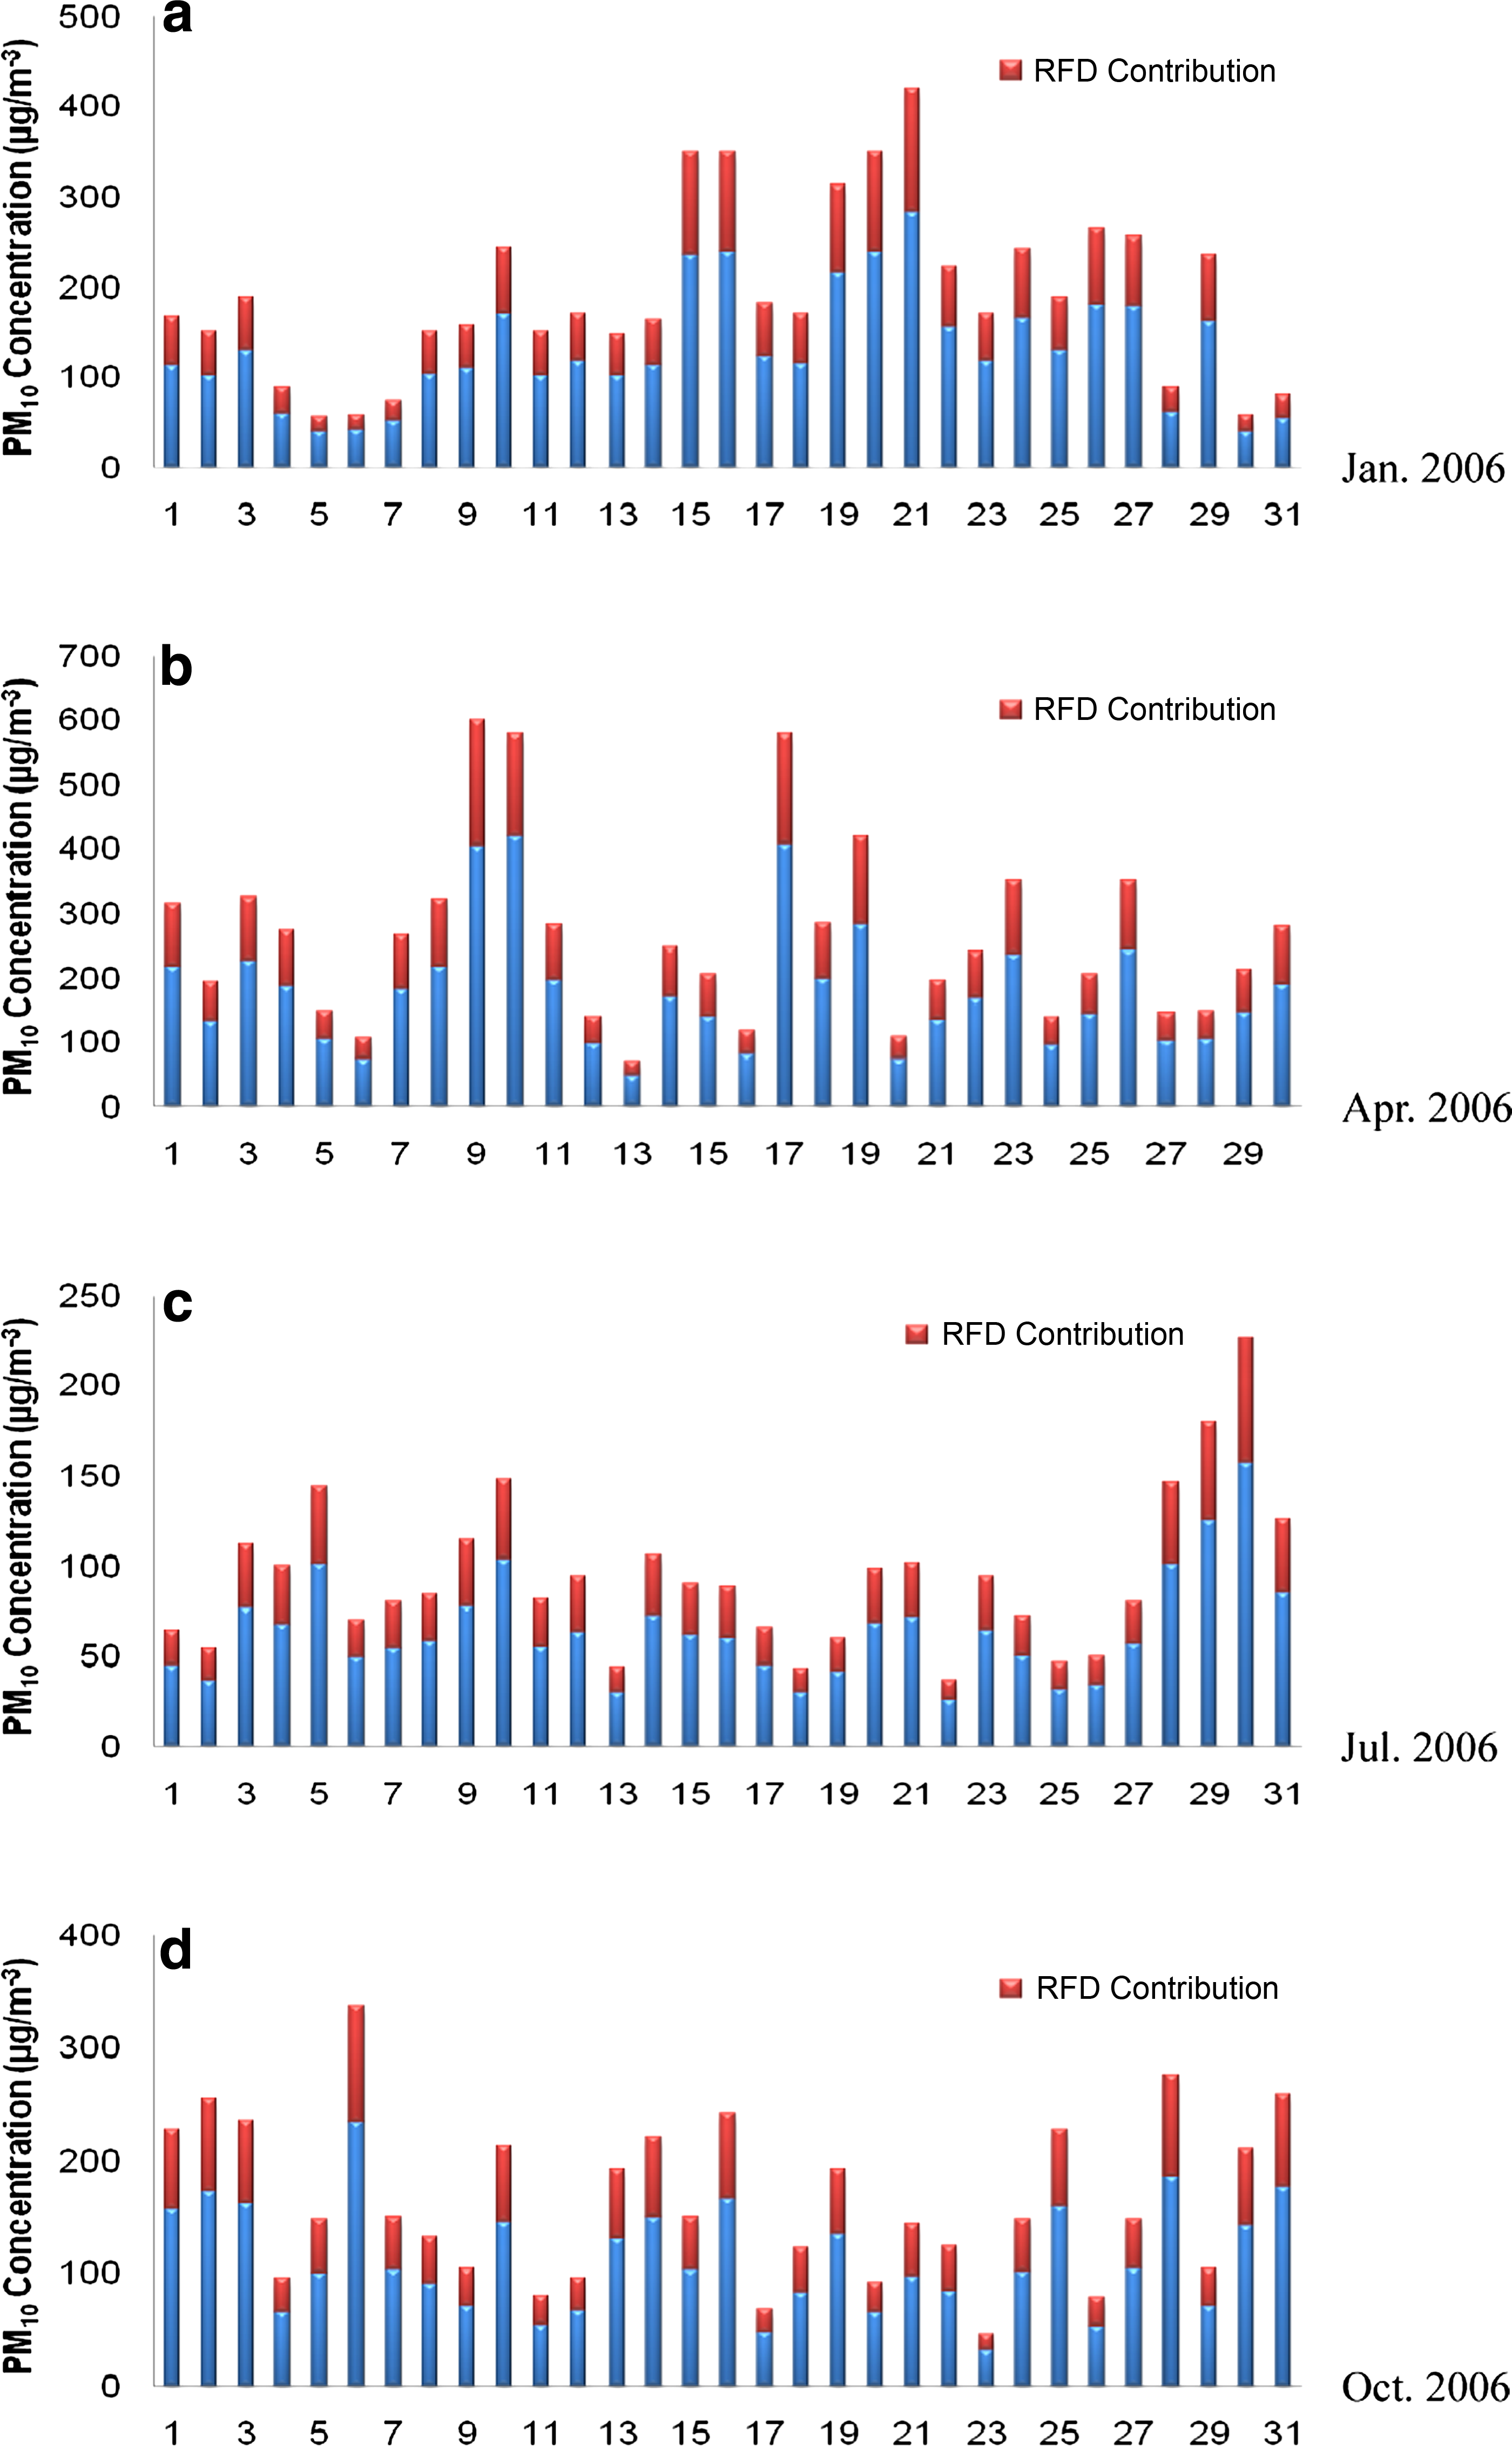
Daily PM10 observations and the RFD contributions of averaged seven monitoring stations in Beijing.
The contribution to Beijing's PM10 concentration from RFD emission was characterized by calculating the emission source contribution ratio (ESCR):
where Czres is the simulated PM10 concentration by considering all the emission sources without any reduction, and Cres is the simulated PM10 concentration after removing RFD emission source from the GIS-based emission database while without reducing other emission sources. The number of days with their monitored daily PM10 concentrations falling in each segment within each month was recorded, and the mean daily PM10 concentration contributed from RFD for each segment was calculated. The results are presented in Table 2. It is indicated that, independent of the total PM10 mass in Beijing, the absolute contribution of RFD to the total PM10 is around 36%. The variations in the PM10 concentrations are mainly caused by regional and local meteorological effects.
Figure 8 depicts the RFD-contributed monthly average PM10 concentrations for the target months of January, April, July, and October in the base year 2006. It is observed from this figure that there are obvious seasonal variations in PM10 concentration and distribution. In January, the areas with high RFD-contributed PM10 concentrations are mainly distributed in the urban districts and the southwestern and southeastern areas of Beijing, whereas the northern mountainous areas have low PM10 concentrations. Except for the effect of road network distribution, another possible reason is the fact of northerly predominant wind direction in January and the relatively weak emission strengths in the upwind directions (e.g., west and north). In April, the northern and eastern mountainous areas are associated with relatively high PM10 concentrations, but the urban districts and southwestern and southeastern areas still possess higher PM10 concentrations. This is mainly due to the impact of external PM transport (e.g., dust storms), which increased the sL on the road. In July and October, the average PM10 concentrations are slightly lower than those in April. Particularly, the concentration in July is the lowest among those during all the target months, and this is mainly due to the effect of more precipitation in the summer season. Figure 9a presents the average RFD-contributed PM10 concentrations of the four target months. It is found that the urban districts and the southwestern areas of Beijing are associated with high PM10 concentrations.
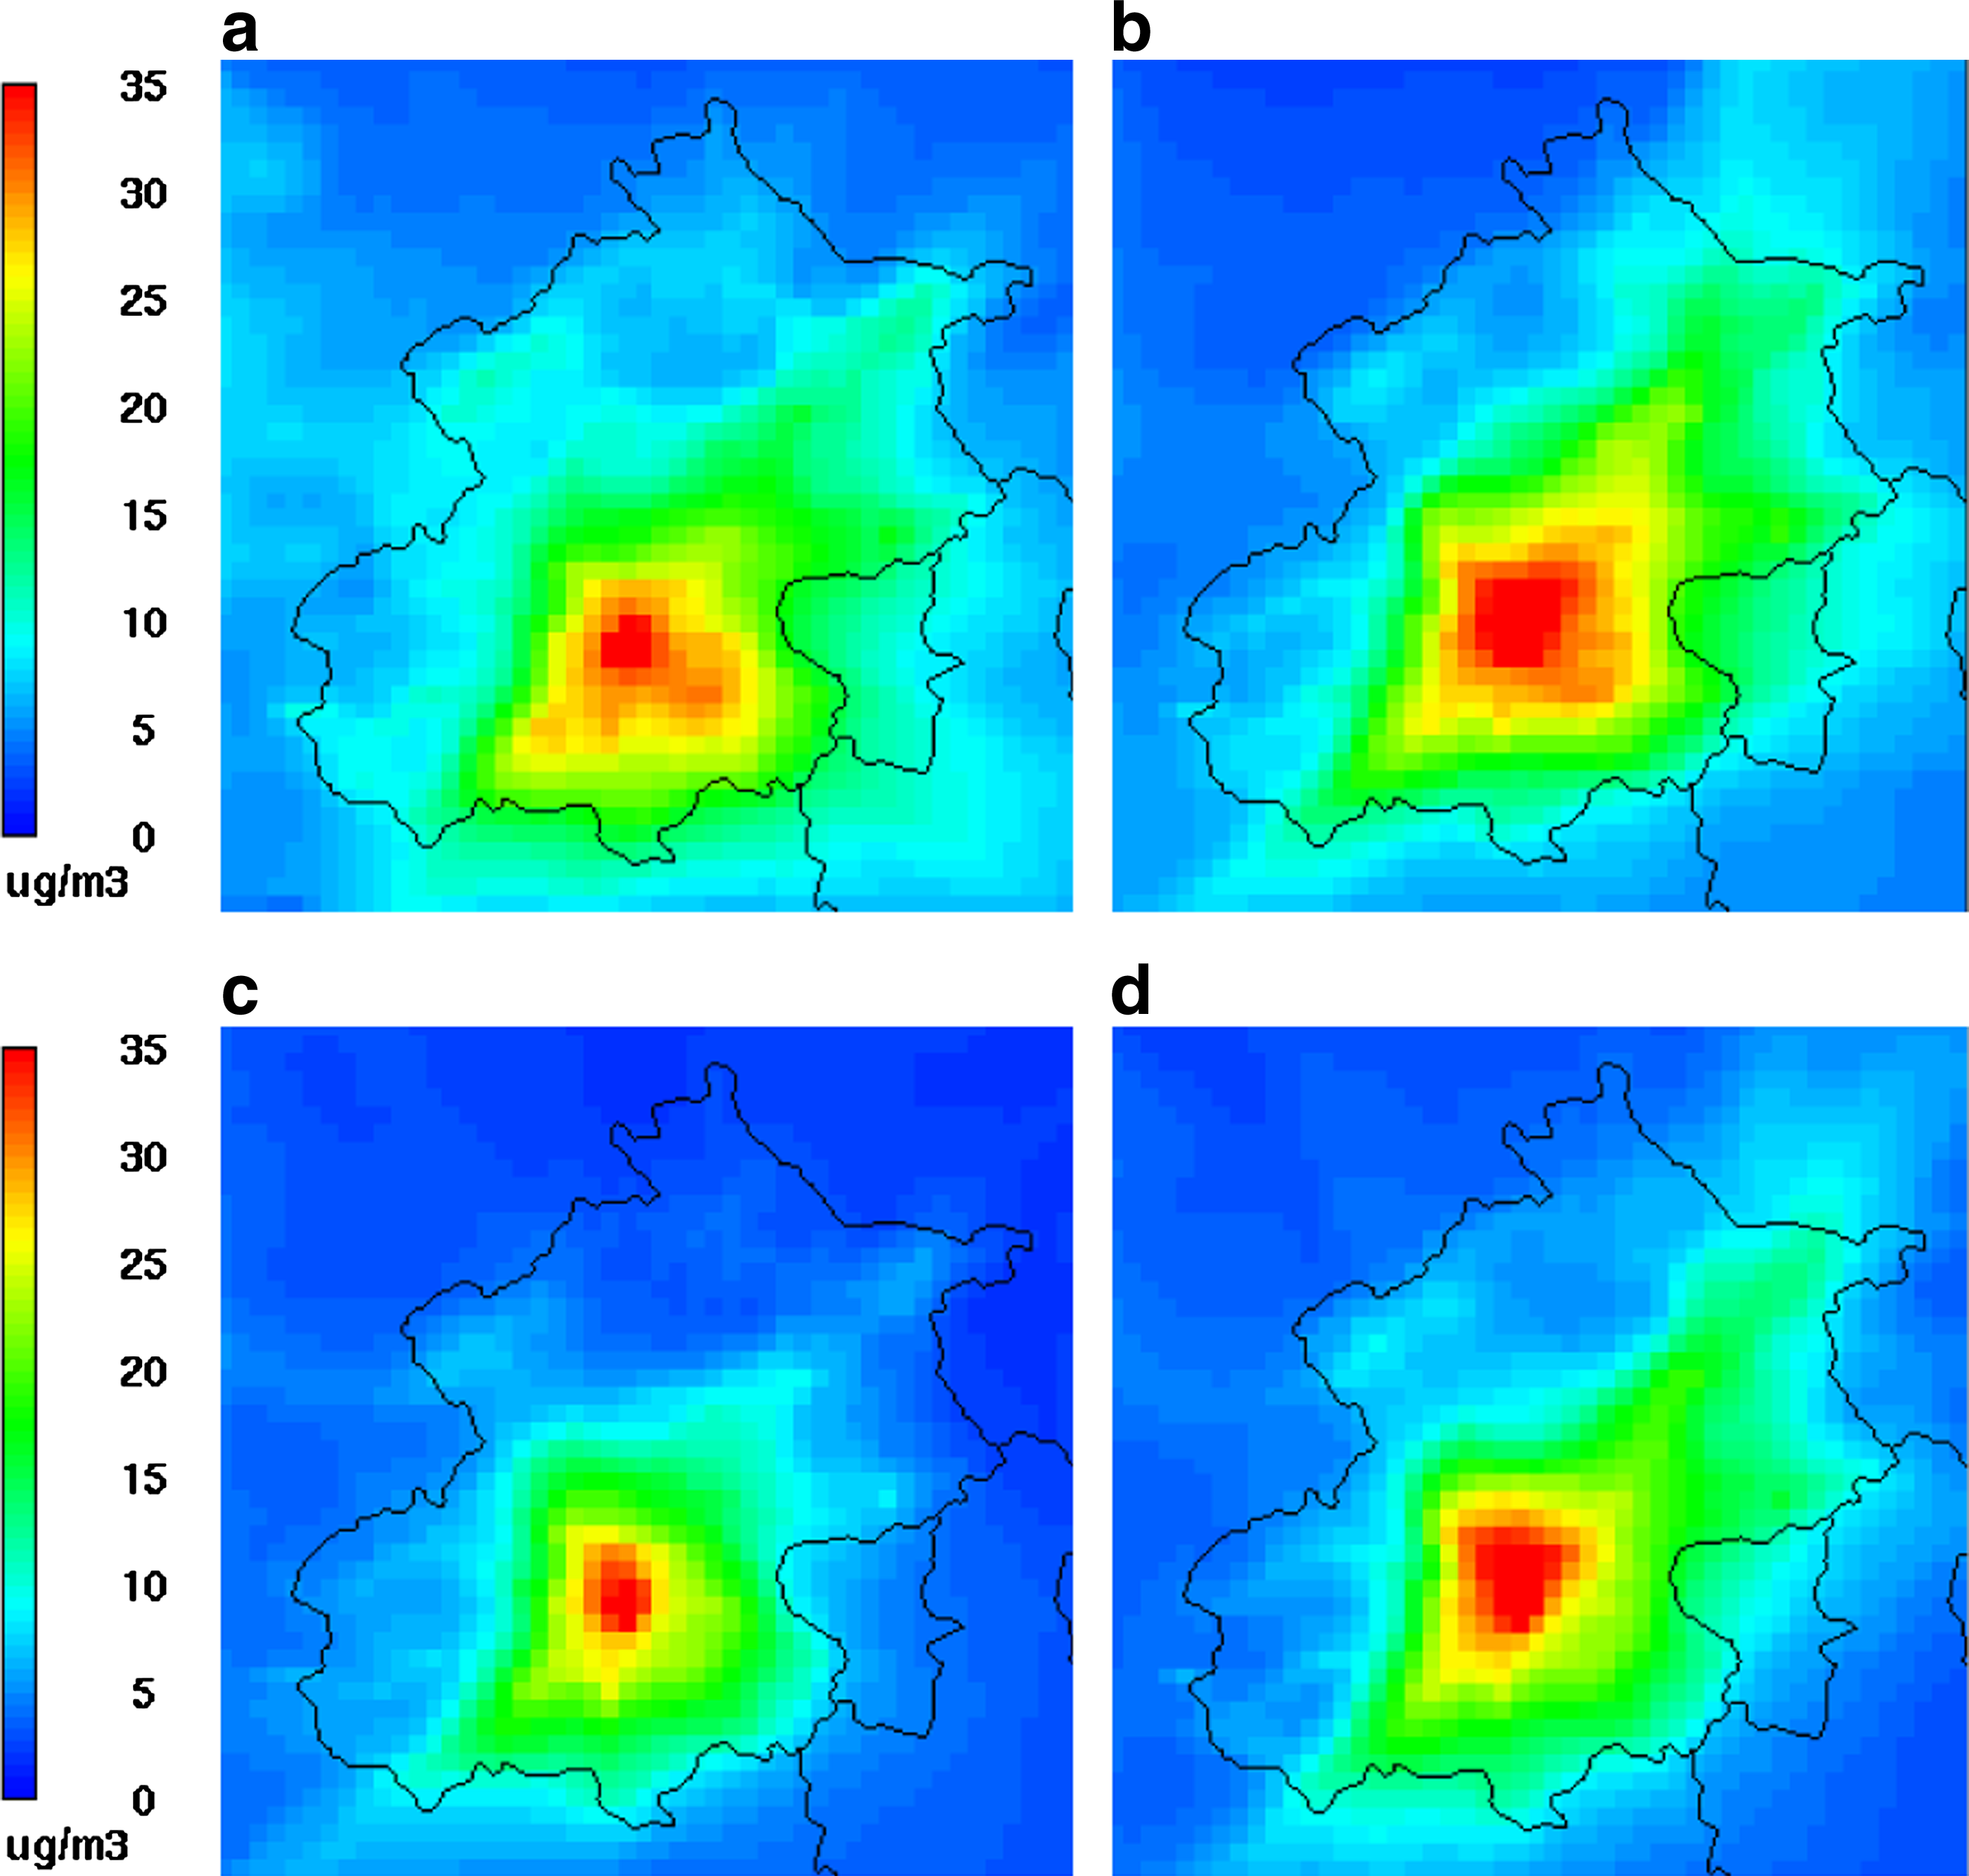
RFD-contributed monthly average PM10 concentrations for target months of January, April, July, and October in the base year 2006.
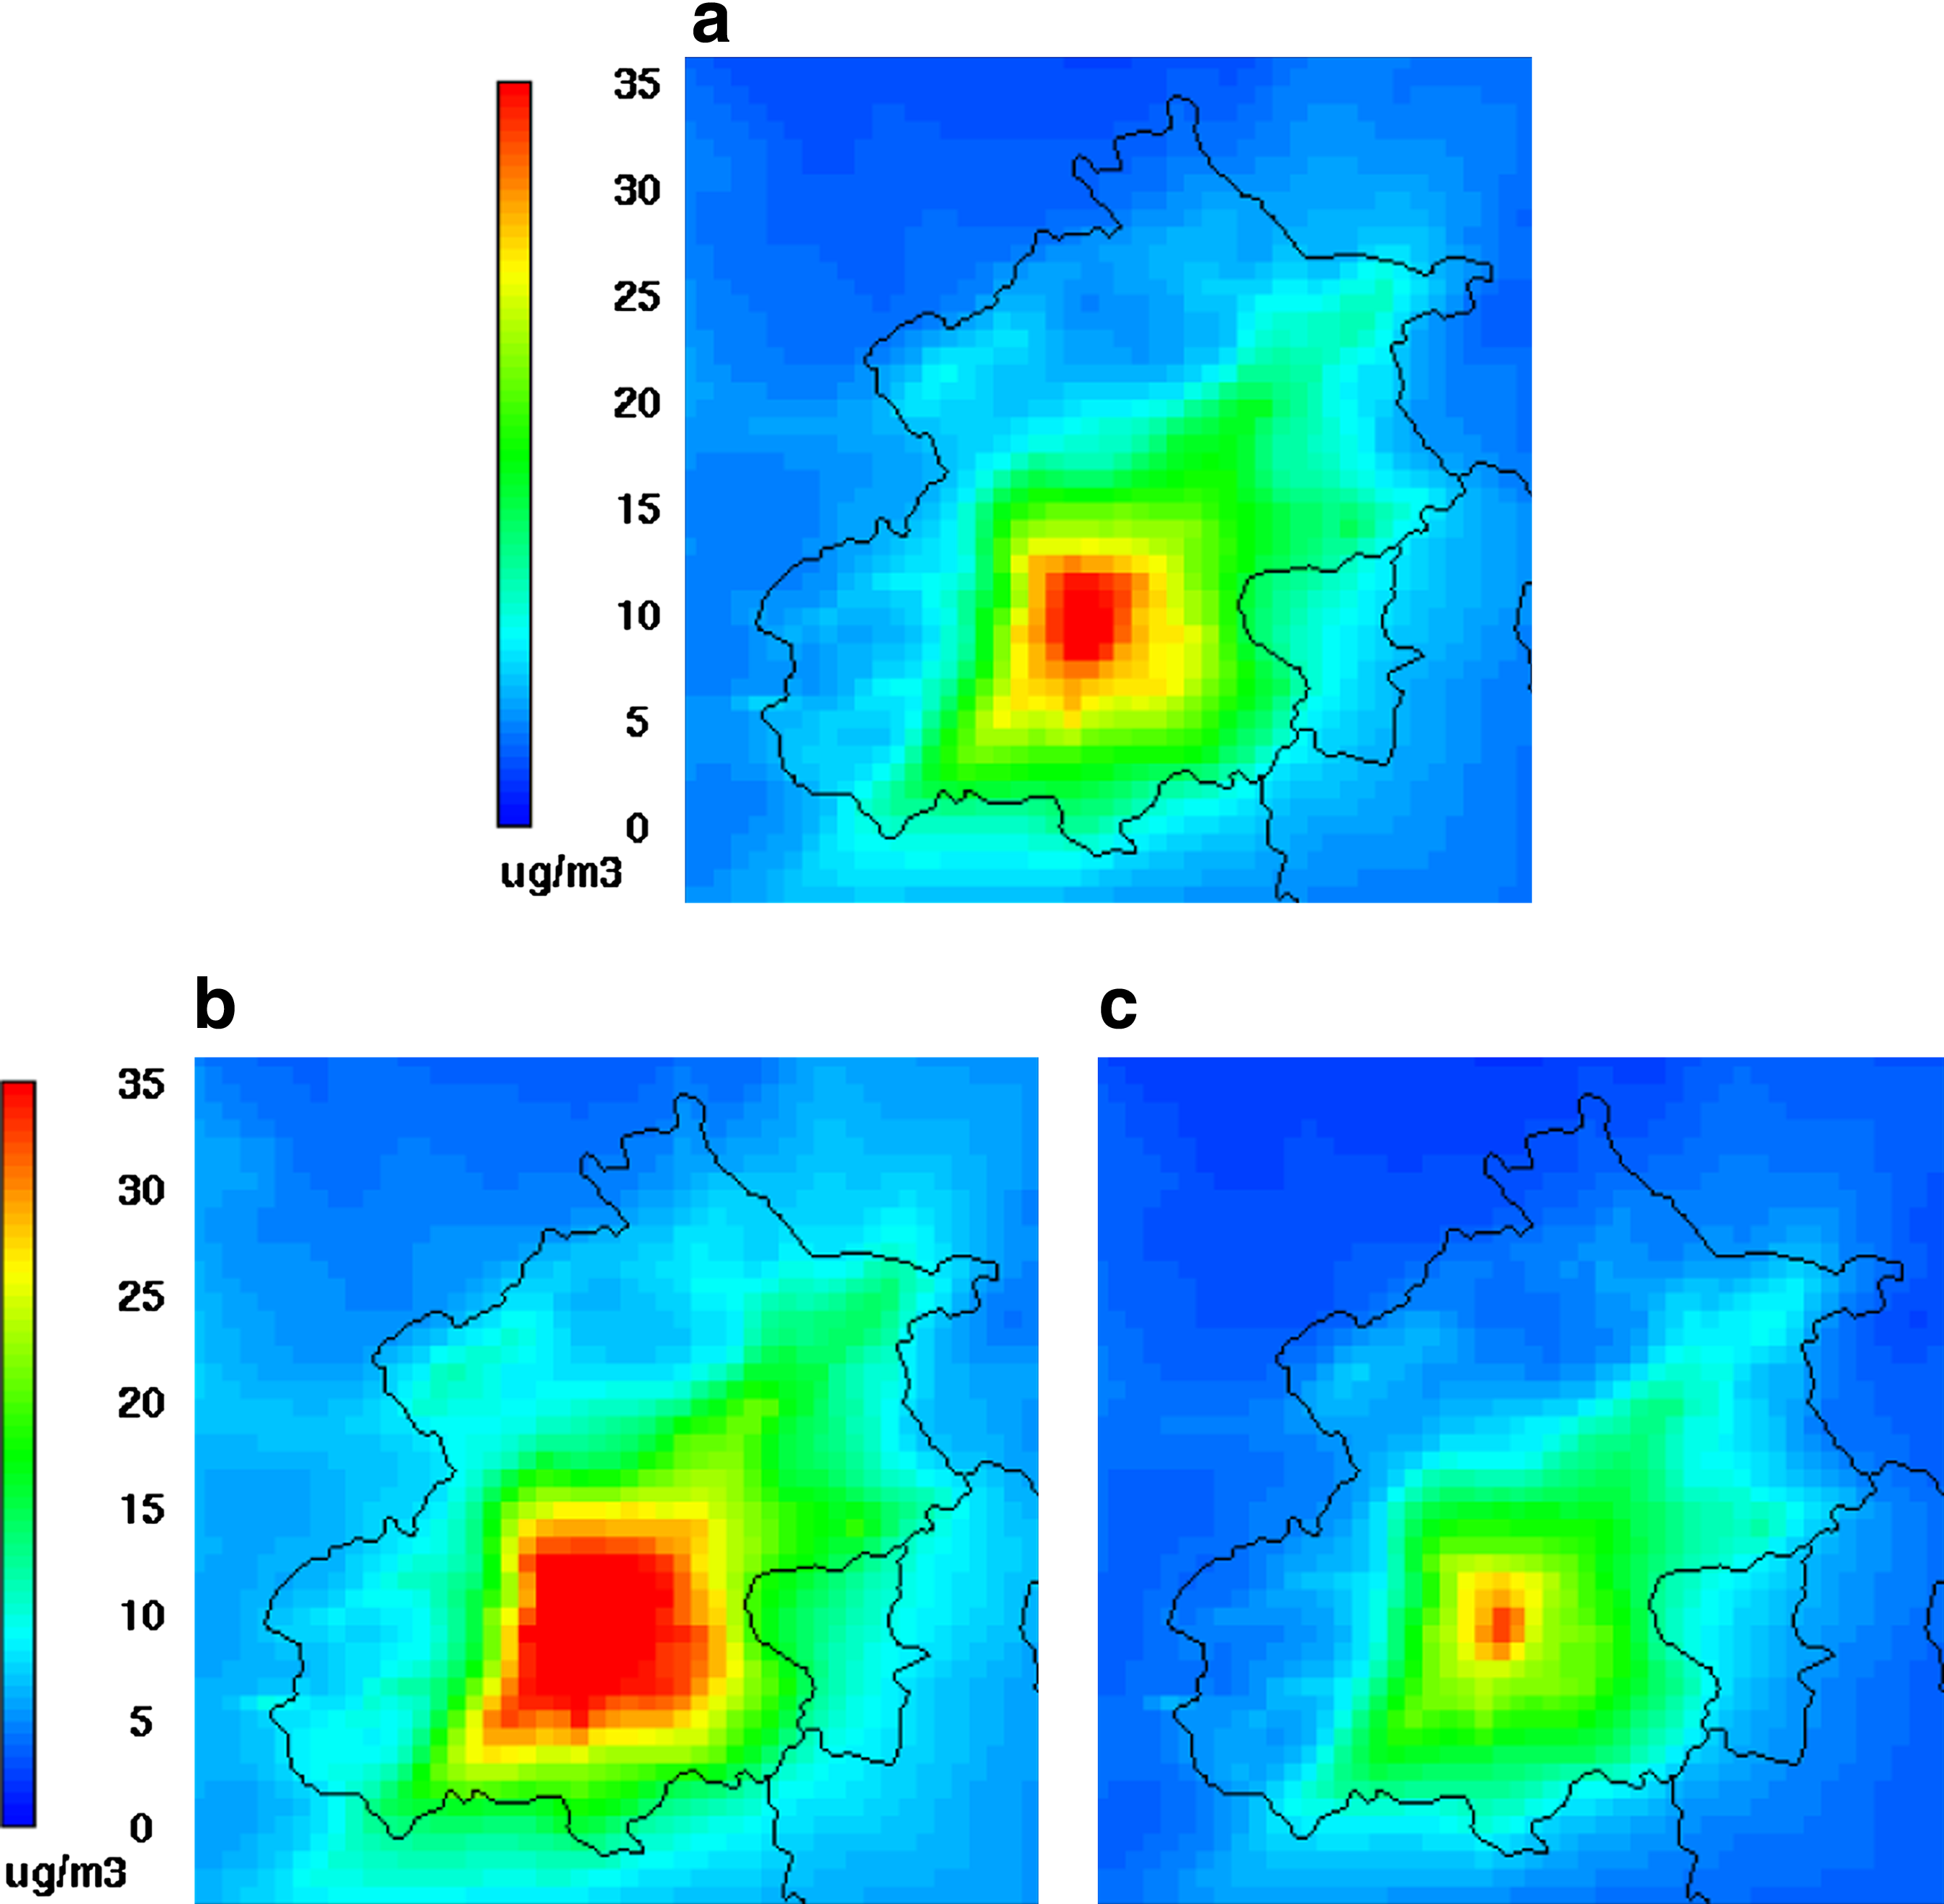
RFD-induced four-target-month-averaged PM10 concentrations in 2006 and 2010 under baseline and attainment scenarios.
The simulation results of the baseline and attainment future scenarios are depicted in Fig. 9b, c. Under baseline scenarios, no future control measures are taken into account, but the growth of future road length and the number of vehicles are considered. It is found from Fig. 9b that the RFD-induced PM10 concentrations increased dramatically, and high PM10 concentrations are found to not only be associated with the urban districts and the southwestern areas of Beijing, but also extend to the northeastern directions. On the other hand, when the RFD control measures are effectively carried out, this trend reverses considerably. Figure 9c shows the simulation results under attainment scenarios. It can be found in Fig. 9c that when the RFD control measures proposed by the municipal government are implemented, the RFD-induced PM10 concentrations drop sharply, even with the growth of future road length and of the number of vehicles considered. Table 2 presents the effectiveness of the control measures quantitatively.
In recent years, although Beijing has taken various measures to improve its air quality and significant improvements in air quality have been achieved since late 1990s, the particulate matter pollution remains at a high level and the government's efforts have been challenged by the restrictions of meteorological conditions and pollutant emission sources. There is a high occurrence frequency (e.g., 40%) (Cheng and Chen, 2006) of unbeneficial meteorological conditions for pollutant dispersion, and there are slight variations in such occurrence among years. Therefore, based on the relative contributions of emission sources to the ambient pollutant concentrations, more cost-effective air quality control measures can be identified when the municipal government makes decision toward effective air quality management. The present work might have provided some pioneer researching results for this purpose.
Conclusions
In this article, an integrated ARPS–CMAQ modeling system was employed to investigate the PM10 air pollution issue in Beijing, China, with a focus on assessing PM10 pollution contributions from RFD. The RFD emission inventory for the base year 2006 was developed by the USEPA AP-42 model. The baseline and attainment scenarios in 2010 were designed based on this emission inventory. Model evaluation results (mean of the monitoring is 121.8 μg m−3, mean of the modeling is 101.3 μg m−3, RMSE is 85.1, and the correlation is 0.74) are similar to previous findings in Beijing. The results show that, independent of the total PM10 mass in Beijing, the absolute contribution of RFD to the total PM10 is around 36%. The variations in the PM10 concentrations are mainly caused by regional and local meteorological effects. Based on scenario analysis, if there are no further control measures on RFD emissions, under the same meteorological conditions of the year 2006, the number of days when Beijing's air quality is at polluted level will increase from 56 days in 2006 to 82 days in 2010 (+21%). On the other hand, when control measures are carried out, the days will decrease from 56 days in 2006 to 45 days in 2010 (−9%), although the number of vehicles and road length will also be increased at that time. Based on the results of present work, more cost-effective air quality control measures can be identified when the municipal government makes decision toward effective air quality management.
Footnotes
Acknowledgments
This work was supported by the Beijing NOVA Program of China (no. 2009B07) and the Natural Science Foundation of Beijing (no. 8092004). The authors thank the National Basic Research (973) Program Project (no. 2005CB724201) and High Technology Project (863) (nos. 2006AA06A305-4, 2006AA06A306-5, and 2006AA06A307-5) of the Ministry of Science and Technology of China for supporting this research work.
Author Disclosure Statement
No competing financial interests exist.