
Abstract
Abstract
Municipal solid waste (MSW) generation is a complex function of socio-economic characteristics, climatic factors, and public policies and strategies. This study develops a model based on the multivariate econometric approach that considers these parameters to forecast and manage the MSW. The model applies statistical tools to select suitable function and most relevant explanatory variables that have strong relationship with solid waste generation. The model applicability is demonstrated with an example of MSW generation in Mashhad, Iran. The results indicate that the number of employees, population, household income, and temperature are significant variables of MSW generation in Mashhad. Socio-economic variables have been evaluated so far, but the impact of climatic factors is not considerably assessed in the previous studies. Thus, in this study, for the first time, the impact of temperature as a significant variable on MSW generation is assessed. The developed model can be used for forecasting the values of disposal waste in the study area. Therefore, by determining the quantity of the disposal waste, decision making for the investment required for machinery, transition stations, disposal capacity, and the required field for sanitary landfills in the study area is more feasible.
Introduction
Conventional forecasting methods for solid waste generation usually depend on the socio-economic factors on a per-capita basis. Tanskanen and Melanen (1999) used a computer model, Tool for Analyzing Separation Actions and Recovery, to study recovery levels reached by different separation strategies in Finland. The model includes a special method that was developed for the analysis of interdependence between the on-site obligation limits and the coverage of on-site collection systems. Fabricino (2001) proposed a mathematical model for managing solid waste production. Dyson and Chang (2005) extended such considerations by including the impacts of population, income level, and the dwelling unit size in a linear regression model. Their study presents a new approach—system dynamics modeling—for the prediction of solid waste generation in a fast-growing urban area based on a set of limited samples.
Up to now, most of these decision support tools for waste management planning used the amount of waste generation as the given input parameter (White et al., 1999; Björklund, 2000). Thus, the impacts of demographic, social, and economic variables as well as other factors (e.g., consumption patterns or climate changes) were not taken into account. Salhofer (2000) developed a model for estimating the rate of commercial and industrial waste in Vienna. In his study, the number of employees was considered a significant factor, as the values of commercial solid waste production were fluctuated by changing the level of employment. Beigl et al. (2004) estimated a model for European cities by considering some explanatory variables such as GDP, infant mortality rate, and household size. Ojeda Benítez et al. (2008) predicted residential solid waste by developing a linear model with explanatory variables such as education, income per household, and number of residents. Beigl et al. (2008) provided a review of the literature regarding the developed models to estimate the waste generation to classify the models according to these criteria, such as regional scale, modeled waste streams, and independent variables and methods. Sudhir et al. (1997) described household income impacts on waste generation directly, but Saltzman et al. (1993) believed that an increase in household income led to more participation in recycling programs. Therefore, by reviewing the previous research, it can be concluded that a comprehensive evaluation of socioeconomic and, particularly, climatic variables has not been performed so far.
In this article, in the first step, different data sets for socio-economic and climatic factors based on the significance, predictability, and the existence of data records were selected. Next, econometric models for solid waste generation were estimated. Then, the best fitted model according to the statistical criteria was chosen. Finally, sensitivity of each explanatory variable was evaluated. This article concludes by identifying the empirical limitations of the multivariate regression models for predicting solid waste.
Methodology
In this study, a multivariate regression model was developed to estimate solid waste production and to analyze the effects of management measures in urban systems. This model can accommodate the monthly data series in the analysis. Therefore, monthly time series datasets were processed by applying the correlation analysis between dependent and independent variables to determine the most significant factors. After determining the main variables, models were developed by using an ordinary least square method and applying econometric software, Eviews7. Applicability of the models was depicted using data from the city of Mashhad, Iran, and sensitivity of each variable was determined by evaluating the elasticities. The developed models can be utilized for the future forecasting of solid waste generation.
Model variables and the correlation analysis
The multivariate waste generation model can use variables that directly or indirectly affect the waste production in a site-specific condition. These variables may be socioeconomic, climatic, or policy-related factors. Monthly time series for the years 2000–2009 are provided for the household income, population, and maximum temperature.
Correlation analysis is carried out, and the partial correlation between dependent and independent variables is conducted. The importance of the explanatory variable depends on the correlation rate. Another issue that should be taken into account is multi-collinearity, because it can cause spurious regression as to which model coefficients are significant. If the correlation among explanatory variables is >0.95, one of them should be omitted to avoid the multi-collinearity phenomenon.
Model estimation
The general form of the solid waste generation model is as follows:
where SW is the generated solid waste in ton, and X1 to Xn are different socioeconomic and climatic variables. The values of the coefficients are obtained through multi-linear regression analysis. Two popular functional forms used for estimating the model are as follows:
Linear model:
Log-Log model:
After estimating the models, sensitivity of each variable will be assessed. In economics, elasticity is the ratio of the percent change in one variable to the percent change in another variable. It is a tool for measuring the responsiveness of a function to changes of parameters used in a unitless way. In empirical work, elasticity is the estimated coefficient of a Log-Log model. Log transformation enabled interpretation of each fitted model parameter as an elasticity, or the percent change in per-unit of dependent variable caused by a one percent change in each parameter's associated explanatory variable (Greene, 2007). Generally, elasticity of dependent variable y with regard to the independent variable X is yielded from equation 4.
The values of the coefficients are estimated through the multiple regression models and applying time series data as input and output variables.
Model selection criteria
The estimated models should be in accordance with the real conditions. The estimating procedure should be corrected, and the model coefficients must be significant. High values of R2 and proximity of the values of R2 and R2adjusted provides the theoretical expectations. p-values and t-statistics depict the significance of each variable. Auto correlations are detected through Durbin-Watson test. To prevent heteroskedasticity (differing variances), tests such as White-test should be applied to the model. To avoid the multi-collinearity phenomenon, correlation analysis between different pairs of independent variables should be conducted (Gujarati, 1992; Kostas and CHrysostomos, 2006). To assess the cointegration, a popular statistical property in time series data, Augmented Dicky Fuler unit root test, should be applied to the variables and residuals of the estimated model. Sum of the square error, Akaike info criterion and Schwarz criterion, can be used to illustrate the fitness of the estimated models in comparison to actual data. Lower values of Akaike info and Schwarz criterion illustrate higher fitness of the estimated model (Greene, 2007).
Model Application: A Case Study of Mashhad, Iran
Case study
Mashhad is the second largest city in Iran and one of the holy cities in the Shia Muslim world. It is located 850 km east of Tehran, at the center of Khorasan-Razavi province, which is close to the Iran borders, with Afghanistan and Turkmenistan and has a population of 2,427,316 according to the 2006 population census. Mashhad features a steppe climate with hot summers and cold winters. The city only sees about 250 mm of precipitation per annum. Summers are typically hot and dry, where the average maximum temperature sometimes exceeds 35°C. Figure 1 indicates the geographical location of Mashhad in Iran.

Geographical location of Mashhad in Iran.
Data
Numerous factors impact the values of disposal waste. Factors applied here are selected based on the availability and predictability of the data records. These factors include socio-economic and climatic factors. Monthly data sets for these variables are provided for the years 1999–2009. These data sets are achieved from Statistics and Meteorological organizations of Mashhad, Iran. The characteristics of the observation data sets are illustrated in Table 1.
Results
Correlation analysis
Variables that affect waste production are categorized in three groups, including social (population, number of employees, and household size), economic (real household income, GDP), and climatic factors (precipitation and temperature). These socio-economic and climatic variables are highly correlated with each other; thus, in this study, to avoid multicollinearity, only one parameter from each category is included in the model (Ordóñez-Ponce et al., 2006). Therefore, variables with high correlation with the dependent variable and low correlation with the other independent variables are selected. When the correlation coefficient exceeds 0.7 in each group, one of the variables should be selected for developing waste generation models (Mason et al., 1999). The results of this analysis are as follows:
Economic variables
To control harmful substances, authorities might increase the charges that each household has to pay in response to the services received from municipalities. This increase in charges should be proportional and rational to the household's income and can change the waste production rate. Economic growth and increasing income can change the rate of solid waste generation. Hockett et al. (1995) found that income is an influential factor in solid waste generation. Chung (2010a) also believed that the income level of individual waste generators is a variable that generally has no good source of data, and obtaining the permission of collecting these data is generally difficult. Therefore, other proxies can be utilized instead. Joutz (1996) applied the ratio of two national-level economic indices to approximate the real incomes. In this study, household expenditure was applied as an indicator of income. The ratio of household expenditure and consumer price index leads to real income.
It can be interpreted from Table 2 that economic variables are highly correlated with each other. To prevent the multi-collinearity phenomenon, the variables that are highly related to solid waste should be selected. Therefore, real household income is chosen due to the higher correlation with solid waste production.
GDP, gross domestic product; SW, solid waste.
Social variables
Similar to the economic factors, changes in social variables such as increasing or reducing in population or in household size can influence waste production. In this article, similar to the study of Dennison et al. (1996b) and Beigl et al. (2004), the average household size and MSW have a reverse relationship. Household size and population are highly correlated. Thus, for preventing multicollinearity, population is selected for the model estimation, as it has been considered to be one of the most important variables affecting total waste disposal rate (McBean and Fortin, 1993). It is obvious in Table 3 that this factor is highly related with solid waste generation. Bach et al. (2004) and Gay et al. (1993) found that the scale of employment can be a good predictor of commercial waste, as the results in Table 3 confirms this.
Climatic factors
Changes in weather conditions such as temperature can cause changes in consumption pattern of households and lead to changes in solid waste production. The rate of precipitation can impact the values of solid waste generation, especially in stationary open containers that are located in every street as temporary containers for disposal solid waste and are subjected to rainfall. Mashhad has a steppe climate and receives low annual precipitation. So, it can be concluded that participation does not influence waste generation considerably. The correlation between precipitation and solid waste amounts confirms the previous claims.
Chung (2010a) believed that weather can influence solid waste generation in Hong Kong. In Mashhad, consumption of heavy and bulky fruits, such as watermelon, melon, and some other vegetables, in the hot season increases extremely because of vast cultivation, low cost, and availability of these fruits. Therefore, an increase in the amount of biodegradable solid waste will happen. The results of correlation in Fig. 2 and Table 4 are testaments to this fact.
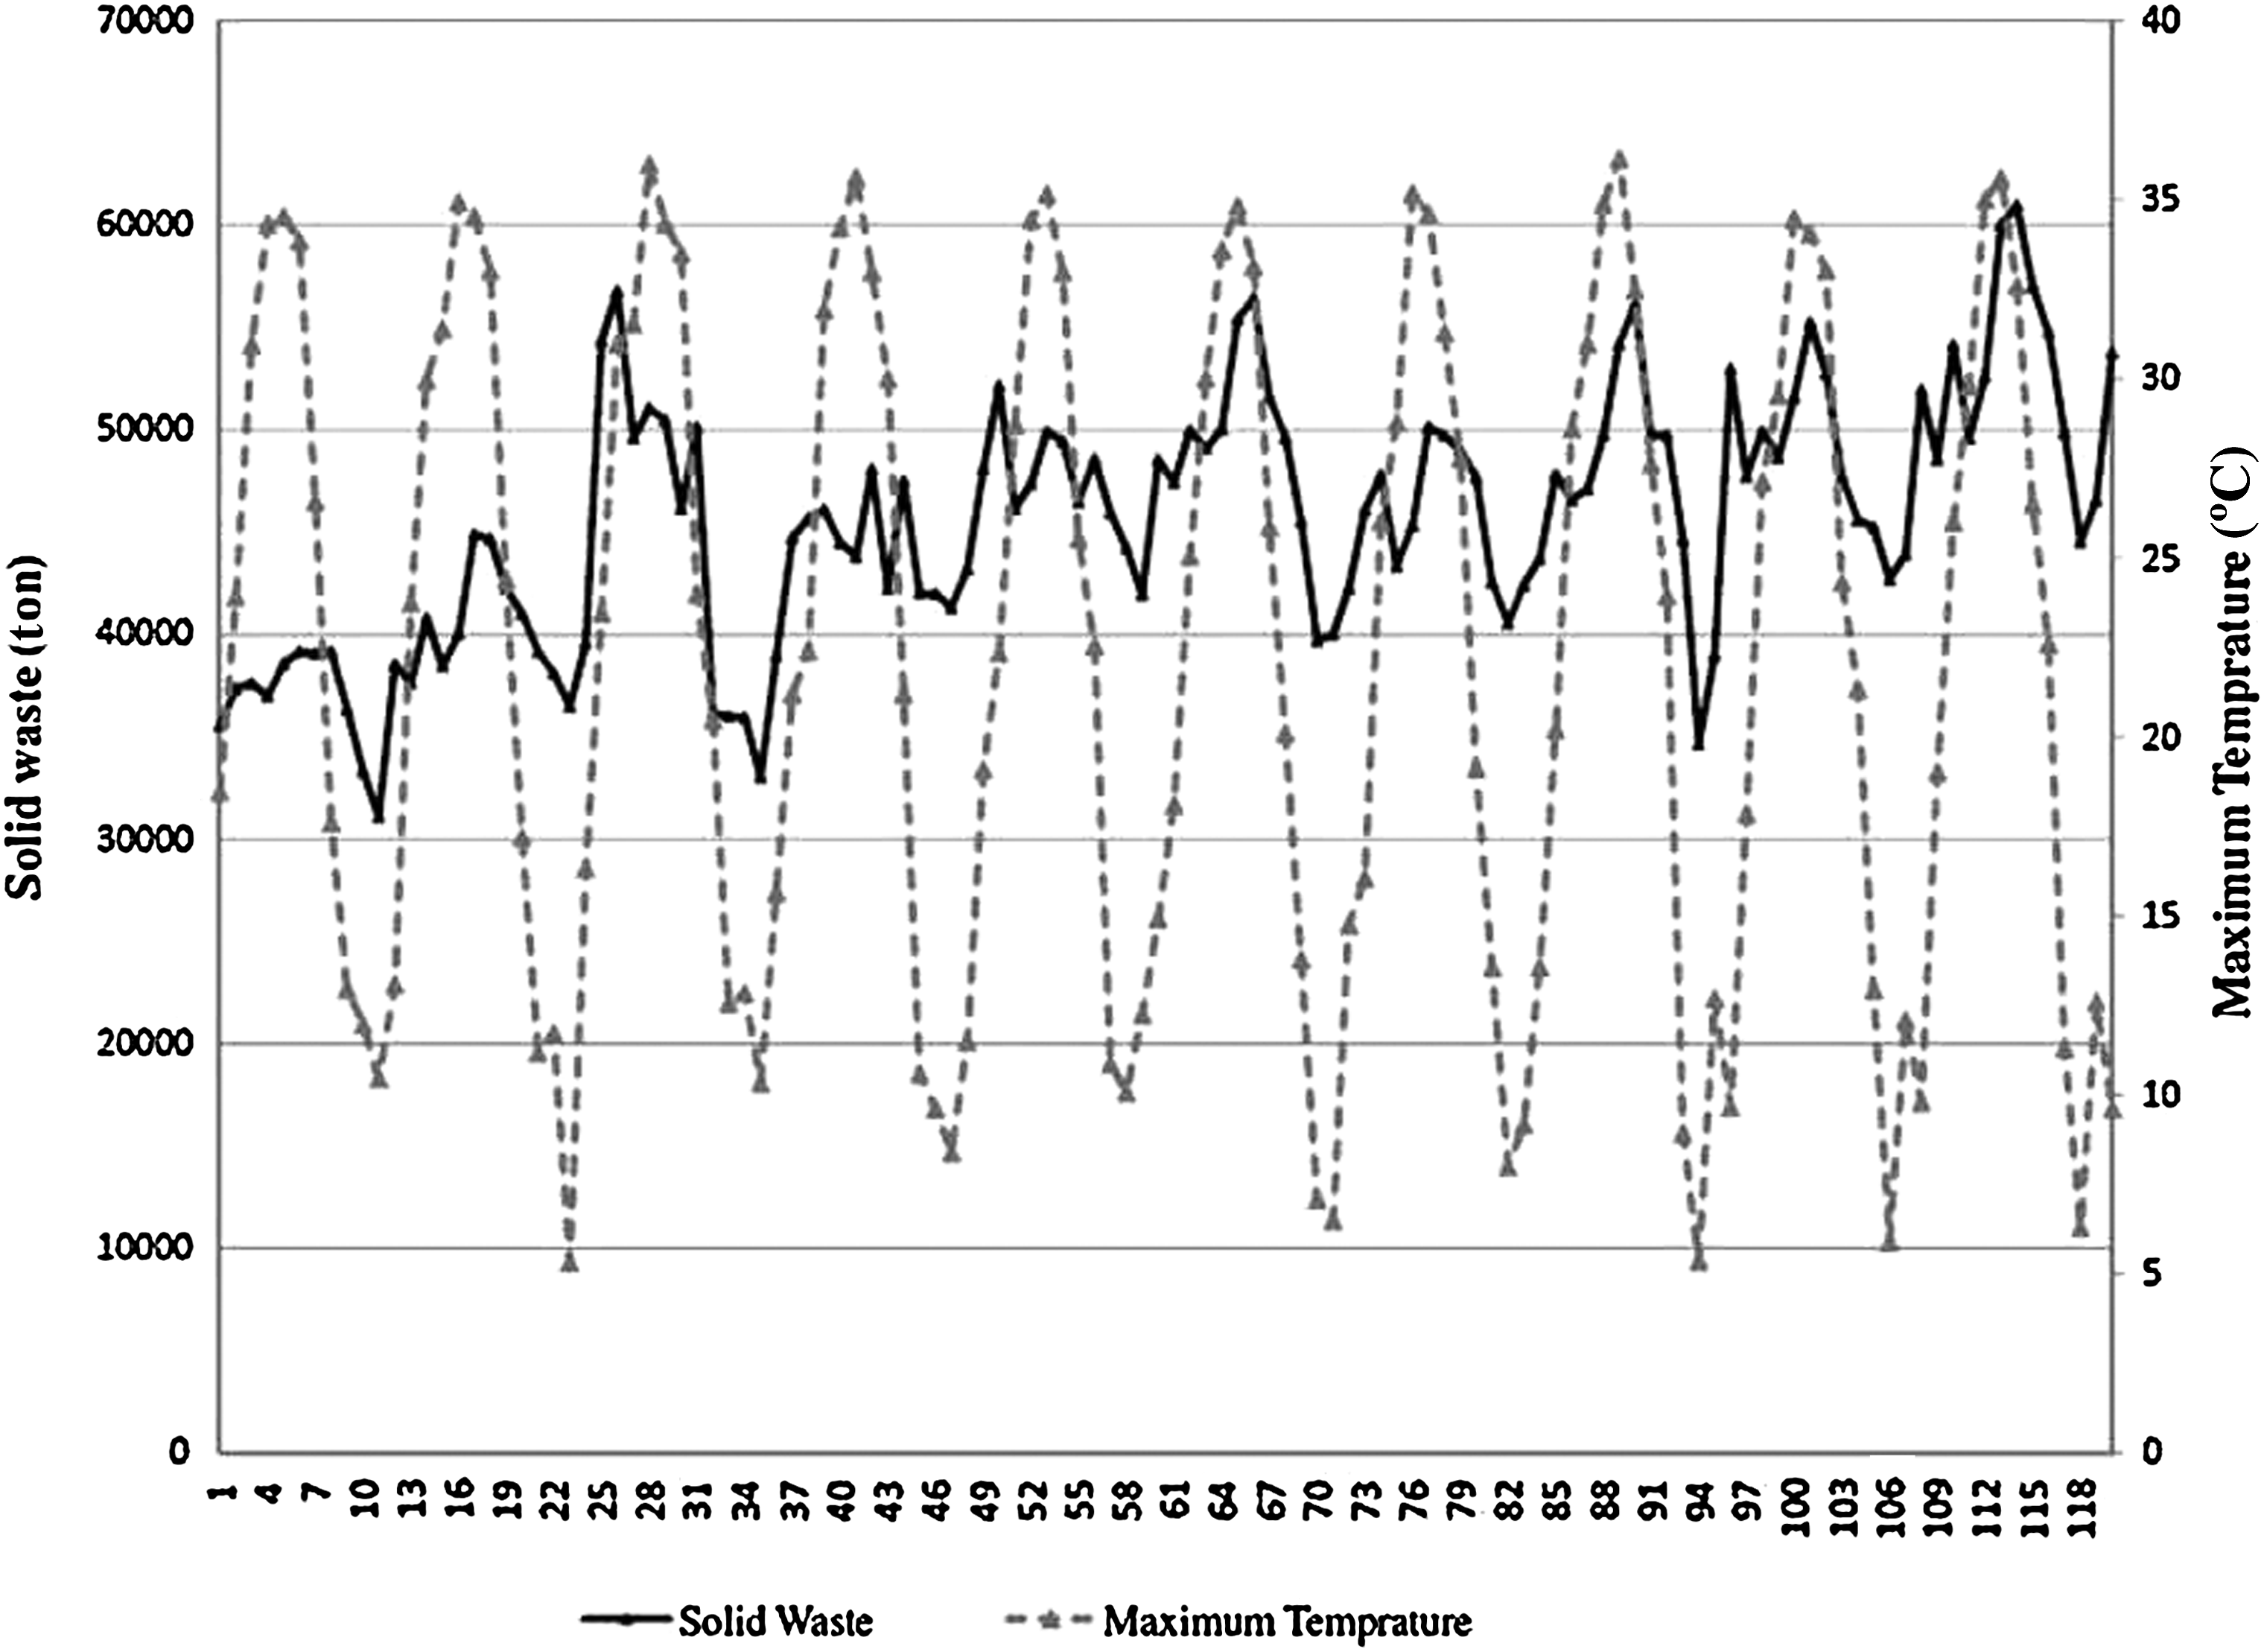
Correlation between maximum temperature and solid waste.
Solid waste generation model
The MSW generation models for the Mashhad city are estimated using 120 months of data (2000–2009). The ordinary least square method is utilized to estimate the relationship between solid waste and explanatory variables. The two functional forms utilized and the results illustrate that the linear model, with four variables, explains 66% variation in the solid waste generation, whereas the logarithmic model shows 70% variation in solid waste production. Tables 5 and 6 illustrate the results of estimating models with linear and logarithmic forms. Based on the obtained t-statistics and p-values for the two above forms, all the variables are important at the significance level of (0.05). Dicky-Fuller unit root test has been applied to all variables and residuals. Results indicate that all the variables are not integrated (Gujarati, 1992). Thus, the problem of co-integration does not exist. Autocorrelation is the statistical procedure used to deal with time-series data or data that have auto correlation problems. If a classical linear regression model is found to be subject to auto correlation problems, the regression coefficient will not be efficient, and the R2 of the linear regression model will also be unreliable. For solving the problem of autocorrelation, Auto Regressive (1) and Moving Average (1) = ARMA (1,1) are applied to the models. Durbin-Watson Statistics depict that the transformed residuals are serially uncorrelated. To avoid heteroskedasticity, the White test is applied to the model, and results indicate that variances are constant (Gujarati, 1992; Ordóñez-Ponce et al., 2006). Table 7 comprised the current investigation and the previous studies. As it can be interpreted, the achieved R2 in this study is, to some extent, with high regard to the previous studies.
Salhofer, S., Graggaber, M. Unpublished report. Erhebung des kommunalen Abfallaufkommens und Untersuchung ausgewählter Sammelsysteme im Bundesland Salzburg (Data Collection of Municipal Solid Waste Generation and Investigation of Selected Collection Systems in the Region Salzburg). Project Report on Behalf of the Federal State of Salzburg, Vienna, Austria, 1999.
n.c., no comment; MSW, municipal solid waste.
To evaluate the accuracy of the models, the developed models are validated with the known values of explanatory variables for the observation period. Mean absolute relative errors (MARE) are 0.0043 and 0.0029 for the linear and logarithmic models, respectively. However, the logarithmic model based on the higher R2 and lower MARE is considered a more appropriate model. Figure 3 compares fitted values (by logarithmic model) with the actual solid waste generation for the observation period.
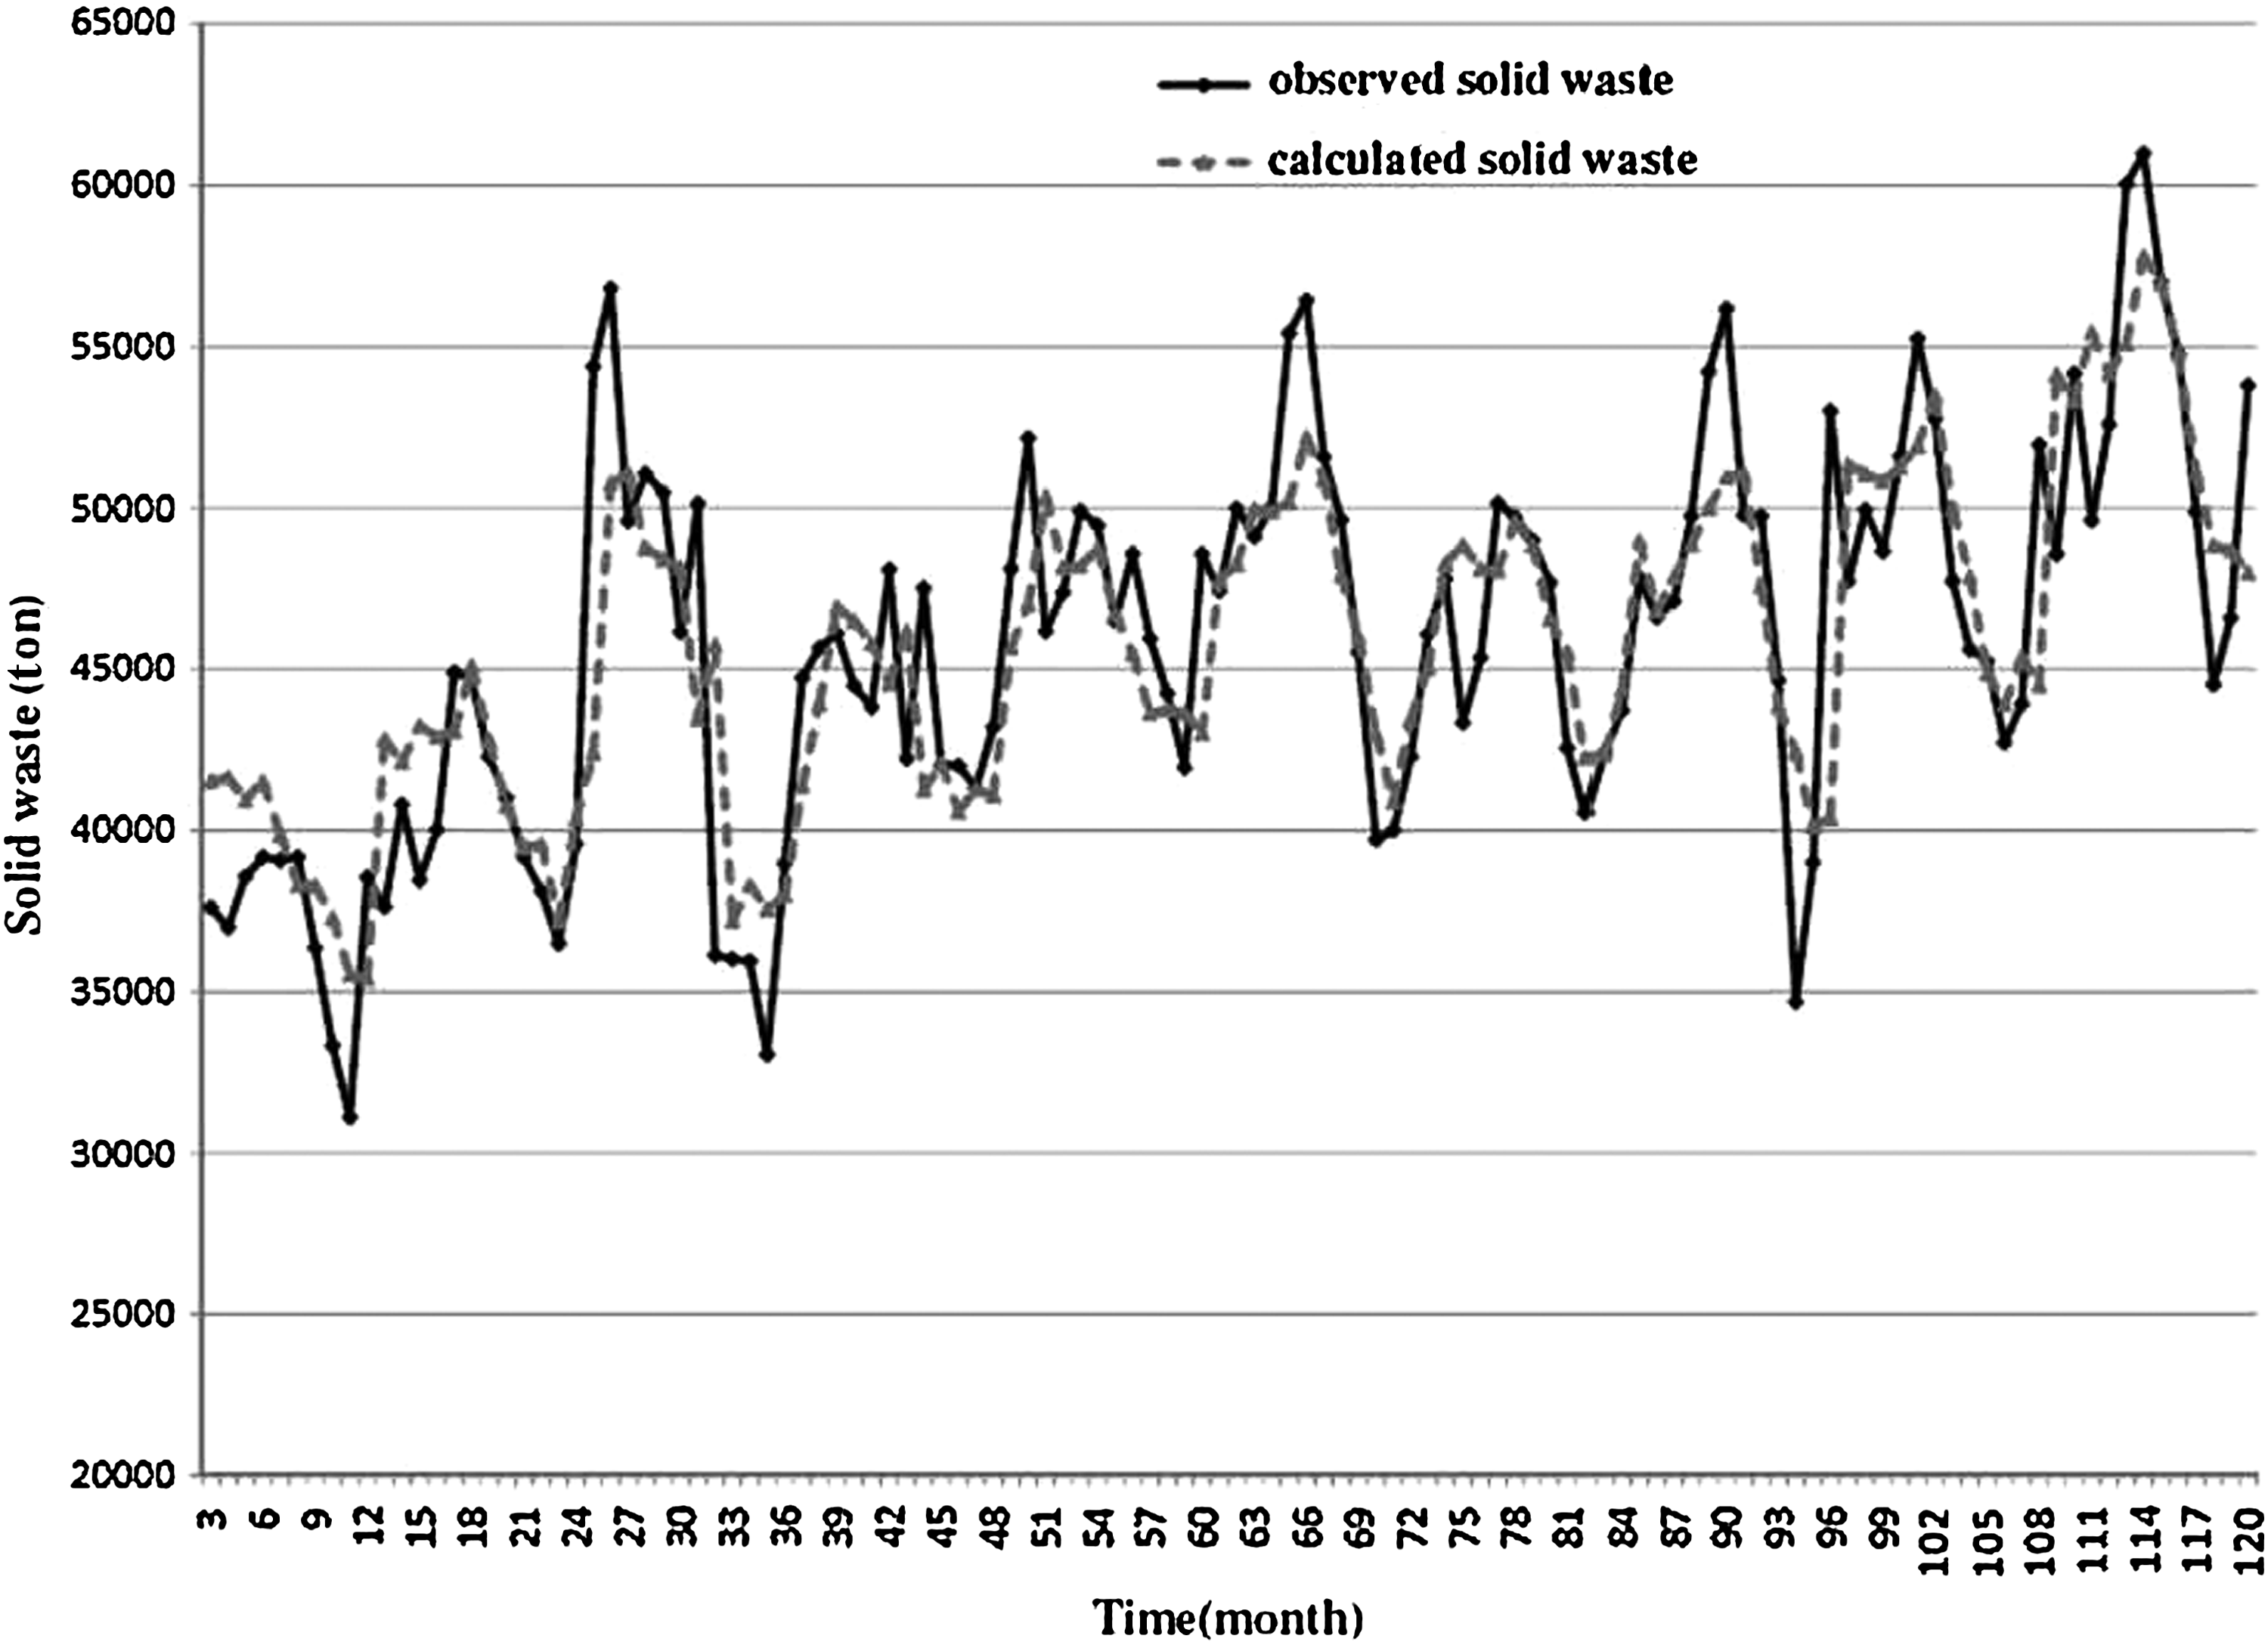
Comparison between fitted values and actual values of solid waste for the observation period.
The elasticities obtained from the present model are presented in Table 8. Income elasticity is 0.48. This figure implies that 10% increase in real household income results in 4.8% increase in solid waste generation. Therefore, it can be stated that similar to the studies of Sudhir et al. (1997), household income has a direct effect on the solid waste generation in Mashhad. In general, households with higher incomes are expected to consume more of the commodities and pursuant to producing more waste. Since the cost of collecting, transition, and final disposal of solid waste should be compensated with the charges that households pay each month, authorities can make regulations, in a way that households with higher income pay more charges.
Population has the greatest elasticity among the variables, as a 10% increase in population leads to 2512 Ton increase in the values of solid waste in the year 2009. Thus, similar to the studies of McBean and Fortin (1993) and Ordóñez-Ponce et al. (2006), population is the most influential variable in the present study.
The maximum temperature elasticity is 0.1. The low value of this figure implies that solid waste production is rather inelastic to the temperature changes. Since in this city, all types of waste, such as domestic and commercial waste are collected together, it cannot be identified how much the proportion of the commercial waste is. Hence, the scale of employment elasticity can be an index for indicating the proportion of commercial waste. Employment elasticity in Mashhad illustrates that 10% increase in employment can result in 1.6% increase in solid waste. So, it can be interpreted that commercial waste does not occupy a major proportion of disposal solid waste and level of employment does not play an important role in the solid waste production in Mashhad. However, it should be brought to light that these results are achieved for this city, which may be different in other regions.
Conclusion
This study presents a methodology for developing solid waste generation models with various socio-economic and climatic factors. Availability, predictability, and reliability of the data records are the chief reasons of selecting these factors. All the variables are categorized in three groups, and correlation analysis is carried out for each group. To avoid the effects of multicollinearity, some of the explanatory variables that have high correlation with the others were eliminated. Two functional forms of multivariate equations were incorporated in the model. Regression analysis was carried out using Econometric software Eviews7 for estimating the model coefficients. p-value and t-tests are utilized to assess the fitness of the model. Logarithmic model due to the higher R2 and the lower MARE is considered as the appropriate model, and elasticities of this model are assessed. The values of the predicted solid waste can be counted using the estimated model and forecasting independent variables, but there are some points that should be noticed: first, although the multivariate economic approach is a main way for estimating the amount of waste, providing and collecting data for each variable is a sophisticated problem, especially in developing countries. So, it is suggested to the authorities to provide a comprehensive database for various variables in greater detail and to implement collection methods for the data type that are not currently available. Some of the data that should be considered are the recycling rate and the rate of the source reduction by households.
Second, despite the accuracy and creditability of the developed model, the need of future values for explanatory variables is a major obstacle in utilizing this model for forecasting solid waste. This forecasting can be implemented merely by predicting each relating factor that might induce a lot of inaccuracy in the model. Hence, only variables should be applied in the model that could have reliable predictions for future. It is recommended to decision makers to rely on this model just as an index that depicts the changes of increasing trend of solid waste generation by fluctuating irrelevant variables.
Third, another factor that should be considered is refitting the model parameters. Based on an actively maintained modeling database, the forecasting model parameters should be refitted (i.e., Regression should be repeated using the updated modeling database) at least once every 5 years. Refitting should also be performed any time it is suspected that a change has occurred in mechanisms by which explanatory variables influence the rate of solid waste generation, such as a change in source reduction policies or a change in recycling rate.
Therefore, in future researches, improving the database and considering the impact of more variables on waste generation should be assessed. Likewise, by forecasting the independent variables and using the estimated model, future values of solid waste can be obtained. Specifying uncertainty in the estimated model to reduce the risks in decision making for future is suggested. For this purpose in the future studies, fuzzy regression models and also probabilistic models such as Mont Carlo can be utilized.
Footnotes
Author Disclosure Statement
No competing financial interests exist.