
Abstract
Abstract
This article elucidates pyrolysis reaction pathways of waste epoxy-printed circuit boards (e-PCBs). Non-isothermal thermogravimetric analyses showed that waste e-PCBs decomposed via a series of reactions distinguished by three apparent reaction regions. The first-stage reaction (<250°C) can be accounted for by the cleavage reaction of N-containing cross-linkage between brominated epoxy resin (BER) and non-brominated epoxy resin (NBER). Evolved gas analysis-mass spectrometry (EGA-MS) showed that the second-stage reaction (250–500°C) can be represented by two independent decomposition reactions of BERs and NBERs to yield thermally stable intermediates. BERs decomposed more rapidly (250–350°C), whereas NBERs decomposed over broader temperature regions (250–500°C) with slower decomposition rates. Multi-shot gas chromatography/mass spectrometry also indicated that brominated compounds, brominated phenol and brominated bisphenol A, are generated mainly at lower temperature zones of the second-stage region, whereas phenols and branched phenols are generated at higher temperature zones. Steady but slow conversion of intermediates was carried out over the conversion of 0.9. At the third-stage reaction, thermally stable intermediates were converted slowly to char as a result of HBr release from intermediates.
Introduction
The incineration of waste PCB can produce high quantities of dioxins and furans and is regarded as an undesirable treatment option (Balabannovich et al., 2004; Barontini and Cozzani, 2006; Moltó et al., 2011; Duan et al., 2012). On the other hand, physical and mechanical separation methods (Hoffmann, 1992; Eswaraiah et al., 2008), gasification (Zhang et al., 2013), pyrometallurgical technology (Eswaraiah et al., 2008), and hydrometallurigical technology (Barontini et al., 2005; Eswaraiah et al., 2008) have been extensively used for resource recovery from waste PCB. Most recycling technologies suffer from the drawbacks of high energy costs and the generation of secondary pollutants. Therefore, it is essential to develop an environmental friendly recycling technology along with economic competitiveness.
The pyrolysis of waste PCB appears to be one of the most promising technologies, leading to the production of valuable gas, liquid, and solid products from waste PCB (Barontini et al., 2005; Grause et al., 2008; Guan et al., 2008; Guo et al., 2010; Quan et al., 2010; Liu et al., 2013). In addition, the initial state of the metals used for manufacturing PCBs can be recovered by the pyrolysis process and can be reused as the raw materials for PCBs after minimal pre-treatment processes.
The oil products recovered as a result of the pyrolysis of waste PCB contained high concentrations of phenol and phenol derivatives (Guo et al., 2010; Li et al., 2010; Quan et al., 2010), which were regarded as the thermal decomposition products of epoxy resin.
Grause et al. (2008) analyzed the debromination of TBBA-containing laminated PCBs based on phenol resins. Their study showed that brominated aromatic compounds are formed exclusively between 270°C and 400°C, and bromine is released at higher temperatures only in the form of HBr.
Although previous studies provided valuable information, the reaction pathways of waste PCB, particularly the kinetic information, are not completely understood.
In this study, the pyrolysis reaction pathway of waste epoxy-PCB (e-PCB) was examined by thermogravimetric analysis (TGA) and pyrolyzer-gas chromatography/mass spectrometry (Py-GC/MS). Evolved gas analysis (EGA) and multi-shot analysis (MSA) were also conducted by Py-GC/MS. The pyrolysis reaction pathways, which are a result of a combined interpretation of the pyrolysis products, are suggested.
Materials and Methods
Materials
Waste e-PCBs were obtained from a local PCB recycling company. The waste e-PCBs were ground, and copper was removed using a gravity separation device. The metal-free samples were cryo-milled with liquid nitrogen and dried at 110°C for at least 4 h before sample analysis.
CHON analysis was conducted using an elemental analyzer (FLASH EA1112; Thermo Electron Co.), and the Br content was measured by X-ray fluorescence (NDT-ANI QCI; Olympus Co.) spectroscopy. Table 1 lists the characteristics of the waste e-PCB powder samples used. The epoxy-based PCB was manufactured by blending brominated epoxy resin (BER; C, H, O, and Br) and non-brominated epoxy resin (NBER) (C, H, O) with a cross-linking agent, such as amine (N). The ultimate analysis results are in good agreement with the chemical properties of e-PCB. The high ash content was attributed to the impregnated fibers and residual metals in the waste PCB samples. The heating value of the sample was determined using a bomb calorimeter (AC-350; LECO Co.).
Dry basis.
Kinetic analysis
TGA (Pyris Diamond; Perkin Elmer Co.) was introduced to examine the kinetics of the decomposition of the waste e-PCB powder samples at three different heating rates of 10–30°C/min at a nitrogen flow rate of 80 mL/min. One of the model-free methods, the Revised Ozawa Method (Kim and Park, 1995), was used to develop a functional relationship of the activation energy with the conversion rate.
Py-GC/MS analysis
EGA is extensively used in pyrolysis research. The nature of the volatile products released by a substance subjected to a controlled temperature program is determined online with the possibility of proving hypothetical reactions under heating conditions (Materazzi et al., 2006; Tsuge et al., 2011).
Figure 1 presents schematic flow diagrams of the Py-GC/MS system that was operated typically with EGA-MS and MSA-GC/MS. As shown in Fig. 1a, EGA-MS is composed of a temperature-programmable micro-furnace pyrolyzer (Py-2020iD; Frontier-Lab.) that is coupled directly with MS (5975C inert MSD; Agilent) using a deactivated stainless steel capillary transfer tube (UA-DTM-2.5N, 2.5 m×0.15 mm inner diameter). The tube temperature was maintained at 300°C in the oven of a gas chromatograph (model: 7890A GC; manufactured by Agilent) to avoid condensation of the degradation products. Approximately 2 mg of the waste e-PCB powder samples in the sample cup was introduced to the pyrolysis zone at a helium flow rate of 50 mL/min and heated from 100°C to 800°C at a heating rate of 20°C/min. The thermogram was displayed by monitoring the total ion current of MS versus the programmed temperature.
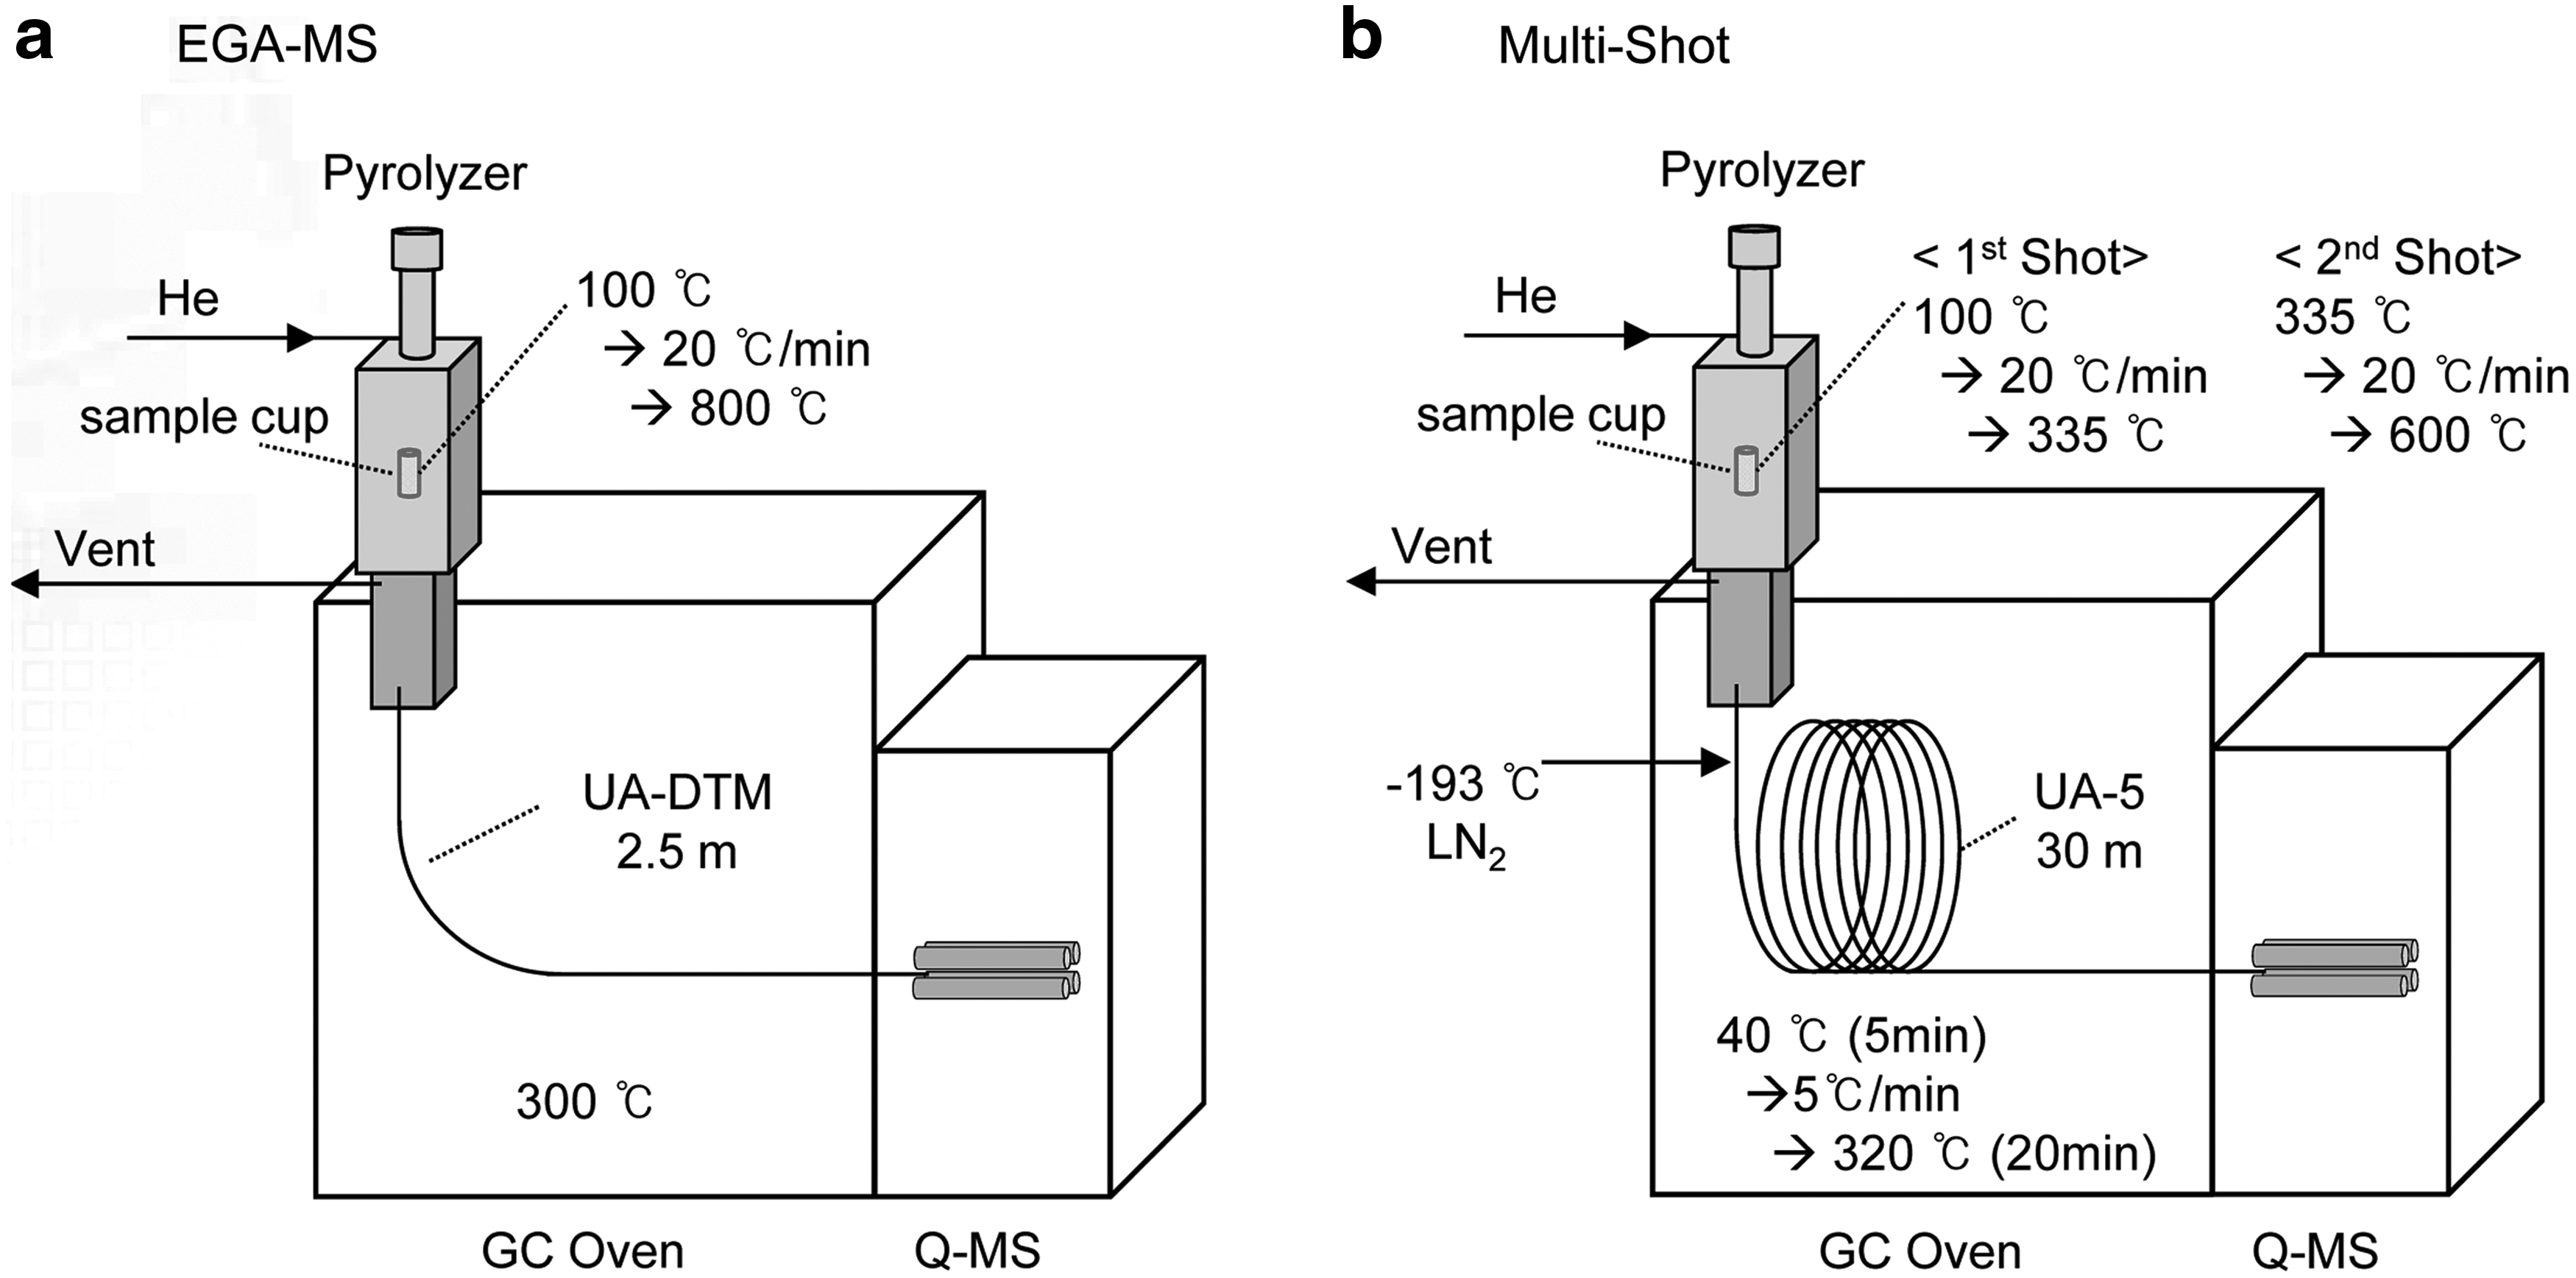
Schematic flow diagram of pyrolyzer-gas chromatography/mass spectrometry (Py-GC/MS).
For MSA (Fig. 1b), the vapors produced from each EGA thermal zone were introduced into the capillary column (DB-5MS, 30 m×0.25 mm inner diameter×0.25 μm film thickness) and trapped temporarily at the front of the column using LN2 at −193°C supplied by a MicroJet Cryo Trap (MJT-1030E; Frontier-Lab). For GC separation, the GC oven temperature was programmed from 40°C (5 min) to 320°C (20 min) at a heating rate of 5°C/min. Each peak on the pyrogram was identified using the NIST 8th library (NIST) and/or pyrolyzates library (F-Search Library; Frontier-Lab Co.).
Results and Discussion
The pyrolysis reaction of waste e-PCB was investigated by a visual observation of the thermal decomposition patterns of the TG curves as well as model-free kinetic analysis. The possible reaction types were proposed from kinetic analysis, and the reaction type was then determined indirectly by characterizing the thermogram and the chemical compositions of the evolved gases of pyrolysis reactions. Hypothetical pyrolysis reaction pathways were derived from the observation, as well as from the results of kinetic analysis and chemical composition results of the evolved gases.
Kinetic analysis
Figure 2 shows non-isothermal decomposition kinetics of waste e-PCB at heating rates of 10–30°C/min. The TG curves suggest that the thermal decomposition of waste e-PCB occurs mainly between 250°C and 500°C, where the conversion reaches 0.8. Slow decomposition occurred over the region where the conversion rate was >0.8. The derivative thermogravimetry (DTG) curves exhibited a tailed decomposition peak (Fig. 3), suggesting that a complicated reaction would occur through the degradation regions.
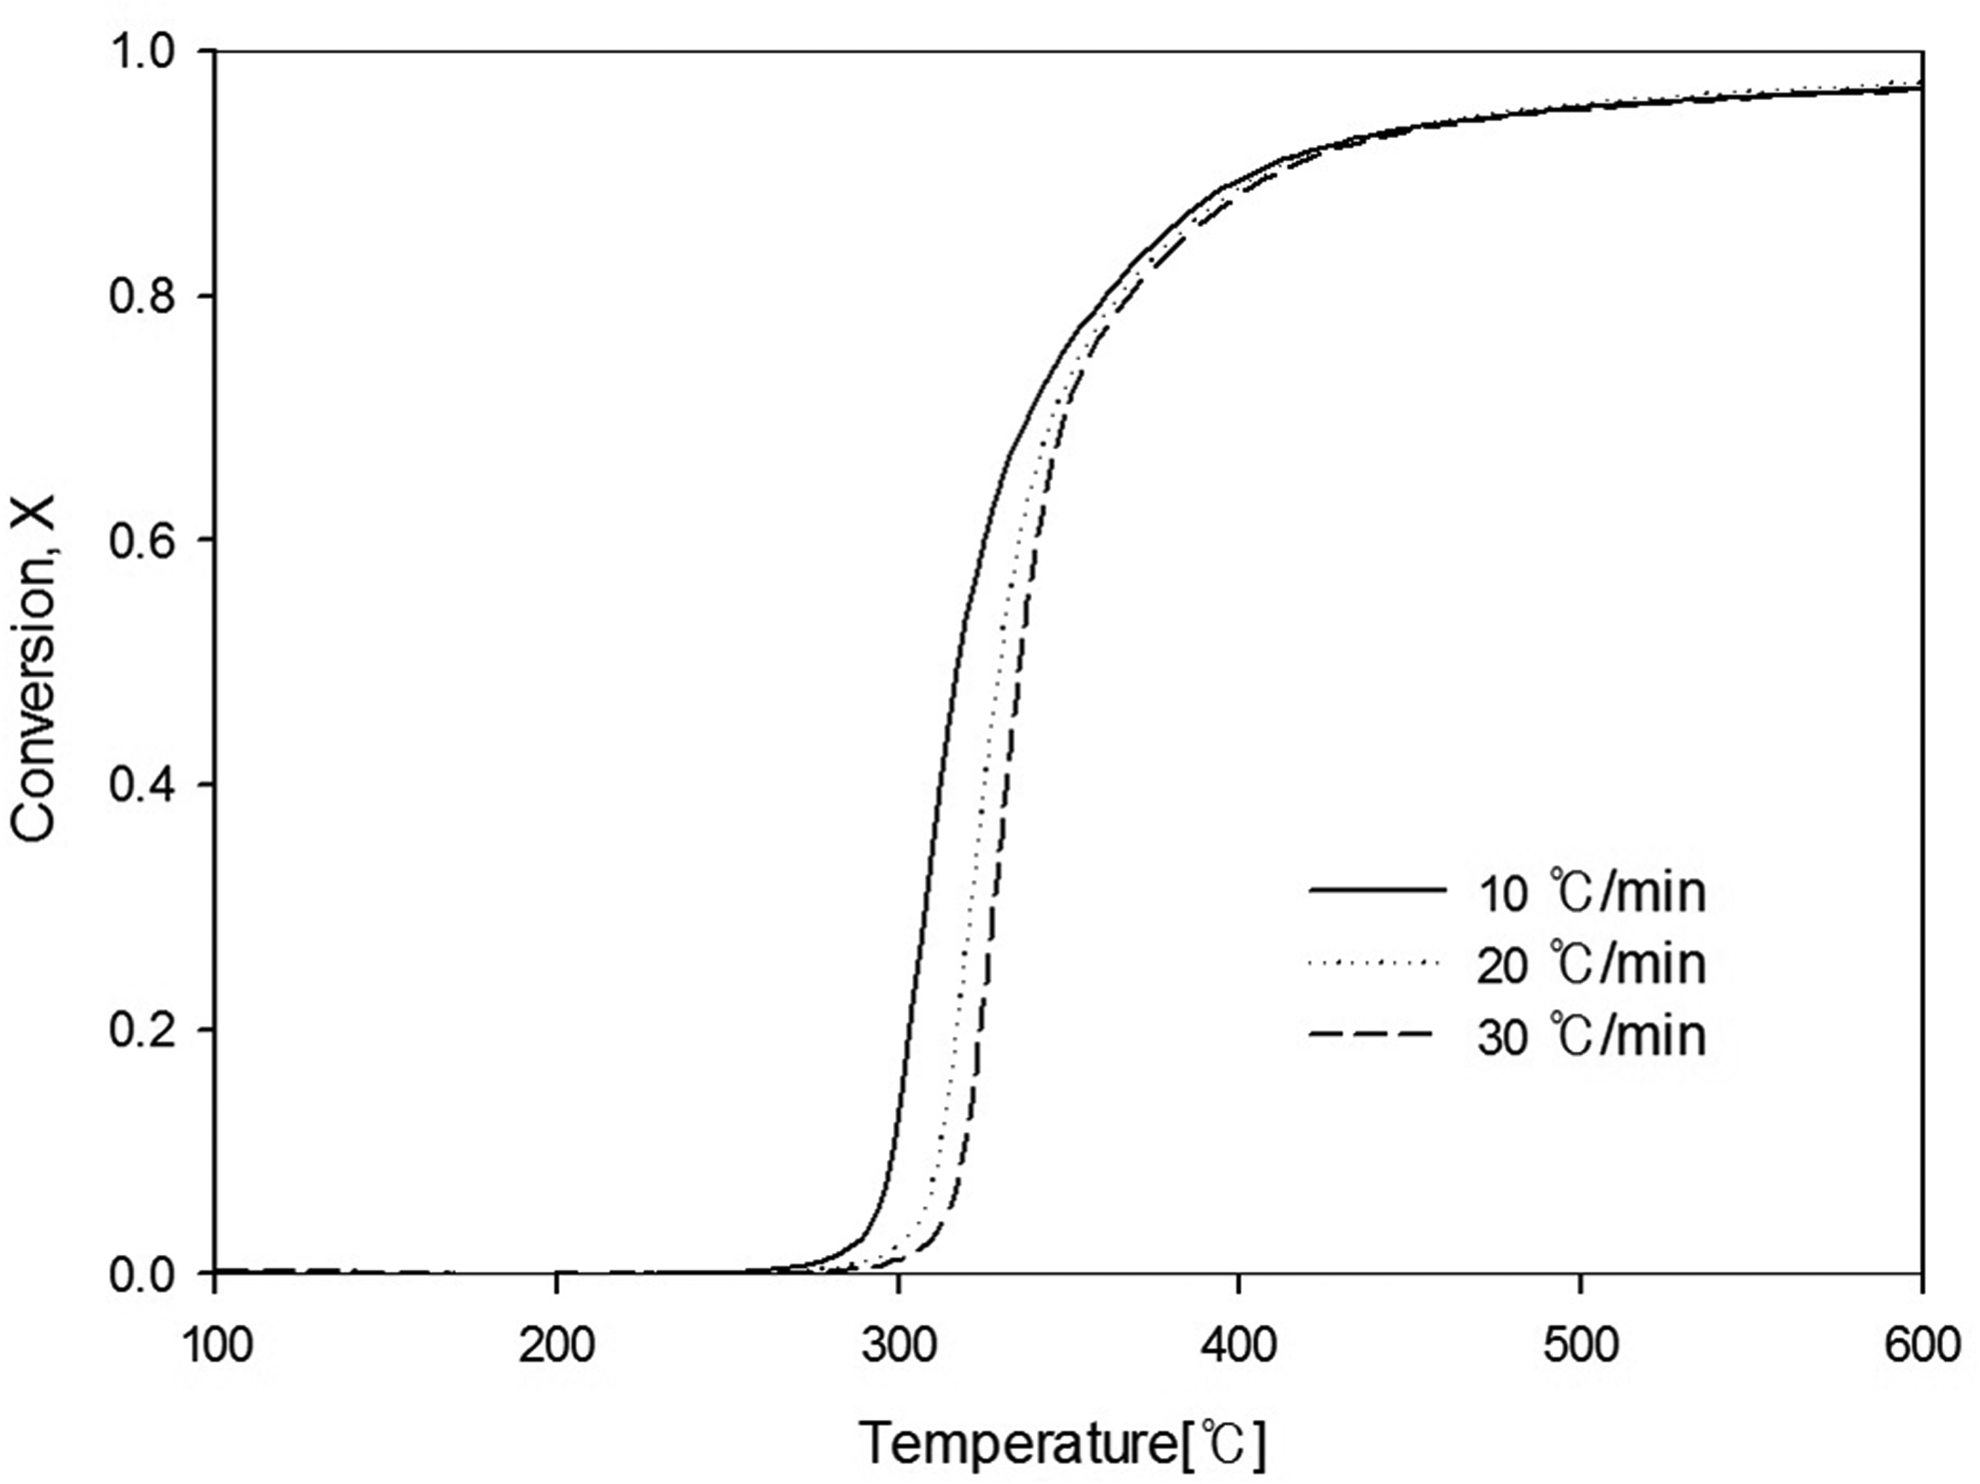
Change in conversion of waste printed circuit boards (PCBs) obtained at a heating rate of 10–30°C/min.
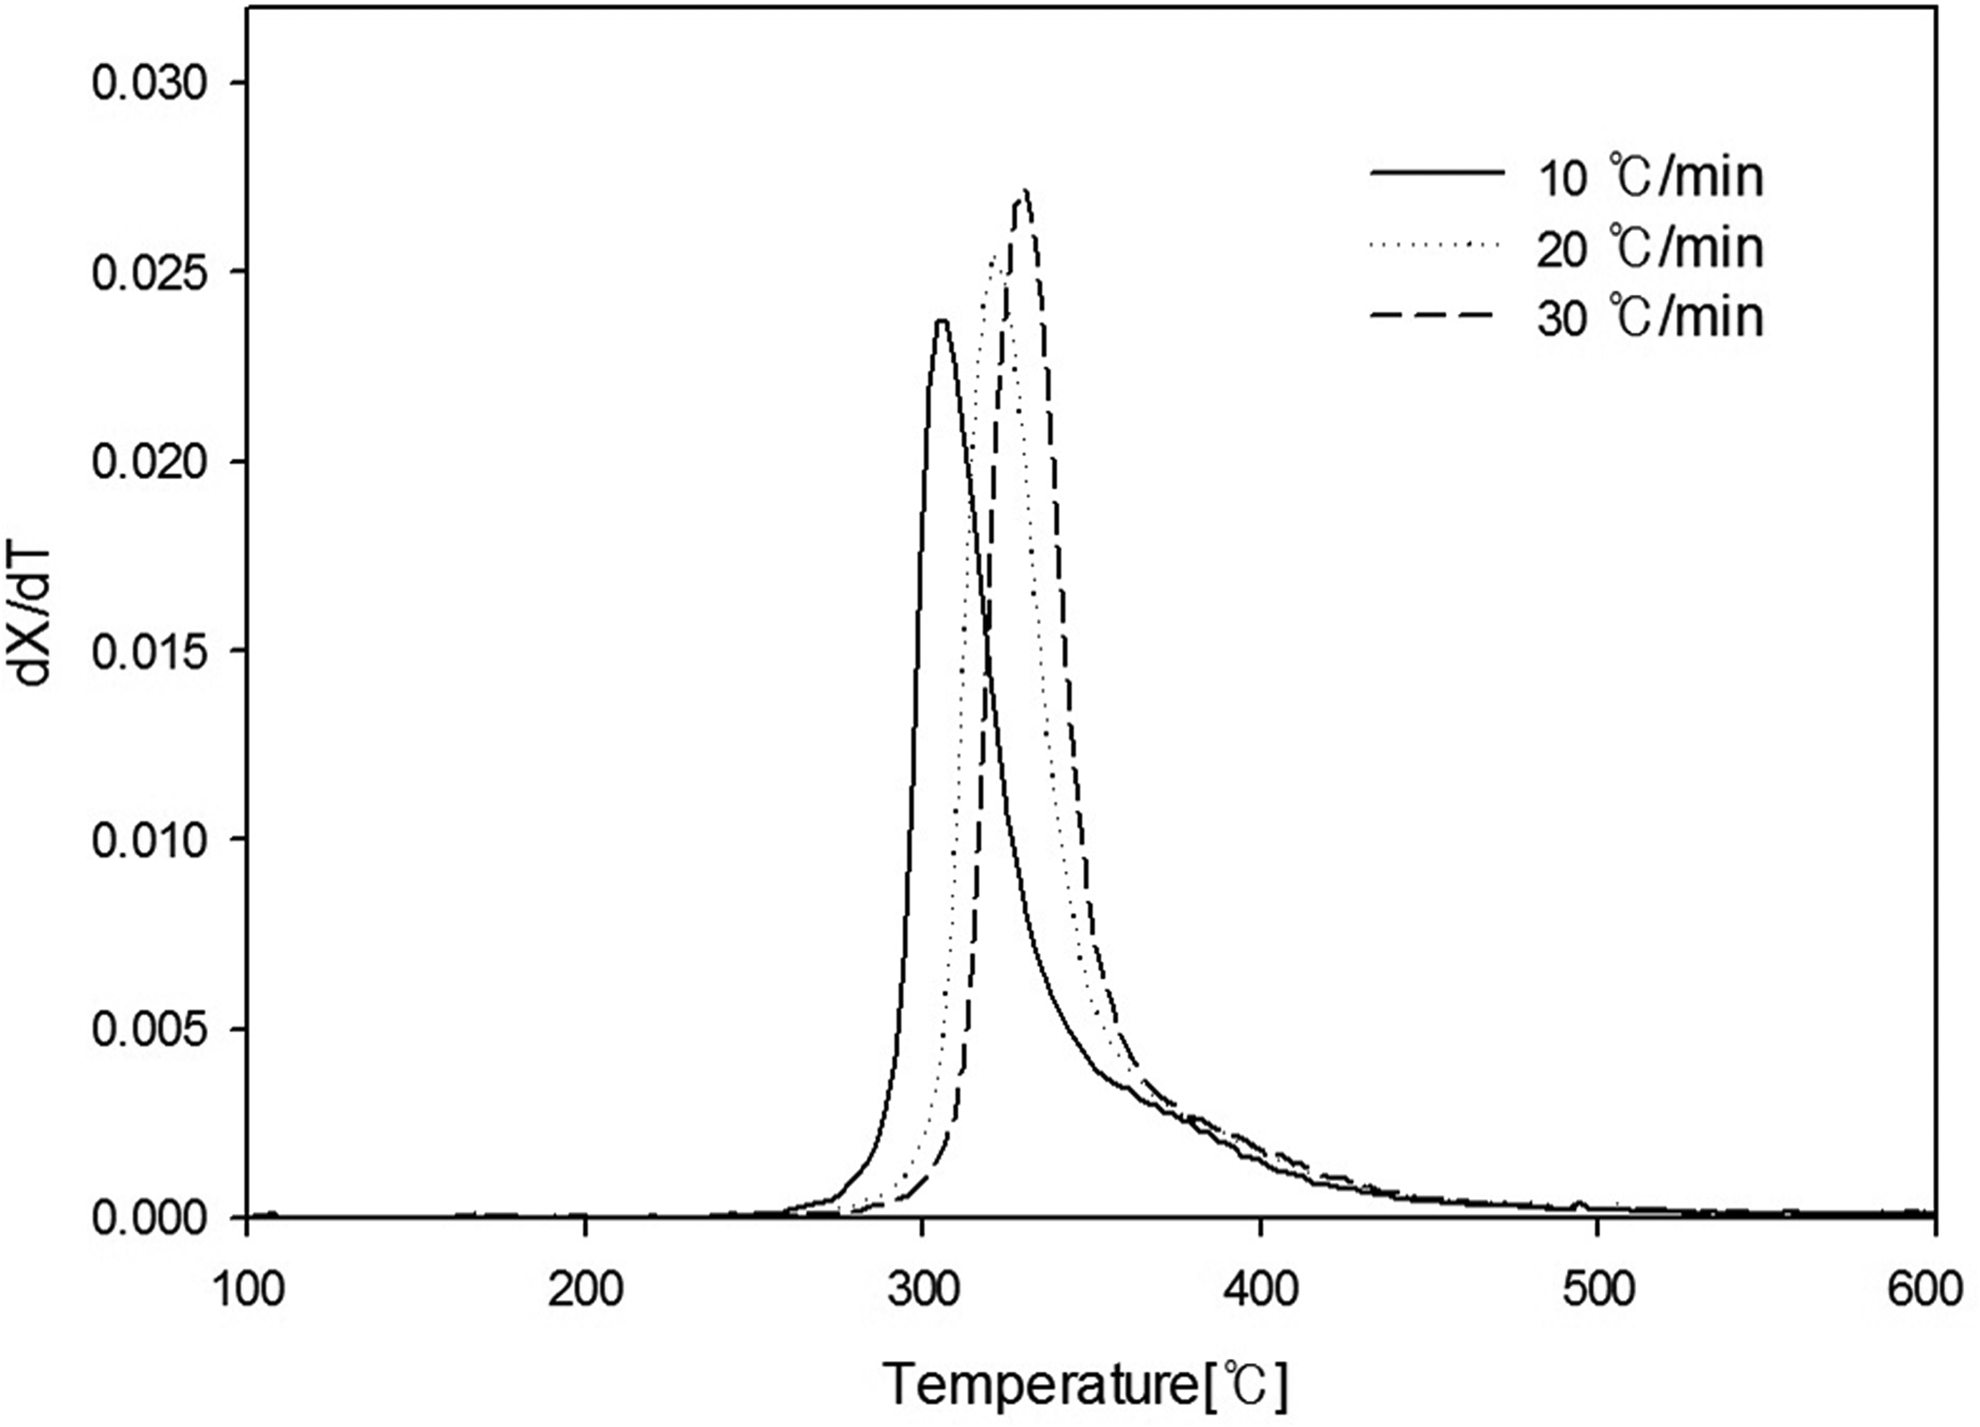
Variation of decomposition rate with temperature obtained at heating rates of 10–30°C/min for pyrolysis of waste PCBs.
The activation energy is expected to vary sharply at certain temperatures and conversion where different reactions may start. Model-free kinetic analysis was applied to check the distinguishable variation of the activation energy. Figure 4 shows the results of model-free kinetic analysis. The slope value of each plot of the conversion is associated with the activation energy. The high linearity of the plots (square of linear correlation factor; R2>0.99) upholds the suitability of the analyses.
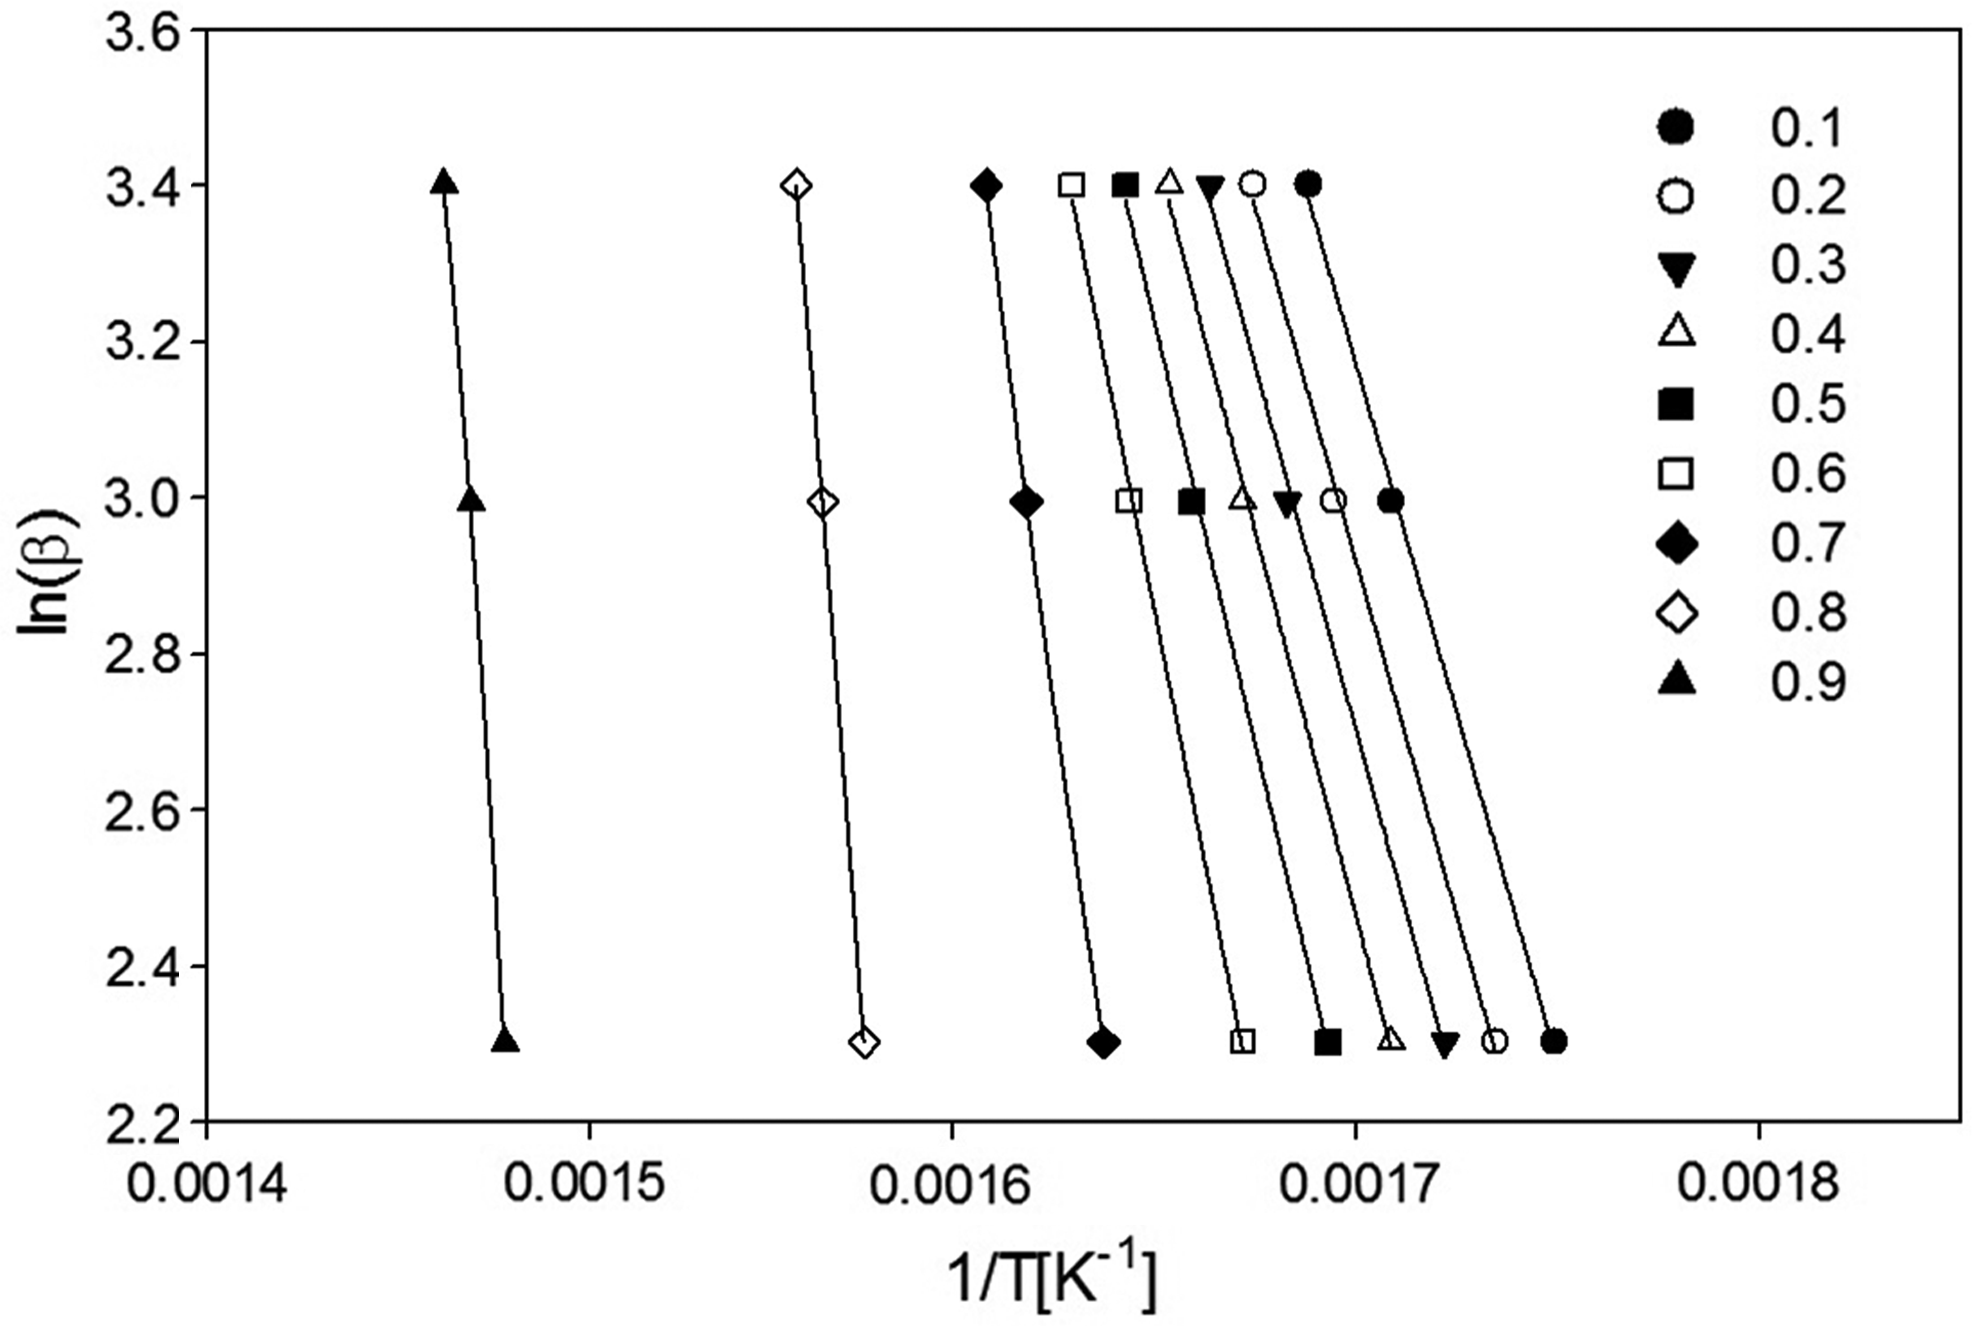
ln(β) versus 1/T as a function of conversion: E is derived from the slope of ln(β) versus 1/T.
Figure 5 shows the variations of the activation energy with conversion. The activation energy with regard to conversion ranged from 141 and 582 kJ/mol with a mean value of 262 kJ/mol. Three distinct regions were observed according to the variation of activation energy with the conversion rate: (1) the first region where a conversion rate was <0.6 (∼335°C), (2) the second region where conversion rates were between 0.6 and 0.8, and (3) the third region where the conversion rate was >0.8 (∼370°C).
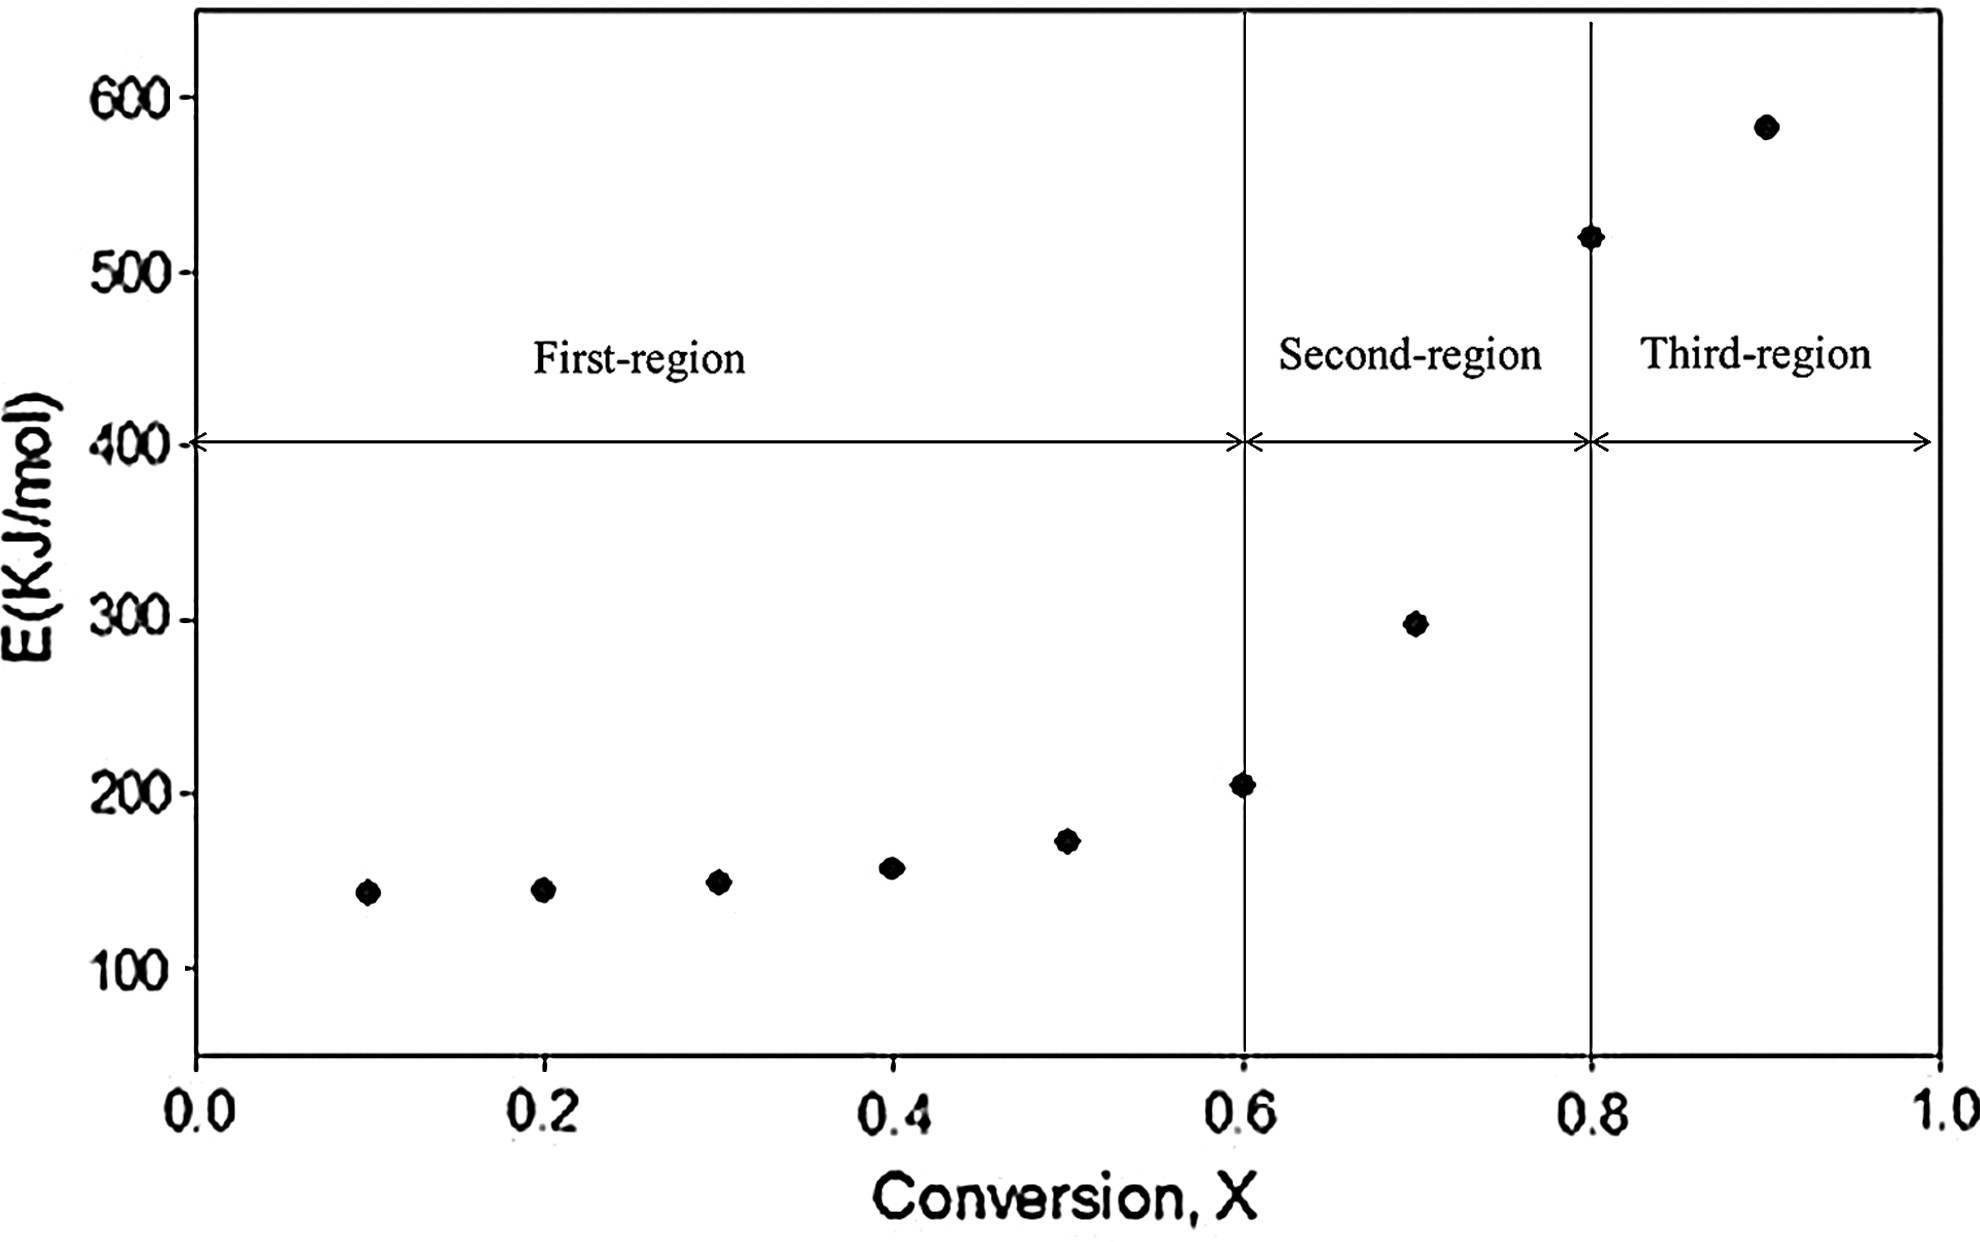
Calculated activation energies at different conversions for pyrolysis of waste PCBs.
In the first region, the activation energy was relatively constant (161±18 kJ/mol). The activation energy increased sharply from 204 to 518 kJ/mol (mean: 340±124 kJ/mol) at the second region. On the other hand, the activation energy increased slightly at the third region. The variation pattern of the activation energy suggests that the pyrolysis reaction of waste e-PCB would be accounted for by either a simple series reaction or a series reaction with two independent reactions at those regions (Moltó et al., 2009; Quan et al., 2009). The hypothesis for a series reaction is that the organic portions of waste e-PCB would be degraded first to thermally stable intermediates over the region where the conversion rate is <0.6 (∼335°C). The intermediates would then be converted slowly to char by releasing volatiles at the third region. On the other hand, independent reactions may be hypothesized by the thermal decomposition of two different types of resin in e-PCB to yield thermally stable intermediates. The intermediates would be degraded slowly to generate char.
Although the kinetic analyses described earlier offer insights into the pyrolysis reaction pathways of waste e-PCB, the kinetic information is insufficient to determine which hypothesis is appropriate for the pyrolysis reactions of waste e-PCB. Therefore, the evolved gases generated at the corresponding regions need to be characterized chemically.
Py-GC/MS analysis
Multi-shot analyses were introduced to separately identify the decomposition products of waste e-PCB at the first- and second region distinguished by the results of kinetic analysis. The multi-shot chromatograms (Fig. 6) show that brominated compounds are present only at the first region, where the conversion rate is <0.6 (T<335°C at a heating rate of 20°C/min). Waste e-PCB is composed of BERs and NBERs (Blazsó and Czégény, 2006). Owing to the lower thermal stability, BERs are decomposed earlier than NBERs (Tsuge et al., 2011). The thermal degradation at the first region would be accounted for by that of BERs.
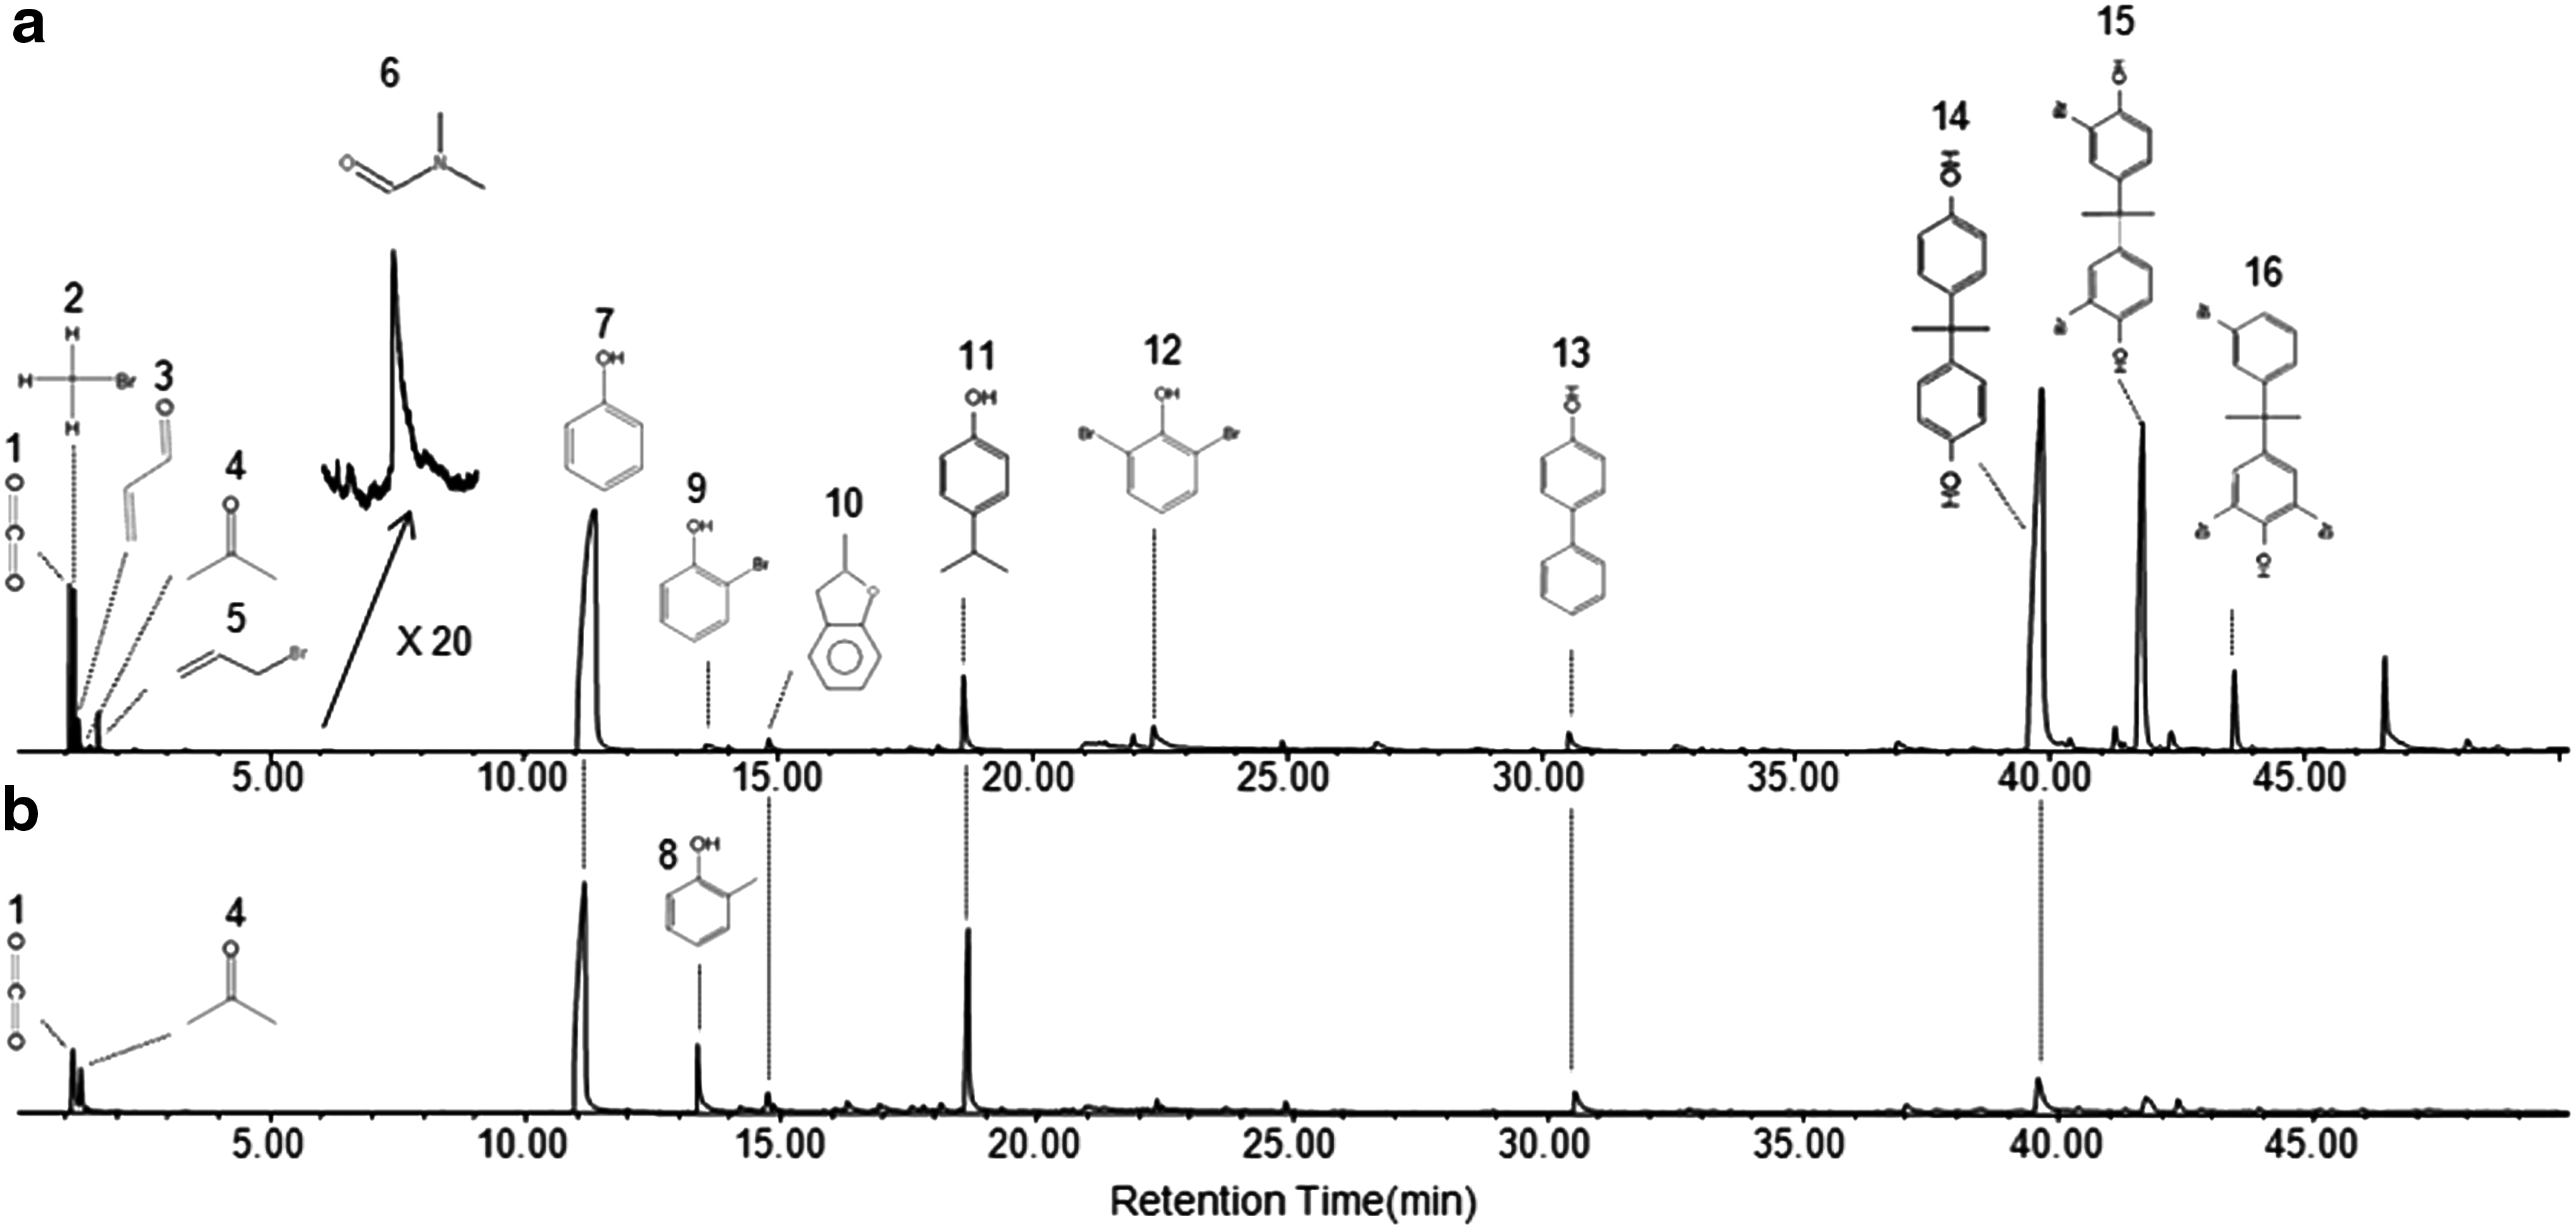
Multi-shot chromatograms at the first-stage and second-stage region.
Non-brominated compounds were observed at both temperature regions except for dimethyl formamide, acrolein, and 2-methylphenol. Dimethyl formamide and acrolein were present only at the first region (Fig. 7 and Table 2), whereas 2-methylphenol was observed solely at the second region (x>0.6 and T>335°C). Interestingly, 2-methylphenol was observed only at higher temperature regions. Thermolysis of NBERs appears to be responsible for the generation of 2-methylphenol.
Mass currents of the evolved gases during the thermal degradation of waste epoxy-PCBs (e-PCBs) by EGA/MS experiment at a heating rate of 20°C/min.
N/D, not detected; GC/MS, gas chromatography/mass spectrometry.
Non-brominated compounds, such as phenol and bisphenol A, are observed equally at both regions, suggesting that BERs and NBERs, respectively, decompose to produce phenol and bisphenol A at the first- and second regions (Li et al., 2010). In addition, overlapped temperature zones would be expected where both resins are decomposed concurrently. Multi-shot analyses offer an insight that the pyrolysis reaction of waste e-PCBs would be accounted for by the independent reactions of BERs and NBERs.
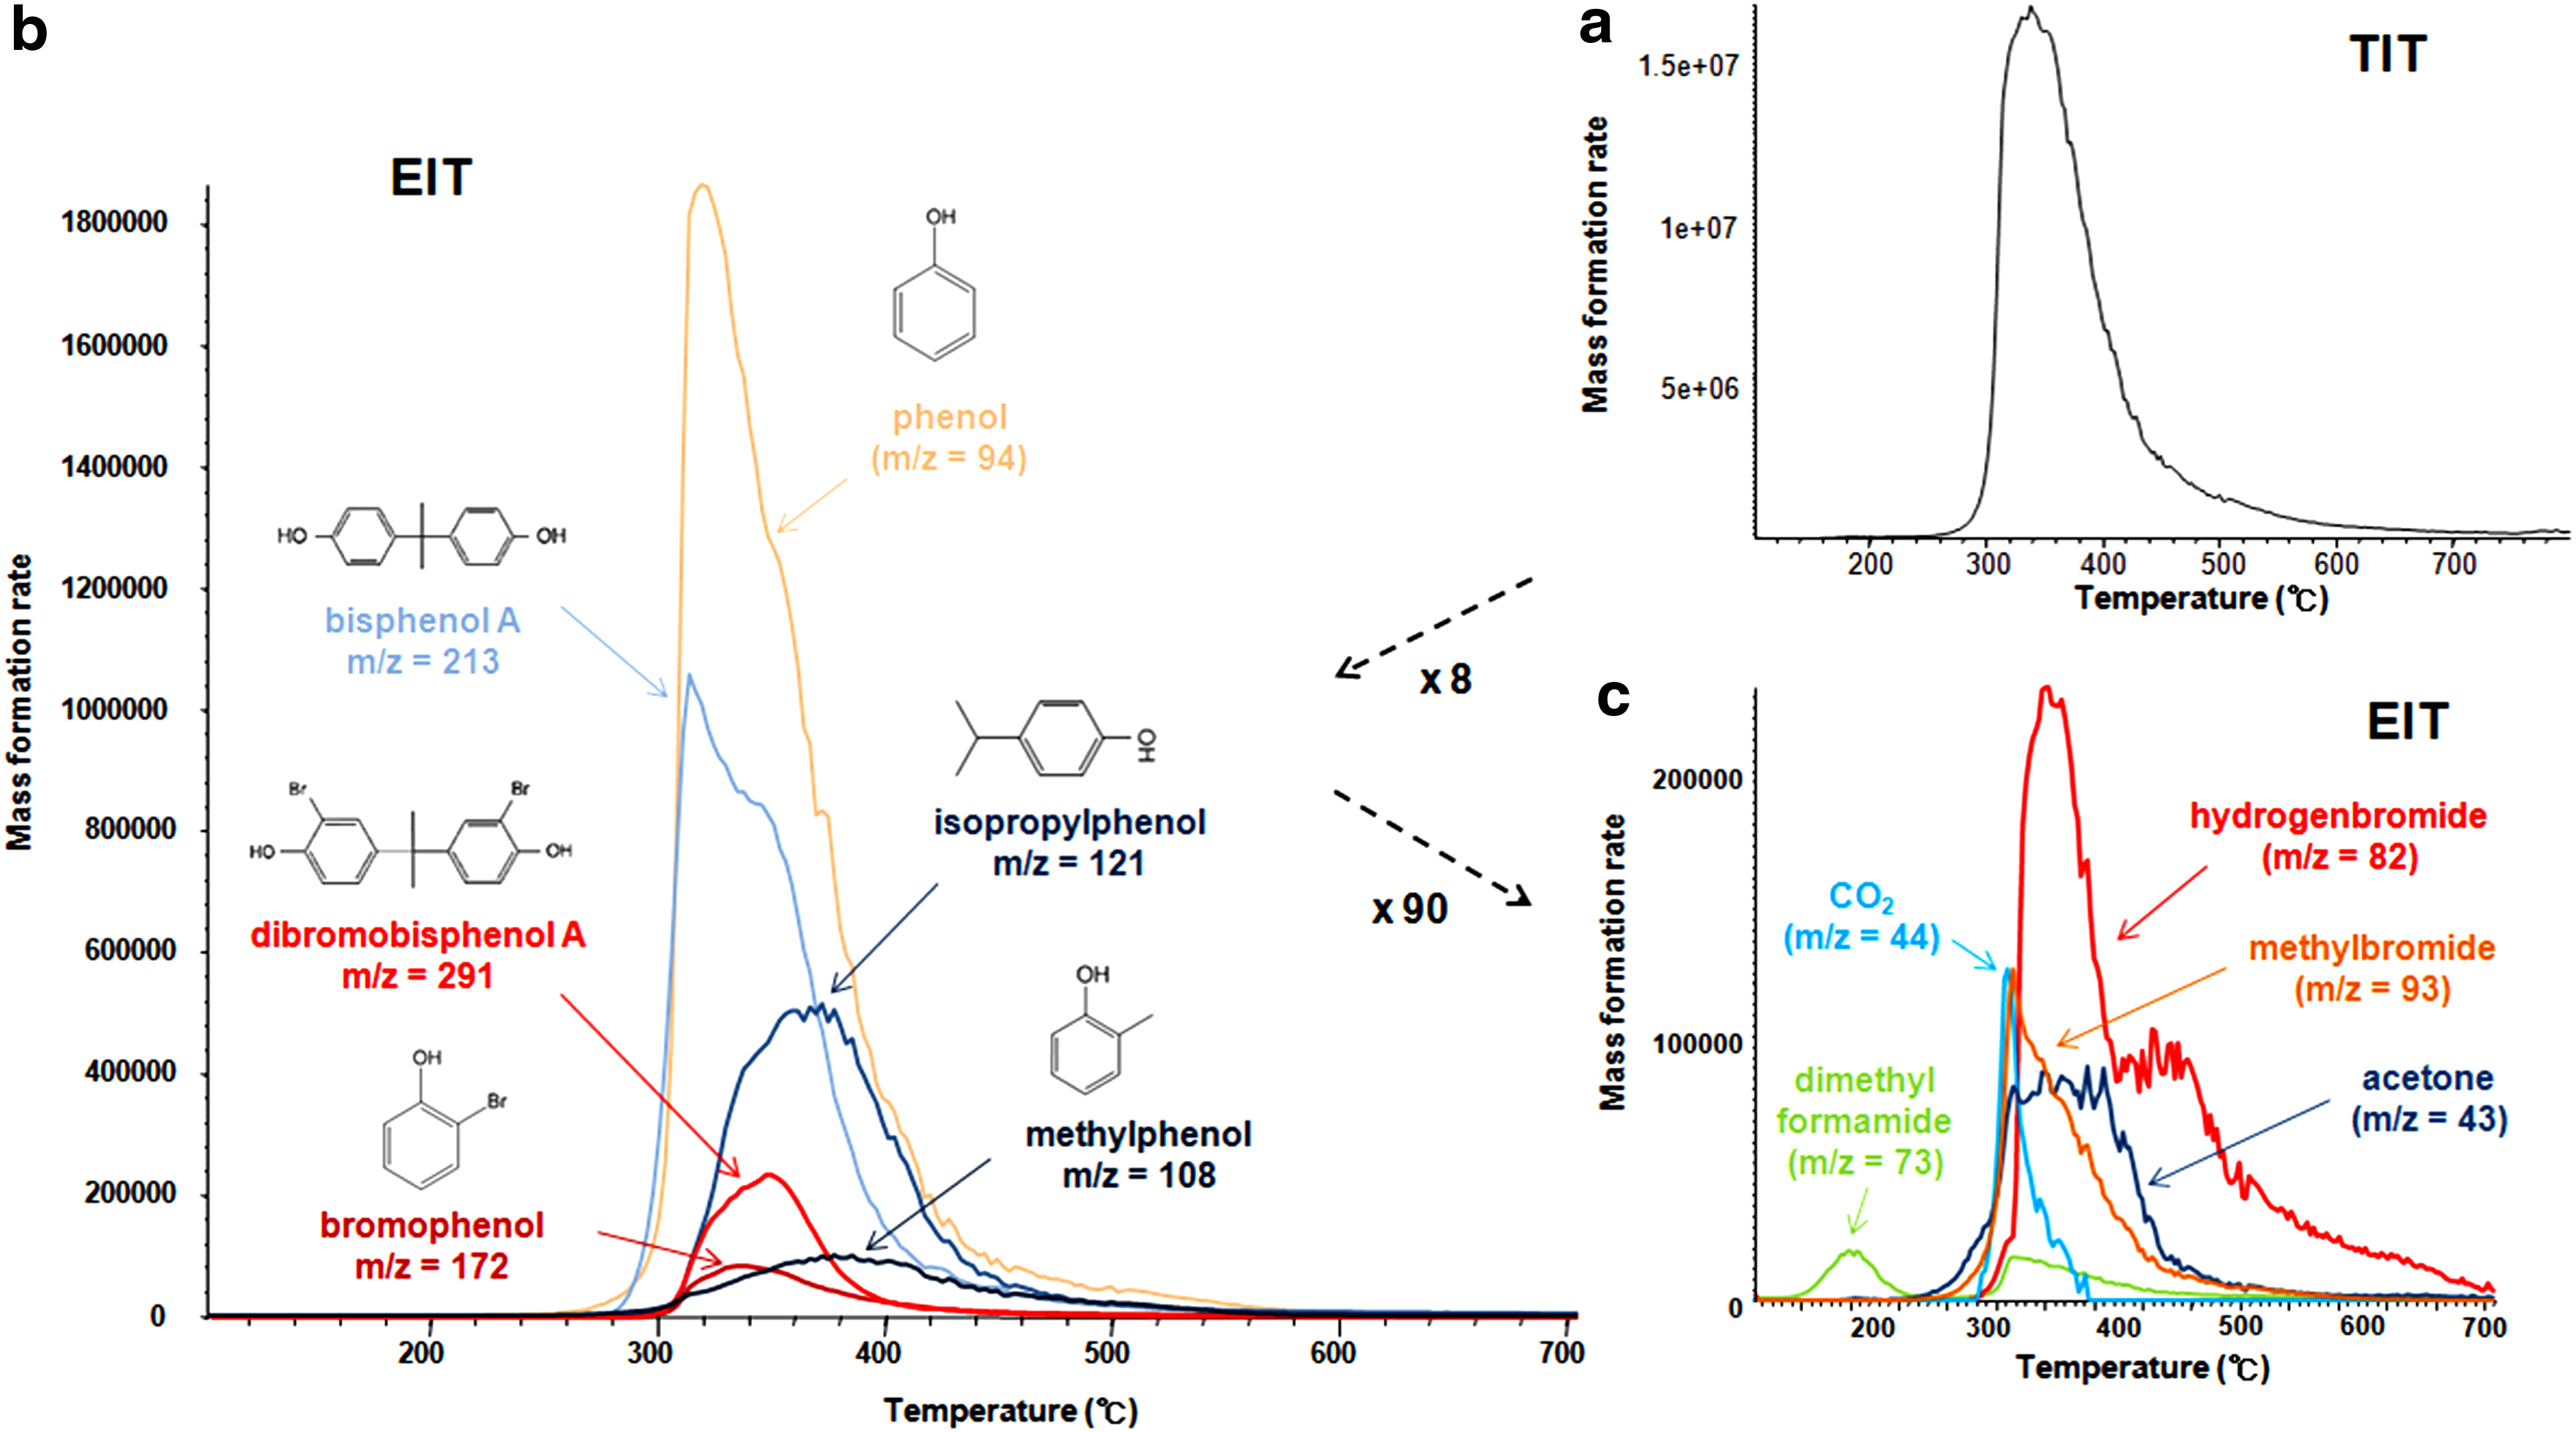
The total ion thermogram (Fig. 7a) and extract ion thermogram (EIT; Fig. 7b, c) of evolved gases obtained from EGA-MS analysis of waste e-PCB are introduced to support the results of multi-shot analyses (Fig. 6). As expected, the shape of the EGA curve is visually similar to that of the DTG curve.
The EITs of e-PCB also suggest that the evolved gases are composed mainly of phenols (m/z=94, 108, 121), bromophenol (m/z=172), bisphenol A (m/z=213), and dibromobisphenol A (m/z=291). In addition, dimethyl formamide (m/z=73), CO2 (m/z=44), methylbromide (m/z=93), acetone (m/z=43), and HBr (m/z=82) were also observed as minor components.
According to the distribution patterns of the products over the reaction temperatures (Fig. 7b), the major compounds were divided into three groups according to their emission temperatures (Table 3): (1) Group 1, phenol and bisphenol A; (2) Group 2, bromophenol and dibromobisphenol A; and (3) Group 3, isopropylphenol and methylphenol. The Group 1 compounds showed the lowest onset temperatures for their generations and were generated over the broadest temperature regions (260–580°C). Group 2 compounds were generated over the narrowest temperature regions from 300°C to 440°C. Group 3 compounds showed the same onset temperature as Group 2 but were produced over broader temperature regions.
Temperatures were determined by evolved gas analysis/mass spectrometry at a heating rate of 20°C/min.
Group 1 compounds are generated over the entire temperature regions, suggesting that their generations are made by the thermal degradations of both BERs and NBERs. The thermal decompositions of BERs are dominant at the lower temperature regions, whereas those of NBERs dominate at the higher temperature regions.
The presence of Group 2 compounds at the lower temperature regions confirmed the degradation of thermally less stable BERs. The Group 3 compounds are fingerprints of the thermal degradation of NBERs. The same onset temperature for the degradation of both resins shows that BERs and NBERs begin to decompose at the same time. The pyrolysis rate of the BERs was faster, thereby exhibiting a narrower decomposition region and lower ending temperature of reaction.
N-containing cross-linking agent is used to blend the BERs and NBERs during the PCB manufacturing process, and this N-containing cross linkage is initially decomposed. The thermal decomposition of BERs is likely to be decomposed first by nucleophilic substitution through amines within the aromatic ring of BER to release HBr via the Hofmann–Matius reaction (Nakao et al., 1989). The HBr then destabilizes the resins by reacting with the amine curing agent (March, 1992), resulting in the formation of dimethyl formamide. Methylbromide, carbon dioxide, and acetone were also generated as a result of the initiation decomposition process of BERs (Balabannovich et al., 2004). EGA and MSA showed that these results correspond well with those in the literature. Therefore, the production profiles identified by multi-shot and EIT suggest that the thermolysis of waste e-PCB is accounted for by two independent reactions of BERs and NBERs to produce intermediates.
On the other hand, HBR is also generated during char and dioxin formation at the higher temperature regions (Grause et al., 2008). Grause et al. (2008) suggested that the tetra brominated bisphenol A forms phenoxy radicals after the elimination of bromine, and these radicals are the precursors for char and dioxin formation. Hence, the slow charring process of intermediates is achieved by releasing HBr and other volatiles that are associated with char forming aromatics. Since the EGA results also showed that HBr was evolved over a wide temperature range between 280°C and 700°C (Fig. 7c), a large amount of HBr emission at high temperatures could imply the charring processes of intermediates.
Reaction pathway
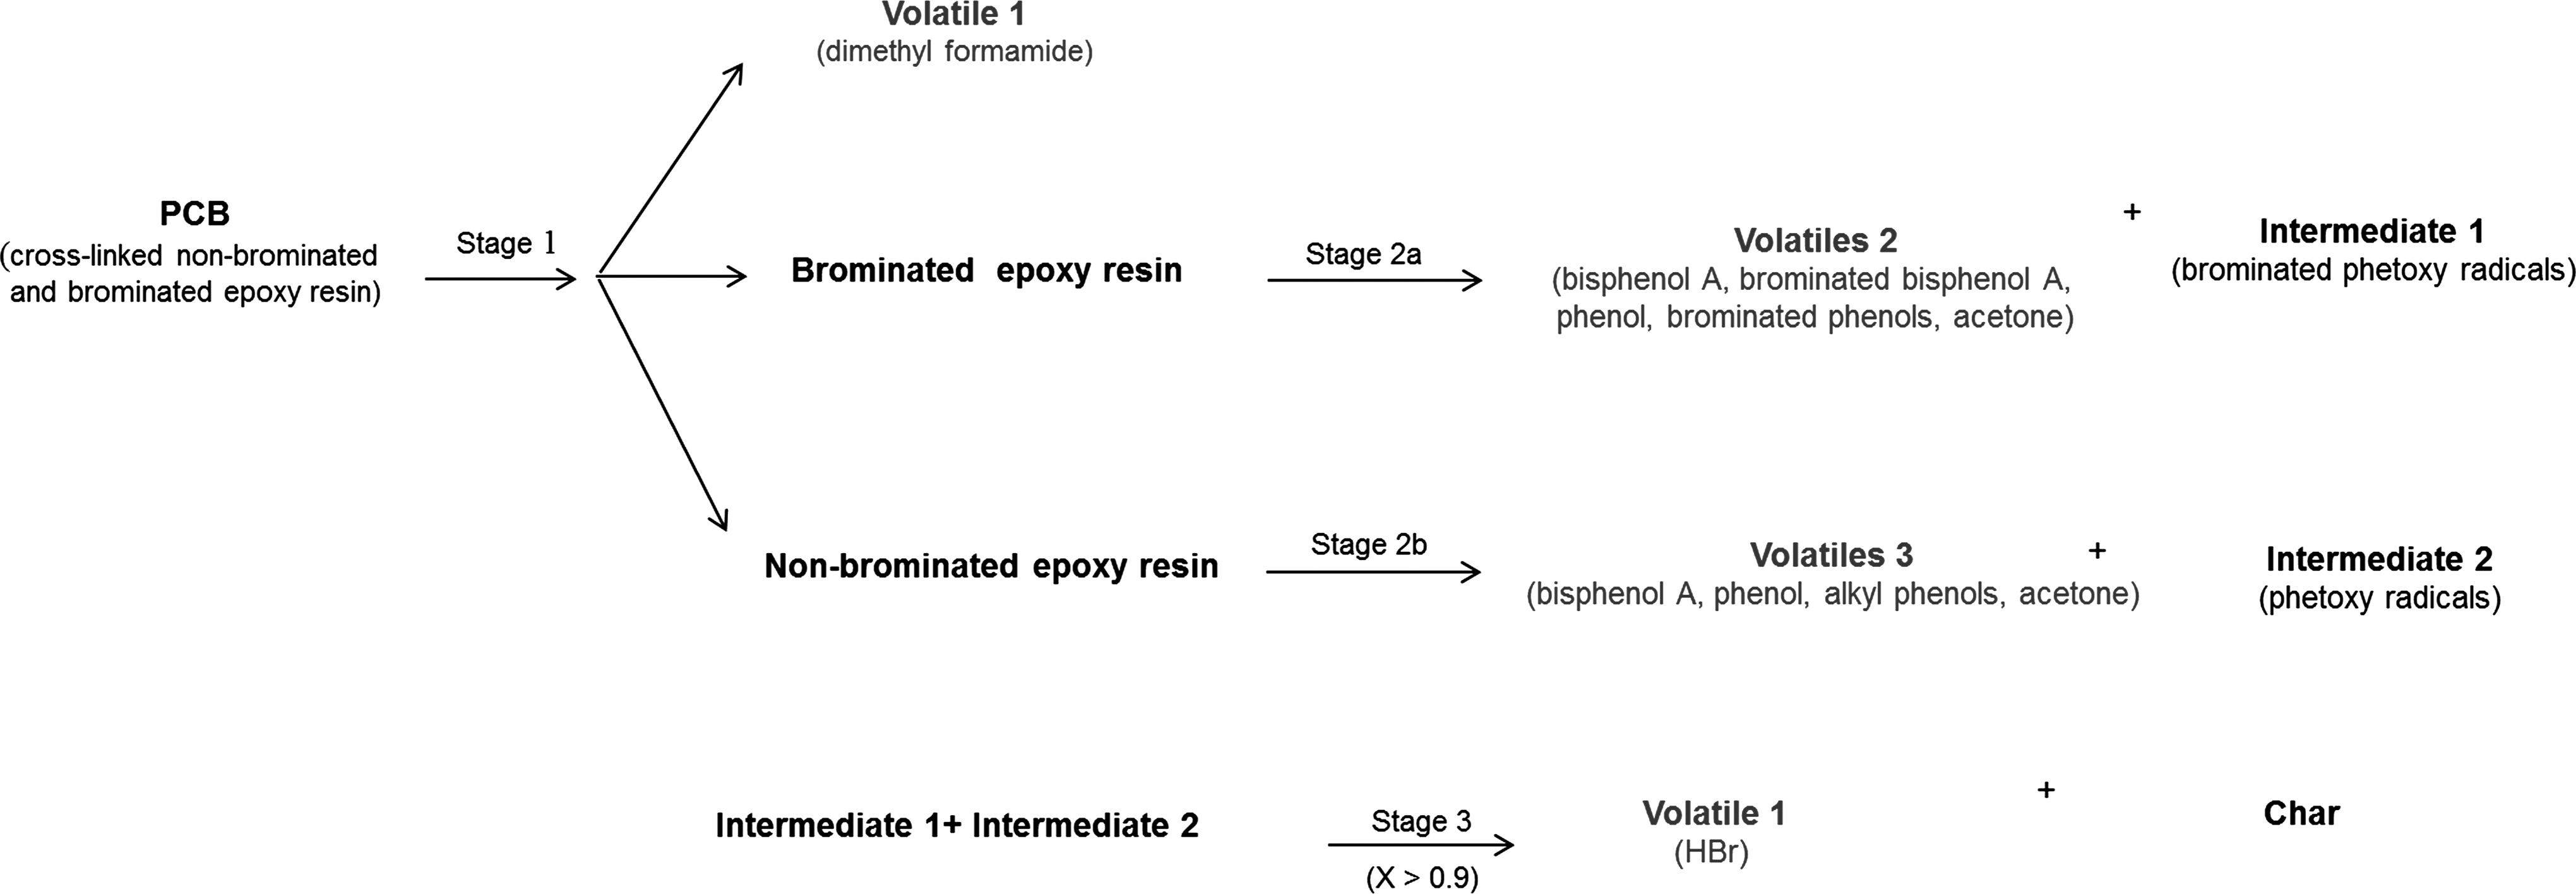
As with other conventional pyrolysis reactions, the thermal decomposition of BERs and NBERs in waste e-PCB is initiated by radicals originating from the cleavage of thermally unstable bonds. The possible pyrolysis reaction pathways of waste e-PCB (Fig. 8) can be summarized as follows:
Possible reaction pathways of waste e-PCBs.
The pyrolysis reaction of waste e-PCB can be accounted for by a series of reactions:
(1) First-stage reaction: initial cleavage of N-containing cross-linkage and separation of BERs and NBERs. (2) Second-stage reaction: independent decomposition of BERs and NBERs to form intermediates and pyrolysis evolved gases. (3) Third-stage reaction: conversion of the intermediate to chars with the concomitant emission of hydrogen bromide.
Conclusions
Kinetic studies of waste e-PCB indicated that its pyrolysis reaction can be represented by either a simple series reaction or a series reaction with two independent reactions at the first-step reaction. The Py-GC/MS results support two independent reactions. BERs and NBERs are the major epoxy resins in e-PCB. Independent decomposition of the two resins is expected, because two epoxy resins exhibit different thermal stability (Eswaraiah et al., 2008). In the first-stage reaction, the cross-linkage of BERs and NERS is decomposed. In the second stage, the BERs and NBERs are decomposed concurrently, whereas the BERs are degraded mainly in the low temperature region due to less thermal stability and because the thermally more stable NBERs are degraded over a broader temperature region. Since volatiles, including HBr, are evolved from the thermally stable intermediates of the first-stage reaction, the intermediates are converted to char products.
Footnotes
Acknowledgment
This research was supported by Hallym University Research Fund, 2012 (HRF-201203-010).
Author Disclosure Statement
No competing financial interests exist.