
Abstract
Abstract
Conversion of CH3Hg+ concentrations in water to CH3Hg+ concentrations in fish tissue is critically important in characterizing Hg health risks to humans and biota in aquatic ecosystems. However, this is a challenging task due to complex biogeochemical CH3Hg+ processes that are replete with uncertainty. In the present study, the uncertainty was reduced by employing the Spreadsheet-based Ecological Risk Assessment for the Fate of Mercury (SERAFM) model and a linear relationship between logarithmic Hg concentrations and stable isotope ratios of nitrogen (δ15N) in biota. By using this approach, the fate, transport, and bioaccumulation of CH3Hg+ in Sarasota Bay, FL, was modeled. Modeling results suggest that ∼60% of the total Hg loading (8.7 kg/year) to the Sarasota Bay in 2011 originated from atmospheric Hg deposition to the watershed with subsequent transport to the waterbody via stormwater runoff. This indicated that watershed runoff could be an important source of Hg to a bay adjacent to highly urbanized areas. In addition, our modeling results suggested that Hg runoff reduction (90%) from impervious surfaces together with lowering atmospheric Hg deposition (21→10 μg/m/year) would be a practical approach to lower current Hg levels and associated risks to the Sarasota Bay ecosystem. Since future Hg loadings to the Bay are likely to rise from increases of atmospheric Hg deposition and watershed urbanization, it will be necessary to reduce various Hg loadings by employing appropriate implementation plans for the management of this urbanized watershed.
Introduction
E
Once elemental Hg (Hg0) is released from coal- and oil-fired power plants, Hg0 is slowly oxidized to Hg2+ with an approximate half-life of 1 year. Hg0 can travel long distances and contaminate remote pristine areas (Fitzgerald et al., 1998). During the atmospheric transport, the Hg0 and Hg2+ will directly enter a waterbody via dry and wet deposition. In addition, atmospheric Hg can be deposited in a watershed first and then be transported into the adjacent waterbody via runoff and erosion that may vary significantly depending on the land cover (Hurley et al., 1995; Mason et al., 1997; Balogh et al., 1998). In an aquatic environment, Hg will change its speciation by oxidation–reduction and methylation–demethylation. The reactions will produce CH3Hg+ that is readily bioaccumulated in organisms at the base of a food chain and then is biomagnified via trophic transfer threatening the top predators (Morel et al., 1998).
Due to the complex behavior of Hg in a waterbody, watershed, and food web, the effectiveness of managing Hg air emissions to reduce Hg levels in a waterbody and biota has become problematic (Ambrose, 2005). Quantifying various Hg sources to a waterbody and determining the linkage between Hg loadings to water and fish tissue CH3Hg+ concentrations are prerequisites to developing accurate TMDLs in waterbodies. There have been several studies that have estimated the Hg cycling in watersheds and/or waterbodies where the atmospheric deposition is the predominant Hg source (Hurley et al., 1995; Ambrose, 2005; Brown et al., 2007; Liu et al., 2008; Knightes et al., 2009; Selin et al., 2010; Sunderland et al., 2010; Liu et al., 2011). However, there are very few studies focused on the Hg cycling in an estuary and coastal area that support habitats for diverse organisms and also that receive significant anthropogenic mercury from the watershed (Sunderland et al., 2010).
In the present study, Hg transport and transformation and Hg bioaccumulation in the Sarasota Bay estuary were investigated using the Spreadsheet-based Ecological Risk Assessment for the Fate of Mercury (SERAFM) model (Knightes, 2008). The model is a steady-state model that incorporated chemical, physical, and biological processes to describe mercury transport and fate in surface water and throughout the watershed. The model includes (1) watershed Hg transport; (2) solid transport and cycling within the waterbody; (3) waterbody Hg transformation processes, such as biogeochemical oxidation–reduction, sorption–desorption, and complexation with various ligands; and (4) Hg loadings to the Sarasota Bay from atmospheric Hg deposition. The model was chosen as it contains enough detailed Hg processes to describe the Hg cycling in the Sarasota Bay ecosystem. It has also been successfully applied to various aquatic ecosystems to study Hg transport, transformation, and bioaccumulation. In addition, the model has a spreadsheet structure that allows users to modify the Hg-related processes in SERAFM for various purposes of modeling.
Previously published data on Hg behavior were used in the model (Hong et al., 2013), and watershed information and data were collected from the literature and state/federal government websites. Models for gaseous Hg0 evaporation from the Bay and CH3Hg+ bioaccumulation in the food web using stable isotope ratios of nitrogen (δ15N) in biota were developed separately and were conveniently incorporated into the spreadsheet structure of SERAFM (Tom et al., 2010; Hong et al., 2013). Using the modified SERAFM, Hg sources in the Bay are identified and strategies to lower Hg exposure to humans and resident bottlenose dolphins are investigated.
Mathematical Modeling
Site description and conceptual model
Sarasota Bay is located off the west coast of Florida and is a coastal lagoonal system bounded by several key islands. In between islands, there are several passes, such as Anna Maria Sound to the north and Big Pass to the south, that exchange the Bay water with the Gulf of Mexico seawater as shown in Fig 1. The average depth, area, and volume of the Bay are about 2 m, 114 km2, and 2.3×10⁸ m3, respectively, and the estimated hydraulic residence time is 0.08 year (SBEP, 2010). There are several tributaries, such as Hudson Bayou, Phillippi Creek, and Whitaker Bayou, which discharge freshwater to the Bay with an average flow rate of 3.6×10⁸ m3/year (USEPA, 1999). Bay water is primarily replaced by the Gulf of Mexico seawater that has an average flow rate of 2.9×10⁹ m3/year. The high salinity (∼30 ppt) of the Bay further supports this explanation.
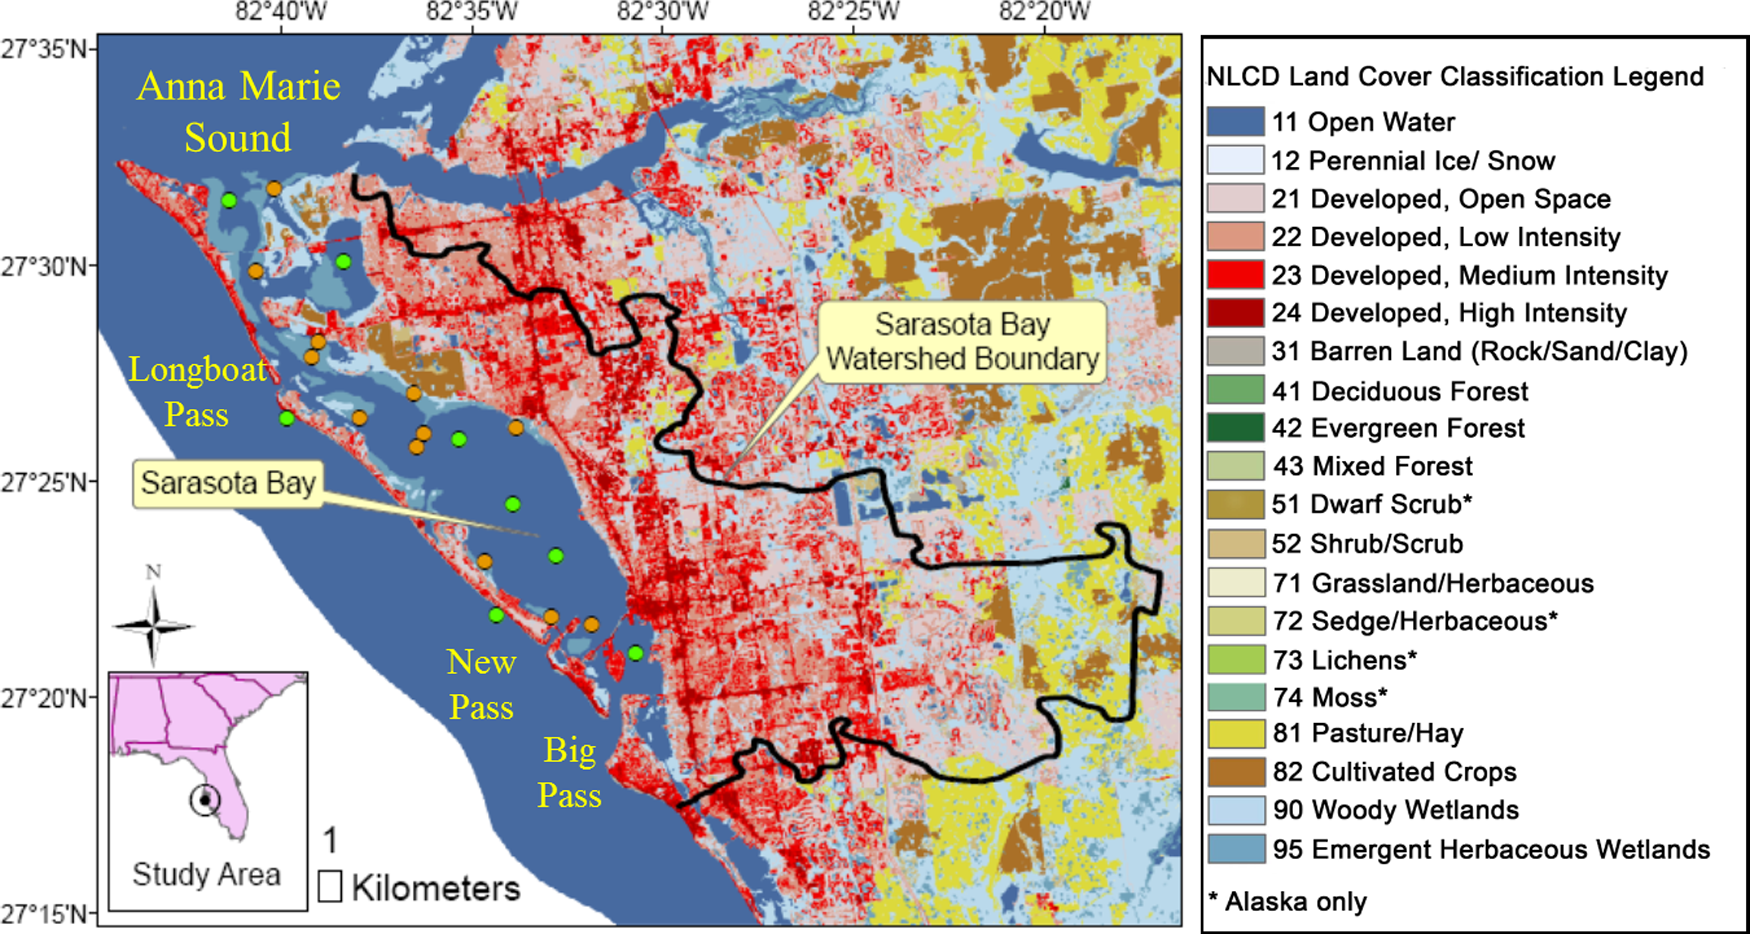
Major Hg sources to the Bay were considered to be (1) direct atmospheric Hg loading, (2) Hg-contaminated stormwater runoff from the highly urbanized watershed that covers 800 km2 (watershed:waterbody ratio=1:7), and (3) Hg loading by the Gulf of Mexico seawater inflow. The Hg in the Bay undergoes complex biogeochemical reactions, such as partitioning to solids and transformation by oxidation, reduction, methylation, and demethylation. Some of the Hg is transformed to Hg0 and released back to the atmosphere via gaseous diffusion. A significant portion of the Hg in the Bay is considered to be deposited in sediments or transported to the Gulf of Mexico by seawater outflow. The CH3Hg+ in the Bay is bioconcentrated at the base of the food web of the Bay and then biomagnified to the top predators as shown in our previous study (Hong et al., 2013). The Sarasota Bay settings and watershed coverage are shown in Fig. 1, and a conceptual model for Hg fate and transport in the Sarasota Bay ecosystem is shown in Fig. 2.
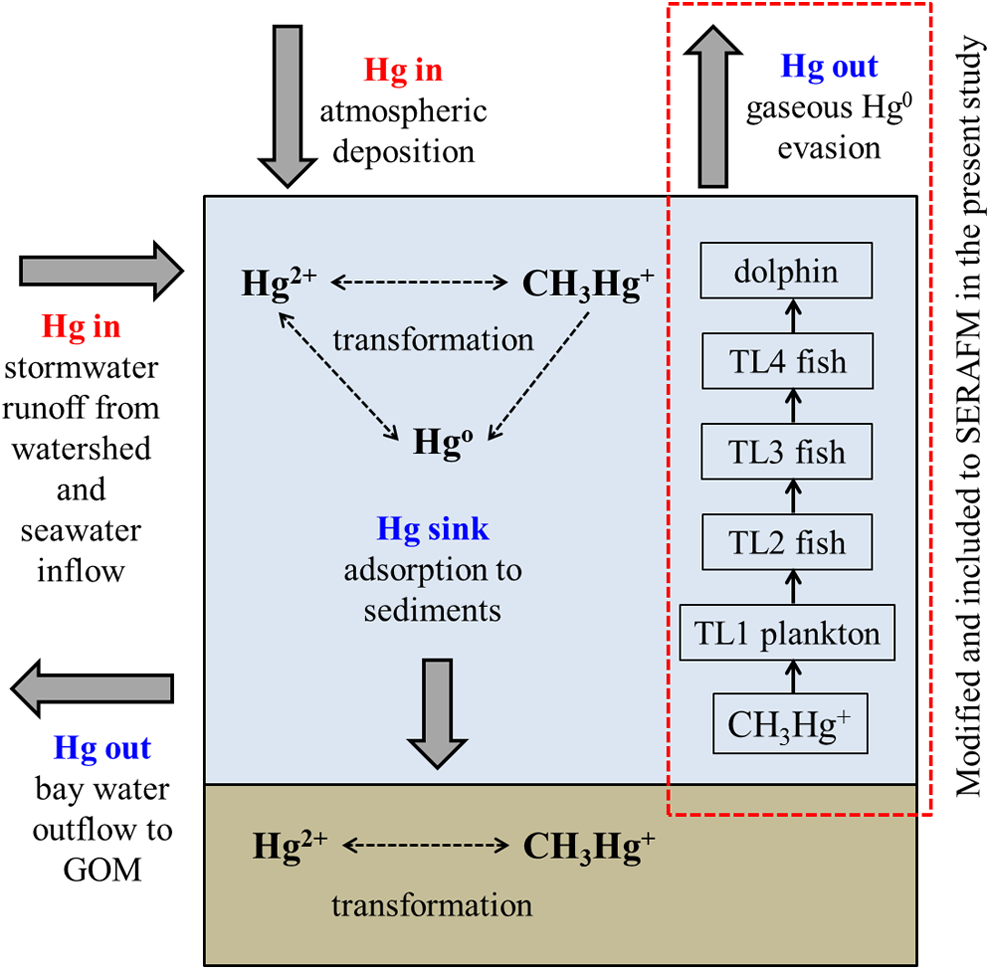
Schematic representation of the Hg fate and transport in the Sarasota Bay ecosystem. GOM, Gulf of Mexico.
Model for Hg transport and transformation in the watershed and waterbody
The SERAFM (Vesion105a_1) model is used to simulate the Hg biogeochemical reactions in the Bay and the Hg transport in the watershed (Knightes, 2008). In the present study, the SERAFM was used primarily to estimate CH3Hg+ concentrations in the water column. Then, the water column CH3Hg+ concentrations were used to estimate CH3Hg+ concentrations in plankton, fish, and bottlenose dolphins' blood using δ15N. It is assumed that the Sarasota Bay had reached quasi-steady state because the atmospheric Hg deposition, which was considered to be the major source of Hg to the Sarasota Bay, had not significantly changed since 2003 (Prestbo and Gay, 2009; Hong et al., 2013).
Hg gaseous diffusion from water to air
Gaseous release of Hg0 from the Sarasota Bay to the air is expected because Hg0 is generally supersaturated in the water column (Andersson et al., 2007). The air–sea exchange of Hg0 was modeled as follows (Sunderland and Mason, 2007):
where Fv is the volatile Hg0 loss (g/year), kw is the annually averaged water-side mass transfer coefficient (m/year), Cw,Hg0 is the Hg0 concentration in the Bay water (μg/m3), which is calculated by SERAFM, and Aw is the Bay surface area (m2). The Hg loss by gaseous evaporation from the Bay was subtracted from the total Hg loading to the Bay calculated by SERAFM.
Modeling Hg bioaccumulation and biomagnification
Once dissolved water column and sediment porewater CH3Hg+ concentrations are determined by SERAFM, the CH3Hg+ concentrations at the food chain bases, such as trophic level 1 or 2 biota, were calculated using bioconcentration factors (BCFs) as follows (Burkhard, 2003):
where CCH3Hg,fb is an average CH3Hg+ concentration in a food chain base (ng/g), BCFfb is an average CH3Hg+ BCF in the food chain base (L/kg), and CCH3Hg,water is an average CH3Hg+ concentration in a filtered water sample (ng/L). The CH3Hg+ concentrations in higher trophic level organisms in the food chain were estimated using the linear relationship between logarithmic CH3Hg+ concentrations in organisms and 15N isotope fraction as follows (Kidd et al., 1995; Tom et al., 2010):
where CCH3Hg,org is an average CH3Hg+ concentration (ng/g) in an organism, δ15Norg is an average stable isotope ratio of nitrogen (δ15N) of the organisms (‰), ACH3Hg is an average slope of the equation referring to the biomagnification rate for CH3Hg+, and BCH3Hg is an average intercept representing the food chain-specific baseline CH3Hg+ value for the food chain base. The CH3Hg+ concentrations at the food chain base calculated in Equation (2) are used to obtain the BCH3Hg as follows:
where δ15Nfb is an average stable isotope ratio of nitrogen of a food chain base (‰). If water column CH3Hg+ concentrations are changed by the change of Hg loadings to the Bay, BCH3Hg+ needs to be recalculated.
Modeling methylmercury uptake by dolphins and humans
The CH3Hg+ dietary exposure of bottlenose dolphins is estimated using δ15N (Hong et al., 2013). Assuming 3.4‰ of δ15N enrichment from the fish to dolphins, the δ15N of dolphins can be expressed as follows (Cabana and Rasmussen, 1994):
where δ15Ndolphin, δ15N2, δ15N3, and δ15N4 are the average nitrogen isotope ratios in dolphins, trophic level 2, 3, and 4 fish, respectively, and α2, α3, and α4 are the dietary fractions of the trophic level 2, 3, and 4 fish, respectively. The α2, α3, and α4 need to be constrained as follows:
Dolphin body weight normalized Hg daily uptake rates (μg/kg/day) are calculated as follows (USEPA, 1993; Knightes, 2008):
where FIR is the body weight normalized fish ingestion rate (g/kg/day), and, C2, C3, and C4 are the average CH3Hg+concentrations (g/g) of trophic level 2, 3, and 4 fish, respectively.
A similar approach was used to estimate human CH3Hg+ exposures. When Equation (7) was used for humans, FIR represents the human body weight normalized fish ingestion rate (g/kg/day), and, α2, α3, and α4 represent the fraction of fish ingested by humans for trophic level 2, 3, and 4 fish, respectively.
Model parameters
Model input parameters for SERAFM and bioaccumulation modeling were grouped into three categories: (1) measured in the field by the authors, (2) collected from the literature, and (3) calibrated within the literature reported values observed in other environments. The first category (measured) is shown in Tables 1 and 2 with the reference of Hong et al. (2013) next to parameters. The second category (collected from the literature) is shown in Tables 1 and 2 with the references other than Hong et al. (2013). The calibrated parameters are summarized in Table 3.
Mercury found in soil was assumed to be all oxidized to Hg2+ (Morel et al., 1998).
Concentrations of Hg2+ and CH3Hg+ obtained in the nearby Gulf of Mexico water, the Ponce de Leon Bay located in southwest Florida (Bergamaschi et al., 2012), were used.
It is assumed that the mercury species in wet and dry depositions are Hg2+ and Hg0, respectively (Morel et al., 1998; Lin and Pehkonen, 1999). The Hg2+ concentration in precipitation was 13 ng/L, which was calculated from the reported wet deposition (17 μg/m2/year) and the annual precipitation of 130 cm/year. The dry Hg0 deposition is estimated from Seigneur et al. (2004).
References: aMorel et al. (1998); bUSEPA (1999); cSeigneur et al. (2004); dMarsik et al. (2007); eSunderland and Mason (2007); fNADP (2010); gSBEP (2010); hBergamaschi et al. (2012); iSCW (2012); jHong et al. (2013).
DOC, dissolved organic carbon; SERAFM, Spreadsheet-based Ecological Risk Assessment for the Fate of Mercury.
High dependence on trophic level 4 fish is assumed for a conservative estimation of dolphin Hg exposure.
Hg uptake from marine fish consumption (0.027 μg/kg/day) is added in addition to the Hg uptake by trophic level 2, 3, and 4 fish.
All parameters are for the reactions in the water column unless noted otherwise.
The data shown in Tables 1 and 2 were obtained from samples collected from field studies conducted from late June to early July in 2011. Samples of sediments (sample size n=20), overlying water (n=15), seagrass (n=12), zooplankton (n=16), shellfish, such as tulip snail (n=9), quahog (n=3), sunray venus (n=5), penshell (n=7), and lightening whelk (n=4), and finfish, such as pinfish (n=7), pigfish (n=6), spot (n=5), spotted seatrout (n=6), ladyfish (n=2), and white mullet (n=7), were collected and analyzed for Hg species. Detailed experimental and analytical procedures and results are available in our previous study (Hong et al., 2013). The CH3Hg+ concentrations in the blood (n=55) of the Sarasota Bay bottlenose dolphins were determined in a different study (Woshner et al., 2008).
Some model parameters were obtained from peer-reviewed journal articles and/or technical reports. The land use information in the watershed was obtained from the Sarasota County Water Atlas (SCW, 2012). The percentage of impervious area was 21%, which was calculated from the summation (69%) of urbanized area (65%) and transportation/utilities (4%) and multiplying by 0.3, which is the median value (0.2–0.4) of impervious area ratio for residential neighborhoods (FDEP, 2006). The percentage of wetland, riparian, and upland were 4%, 19%, and 1%, respectively, and the remaining area (55%) was assigned for “contaminated soil” in SERAFM to include soil collected in residential areas. Default values were used for the remaining parameters, such as mercury complexation constants with Cl−, SO42−, and dissolved organic carbon, watershed runoff coefficients, and other various biotic and abiotic rate constants.
Parameters that were not available in the literature were calibrated and summarized in Table 3 that includes (1) Hg partitioning coefficients and (2) Hg transformation-related rate coefficients. The parameters were adjusted to fit primarily the filtered CH3Hg+ concentration in the overlying water since the concentration was used as a central value to calculate CH3Hg+ concentrations in a food chain base using Equation (2), which was subsequently used to calculate CH3Hg+ levels in the entire food web using Equation (3). The Hg partitioning coefficients to suspended solids were adjusted to fit the measured partitioning of the mercury species between filtered and nonfiltered samples. The Hg methylation, demethylation, oxidation, and reduction rate coefficients in water column and sediment were adjusted to fit the observed ratios between total Hg and CH3Hg+ in the water column and sediment.
The average water depth of Sarasota Bay was shallow (∼2 m), and no vertical profiles of dissolved oxygen concentrations were observed during field sampling. SERAFM separates the water column into two layers, epilimnion and hypolimnion, although no such stratification was observed in the shallow waterbody of the Sarasota Bay. To model the vertically homogeneous water column system, it is assumed that the epilimnion (1.9 m) is deeper than the hypolimnion (0.1 m), and rapid particle exchange between the two layers is assumed to make the suspended solid concentration in the epilimnion close to the measured suspended solid concentrations. The abiotic solid concentrations in water inflow and abiotic resuspension and settling velocities were adjusted to fit the measured fixed suspended solids (≈25.8±2.5 mg/L) in the water column. The biotic settling velocity was fitted to particulate organic matter contents in sediments (≈1.37%±0.65%). The fitting of the parameters was independent of each other, that is, the change of mercury partitioning coefficients does not affect the ratio between total mercury (THg) and methylmercury and did not significantly influence the results of the present study. Extensive sensitivity analyses were conducted to know the relative importance of the parameters, and the outcome is discussed in this article.
Results and Discussion
Modeling results
To assess Hg risks in an ecosystem, SERAFM provides three scenarios: historically contaminated sites with industrial activities (scenario 1), background and reference condition (scenario 2), and a proposed possible sediment clean-up goal (scenario 3). Since Sarasota Bay has experienced little impact from industrial activities, scenario 2, where the Hg concentration in an ecosystem is directly related to atmospheric Hg deposition, was considered to be the appropriate model for the present study.
The field measured and model-predicted Hg concentrations in Sarasota Bay are compared in Table 4. To quantify the accuracy of the model prediction, the relative errors (RE) were obtained as follows:
The errors were calculated by 100×absolute value of (estimated values−measured values)/measured values.
AVG, average; SD, 1 standard deviation; RE, relative error; THg, total mercury; dw, dry weight.
where Cmodeled was the scenario 2-estimated mercury species concentrations and Cmeasured were the measured concentrations (Hong et al., 2013). Overall, the RE varied between 2% and 90%, and the errors for the unfiltered overlying water THg concentrations (127%) were the highest among the evaluated values, although the predicted values were generally confined within the range of the measured values. The RE for the filtered overlying water CH3Hg+ concentration, which was the central factor that relates Hg atmospheric deposition to Hg concentrations in biota, was only 0.45%.
Modeling results provided some information about the biogeochemical conditions in the Bay. The distribution of Hg among Hg0, Hg2+, and CH3Hg+ in overlying water, sediment porewater, and sediment is shown in Fig. 3. The major Hg species entering the waterbody were inorganic mercury (Hg2+ or Hg0). However, CH3Hg+ was produced from Hg2+ and the model suggested that ∼6% and 2% of the THg in the overlying water and sediment was CH3Hg+, respectively. The net methylation rate constants, which were calculated from methylation rate constants (day−1) divided by demethylation rate constants (day−1), were 280 and 0.02 [−] in the overlying water and sediment, respectively.
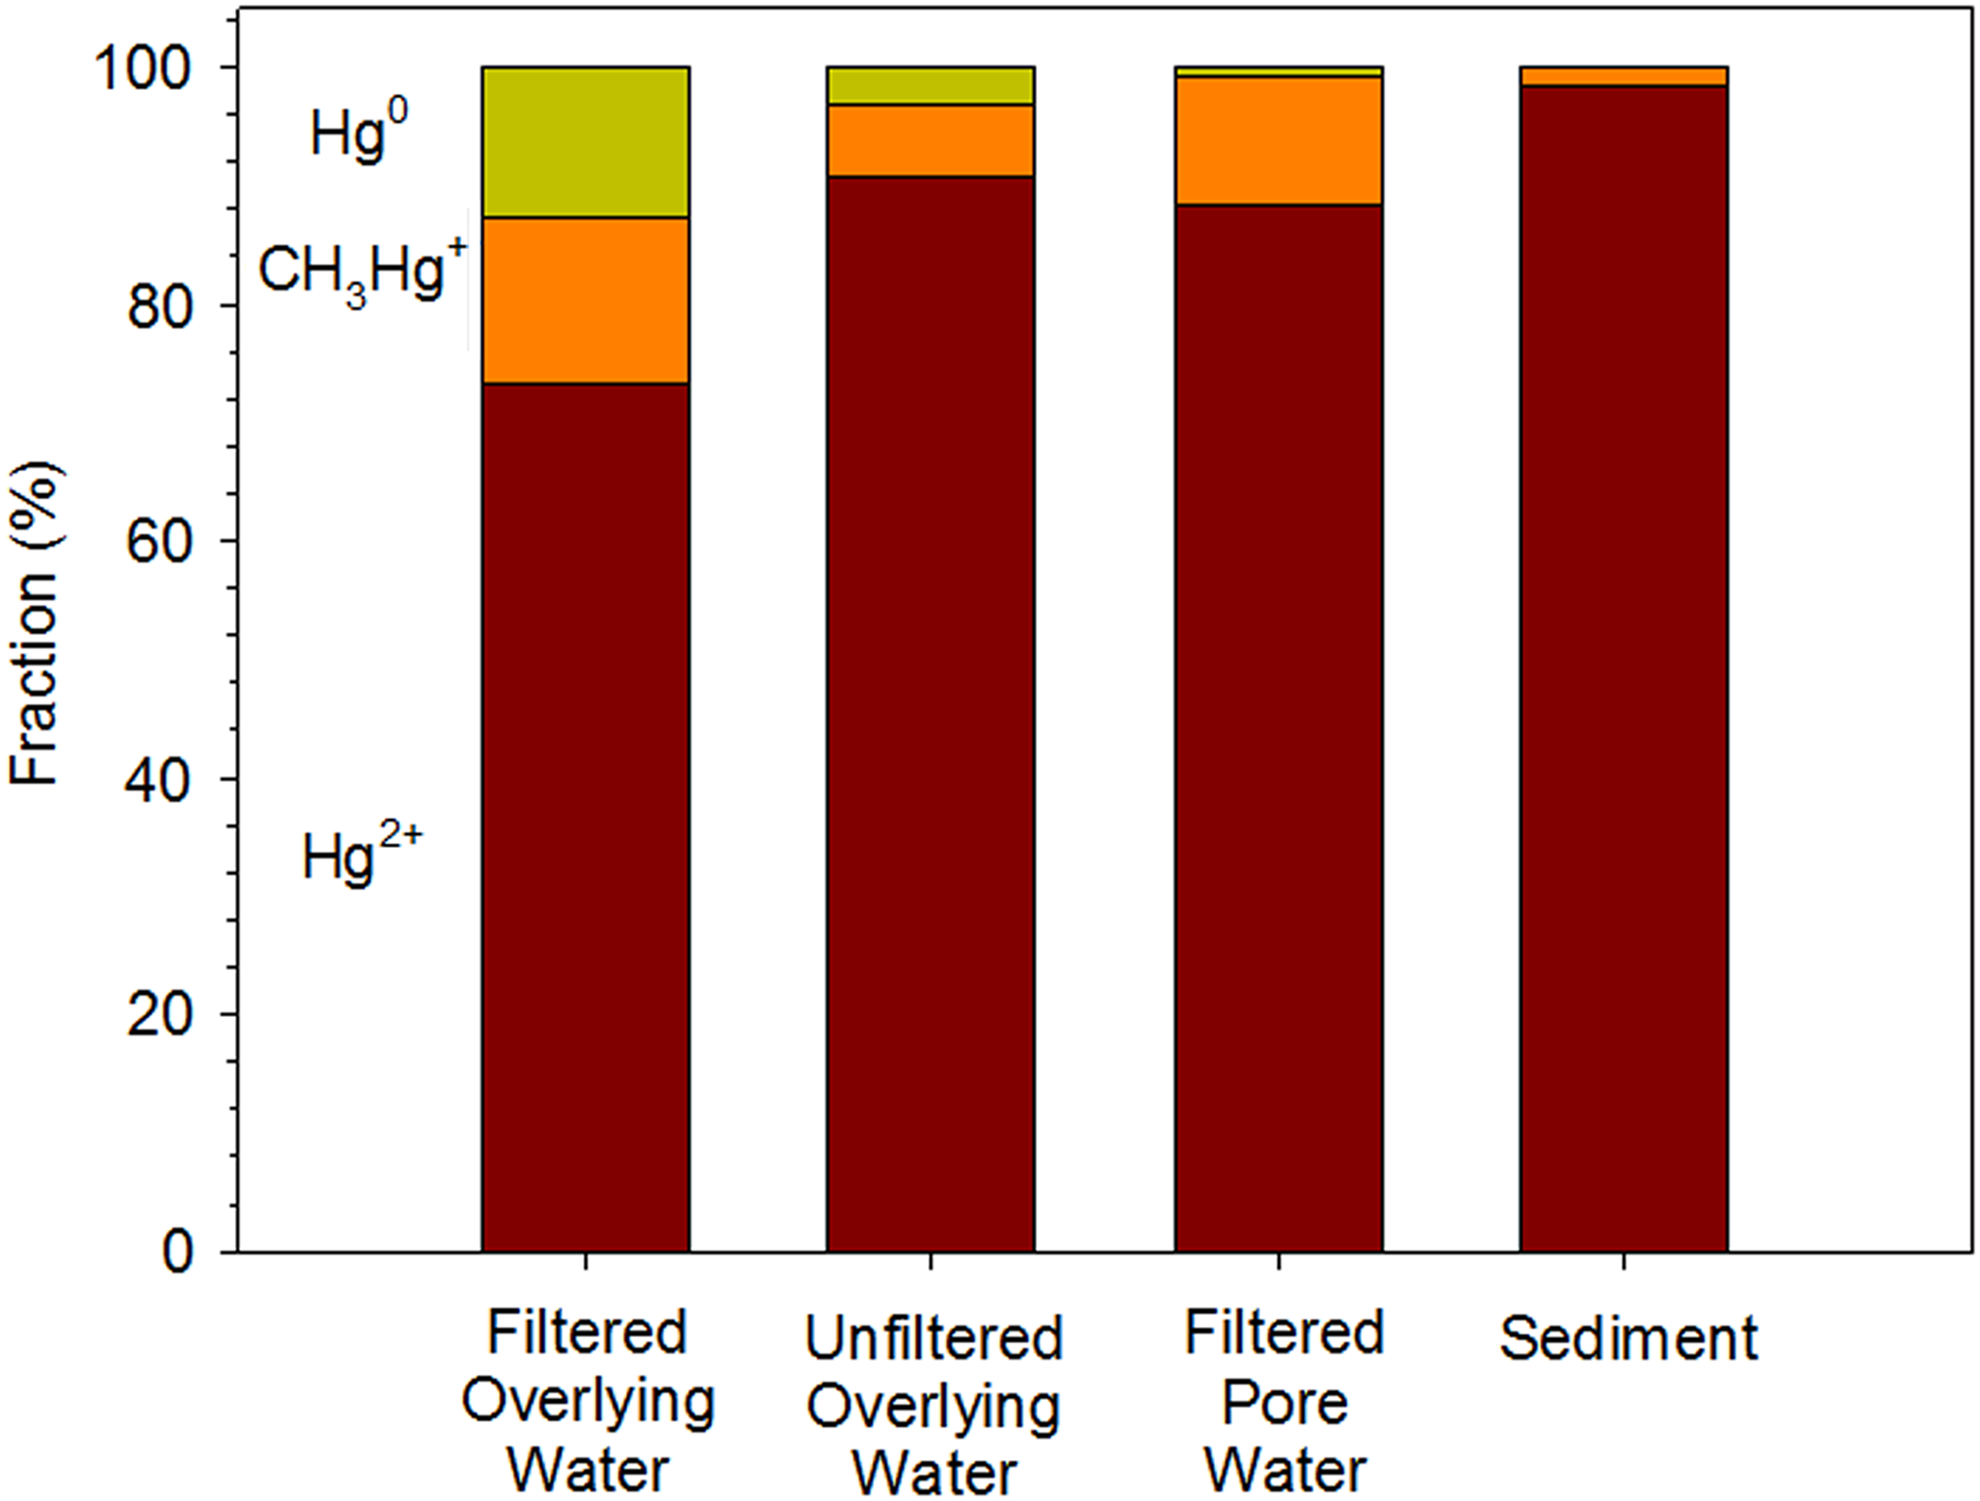
The speciation of Hg in filtered and unfiltered overlying water, filtered porewater, and sediment.
The model linked the CH3Hg+ concentration in the filtered water to the CH3Hg+ levels in biota successfully, and the results are shown in Fig. 4. A sensitivity analysis was performed with ACH3Hg, the slope for the linear relation between log CCH3Hg and δ15N: log10 CCH3Hg=0.33(±0.027)×δ15N − 1.03(±0.15). ACH3Hg values were changed within 1 standard deviation (σ=0.027) from the average value (0.33), and the BCH3Hg, the intercept of the linear relation, were recalculated. When ACH3Hg was changed within 1σ, most of the data except zooplankton and spot were included by the proposed model, and all of the data were included when ACH3Hg was changed with 3σ. In addition, as shown in Table 5, the change of ACH3Hg suggested the range of CCH3Hg in each trophic level organisms with confidence intervals. These results were more realistic to compare with the measured values, which are usually scattered.
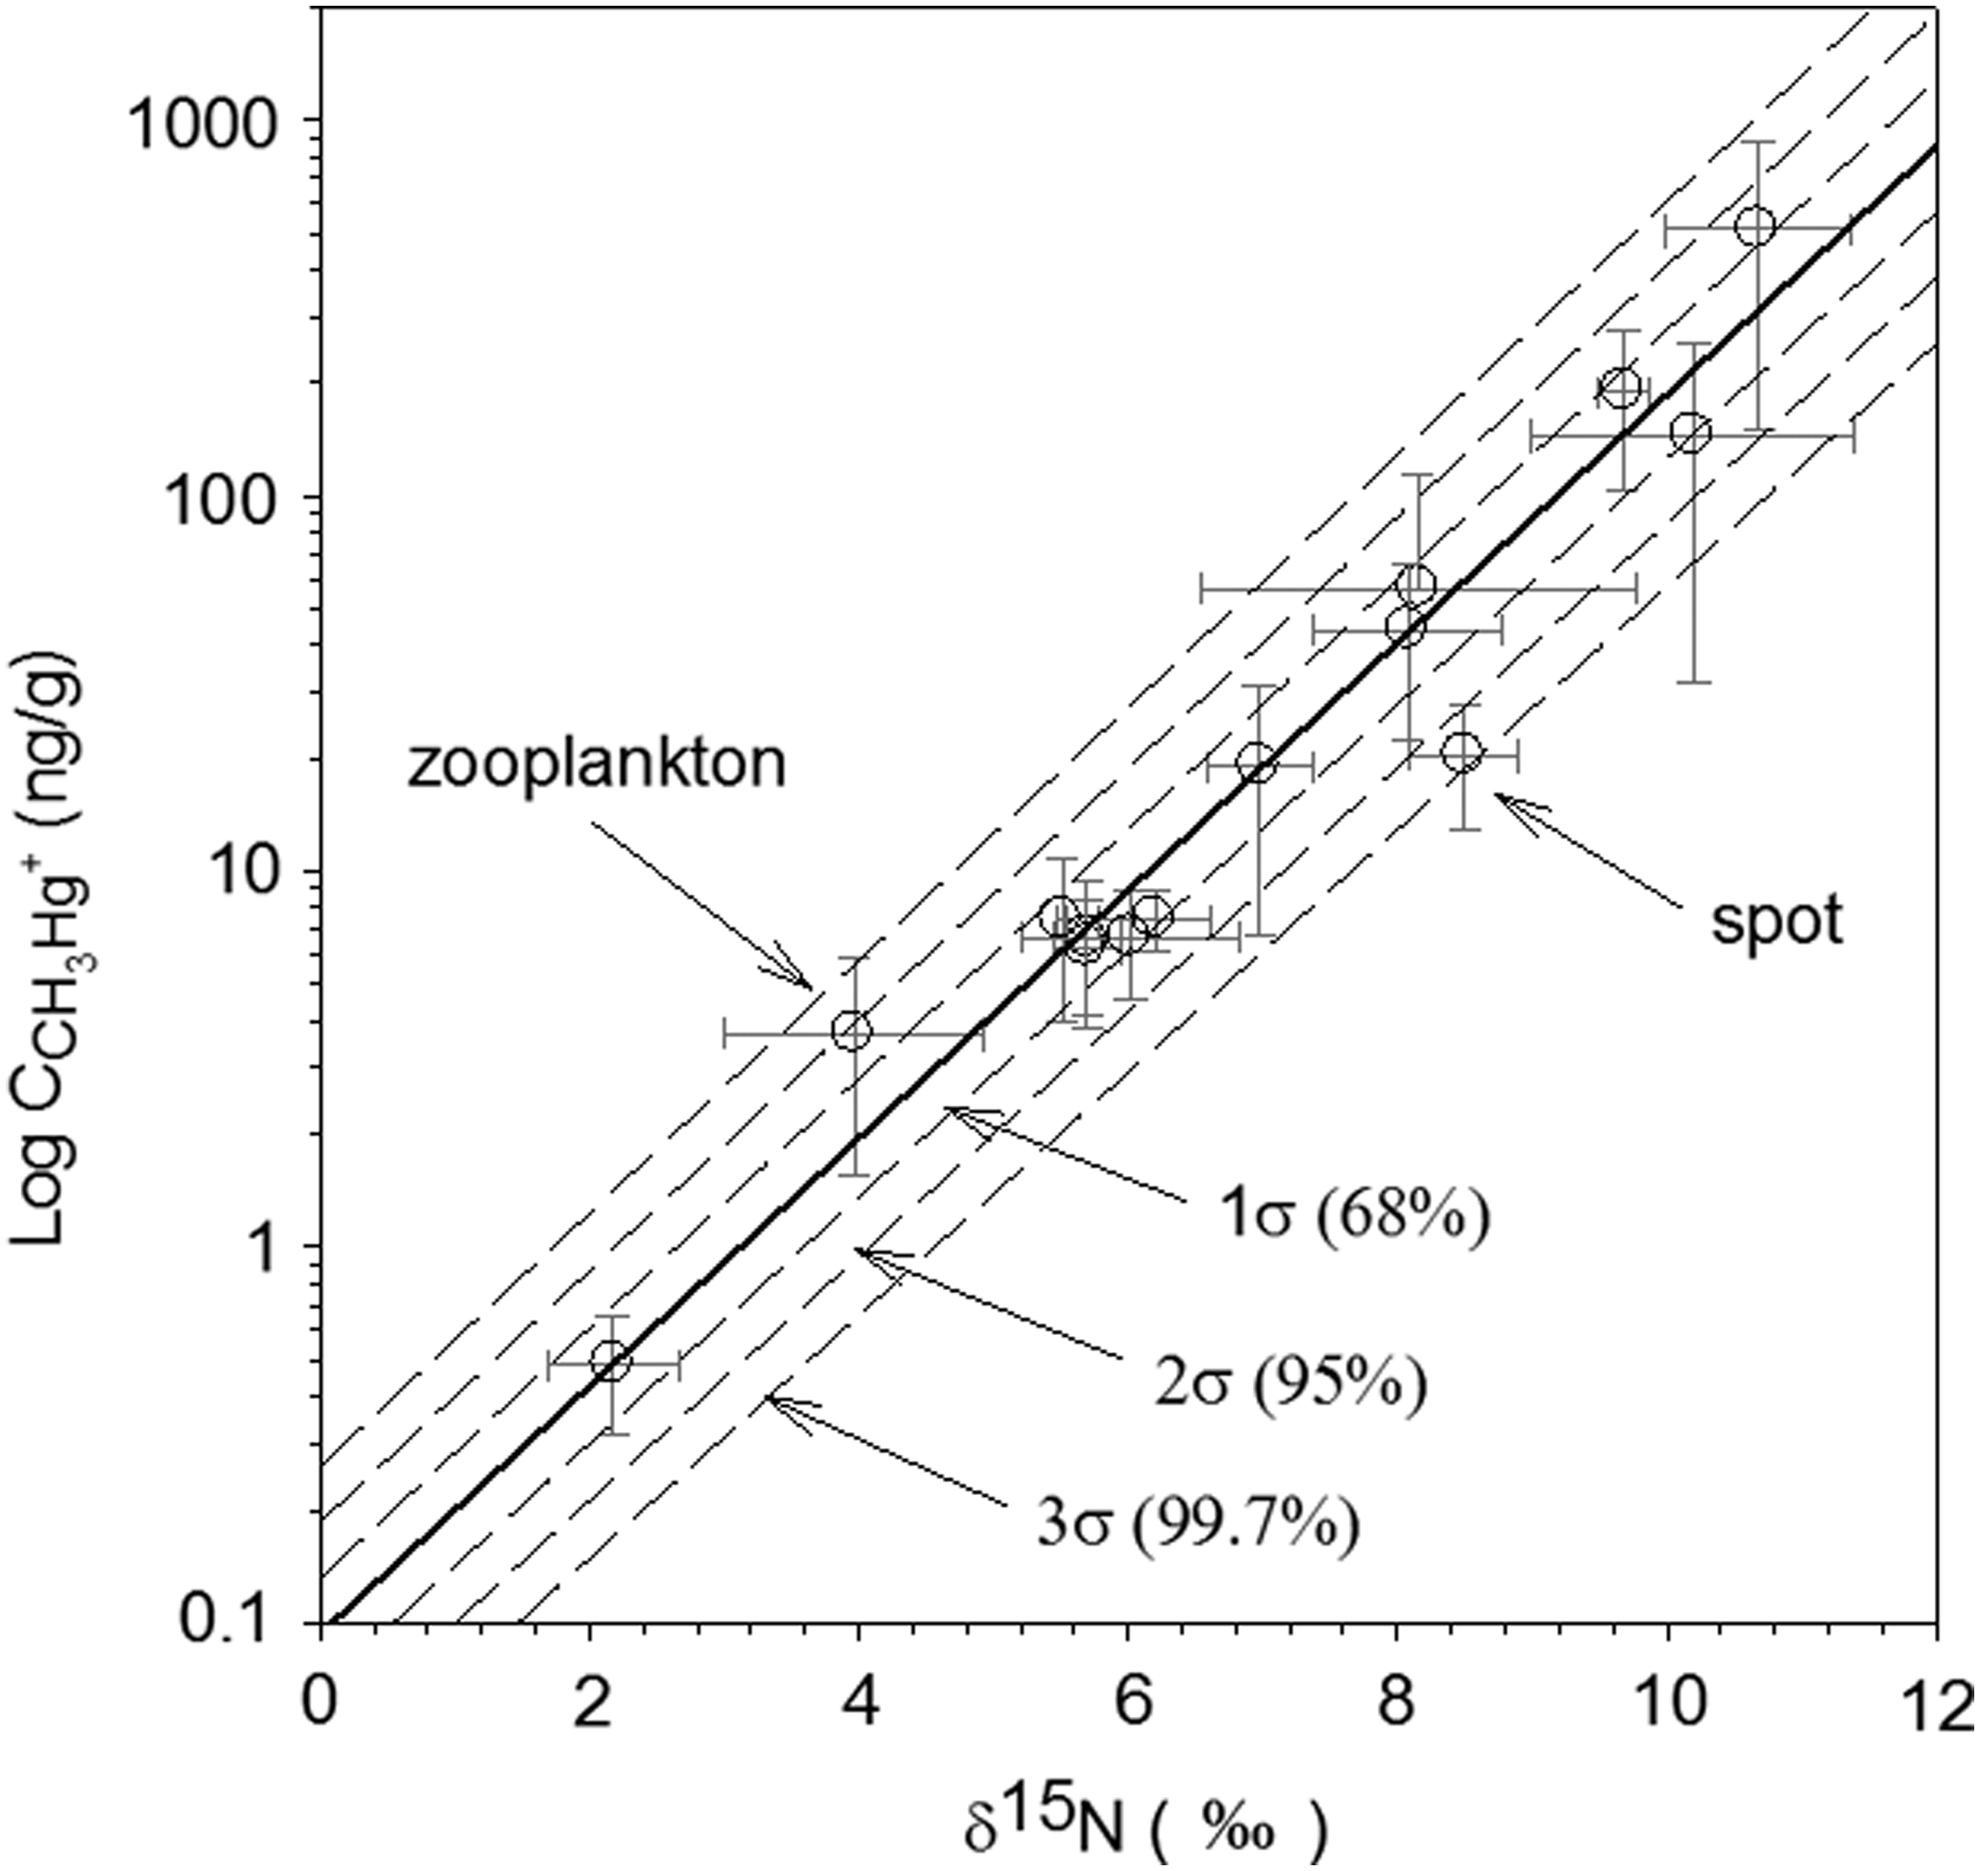
Modeling the CH3Hg+ biomagnification in the Sarasota food web using the linear relation between log CCH3Hg and δ15N. The solid line represents the model derived from the average value of ACH3Hg, and the broken lines represent models derived from the ACH3Hg changed by 1, 2, and 3 standard deviations. Theoretically, the change of ACH3Hg with 1, 2, and 3 standard deviations will include 68%, 95%, and 99.7% of the observations.
TL, trophic level.
Conversion of CH3Hg+ concentrations in water to the CH3Hg+ concentrations in fish tissue is important in assessing the Hg exposure risks in Hg-impaired waterbodies. This is because CH3Hg+ in water is typically used for regulating Hg air emissions and CH3Hg+ in fish is used to characterize Hg human health risks. The traditional approach introduces BCFs for trophic level 2, 3, and 4 organisms to convert CH3Hg+ water concentrations to tissue concentrations. However, this method could introduce significant uncertainties in water and tissue concentrations since BCFs generally have standard deviations that span one order of magnitude or more (Sanborn and Brodberg, 2006).
Rather than using multiple BCFs, we propose to use one BCF for one species in a food chain and one biomagnification rate to describe the CH3Hg+ concentrations in the entire food web using predetermined δ15N, which was described previously in Equations (2)–(4). The approach could be advantageous since δ15N is easy to measure and could provide a quantifiable food chain value. In addition, by changing the slope of the linear relationship between log C and δ15N, Hg concentrations in the entire food web could be obtained with the required accuracy and allowable uncertainties. Hence, the use of a linear relationship between logarithmic Hg concentrations and δ15N could provide a more consistent and convenient way for the conversion of CH3Hg+ water concentrations to fish tissue concentrations. However, to strongly support the argument, more detailed stochastic modeling, that is, Monte Carlo Simulation, will be necessary to better understand how the various input parameters with individual uncertainties (standard deviation) are affecting the uncertainties of output, that is, CH3Hg+ concentrations in fish.
Analyses of Hg loadings to the Sarasota Bay
As was mentioned earlier, the total Hg loading to the Bay can be divided into three categories: (1) direct atmospheric Hg deposition that enters the waterbody directly from the air, (2) indirect atmospheric Hg deposition representing Hg deposition first on the watershed and then transported in runoff to the Bay water, and (3) the Hg inflow by sea water exchange. The individual Hg loadings to the Bay were calculated and are shown in Fig. 5.
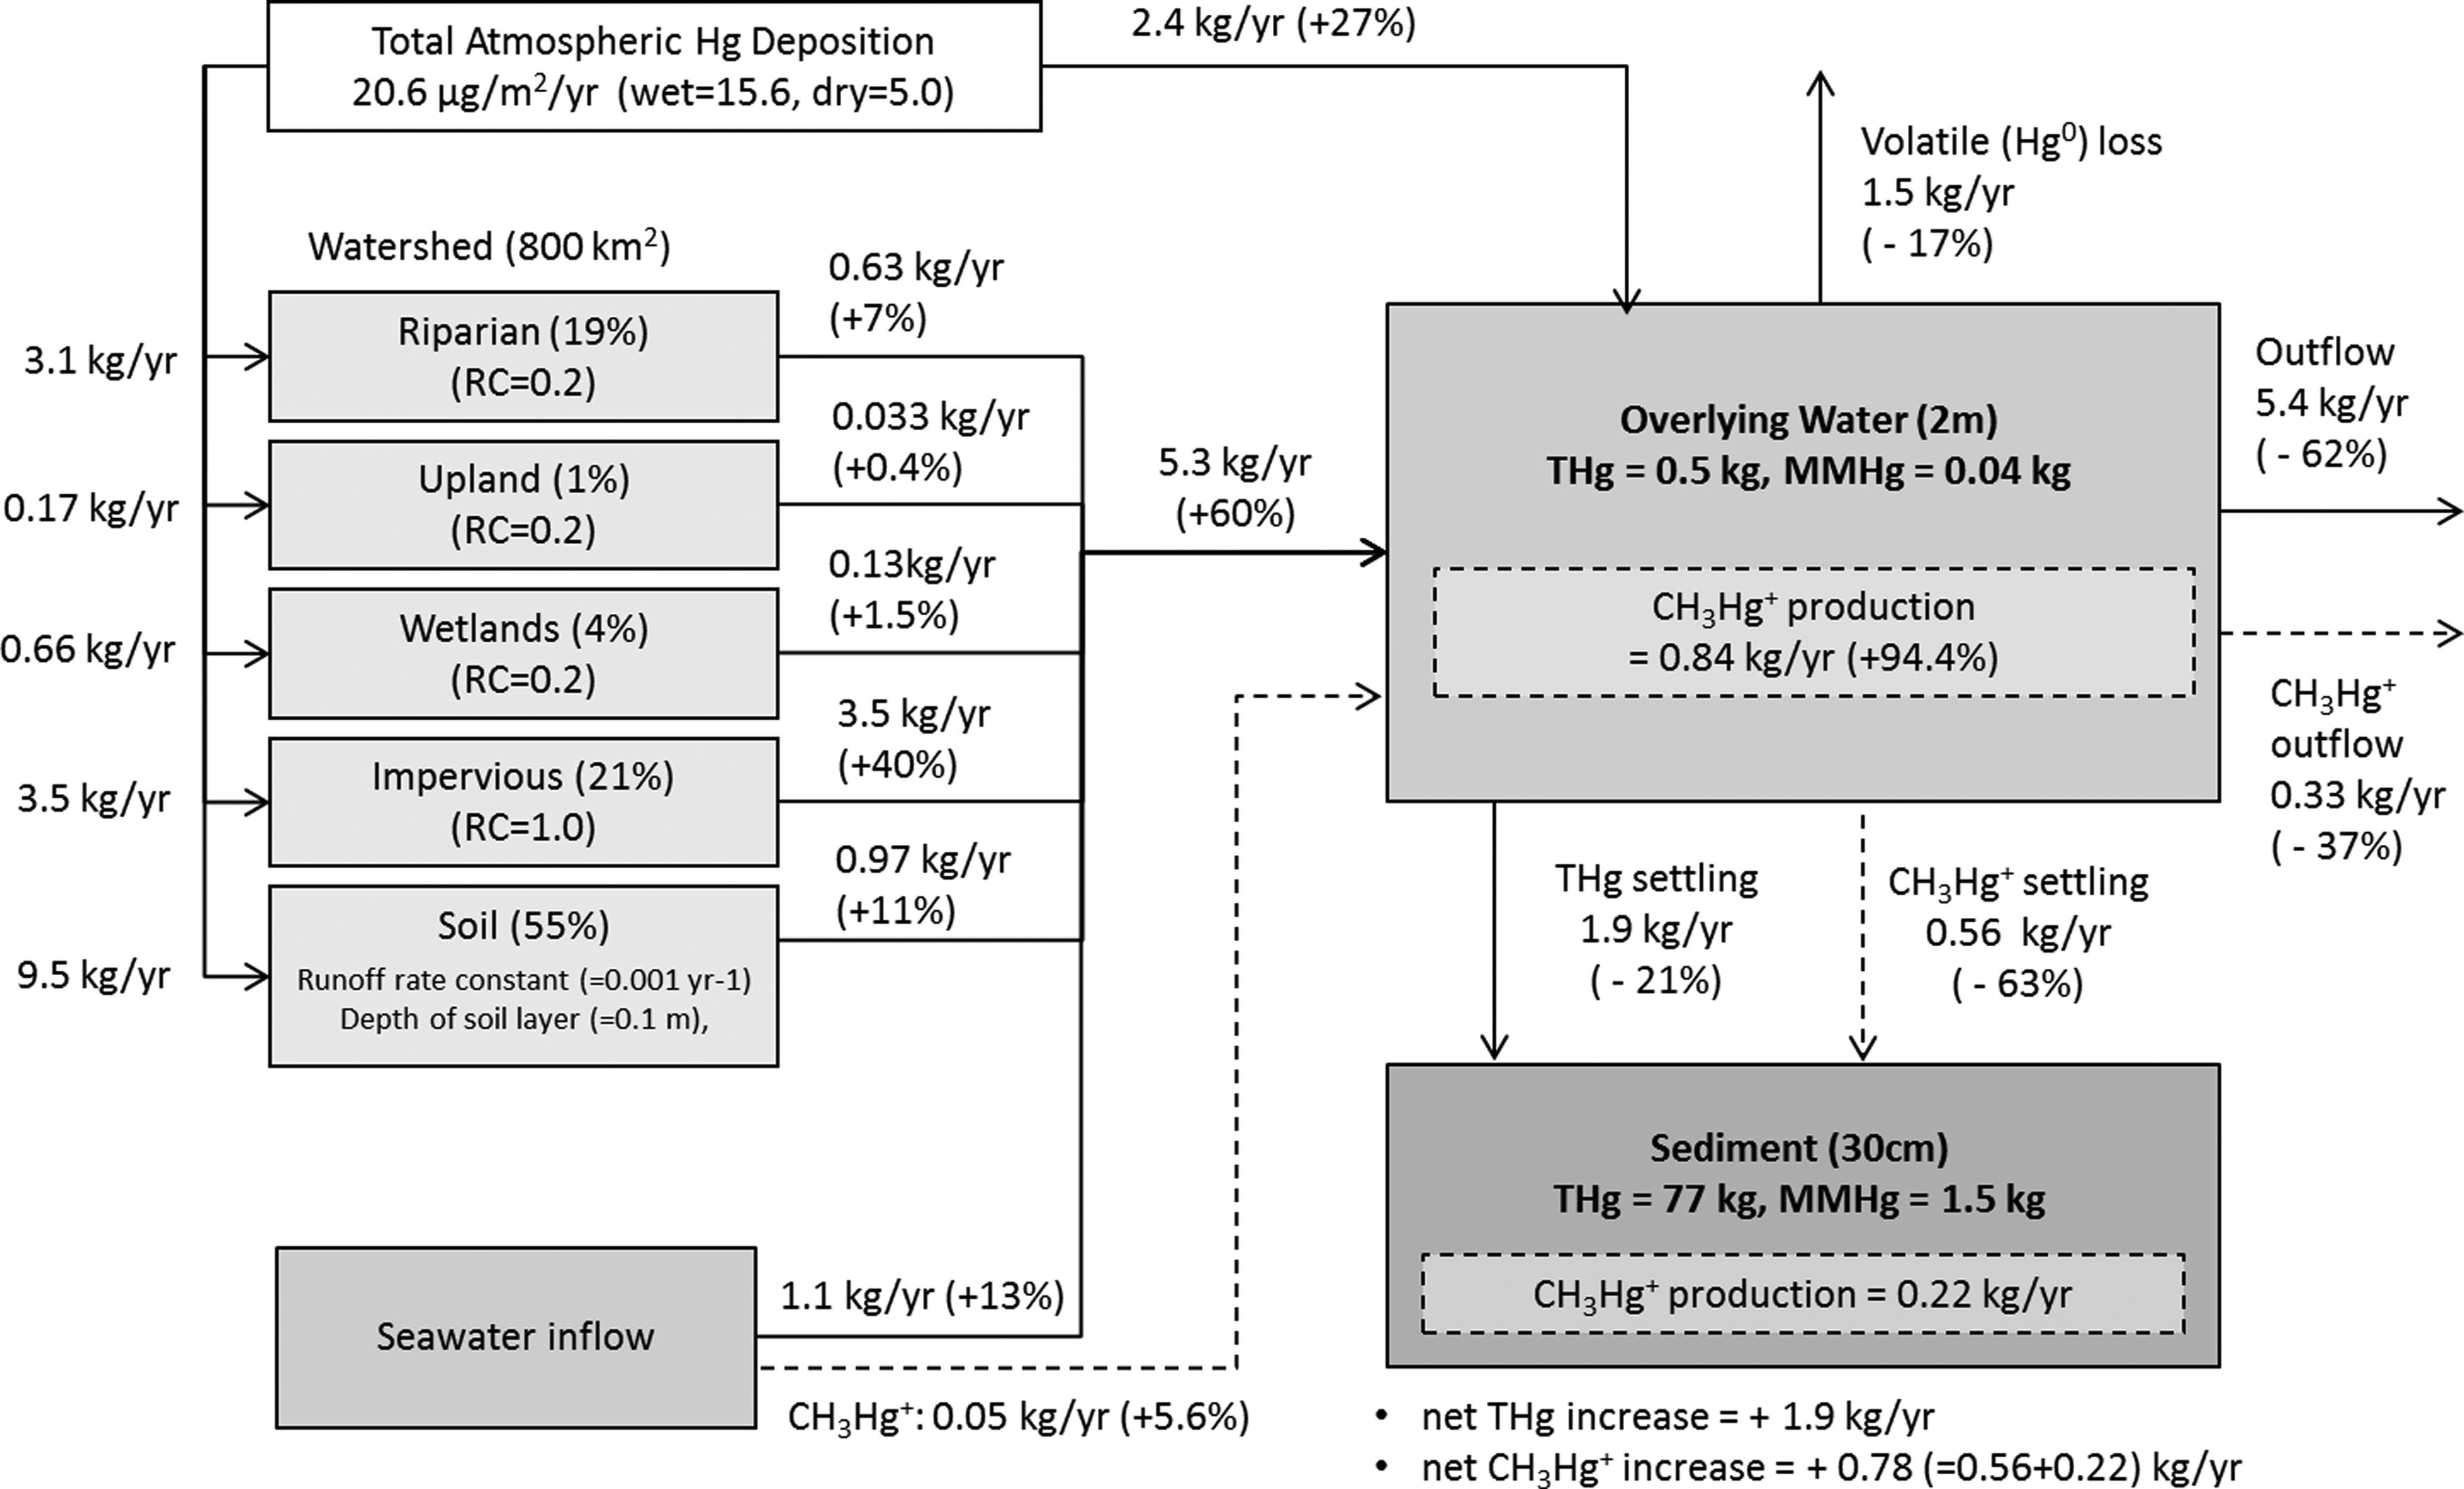
Total mercury (THg) and methylmercury (CH3Hg+) mass flux and mass balance in the Sarasota Bay watershed and waterbody. The THg and CH3Hg+ mass flows are shown with solid and broken lines, respectively.
The calculated THg entering the Sarasota Bay was 8.8 kg/year, and only 27% (2.4 kg/year) and 13% (1.1 kg/year) of the total loading came from direct atmospheric Hg deposition and seawater inflow, respectively. The dominant THg loading to the Bay was the indirect atmospheric Hg loading from watershed runoff occupying 60% (5.3 kg/year) of the total loading. About 30% of the Hg deposited in the watershed was delivered to the Bay and 70% remained in the watershed. The fraction of Hg released to the Sarasota Bay was higher than the 10% observed in other areas that were mainly covered with soil (Mason et al., 1997; Ambrose 2005).
Among the THg loadings from the watershed, the impervious area of THg runoff, which was 40% (3.5 kg/year) of the total Hg loadings to the Bay, was the biggest THg source to the Bay. As shown in Fig. 1, the watershed of the Sarasota Bay is mostly developed with medium- and high-intensity urbanization occupying more than 70% of the watershed land cover. In addition, the atmospheric deposition of Hg in Florida (21.6 μg/m2/year) is relatively high compared to other areas within the United States (Joslin, 1994; NADP, 2010). The significant Hg loading from the watershed stems from the synergistic effect of elevated Hg atmospheric deposition and high urbanization around the Sarasota Bay. Similar results were reported in waterbodies that received Hg from adjacent urbanized areas (Mason and Sullivan 1998; Lawson et al., 2001).
The mercury that entered the Bay mostly departed the Bay by water outflow to the Gulf of Mexico (62%), although 17% (1.5 kg/year) of the THg left the Bay by Hg0 gas evaporation and about 21% (1.9 kg/year) was deposited in sediment. The deposition of total Hg to sediments is 0.04 ng Hg/g sediment/year, and this slow Hg deposition rate further suggests that the Sarasota Bay sediments are not contaminated with high levels of Hg but contain levels closer to background.
The CH3Hg+ mass budget is also calculated and is separately shown in Fig. 5 using broken lines. The CH3Hg+ inflow and out flow is calculated from the seawater exchange, and net CH3Hg+ productions were calculated using equations shown in SERAFM as follows:
where MCH3Hg is the CH3Hg+ mass (g),
The CH3Hg+ production in sediment is calculated as follows:
where
As shown in Fig. 5 with broken lines, 0.05 kg/year of CH3Hg+ was entering the Bay, although 0.33 kg/year was departing the Bay, and this suggested that CH3Hg+ was internally produced in the Bay. The SERAFM results suggested that 0.84 kg/year CH3Hg+ was produced in the overlying water and 0.56 kg/year was deposited in sediment providing that the source of CH3Hg+ in the Bay is the water column and sediment in Sarasota Bay is the sink. Combining the CH3Hg+ deposited in sediment with CH3Hg+ produced in sediment, the net CH3Hg+ increase was 0.78 kg/year. These modeling results indicate that the source of CH3Hg+ in the Bay is the overlying water, and rapid decrease of Hg concentrations in the Sarasota Bay ecosystem could be achieved by lowering the atmospheric Hg deposition to the Bay (Sunderland et al., 2010).
Effect of urbanization and atmospheric Hg deposition on Hg levels in the Sarasota Bay ecosystem
The population of Sarasota increased from 2,150 to 325,957 from 1920 to 2010. This growth has converted agricultural land to urbanized land increasing the spatial extent of impervious surfaces (Kish et al., 2008). In addition to the land cover change, there has been a significant increase in the US Hg emissions during the 20th century (Pirrone et al., 1998). The increase in atmospheric Hg deposition has increased the Hg loading in South Florida (Frederick et al., 2004). The land cover changes and the increase in atmospheric Hg deposition could have impacted the Hg levels in the Sarasota Bay ecosystem individually or synergistically. Understanding the relative importance of the two factors on the Hg levels in the ecosystem will be helpful in developing a strategy to lower the Hg levels in the area and in areas with similar characteristics. Hence, for this modeling exercise, the atmospheric Hg deposition and impervious area were changed from 4 to 40 μg/m2/year and from 1% to 61%, respectively. It was assumed that an increase in impervious area correspondingly decreased the area covered with soil. The areas of wetland, riparian, and upland were fixed since their contribution to Hg loading to the Bay was less than 10%. The total Hg loading to the Bay was calculated and summarized in Fig. 6.
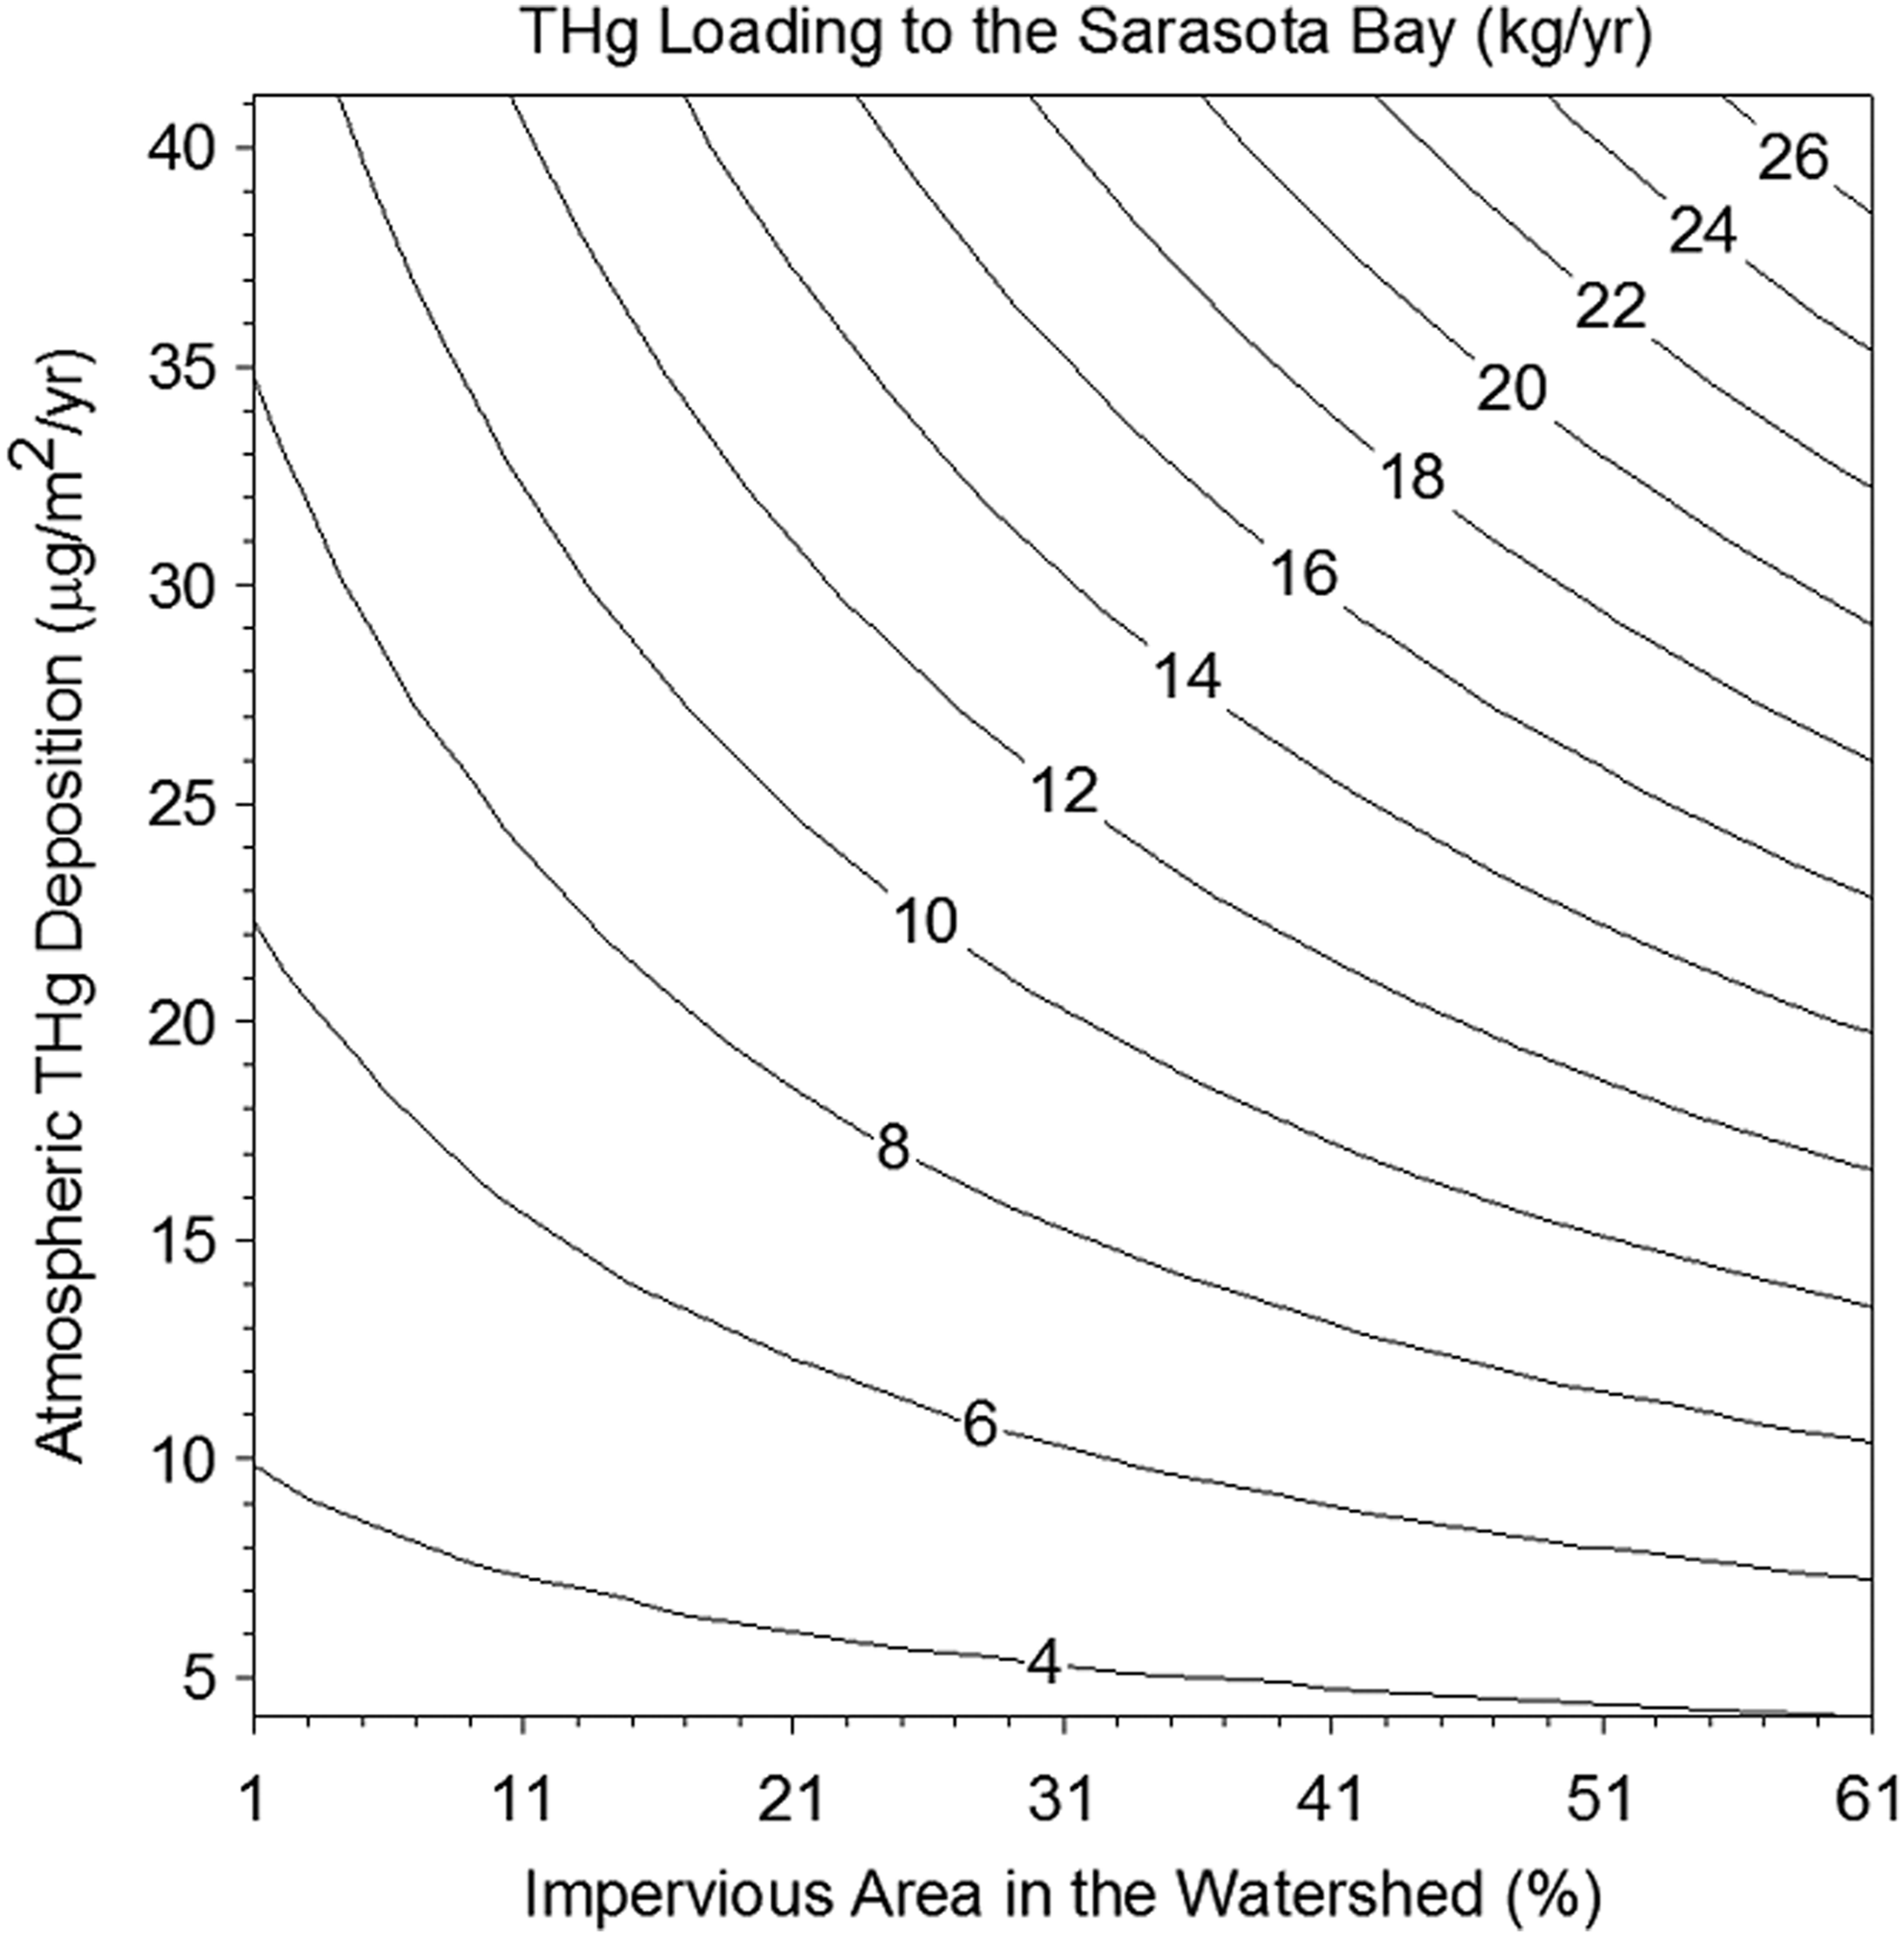
Relationship between the atmospheric THg deposition and watershed impervious area on the THg loading to the Sarasota Bay.
THg loadings to the Bay varied between 4 and 26 kg/year and the increase of impervious area and atmospheric Hg deposition increased the total Hg loading to the Bay. Hence, lower atmospheric Hg deposition and less impervious area will result in a decrease of THg loading to the Bay. However, when the atmospheric THg deposition was low, the change of impervious area did not affect the total Hg loading to the Bay. For example, when THg atmospheric deposition was 10 μg/m2/year, the total Hg loading only varied between 4 and 6 kg/year regardless of the impervious area coverage. This was because background Hg sources such as soil erosion and runoff from the watershed and Hg input of the Gulf of Mexico sea water inflow became more important than Hg atmospheric deposition.
Model predictions suggest that increasing the THg loading to the Bay increased CH3Hg+ levels in the water column and subsequently increased CH3Hg+ levels in the biota (Fig. 7a). The slope of the relationship between CCH3Hg+ and THg loading to the Bay becomes larger when the trophic level (TL) is increased. For example, if THg loading to the Bay is increased from 10 to 15 kg/year, then the TL4 fish CH3Hg+ concentrations would be increased by 100 ng/g (200→300 ng/g), although TL3 fish CH3Hg+ concentrations would be increased only by 50 ng/g (50→100 ng/g). This observation suggests that small changes in CH3Hg+ concentrations in the water column with lower trophic level organisms could lead to significant changes in CH3Hg+ concentrations in higher trophic level organisms.
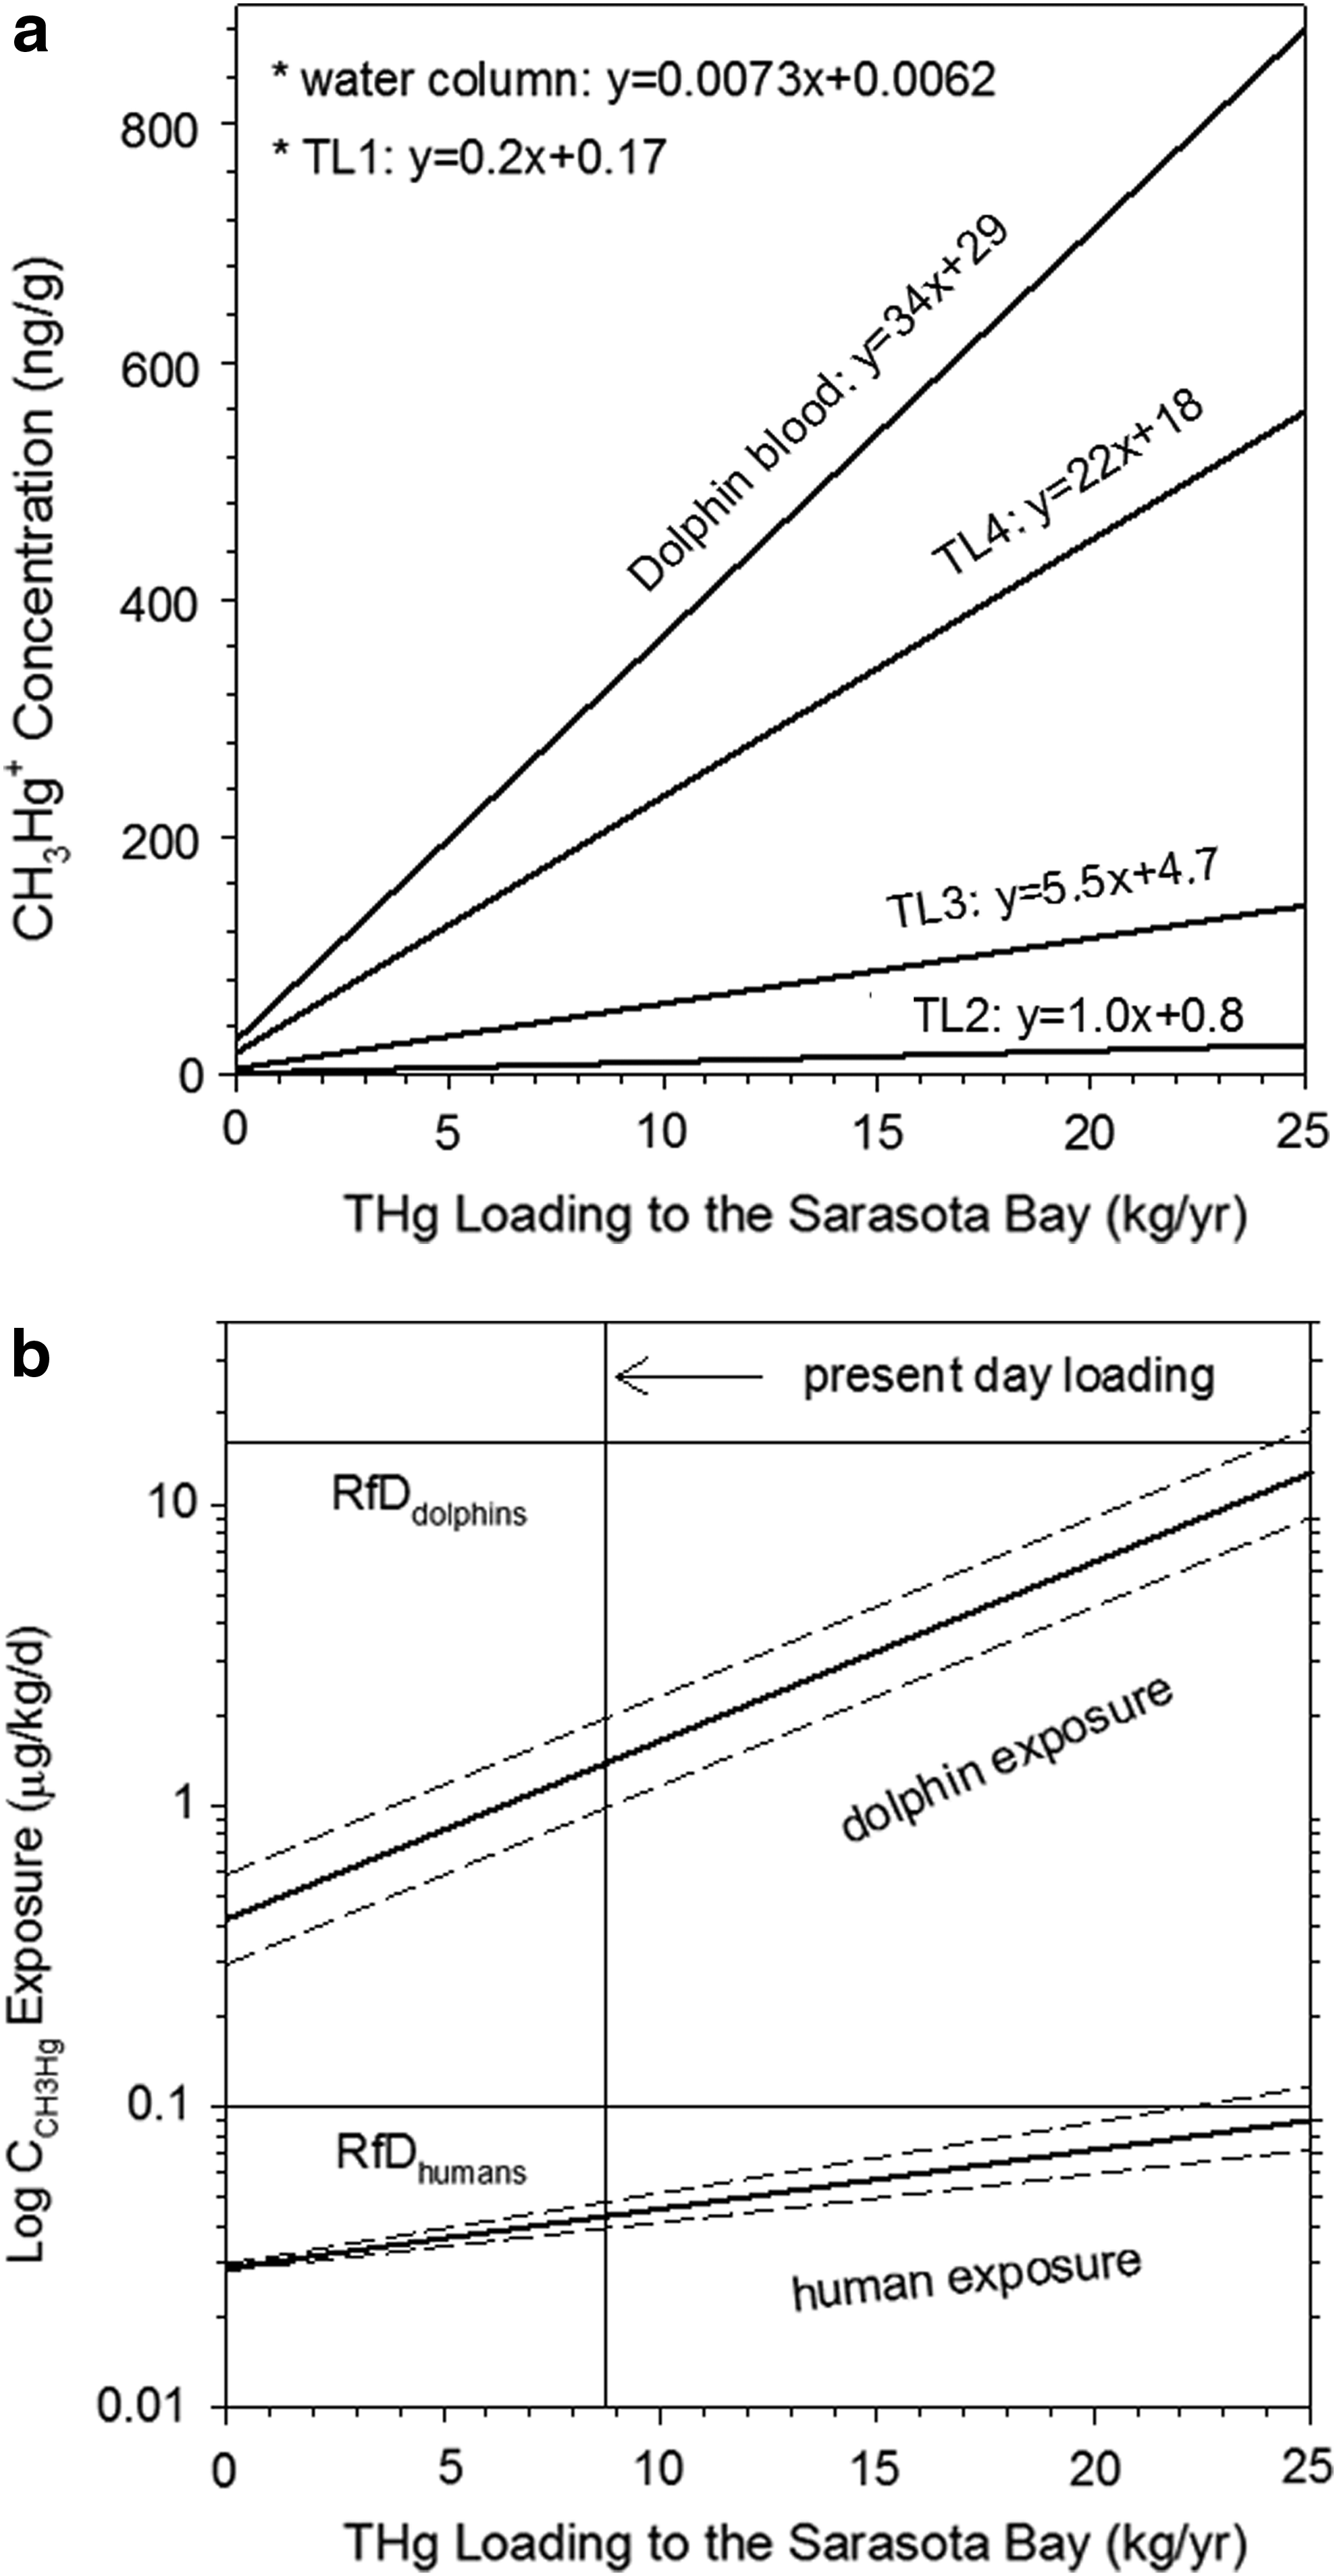
It is likely that the increase in THg loading to the Sarasota Bay from the urbanization of the watershed has increased the Hg levels in the resident bottlenose dolphins, the top predators. The average (±standard deviation) CH3Hg+ level in the blood (sample size=51) of Sarasota resident bottlenose dolphins was 512 (±363) ng/g (Bryan et al., 2007; Woshner et al., 2008), which was higher than the 147 (±88) ng/g observed in the blood (sample size=74) of bottlenose dolphins in Charleston, SC (Stavros et al., 2008). Human studies have shown that blood mercury concentrations above 200 ng/g can cause adverse health effects (WHO/IPCS, 1990), and the human cord-blood benchmark Hg level at which adverse neurodevelopmental effects may occur is 58 ng/g (NRC, 2000). To decrease the Hg in the blood levels of the Sarasota bottlenose dolphins to, for example, the values found in Charleston, SC (∼150 ng/g), the model indicates that the current THg loading to the Bay (8.7 kg/year) needs to be lowered to 4.0 kg/year, a reduction of 54%. Such a large reduction may be achieved by decreasing atmospheric Hg deposition by 66% (20.6→7.0 μg/m2/year) without a change in the fraction of impervious area. It is questionable whether such a reduction can be achieved simply by lowering the Hg atmospheric emission from coal- and oil-fired power plants in the United States because a study suggested that the US anthropogenic Hg sources only account for 11% of the atmospheric THg deposited in the US Southeast (Selin et al., 2010). In the study, Hg sources were divided by three categories: natural Hg sources (e.g., volcano, forest fires), anthropogenic sources (e.g., coal-fired power plants, gold mining) within and outside the United States, and historical anthropogenic sources that had released Hg currently being transported and deposited in the atmosphere and aquatic environments. A model used in the study estimated that only 11% of the Hg deposited in Florida (US Southeast region) originated from the US anthropogenic sources and ∼23% of the Hg deposited in Florida was transported from anthropogenic sources in other countries. The remaining Hg deposited was attributed to natural sources (42%) and historical anthropogenic sources (24%) that are not controllable. Therefore, the maximum reduction of atmospheric THg deposition could be 58% (11%+23%+24%) if international collaboration is successful in reducing Hg releases to atmosphere.
The combination of decreasing Hg in the runoff from impervious areas together with a decrease in Hg emissions from coal-fired power plants may be more effective and practical in reducing the Hg loadings to the Bay and Hg concentrations in the environment and biota. If the implementation of vacuum street sweeping, stormwater vaults with media filters, and sediment traps reduces the Hg in the runoff from impervious surfaces by 90%, then the model shows that a reduction of atmospheric THg deposition by 52% (21→10 μg/m2/year) will be required to reduce the Hg in dolphin's blood levels in the Sarasota resident bottlenose dolphins to the value observed at Charleston, SC. The 90% reduction of Hg in the runoff is simulated in the model by decreasing the Hg runoff coefficient from 1 to 0.1; that is also equivalent to a decrease in impervious area from 21% to 2%.
The CH3Hg+ exposure risks to humans and resident bottlenose dolphins were also evaluated (Fig. 7b). At the present day THg loading (8.7 kg/year), the estimated CH3Hg+ exposures of humans and resident bottlenose dolphins in Sarasota were 0.05 and 4.7 μg/kg/day, respectively. These values are smaller than the published reference doses for humans and resident bottlenose dolphins of 0.1 and 16 μg/kg/day, respectively (USEPA, 1993, 2010b). The reference dose for dolphins may not accurately characterize the Hg exposure risks since the value has not been updated since early 1980. As mentioned before, the Hg levels in the blood of resident bottlenose dolphins were significantly higher than those found in Charleston, SC. Considering the trend of increased urbanization in the Sarasota Bay watershed, it is likely that increased amounts of impervious area will also increase the Hg loadings to the Sarasota Bay. Appropriate implementation plans for the management of impervious areas are recommended to reduce the largest Hg sources to the Bay.
Sensitivity analysis
The behavior of Hg is complex in aquatic systems and food chains. Understanding the key processes that significantly affect Hg behavior can be important for collecting key data and improving model reliability. An extensive sensitivity analysis on mercury reactions, including methylation, demethylation, oxidation, and reduction, was conducted for SERAFM in a previous study (Knightes, 2008). In the present study, the sensitivity of atmospheric THg deposition and the impervious Hg runoff coefficient, as well as, parameters related to Hg bioconcentration and biomagnification to the Hg levels in the blood of resident bottlenose dolphins were analyzed to identify the relative importance of processes that would be critical in evaluating the Hg risks to humans and ecological top predators. The sensitivity of parameters in this study is defined as the ratio of “change of input” and “change of output” as follows (Travis and Rosenberg, 1997):
where Xbase is the baseline input value, X is the changed input value, (CCH3Hg+,DB)base is the baseline CH3Hg+ concentration in the blood of resident bottlenose dolphins, and CCH3Hg+,DB is the changed CH3Hg+ concentration in the blood of resident bottlenose dolphins. Most of the X is decreased by 1 standard deviation of the reported values (Hong et al., 2013), and atmospheric THg deposition and Hg runoff coefficient from impervious surfaces were decreased by 50%. During the simulation, only one input parameter was changed while all other parameters were held constant. Parameters are listed in Table 6 from the most sensitive to the least sensitive. A positive value implies that an increase of input value (X) will increase the CH3Hg+ concentration in dolphin blood (CCH3Hg+,DB), and a negative value means an increase of input value (X) will decrease the CCH3Hg+,DB.
BCF, bioconcentration factor.
The most sensitive parameter influencing CCH3Hg,DB is δ15Ndolphin (‰), which suggests that the accurate measurement of the trophic position of bottlenose dolphins is critical in estimating CCH3Hg,DB. Other important factors to estimate CCH3Hg, DB are ACH3Hg (CH3Hg+ biomagnification rate) and BCH3Hg (baseline CH3Hg+ value for the food chain base). A previous study has shown that the ACH3Hg can vary between 0.15 and 0.30 depending on the environment (Hong et al., 2013), and an accurate assessment of this value is recommended. The BCH3Hg can be estimated during the evaluation of ACH3Hg, or it can be calculated from the Equation (3). Considering the high sensitivity of the value, it is desirable to evaluate the BCH3Hg with both methods. The remaining parameters, such as CH3Hg+ water column concentrations, THg atmospheric deposition, and Hg runoff coefficient from impervious areas, also affected CCH3Hg,DB. The CCH3Hg,DB value is relatively insensitive to the δ15N of trophic level 1, 2, and 3 fish. Considering the sensitivity of the parameters, it will be the most important to accurately characterize δ15Ndolphin, ACH3Hg, and BCH3Hg in estimating CCH3Hg,DB.
Conclusions and Future Work
The fate, transport, and bioaccumulation of mercury (Hg) in aquatic ecosystems involve complex biological and chemical processes that are replete with uncertainty. This uncertainty is of particular concern when characterizing methylmercury (CH3Hg+) risks in waterbodies since the conversion of CH3Hg+ concentrations in water to CH3Hg+ concentrations in fish tissue is critically important in assessing Hg health risks to humans and biota in aquatic ecosystems. In the present study, efforts were taken to minimize the uncertainty by modeling mercury (Hg) fate in the Sarasota Bay ecosystem. Hg transformation and transport were investigated using the SERAFM model.
To describe the CH3Hg+ concentrations in the entire food web, one BCF in lower trophic level organisms and one biomagnification rate were used with predetermined δ15N. The modeling approach successfully reproduced the literature reported Hg distributions in the Sarasota Bay ecosystem. We believe that our approach could provide governmental regulatory and advisory agencies a more consistent and convenient way to convert CH3Hg+ water concentrations to fish tissue concentrations.
The model showed that the indirect Hg atmospheric deposition (Hg runoff from impervious areas in the watershed) was more important than the direct Hg atmospheric deposition to the Sarasota Bay due to the highly urbanized watershed. To lower CH3Hg+ concentrations in the blood of resident bottlenose dolphins (an animal exposed to relatively high risks of Hg uptake) to the reference value observed in the bottlenose dolphins of Charleston, SC, the THg loading to the Bay needs to be reduced. The model also showed that reduction could be achieved by lowering the THg atmospheric deposition by 50% and by lowering THg runoff from the watershed by 90%. A sensitivity analysis showed that the trophic position of dolphins (δ15Ndolphin), Hg biomagnification rate (ACH3Hg), and CH3Hg+ levels in the food chain base (BCH3Hg) were important in estimating Hg levels in the blood of resident bottlenose dolphins. Although current exposure risks of humans and resident bottlenose dolphins in the Sarasota Bay via fish consumption are low, actions to lower Hg levels in the Sarasota Bay are recommended due to the expected future increases in Hg loadings from atmospheric deposition and watershed runoff and associated risks to the Bay.
Although our modeling approach was successful, several improvements can be made by more rigorous sampling logistics and the approach to modeling. The Hg loadings to the Bay from nonpoint sources could have been better estimated if we had collected event-based and continuous observations of Hg loading in tributaries. A transient model, such as USEPA Region 4 Watershed Characterization System Mercury Loading Model (WCM-MLM), which can calculate time-dependent watershed loading of mercury, likely will be required to model Hg transport in the watershed. Incorporation of new findings in Hg biogeochemical reactions to SERAFM could better predict Hg fate and transport in an aquatic environment. Finally, more research is necessary to accurately calculate the dietary enrichment of δ15N for bottlenose dolphins, which will be helpful in calculating the Hg uptake more precisely by Equation (5) and in assessing the Hg exposure risks for these marine mammals.
Footnotes
Acknowledgments
The authors are grateful for financial support from the National Aquarium in Baltimore and from the Center for Contaminant Transport, Fate, and Remediation at the Johns Hopkins University.
Author Disclosure Statement
No competing financial interests exist.