
Abstract
Abstract
To quantify characteristics of bioaerosols in university indoor environments, concentration and size distribution of airborne culturable bacteria and fungi were examined in four types of buildings of Chang'an University in Xi'an, China, from March, 2012 to February, 2013. Indoor temperature and relative humidity (RH) were also measured to determine correlations between bioaerosols and environmental parameters. Results showed that concentration and size distribution of airborne bacteria and fungi varied in various indoor environments due to the appearance of different indoor sources and human occupancy. The highest mean concentrations of airborne bacteria and fungi were found in the canteen (1,025±91 and 699±57 CFU/m3), followed by the clinic and dormitories, and the lowest in classrooms (479±66 and 345±15 CFU/m3). Airborne bacteria and fungi here showed higher concentrations than those of western universities. Similar seasonal variations of airborne fungal concentrations were observed for all indoor environments, with higher levels in fall and winter and lower in spring and summer. Indoor temperature showed more significant correlation with bioaerosols than RH in all indoor environments. Another important finding was that more than 75% bacterial and fungal aerosols were in respirable size range in each indoor environment.
Introduction
W
Numerous studies have been conducted to assess personal exposure to airborne bacteria and fungi in various indoor environments: apartments and houses (Jones and Harrison, 2004; Lee and Jo, 2006; Lee et al., 2006; LeBouf et al., 2008; Nasir and Colbeck, 2010, 2012; Frankel et al., 2012), public buildings (Pastuszka et al., 2000; Kim and Kim, 2007; Dutil et al., 2009; Zuraimi et al., 2009; Karbowska-Berent et al., 2011; Lal et al., 2013; Li et al., 2013), public transport vehicles (Lee and Jo, 2005; Wang et al., 2010b), agricultural setting (Rosas et al., 2001; Kim et al., 2009; Martin et al., 2010), and food processing settings (Zorman and Jersek, 2008; Rajasekar and Balasubramanian, 2011). These investigations have indicated that there are wide variations in the concentration and size distribution of bioaerosols in different microenvironments, depending on such biotic and abiotic factors as the type of microorganism species, relative humidity (RH) and temperature, outdoor concentrations, air exchange rates, and human activities.
Most of the above studies on bioaerosols in public buildings have been carried out in offices, hospitals, libraries, and schools. Relatively limited studies have been conducted in university indoor environments, especially in Chinese universities. Moreover, the existing studies on university indoor environments mainly focused on a single type of university building such as classrooms (Grisoli et al., 2012; Qian et al., 2012), research laboratories (Giulio et al., 2010), and archives (Karbowska-Berent et al., 2011; Nunes et al., 2013), there is very little information on bioaerosol concentrations in different types of university indoor environments, how they compare across these environments, and their dominant sources (Stryjakowska-Sekulska et al., 2007; Chan et al., 2008; Lal et al., 2013).
It is well known that the campus setting of Chinese universities is generally different from that of western universities. For example, Chinese universities have many public canteens, student dormitories, and public clinics in which there are no ventilation and air-conditioning (HVAC) systems. In addition, Chinese universities have a higher population density than western universities regardless of whether it is academic year or vacation. Generally, room conditions and human occupancy have been reported to considerably contribute to the varying concentrations of bioaerosols (Kim and Kim, 2007; Nasir and Colbeck, 2010; Chatzidiakou et al., 2012; Frankel et al., 2012; Qian et al., 2012). Therefore, the potential to come into contact with bioaerosols and then be infected in Chinese universities might be higher than western universities.
To effectively control the adverse health effects in indoor environments, the Ministry of Health (MOH), Ministry of Environmental Protection (MEP), and General Administration of Quality Supervision, Inspection and Quarantine (AQSIQ) of China announced an Indoor Air Quality Standard (2002). According to the standard, Chinese residential buildings and office buildings are regulated in regard of threshold limit value of 2,500 CFU/m3 for total airborne microorganism. The American Industrial Hygiene Association (AIHA) published a proposition of guidelines for the amount of fungal spores in different indoor environments (e.g., residential and commercial buildings) in 2001. Guidelines for residential buildings are less than 500 CFU/m3 and for commercial buildings are less than 250 CFU/m3 (Wonder Makers Environmental, Inc., 2001). Other countries' requirements are similar (Stryjakowska-Sekulska et al., 2007). Therefore, knowledge of the concentration of bioaerosols in various indoor environments including university indoor environments is significantly critical to evaluate whether the current Chinese standard is pertinent.
In addition, the effects of indoor bioaerosols on occupational and environmental health depend not only on their concentrations and species, but also on their size distributions. Bioaerosols with different aerodynamic diameters are recognized to be deposited in different positions of the respiratory system. According to Chatigny et al. (1989), particles with the diameter less than 4.7 μm, the so-called respirable particles, can penetrate into the human alveoli and lead to allergic alveolitis and other serious illnesses. In contrast to intensive studies on size distribution of bioaerosols in other indoor environments, very few studies on size distribution of airborne bacteria and fungi in the university indoor environments have been reported in the literature (Qian et al., 2012). To understand the human exposure to airborne microorganisms, information on the size distribution of bioaerosols is also indispensable in various indoor environments.
The present study aims to find out the typical concentration levels and size distributions of culturable bacterial and fungal aerosols in four types of typical university indoor environments in Xi'an, China. The seasonal distribution of bioaerosols is also discussed. The indoor temperature and RH were measured to determine correlation degree between bioaerosols and environmental parameters.
Materials and Methods
Sampling sites
Field sampling of indoor bioaerosols was carried out in a university campus, located at the southern part of Xi'an city (N 34°26′ and E 108°94′), China. As the largest city in northwestern China, Xi'an occupies an area of about 9,983 km2, with a population of 8.468 million and a total number of vehicles more than 1.60 million. As a typical semi-arid inland city, Xi'an is located in the middle of the Yellow River valley and in the center of the Guanzhong Plain, surrounded by the Loess Plateau and Qinling Mountain. Moreover, Xi'an has four distinct seasons with long summer and winter and short spring and autumn. Summer is usually from May to the end of August, and then autumn starts until the end of October. November, December, January, and February are usually the winter season, and March and April are the spring season.
This university campus is ∼5 km away from the city center, surrounded by residential dwellings, public buildings, and several asphalt roads, as shown in Fig. 1. There are also no industries surrounding this campus and there is little vehicle traffic in the campus. In the university campus, four different types of indoor environments were chosen as following: a canteen, a clinic, two dormitories, and two classrooms (also shown in Fig. 1). The details of these indoor environments are presented in Table 1. All indoor rooms are within 100 m of each other and thus, ambient conditions are expected to be similar. To reduce the influence of human occupancy as much as possible, the population density of each selected site was ensured to be relatively stable during the sampling period. Moreover, the Cultural Square surrounded by the above rooms was selected as an outdoor sampling site during this research period to determine the average ambient conditions.
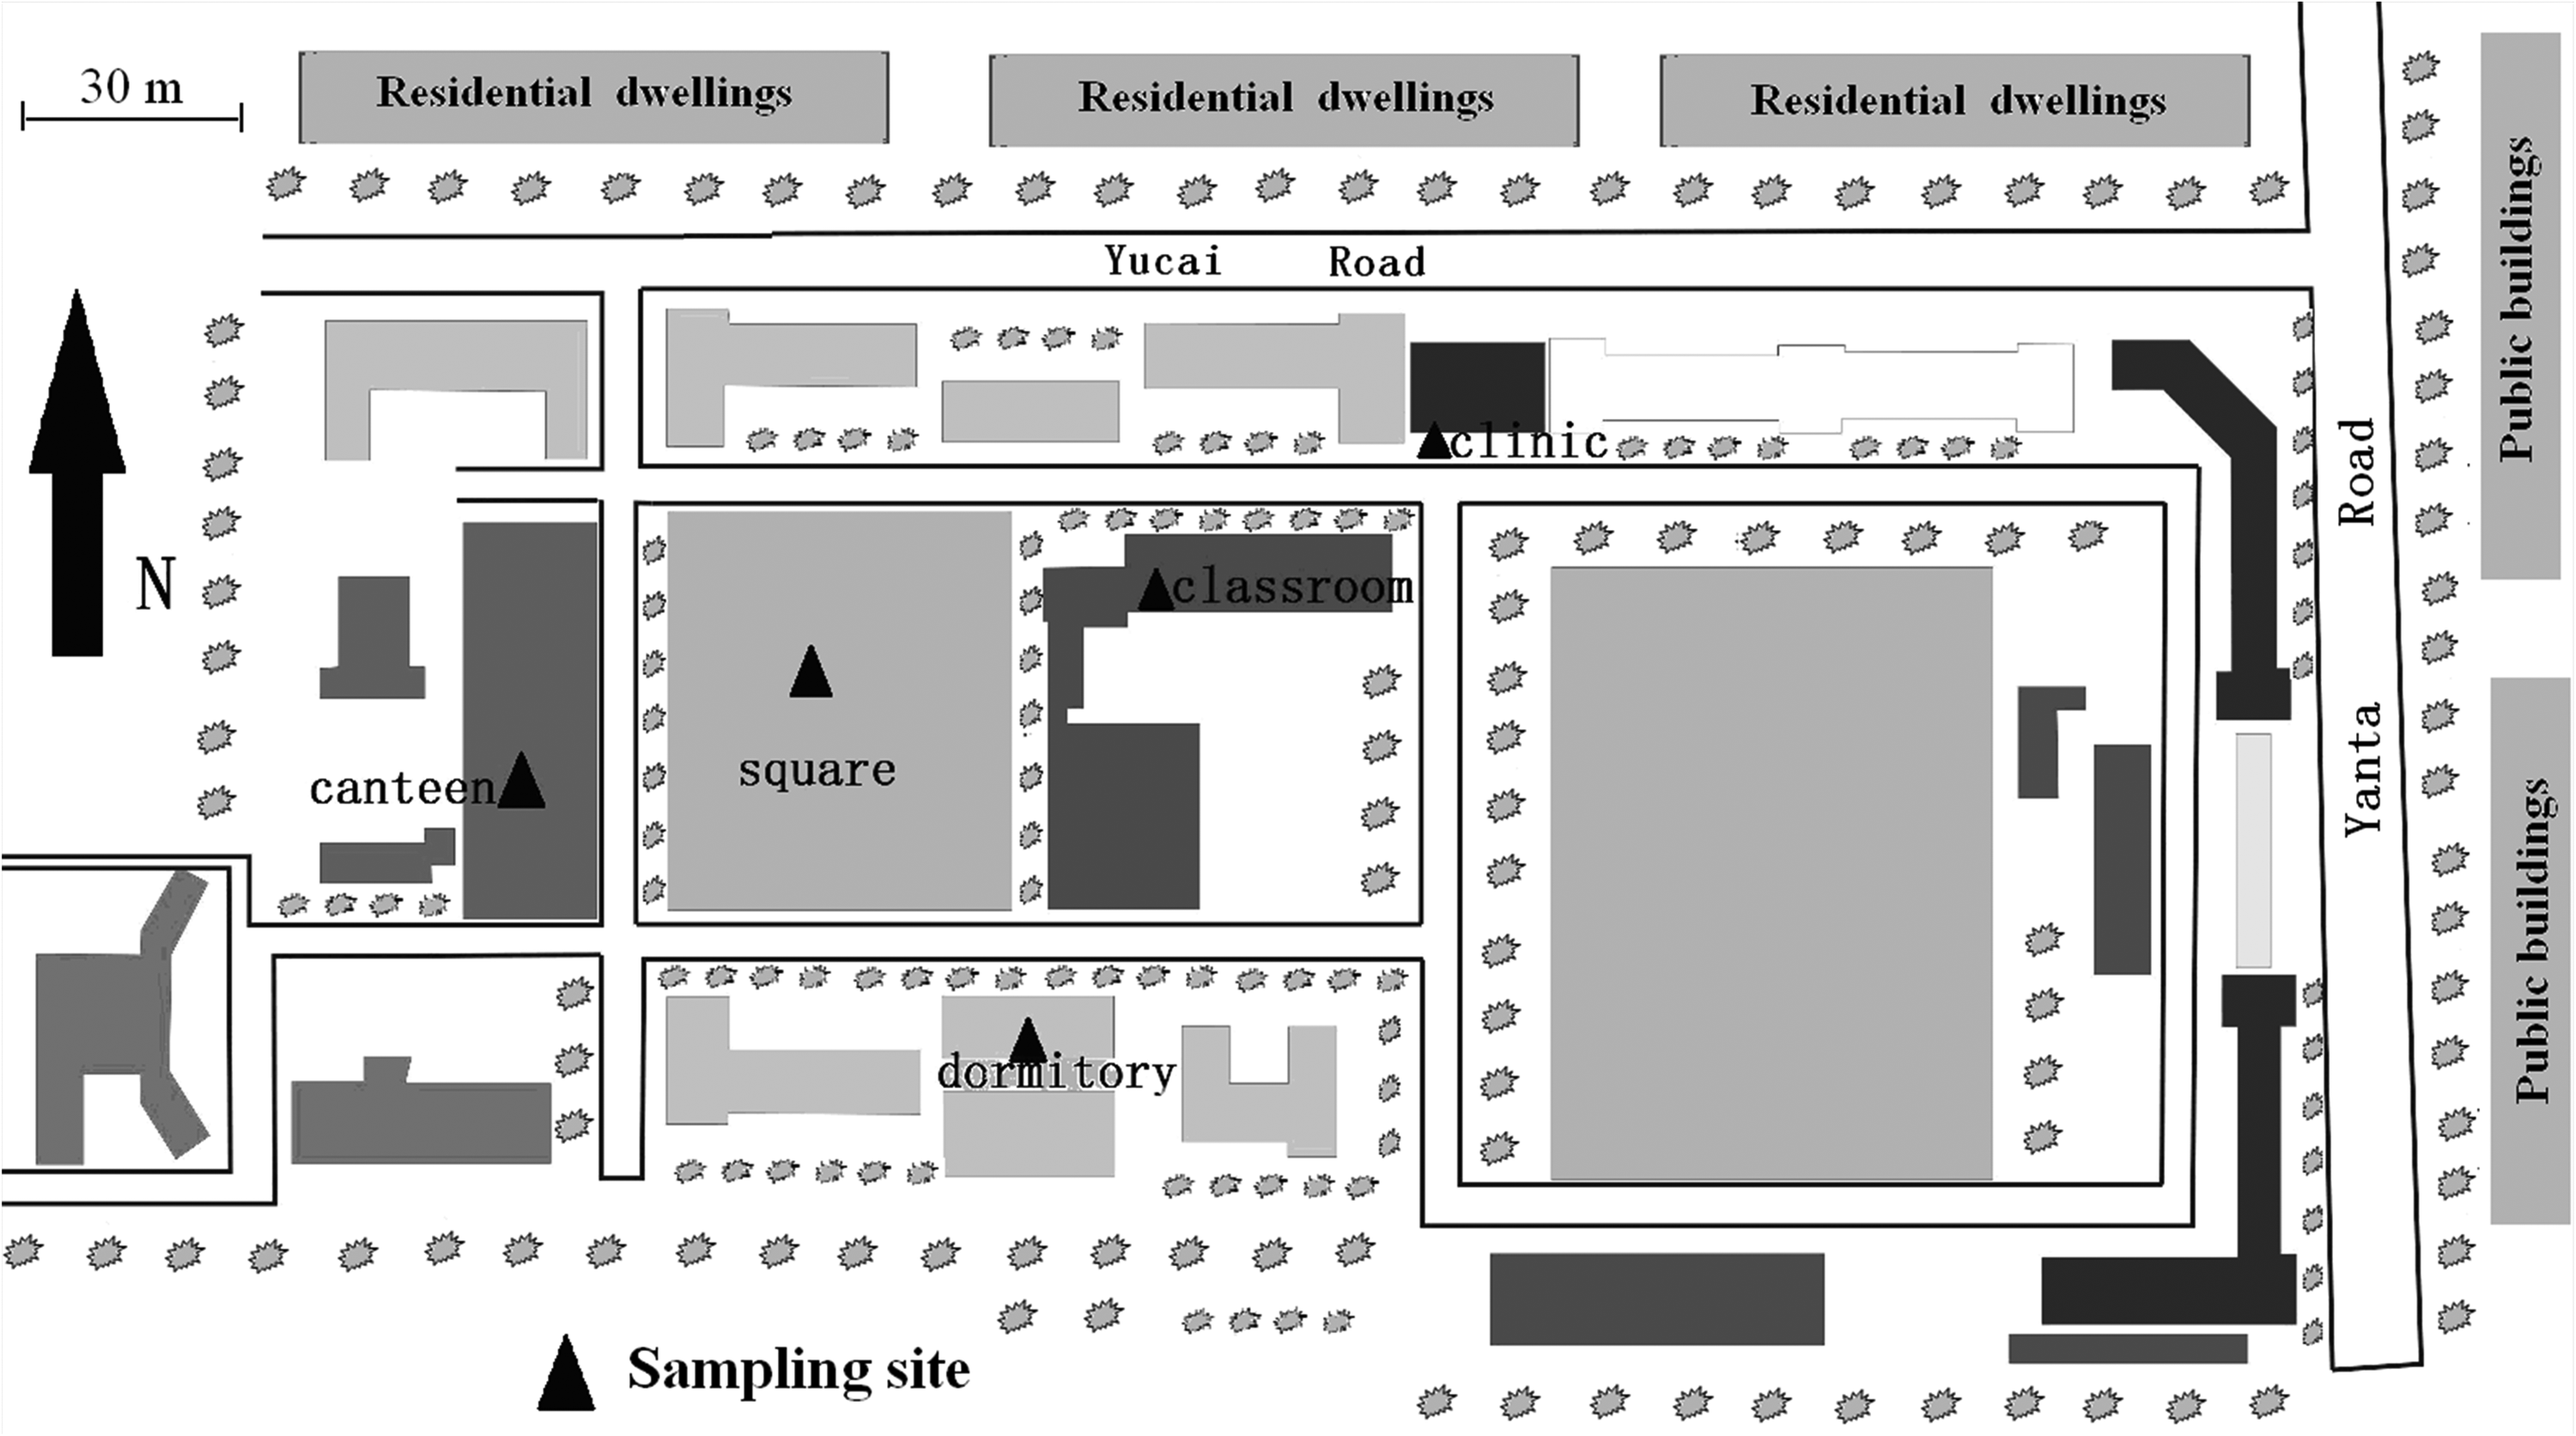
Sampling sites in university indoor environments of Xi'an, China.
The number of each type of indoor environments investigated.
Measurement and analysis
An Andersen six-stage cascade impactor (Westech) with six glass petri dishes of 93 mm in diameter was employed to collect bioaerosol samples with different size ranges. The range of aerodynamic diameter at each stage is as follows: ≥7.0 μm (stage 1), 7.0–4.7 μm (stage 2), 4.7–3.3 μm (stage 3), 3.3–2.1 μm (stage 4), 2.1–1.1 μm (stage 5), and 1.1–0.65 μm (stage 6). According to Chatigny et al.'s (1989) definition, the respirable fraction of particles corresponds to the size range between stages 3–6.
Bioaerosols sampling and monitoring of RH and temperature (T) were conducted at four indoor sites in four different seasons from March 2012 to February 2013. The RH and T were recorded using a hygrothermograph (TES1364, Taishi, Chinese Taiwan). At each site, sampling was performed at the height of about 1.5 m above the floor surface (i.e., in the breathing zone of a normal person) in several consecutive sunny days each season and during the same period between 11:00 am and 1:00 pm throughout the year. Samples were collected for about 10 min by sucking the air at the rate of 28.3 L/min with three repetitions each time. Therefore, a total of 24 samples (144 plates) were collected including 12 samples (72 plates) for bacteria and 12 samples (72 plates) for fungi at each site in this study. For comparison with the outdoor concentration, measurement was also taken simultaneously at the selected outdoor site.
Before each sampling, the sampler was disinfected with 75% ethanol. After the alcohol was volatilized sufficiently (about 3–5 min), the agar plates were loaded to the sampler according to collection stage inside of a Class II biosafety cabinet (BSC-1500; Biobase) and then the sampler was carried in a dust-free box to the sampling sites. According to Fang et al. (2008), nutrient agar (3 g beef extract, 10 g peptone, 5 g sodium chloride, 15 g agar, and 1,000 mL distilled water, pH=7.2) and Sabouraud dextrose agar (40 g glucose, 10 g peptone, 20 g agar, and 1,000 mL distilled water, pH=7.2) were used as bacterial and fungal culture medium, respectively in the present study. After sampling, the agar plates were immediately transported to the laboratory for incubation. Bacteria were incubated at 37°C for 48 h and fungi were incubated at 25°C for 72 h (Taiwan EPA, 2009a, 2009b).
After incubation, the colonies were counted followed by the positive-hole correction method to correct for colony overlapping. Each concentration of bioaerosols, generally expressed as total colony-forming units (CFU/m3) for respective particle size, was then calculated by dividing the number of colonies formed on the culture medium at each stage by the sampling air volume.
Statistical analysis of the observed data was conducted using regression analysis. The standard deviations associated with the annual or seasonal mean values at each sampling site are shown in the respective figures in the form of error bars. In addition, number median diameter (NMD) and geometric standard deviation (GSD) were used to describe the size distribution for each indoor site. The differences between bioaerosol concentrations at different sites were also tested by a student's t-test, in which p-value of<0.05 was considered to be statistically significant. Pearson's correlation analysis was performed to evaluate the statistical significances of correlation between various environmental factors and each concentration of airborne culturable bacteria and fungi.
Results and Discussion
Concentrations of airborne culturable bacteria and fungi
The annual mean concentrations of airborne culturable bacteria and fungi in all four indoor environments examined are shown in Table 2. It can be clearly seen that the airborne bacterial concentrations vary in different indoor environments, ranging from 186 to 1,593 CFU/m3. The highest mean concentration of bacteria occurs in canteen (1,025±91 CFU/m3), followed by clinic (689±26 CFU/m3) and dormitories (614±34 CFU/m3), and the lowest is found in classrooms (479±66 CFU/m3). Fungal concentration ranges from 130 to 940 CFU/m3. The maximum concentration is also detected in canteen (699±57 CFU/m3) followed by clinic (584±43 CFU/m3) and dormitories (421±52 CFU/m3), while the lowest is also found in classrooms (345±15 CFU/m3).
Mean values within the column by the same letter are not significantly different (p<0.05).
The differences between airborne fungi and bacteria are compared by t-test.
Statistically, airborne culturable bacterial and fungal concentrations detected in canteens are significantly higher than those at other three indoor sites (p<0.05). In the clinic, the concentration of total culturable fungi is also significantly higher than that in classrooms and dormitories (p<0.05) and the concentration of total culturable bacteria is higher significantly than that in classrooms (p<0.05). However, no significant difference is found between dormitories and the clinic (p>0.05).
According to Nasir and Colbeck (2012), bioaerosols in indoor environments can be of both outdoor and indoor origin. Outdoor bioaerosols can migrate into indoor environments through a range of avenues such as doors, windows, and human movement. As the indoor sites in this study are within 100 m of each other, ambient conditions are expected to be similar and thus, it is reasonable that outdoor origin is approximately considered as the same for all indoor sites. Therefore, the variations in the concentration in various indoor environments may be attributed mainly to different amounts of aerosolized bioaerosols from various indoor sources. During the sampling, remains of meals, medical wastes, and dirty socks and clothing may be found in the canteen, clinic, and dormitories, respectively, which is common in Chinese public places and is also a reflection of daily lifestyles of Chinese people. This phenomenon is undeniably connected with an appearance of a new indoor source of bioaerosols, leading to the accumulation of microorganisms and the increase of bioaerosol concentrations.
Another reason why the higher concentrations show in the canteen and clinic may be owing to higher occupant density and more human activities than in classrooms. As seen in Table 1, there were more persons in the canteen (50–100 persons) and clinic (20–30 persons) than in classrooms (10–20 persons) and dormitories (4–6 persons) when the sampling was carried out. As suggested by Qian et al. (2012), both resuspended dust deposited on the floor due to human activities and direct shedding from human occupants are important contributors to indoor bioaerosol populations. Furthermore, patient oral and respiratory fluid emitted via coughing, sneezing, talking, and breathing may be another significant source of bioaerosols (Hospodsky et al., 2012). This is why there are more elevated bioaerosols in clinic than in classrooms despite similar number of persons in both sites.
The ratio of indoor-to-outdoor airborne bacteria and fungi (I/O ratio) is generally used to check if indoor spaces are contaminated with them. If this ratio is larger than 1, it might be suspected that the indoor air has been contaminated with airborne microorganisms (Lee et al., 2006; Kim and Kim, 2007; Karbowska-Berent et al., 2011). The present results, shown in Fig. 2, indicate that the I/O ratios for both bacteria and fungi are higher than 1 in most investigated buildings except for classrooms. As discussed earlier, this can be explained by the fact that there are commonly remains of meals, medical wastes, and dirty clothing carelessly discarded in these places, which provide favorable conditions for bacterial and fungal growth and proliferation, resulting in I/O ratios larger than 1.
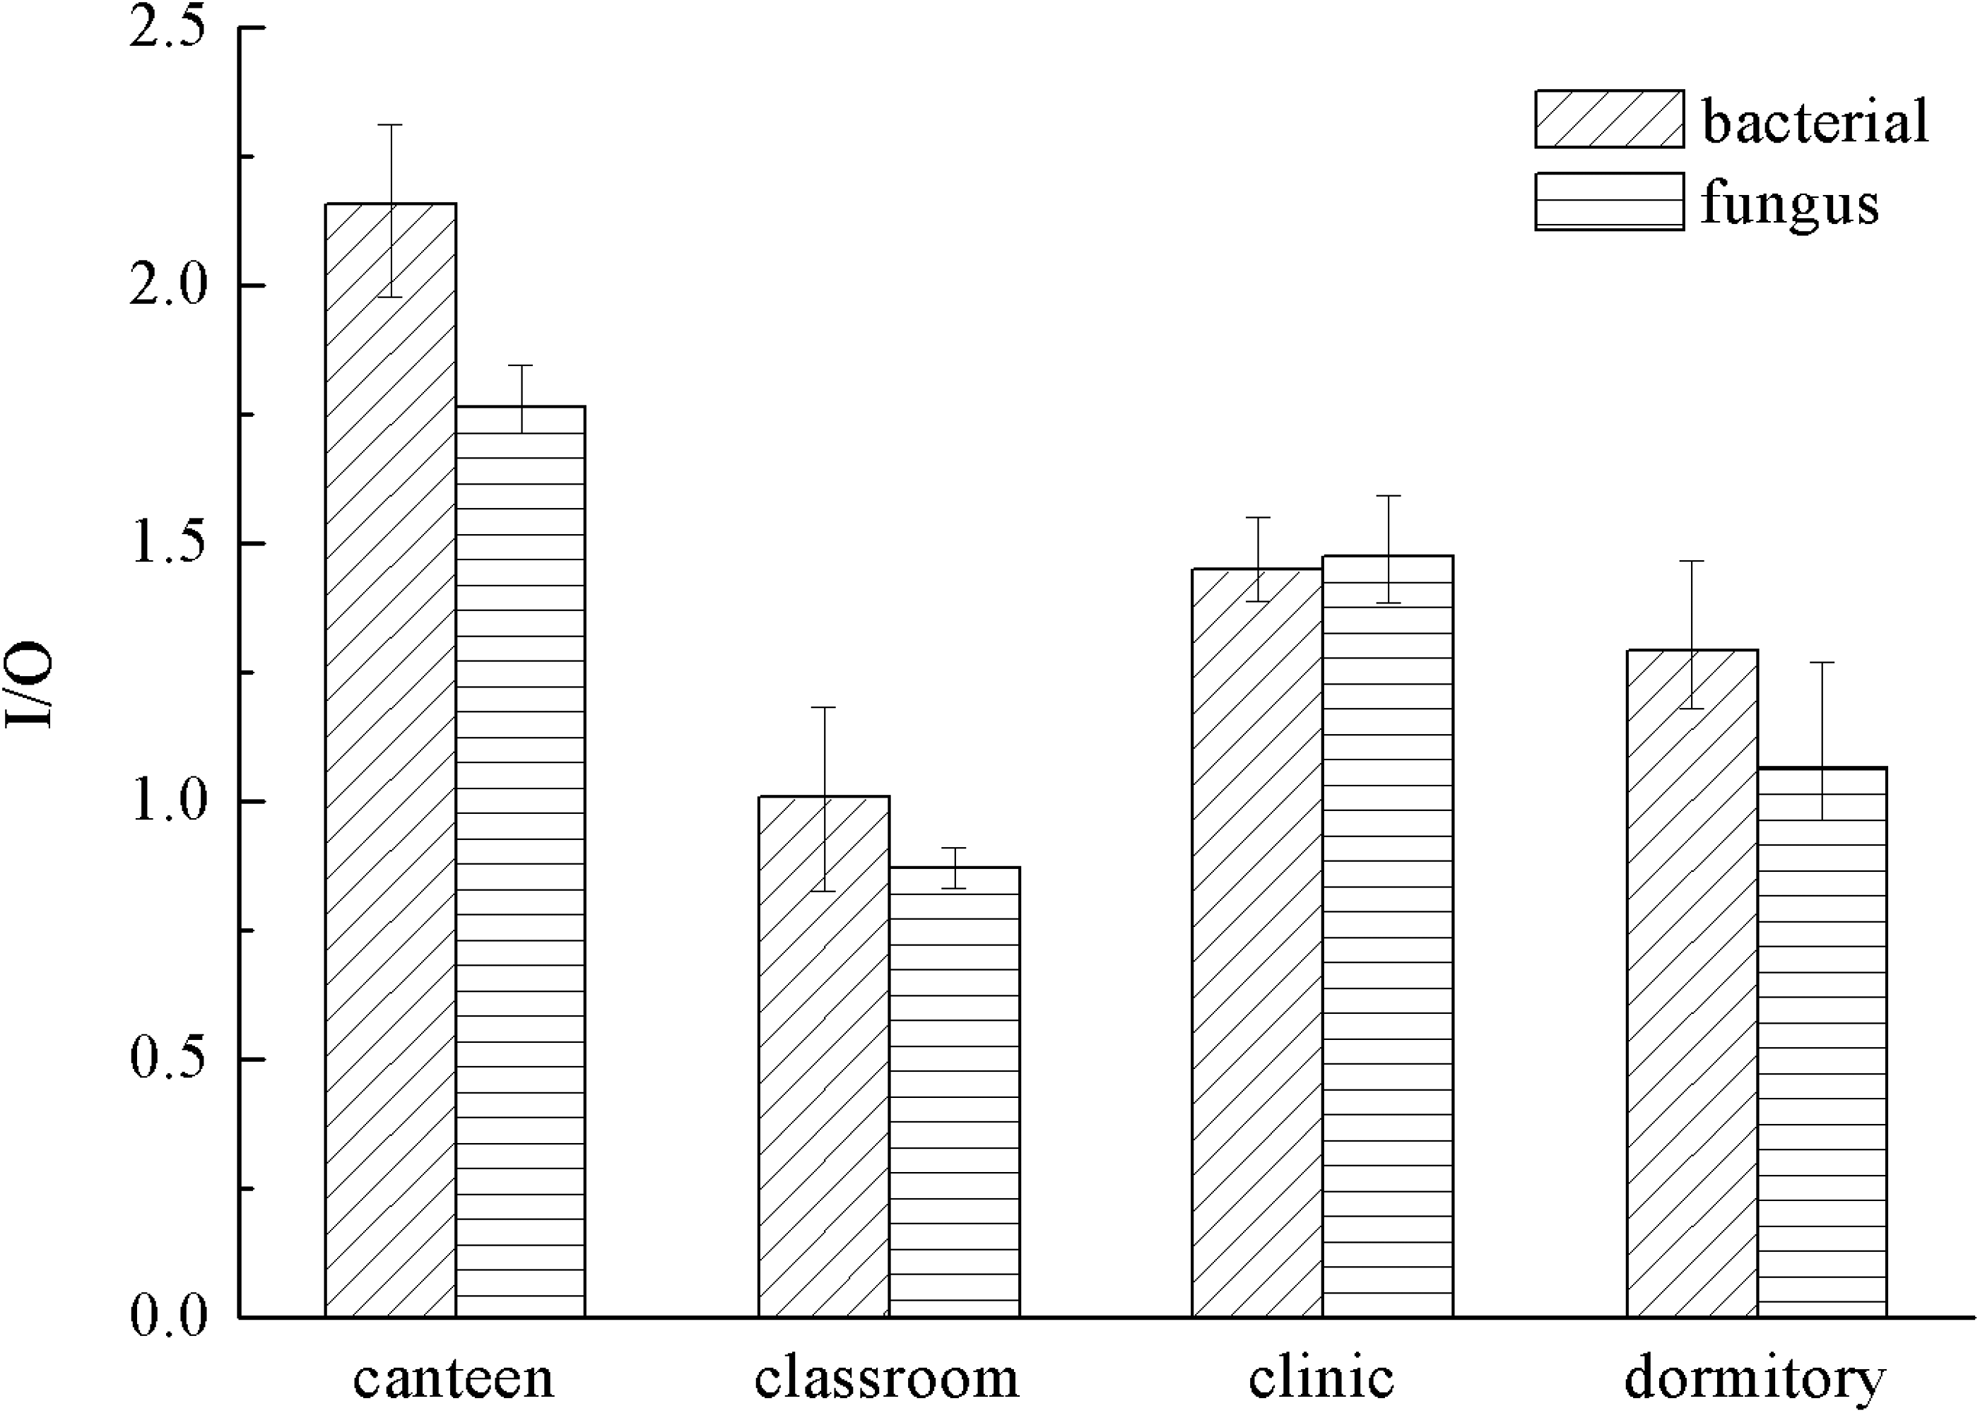
Indoor and outdoor ratio of levels of airborne bacteria and fungi in the university indoor environments of Chang'an University.
Similar results were also reported by Nasir and Colbeck (2012), who pointed out that this phenomenon was undeniably a reflection of new significant microbiological source. However, the present values for both bacteria and fungi are inconsistent with some other studies (Lee et al., 2006; Kim and Kim, 2007; Karbowska-Berent et al., 2011). Kim and Kim (2007) reported that the I/O ratios for airborne bacteria and fungi were 0.58 and 0.56 in hospitals, 0.71 and 0.72 in childcare centers, 0.28 and 0.33 in elderly welfare facilities, and 0.63 and 0.66 in maternity recuperation centers, respectively. Lee et al. (2006) and Karbowska-Berent et al. (2011) also found that the I/O ratios for airborne fungi were lower than 1 regardless of the type of investigated public buildings. Differences in the environmental conditions and indoor sources should be a likely reason for these inconsistencies.
Average bioaerosol exposures in this study inside different university indoor environments do not exceed the threshold limit value, 2,500 CFU/m3 announced by the MOH, MEP, and AQSIQ of China (2002). However, it is valuable to compare the present data with some guideline values proposed by various organizations all over the world. The AIHA has suggested that the guideline values for fungal spores should be less than 500 CFU/m3 in residential buildings and less than 250 CFU/m3 in commercial buildings (Wonder Makers Environmental, Inc., 2001), respectively. In Swedish, the number of 500 CFU/m3 of bacteria and 300 CFU/m3 of fungal spores can be accepted in an indoor environment (Abel et al., 2002). According to current Singaporean requirements, total amount of airborne bacteria in indoor environments should not exceed 500 CFU/m3 (Obbard and Fang, 2003). It is evident that most of the bioaerosol concentrations detected in this study are above these reference values. Such comparison partly reflects the differences in geographic region of different countries and localized characteristics of bioaerosols. On the other hand, it is also a reflection of substantially strong air pollution in China due to recent rapid economic growth in the past decades, and the regulation of indoor air quality in China still need further optimization.
Furthermore, it is worthwhile to carry out comparisons of bioaerosol concentrations in different university indoor environments worldwide. Table 3 presents the comparison in different university indoor environments worldwide. It can be seen that the airborne bacteria and fungi detected in this study show higher concentrations in comparison to previous indoor studies in western universities (Karbowska-Berent et al., 2011; Grisoli et al., 2012; Nunes et al., 2013). These discrepancies should be due to differences in the occupant density and lifestyle, ventilation behavior, and room conditions between Chinese and western universities. The quantity of indoor furnishings, general household cleaning practices, and ventilation behavior will greatly affect the amount of aerosolized bioaerosols from already deposited particles on indoor surfaces and ingress of outdoor bioaerosols (Jones and Harrison, 2004). Another important reason may be attributed to dissimilar meteorological and environmental conditions in different cities. It should be noted that the referred investigations were performed in the geographic regions different from the present semi-arid region. Moreover, compared to other cities examined in the world, the microbial concentration in the atmosphere was higher in Xi'an (Li et al., 2012).
Seasonal variation of airborne culturable bacterial and fungal concentrations
Figure 3 shows the seasonal variation of airborne culturable bacterial and fungal concentrations at all sampling sites. In all four indoor sites, there are similar distinct seasonal variations in the fungal concentrations. The highest fungal concentrations occur in autumn, and relatively higher concentrations are detected in winter than in spring and summer, although the seasonal difference between autumn and winter is not statistically significant (p>0.05). Similar seasonal variations for fungal concentrations have also been reported by Huang et al. (2002) and Lee et al. (2006). Huang et al. (2002) investigated a seasonal distribution of airborne fungi in municipal landfill sites, in which the total culturable microbial concentrations peaked in winter in closed or undergoing-closure landfill areas. Lee et al. (2006) studied the culturability of airborne fungi collected in indoor and outdoor environments in six Cincinnati area single-family homes. Their results indicated that the highest indoor concentration of fungi was observed in the fall. However, this kind of seasonal variation was contrary to other studies where the highest concentrations of bioaerosols occurred in summer (Pastuszka et al., 2000; Tsai and Macher, 2005; Lee and Jo, 2006; Wang et al., 2010a). This is more likely due to the weather condition and various indoor microenvironments, such as activities and life style of occupants, ventilation behavior, and ingress of particles from outdoor, furnishings. The effect of weather conditions (temperature and RH) will be discussed below. In addition, these factors fluctuate to a great degree between various housing types, their condition and geographic location.
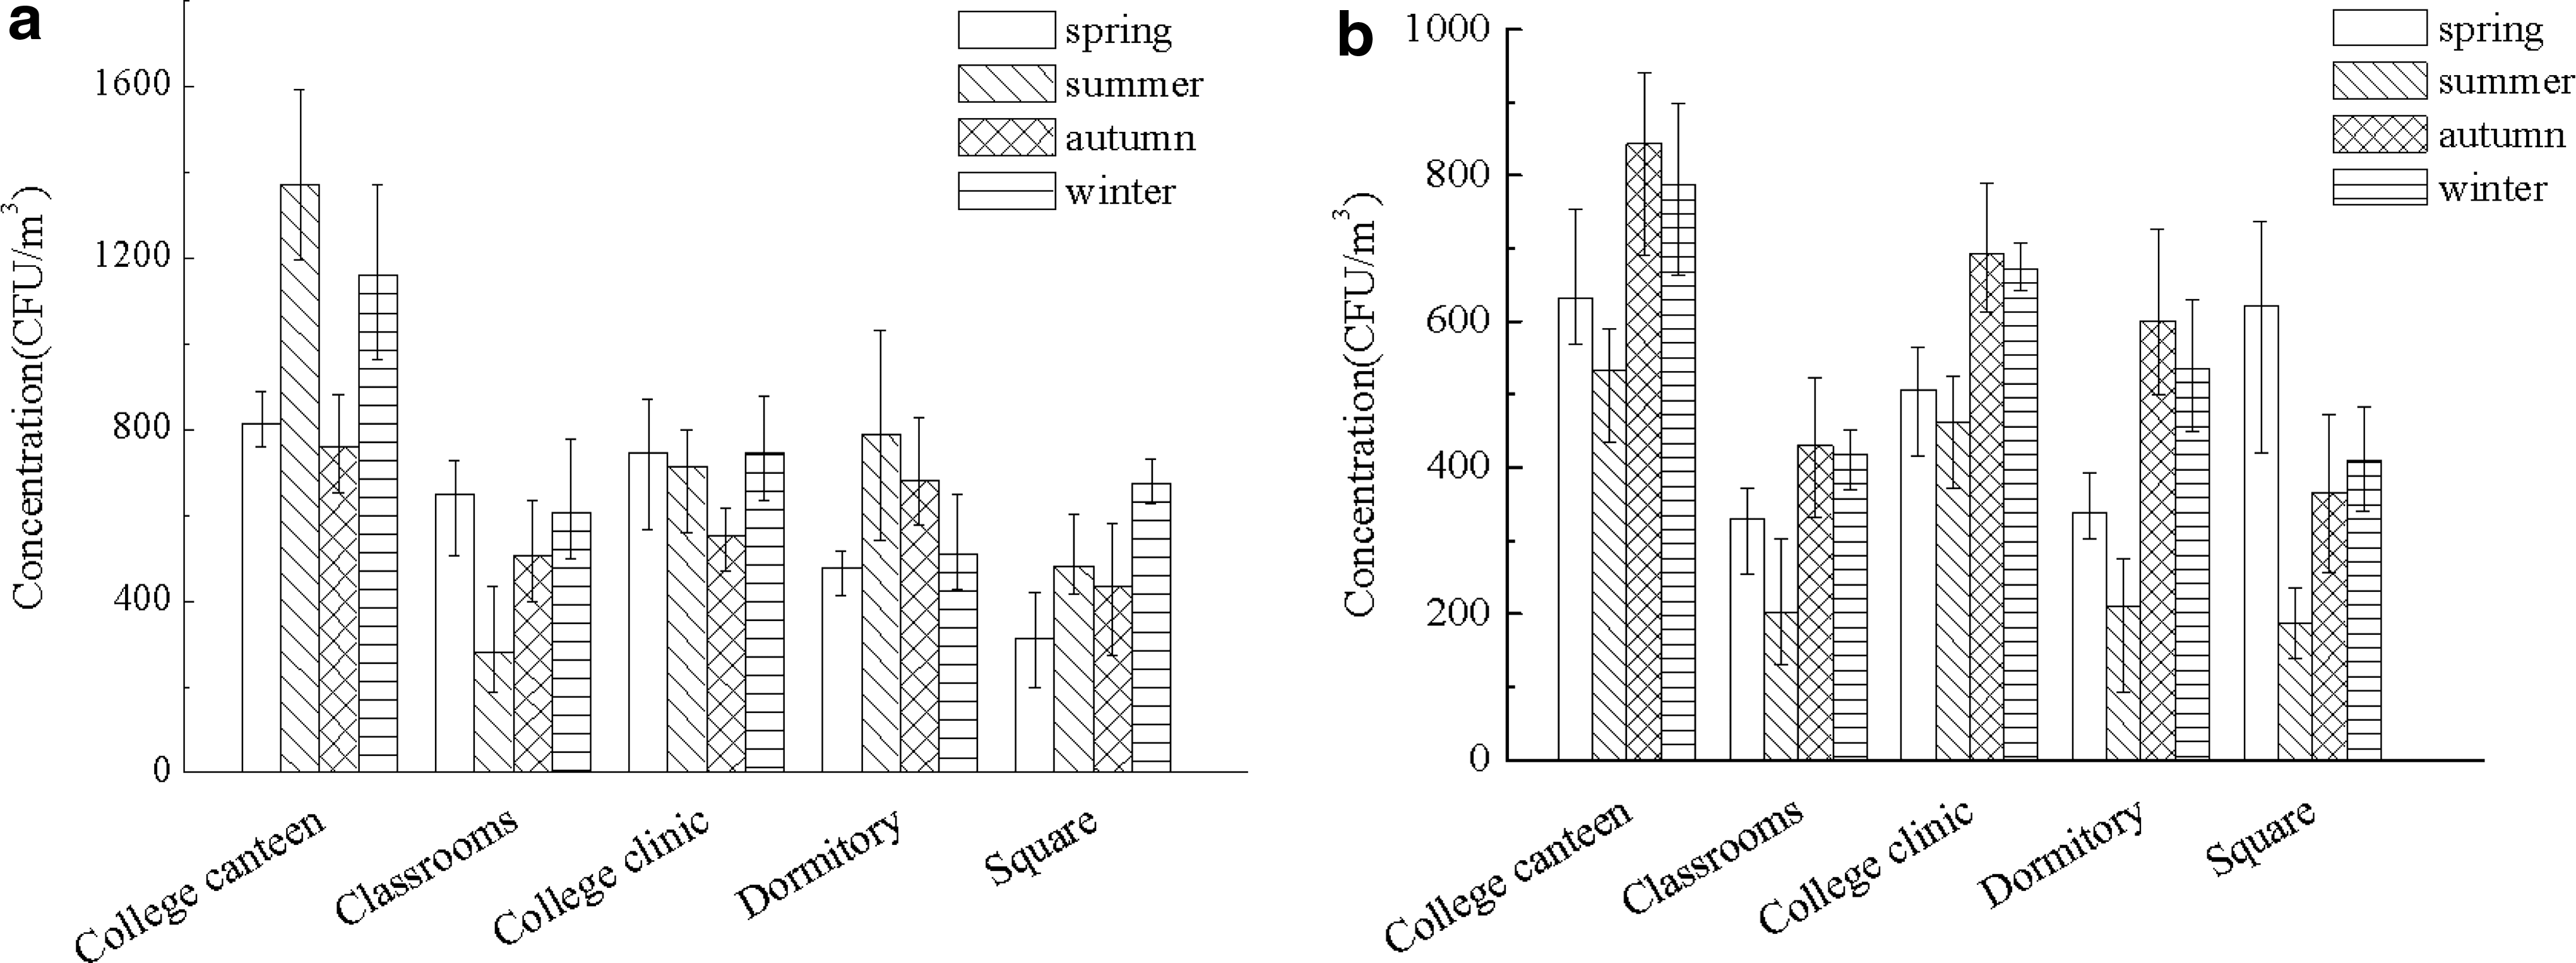
Seasonal variation of airborne
A different seasonal variability of airborne fungi from indoor sites can be also observed in the present outdoor site. The concentration of airborne fungi reaches its highest level in spring, and its lowest level in summer. This difference in seasonal trend of airborne fungal concentration between indoor and outdoor environments reflects the role of the different sources and different influence factors for airborne fungi indoor and outdoor. Normally, plants and vegetables are regarded as the main sources of fungal air contamination in outdoor environments (Awad, 2005; Fang et al., 2008). In Xi'an, warm temperatures throughout the spring promote plants growth quickly and vigorously, which can provide favorable conditions for fungal proliferation, thereby greatly contributing to the concentration of fungal spores. During the present sampling period of summer, higher temperature and stronger UV radiation in outdoor environment generally result in decreased airborne fungal spore concentration.
The seasonal variation trend of airborne bacteria apparently varies in four different indoor sites. For example, the averaged bacterial concentrations are significantly higher in summer and winter than in spring and autumn in canteen (p<0.05), while the lower average levels of airborne bacteria are notably found in summer than any other seasons in classrooms (p<0.05). Such seasonal variation for bacterial concentrations seems to mainly depend on the various sampling sites. Further research need to be performed in this area.
Correlations between airborne culturable bacteria and fungi and environmental parameters
The temperature and RH at the four indoor sites and one outdoor site during four seasons are shown in Fig. 4. It can be seen that the difference of the temperature between any two of different indoor sites is not significant (p>0.05) except for that between clinic and each of other sites, especially during summer, autumn, and winter. For example, during autumn in the canteen, classrooms, and dormitories, the mean temperatures are 15.5°C, 14.4°C, and 15.7°C with a range of 12.7–18.6°C, 12.6–16.2°C, and 13.5–19.8°C, respectively, while in the clinic the mean temperature is 8.5°C with a range of 6.6–11.7°C. In addition, the difference of the RH between any two different indoor sites is not significant (p>0.05) except for that between clinic and each of other sites. For example, during winter in the canteen, classrooms, and dormitories, the mean temperatures are 32.8%, 32.1%, and 34.7% with a range of 30.5–35.3%, 29.8–35.7%, and 31.8–36.3%, respectively, while in the clinic the mean temperature is 39.5% with a range of 38.3–43.0%. The humidity and temperature in four indoor environments are found to show relatively smaller change compared with those in outdoor environment in this study. It is worth noting that the sampling sessions were performed during consecutive sunny days of each season and during the same time between 11:00 am and 1:00 pm. Therefore, it is not surprising that the variations of outdoor temperature and humidity in each season are not huge.
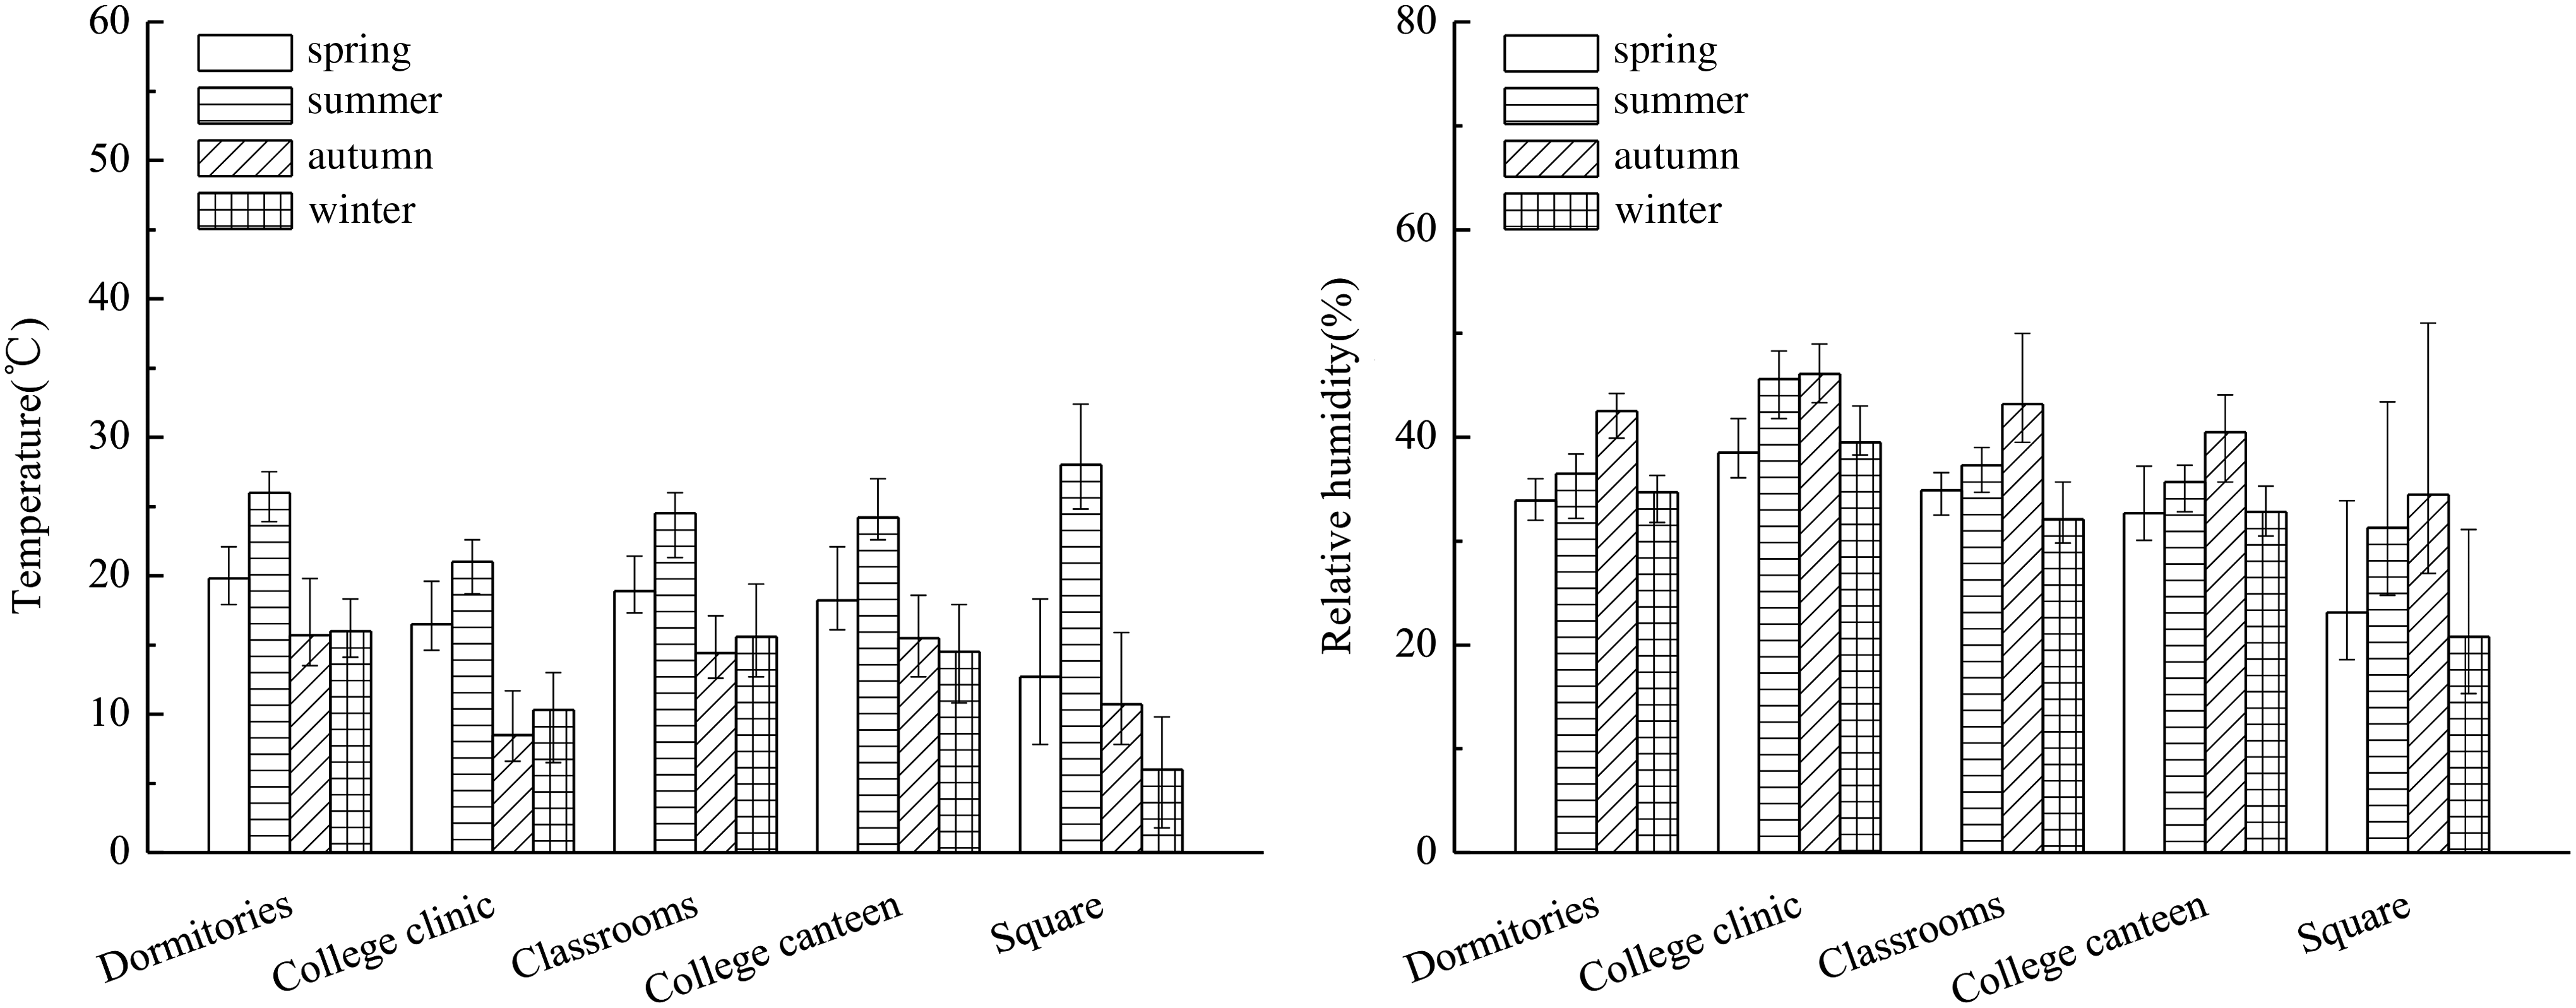
Temperature and relative humidity at the four indoor sites and one outdoor site during four seasons.
Table 4 shows the correlation between concentrations of airborne fungi and temperature and RH in four indoor sites. It can be seen that the RH is statistically and positively correlated with airborne fungal concentration only in canteen and dormitories (p<0.05). Similar results are also reported by Kim et al. (2009) and Nasir and Colbeck (2010). According to them, the RH of the air has a major role in growth and survival of airborne fungi. Therefore, higher RH could promote the higher airborne fungal number.
Correlation is significant at the 0.05 level (two-tailed).
Correlation is significant at the 0.01 level (two-tailed).
In contrast, there is a negative correlation between airborne fungal concentrations and temperature in all the housing types. All of these correlation values are statistically significant (p<0.05). This observation does not agree with the general results reported in the literature, in which the concentrations of airborne fungi are high in a relatively warm condition and low in a cool condition. However, the present result is consistent with that obtained by Nasir and Colbeck (2010). The possible reason still appears to attribute to the specific microenvironments as discussed above.
Table 5 indicates the correlation between concentrations of airborne bacteria and temperature and humidity in four university indoor environments. Since all correlation coefficients of the bacterial concentrations with temperature at four sites are larger than those with RH, indoor temperature is more statistically correlated with bacterial concentration than indoor humidity. This might be because the variations of the RH are smaller than those of temperature in this study (as shown in Fig. 4). To some extent, this is a reflection of meteorological conditions of Xi'an city located in Chinese semi-arid region.
Correlation is significant at the 0.05 level (two-tailed).
Correlation is significant at the 0.01 level (two-tailed).
In addition, it is evident from Table 5 that there are obvious differences in the degree of correlation between airborne bacteria levels and temperature in different indoor sites. The strongest correlation of bacterial counts with temperature is found in classrooms, followed by canteen and dormitories. In the clinic, a weak correlation with bacterial numbers can be observed. Conversely, indoor humidity does not appear to have a significant influence on bacterial concentrations in all indoor sites investigated here. This suggests that the influence of temperature and RH on airborne bacterial and fungal concentrations is dynamic and the fluctuation of airborne bacterial and fungal concentrations indoors affects by various variables (LeBouf et al., 2008; Raisi et al., 2013).
Size distributions of airborne culturable bacteria and fungi
Figure 5 illustrates the size distributions of airborne culturable bacteria and fungi in all four indoor sites. For airborne bacteria collected, there is a similar single-peak concentration, 4,591 and 4,934 CFU/m3/dlogDp (76 and 104 CFU/m3), respectively in classrooms and dormitories, in a size range of 3.3–4.7 μm (stage 3). In contrast, there exists a double-peak pattern of bacterial concentration in the canteen and clinic, respectively. In the canteen, the major and second peak concentrations are 7,617 and 7,351 CFU/m3/dlogDp (85 and 170 CFU/m3), in the >7 μm (stage 1) and 3.3–4.7 μm (stage 3) size range, respectively. In the clinic, the major and second peak concentrations are 4,826 and 4,399 CFU/m3/dlogDp (135 and 67 CFU/m3) in the 3.3–4.7 μm (stage 3) and >7 μm (stage 1) size range, respectively.
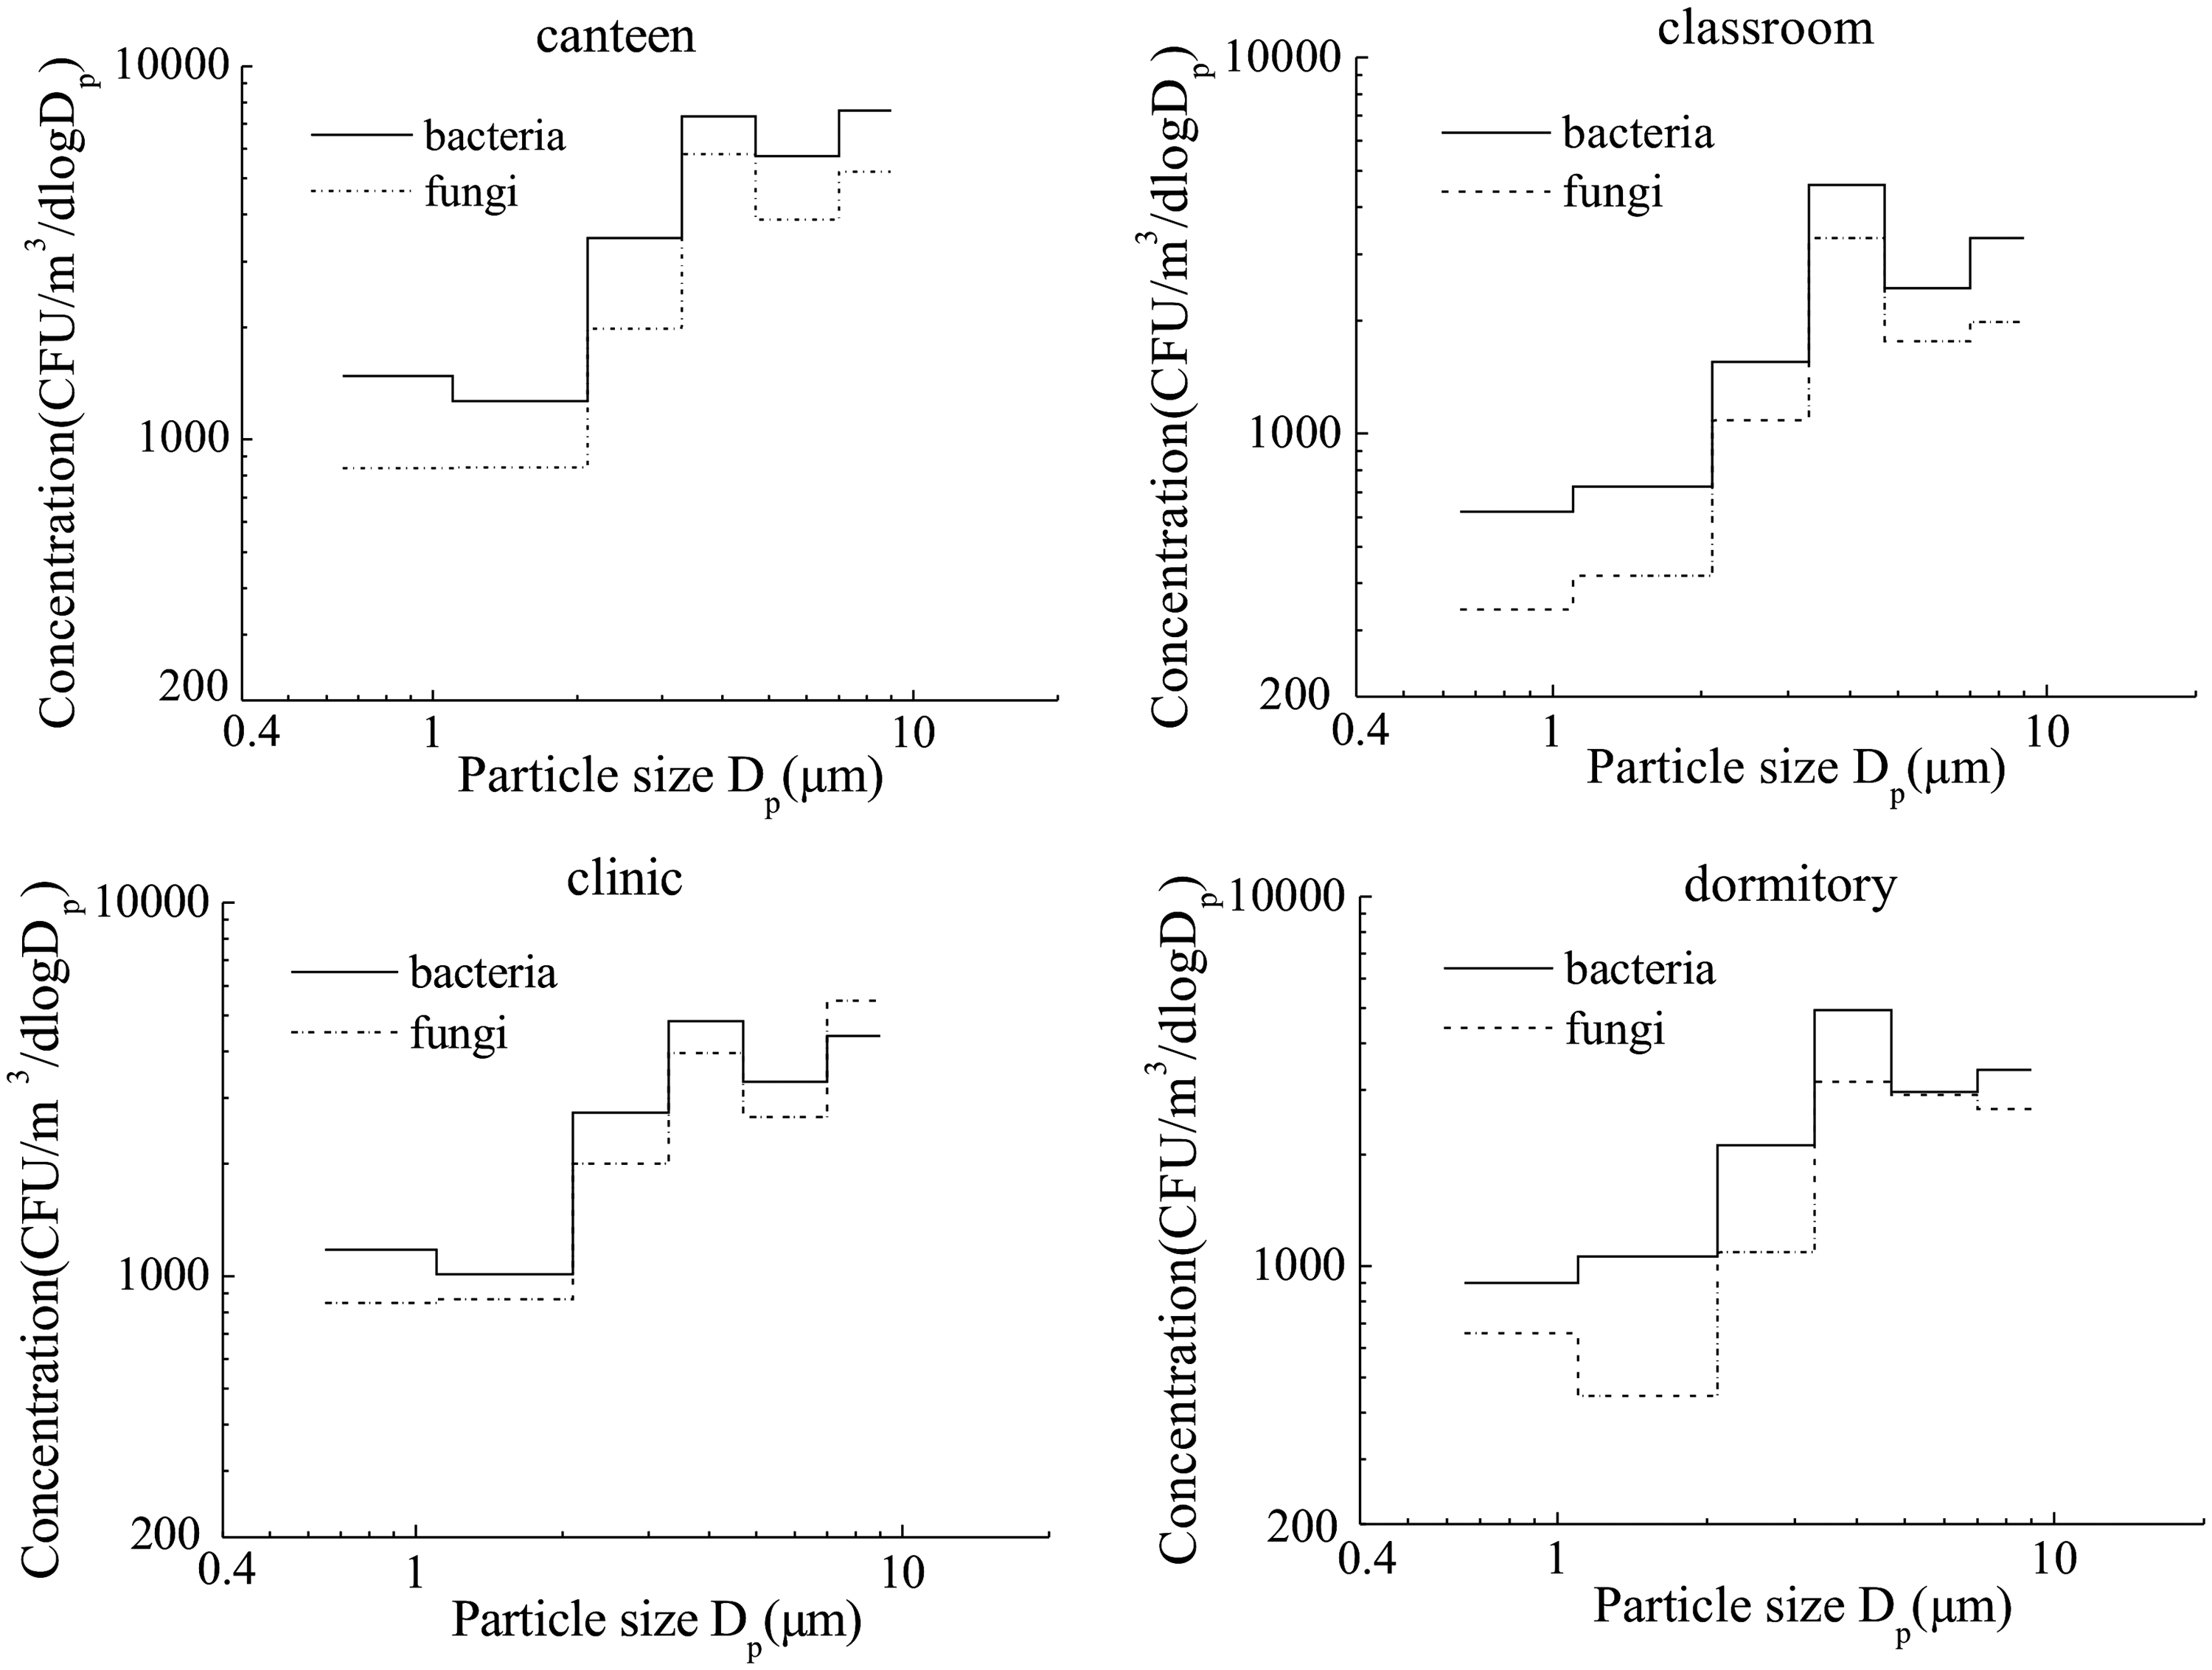
Size distributions of airborne bacteria and fungi in university indoor environments.
For the airborne fungi, the double-peak pattern can be also observed in the canteen and clinic, respectively: the major peak concentration in the 3.3–4.7 μm (stage 3) and >7 μm (stage 1) size range, and another peak concentration in the size range of >7 μm (stage 1) and 3.3–4.7 μm (stage 3), respectively. A single-peak concentration appears in a size range of 3.3–4.7 μm (stage 3) in classrooms, whereas stage 3 (3.3–4.7 μm) and stage 2 (4.7–7 μm) dominate in dormitories.
The size distribution peaking toward the coarse size fraction shows that bioaerosols may appear as agglomerates or attached to other nonbiological matrixes rather than single cells. The recent study by Qian et al. (2012) also found the largest increase in concentration on the largest impactor stage (>9 μm) due to human occupancy. Moreover, the species composition can also play a role in the size distribution. As stated by Yamamoto et al. (2012), the size of bioaerosols is different according to each genus and is dependent upon the age and nutrient source of the spore. Therefore, some differences in size distribution patterns of airborne bacteria or fungi can be found in this study. For example, the size distributions of bacteria and fungi are different in dormitories in this study, while in other three indoor environments show similarity. It is still comparable with other results obtained by Nasir and Colbeck (2010, 2012), in which the bacteria and fungi show similar size distributions in Type I house (single bedroom) and KIT (kitchen), while in other indoor environments differences exist. However, in this study we cannot give further detailed explanation on this phenomenon due to the lack of information on the age and nutrient source of bioaerosols, but we will focus on this phenomenon in our future studies.
Figure 6 shows the cumulative size distributions of airborne bacteria and fungi detected in this study. About 83.1%, 82.0%, 79.9%, and 79.5% of airborne bacteria, and 84.7%, 85.8%, 81.3%, and 83.6% of airborne fungi, are found in the size range of less than 4.7 μm, respectively, in canteen, classrooms, clinic, and dormitories. This indicates that close to 80% of bacterial aerosols and more than 80% fungal aerosols are in respirable size range in all of the present indoor environments. The respirable particles have potential to deposit in the lower respiratory system. Therefore, there is a potential risk of bioaerosols to students and staff in university indoor environments. Furthermore, the present finding also suggests that the respirable fraction of bioaerosols does not significantly vary among housing type. To our knowledge, the available results related to the respirable fractions of bioaerosols in university indoor environments are very few. However, the proportion of respirable bioaerosols in the present environments are comparable to the results obtained in other indoor environments (Pastuszka et al., 2000; Wang et al., 2010a; Nasir and Colbeck, 2012), suggesting that the respirable fraction of bacteria and fungi might be not dependent on building type and material, geographical and meteorological factors.
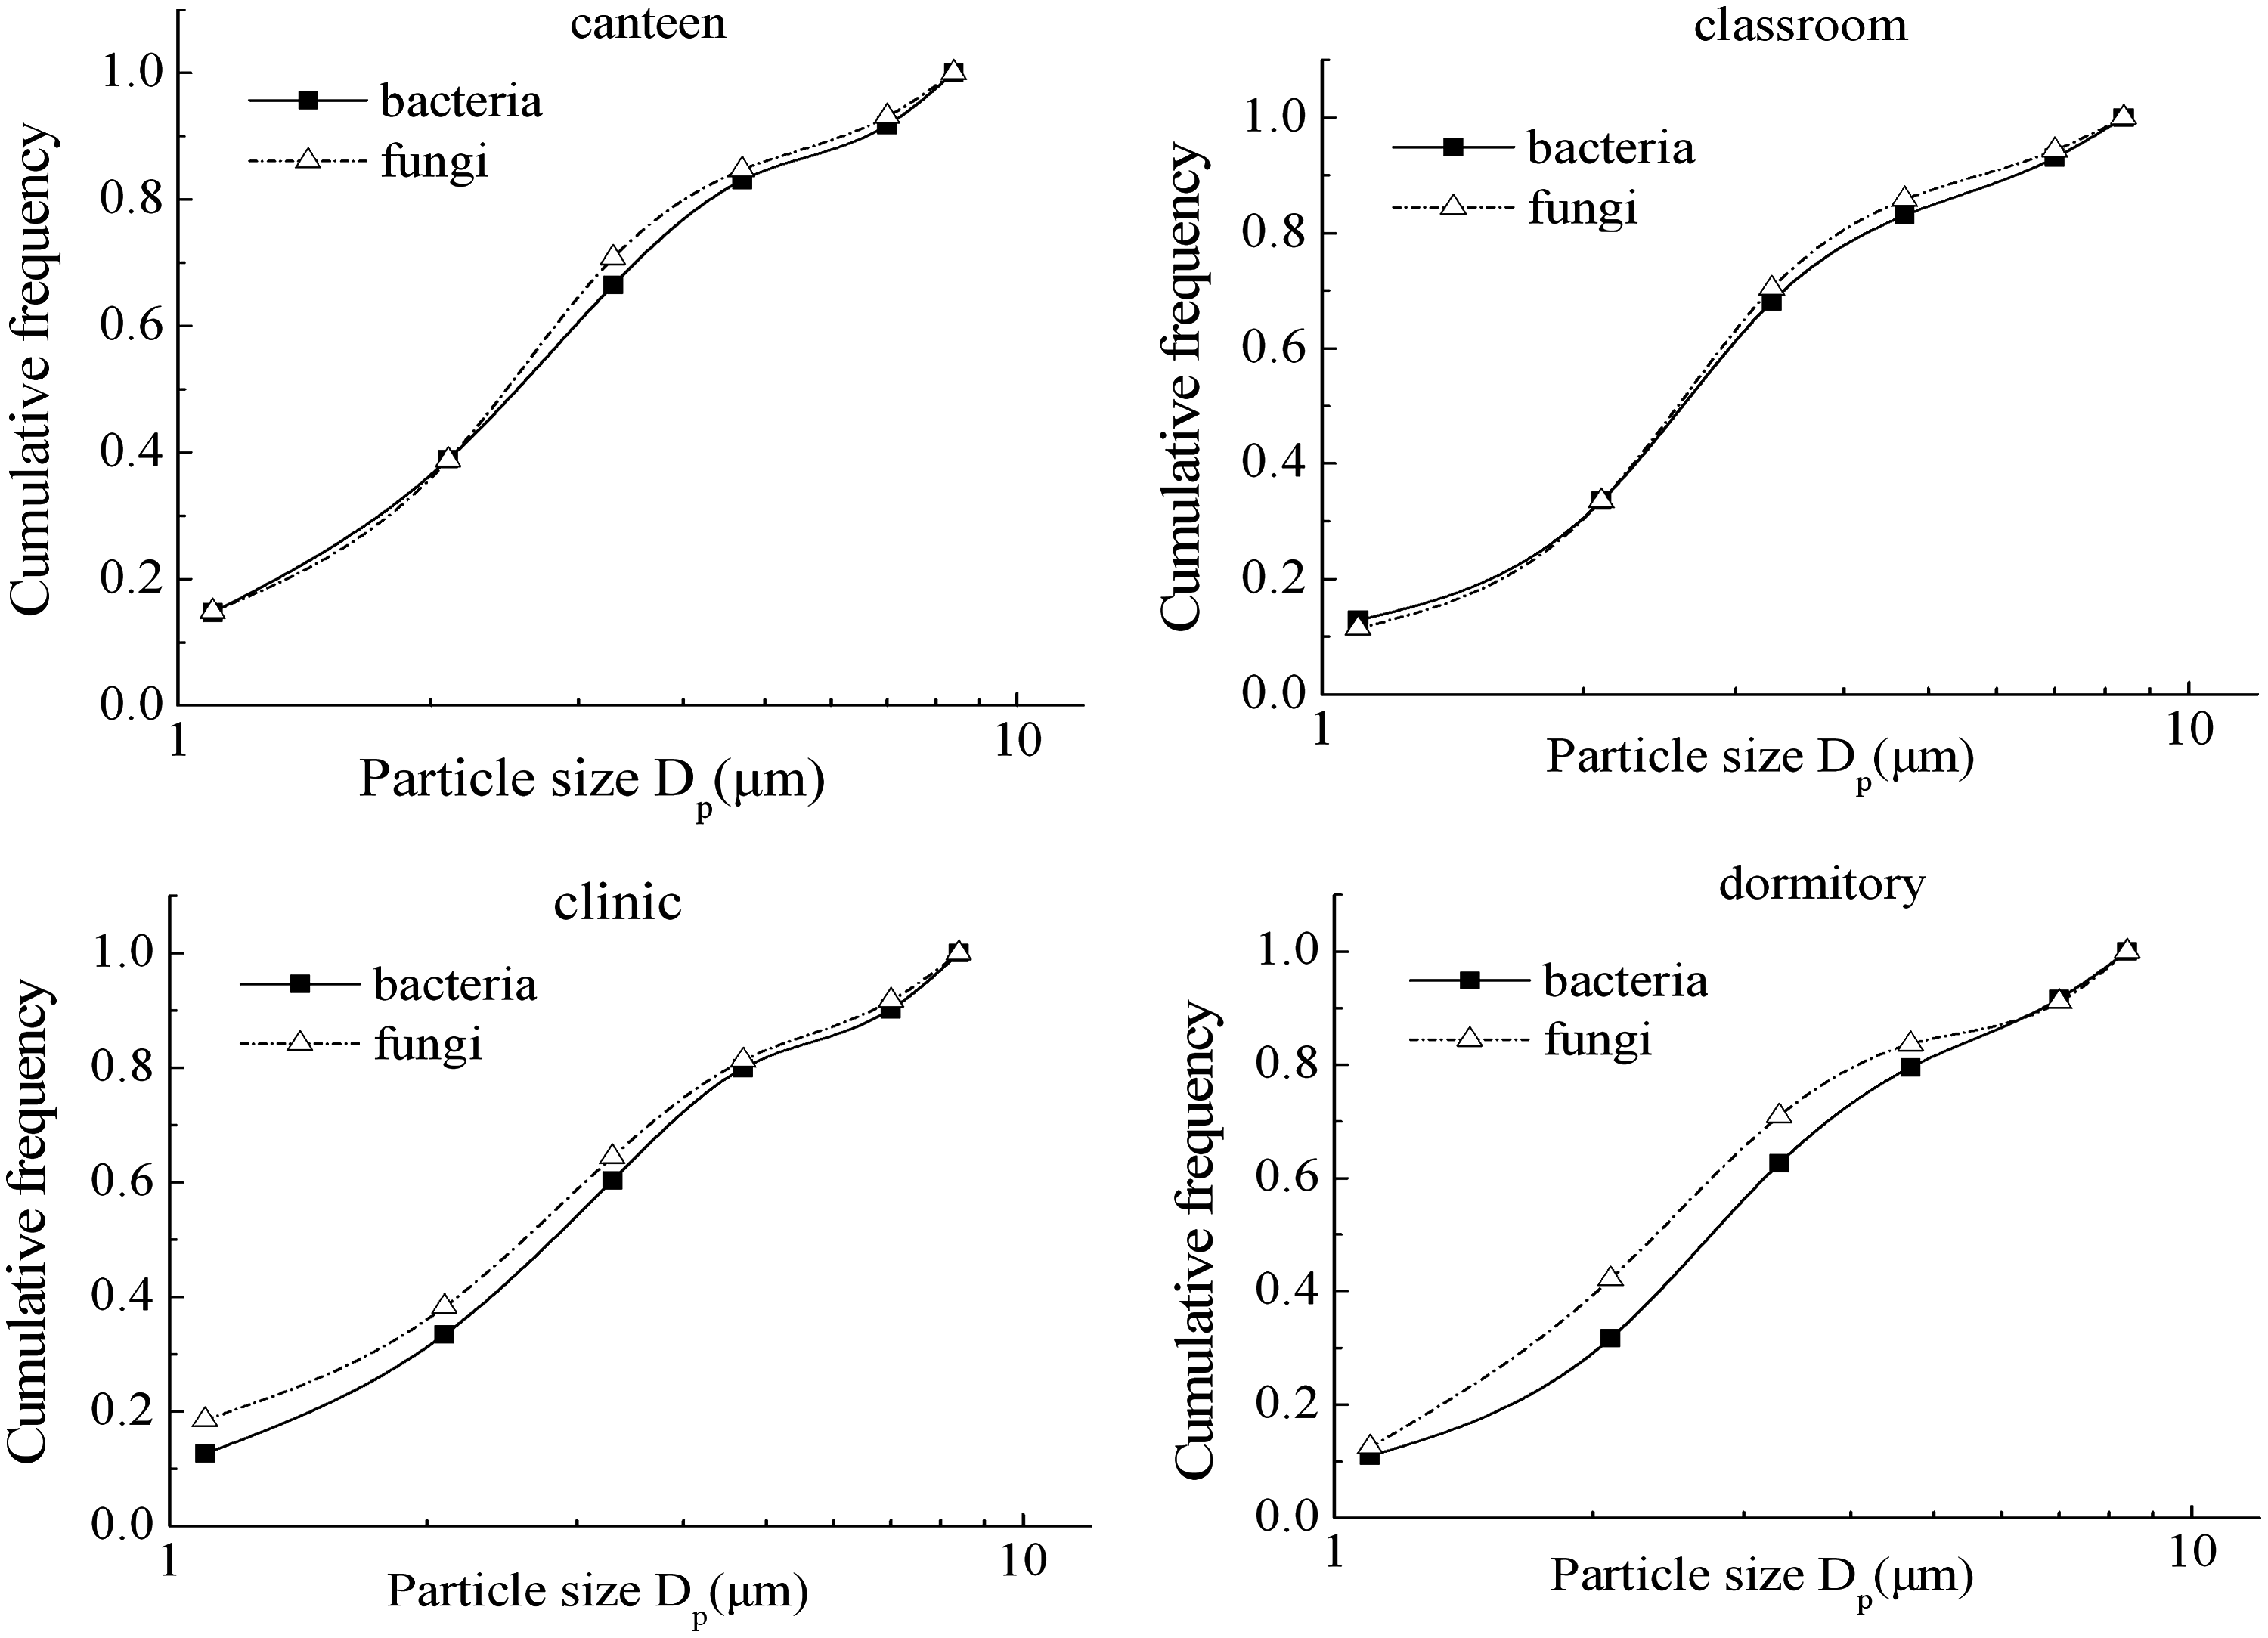
Cumulative size distributions of airborne bacteria and fungi in university indoor environments.
Based on the cumulative size distributions, both NMD and GSD can be also obtained. The NMD and GSD of bacterial concentrations are 2.99±0.12, 2.67±0.19, 2.83±0.09, and 2.77±0.12 μm in the canteen, classrooms, clinic, and dormitories, respectively, while both values of fungal concentrations are 2.83±0.10, 2.51±0.18, 2.76±0.97, and 2.59±0.26 μm, respectively. It is obvious that the NMD of bacteria is larger than that of fungi at each indoor site, which may be attributed to the fact that airborne bacteria primarily exist in clusters or attached to particles. It can be also found that the largest NMD of bacterial and fungal aerosols appear in the canteen, while the smallest value happened in the classrooms. This may due to different spore agglomeration rates affected by indoor activities and various species composition from different sources, which still needs further study in our future work.
The NMD of airborne bacteria and fungi in four indoor environments are all in the size range of 2.1–3.3 μm (stage 4), which is consistent with other reported studies. Reponen (1995), Zuraimi et al. (2009), and Wang et al. (2010a) found that the NMD of airborne fungal spores was in the range 2.1–3.3 μm in moisture-damaged buildings. Conversely, Nasir and Colbeck (2010) reported larger NMD of total bacteria and fungi concentrations (3.3–4.7 μm) in nonmouldy residences. Differences in use and management of room space, mould infestation, and dampness are the most likely explanations for the observed discrepancies.
Conclusions
In this study, it was found that the concentration of airborne bacteria and fungi varied in different indoor environments of Chang'an University in Xi'an, China. The highest mean concentration of both airborne bacteria and fungi was observed in the canteen, followed by the clinic and dormitories, and the lowest found in classrooms. Moreover, the ratio of indoor to outdoor concentration of airborne bacteria and fungi was greater than 1 in most indoor environments except for classrooms, implying that the indoor air might be contaminated with bioaerosols. It was also found that although mean concentrations of airborne bacteria and fungi in investigated university rooms did not exceed the threshold limit value of China, they were higher than those detected in indoor environments of western universities and most guideline values proposed by some organizations all over the world.
Within the same room, the concentrations of both culturable bacteria and fungi also varied with seasons. In all four indoor sites, there were higher fungal concentrations in autumn and winter than in spring and summer. In contrast, there were not similar seasonal variations of airborne bacteria in various indoor environments. The environmental parameters investigated here are found to have different effects on bioaerosols in various indoor environments. Indoor temperature showed more significant correlation with bioaerosols than RH in all indoor environments.
In addition, it was found that the size distribution of airborne bacteria and fungi varied in different indoor environments investigated in this study. The highest number of culturable bacteria were observed in a size range of 3.3–4.7 μm in classrooms and dormitories, while the size ranges 3.3–4.7 and 7 μm and above dominated in the canteen and clinic. For culturable fungi, stage 1 (7 μm and above) and stage 3 (3.3–4.7 μm) dominated in the clinic and canteen, respectively, while stage 2 (4.7–7 μm) and stage 3 (3.3–4.7 μm) dominated in dormitories, and stage 3 had a major share in classrooms. Another finding was that about more than 75% bacterial and fungal aerosols in university indoor environments were in the respirable size range (less than 4.7 μm). The observed differences in concentration and size distribution of bacterial and fungal aerosols in various university rooms reflect not only the differences in sources of bioaerosols but also the differences in influence factors such as occupant density and lifestyle, room conditions, and environmental parameters.
It is worth noting that the number of microorganisms in bioaerosols reported in this study is only for culturable ones on selective media, probably accounting for <0.1% of the total microorganisms in each site. Although this could lead to an underestimation of the total concentration, it can be expected from the present results of large I/O ratio and high respirable fraction of bioaerosols that the indoor environments in Chinese universities could not be safe. Moreover, the results derived from this study are useful for providing valuable information on exposure assessment in university indoor environments and future determination of Chinese official standard in indoor air quality although this field study is only carried out in one university in Xi'an and does not consider the specific characteristics of hazardous factors of airborne microorganism as well as characteristics of different species.
Footnotes
Acknowledgments
The authors would like to thank the National Natural Science Foundation of China (41230314, 51208059) and the Special Fund for Basic Scientific Research of Central Colleges, Chang'an University (2013G2291013).
Author Disclosure Statement
No competing financial interests exist.