
Abstract
Abstract
Dissolved organic matter (DOM) is found in most natural waters at concentrations low enough to make DOM isolation methodologies critical to full analytical characterization and preservation. During the last few decades, two major protocols have been developed for the extraction of DOM isolates from natural waters. These methods utilize XAD resins and reverse osmosis (RO). In this work, the hydrophobic acid (May 2012 HPOA) and transphilic acid (May 2012 TPIA) isolates from XAD-8 and XAD-4 resins, respectively, were compared with the RO (May 2012 RO) natural organic matter isolate of the Suwannee River water using 13C nuclear magnetic resonance (NMR) and electron paramagnetic resonance (EPR) spectroscopies. 13C NMR analysis showed that the May 2012 RO isolate could be viewed as a hybrid of the more hydrophobic May 2012 HPOA isolate and more hydrophilic May 2012 TPIA isolate. The May 2012 HPOA isolate is shown to be higher in alkyl and aromatic moieties, while the May 2012 TPIA isolate is higher in O-alkyl moieties. EPR analysis revealed that the May 2012 TPIA and, in particular, May 2012 HPOA isolates had higher radical concentrations than the May 2012 RO isolate. It is postulated that some of the radical concentrations came from the use of base during the isolation procedures, especially in the XAD method.
Introduction
N
Chemical composition of DOM is variable depending on source materials as well as biochemistry; thus, DOMs isolated from different sites across the globe are not equivalent. Even DOM isolated from the same location but at different times may be very different (Bianchi et al., 2004; Duan et al., 2007). Consequently, studies based on DOM isolated from different locations are difficult to compare directly. This means that there is a need for a standard (or reference) material that is available to the research community so that different studies can be compared. The International Humic Substance Society (IHSS) has been providing such references for decades. Some of the most studied, if not the most studied, of the IHSS standards are the Suwannee River humic acid (XAD isolate), fulvic acids (XAD isolate), and reverse osmosis (RO) isolates. However, because the IHSS Suwannee River humic and fulvic acid versus RO samples were isolated at different times, the physicochemical properties of these different samples cannot be directly compared.
The purpose of this work was to compare the XAD (XAD-8; HPOA and XAD-4; TPIA) and RO isolates of the same source water, in this case the Suwannee River, collected in May 2012. This study compares the carbon speciation and radical content of the different isolates by solid-state cross-polarization magic angle spinning 13C nuclear magnetic resonance (CP-MAS 13C NMR) and electron paramagnetic resonance (EPR), respectively.
Experimental Protocols
Three DOM isolates [May 2012 HPOA, May 2012 TPIA, and May 2012 RO (2R101N)] investigated here were provided, as a gift, in freeze-dried form by Patricia Maurice, Department of Civil and Environmental Engineering and Earth Sciences, University of Notre Dame. The samples were collected during an IHSS-sponsored sampling trip to the Suwannee River led by E. Michael Perdue [Ball State University; see Green et al. (2014) and Kuhn et al. (2014a, b) for details of sampling and isolation]. The isolates were extracted by two different protocols, namely, using XAD resins (Aiken et al., 1992) and RO (Sun et al., 1995). Two isolates were yielded by the protocol utilizing the XAD resin, namely, (1) the hydrophobic acid (May 2012 HPOA) isolate, which was eluted from the XAD-8 resin with base, and (2) the transphilic acid (May 2012 TPIA) isolate, which was eluted from the XAD-4 resin with base. The HPOA isolate contains both fulvic and humic acids, as defined by the IHSS. In terms of carbon recovery and distribution, the products of the XAD isolation yield the following distribution of isolates: 60% HPOA and 15% TPIA, with hydrophilic acids, hydrophobic organic neutrals, as well as transphilic and hydrophilic neutrals accounting for the remaining 25% (Kuhn et al., 2014a, b). The RO protocol yielded one isolate [May 2012 RO (2R101N)], with an overall 84.2% recovery of available carbon, designated by IHSS catalog number 2R101N, and referred to throughout this article as the May 2012 RO isolate. A summary of the elemental composition, metal content, and ash content of these samples is provided in Table 1 (Kuhn et al., 2014a, b).
Data from Kuhn et al. (2014a).
NMR analysis
Solid-state 13C NMR spectra were collected using a Bruker Avance 400 MHz spectrometer, utilizing a ramp-amplitude, cross-polarization pulse sequence along with magic angle spinning. The following conditions were used: a contact time between the proton and carbon pools was 2 ms, the delay between scans was 1 s to allow for relaxation, and the sample was spun at 14 kHz in order to reduce possible spinning band effects (Mao and Schmidt-Rohr, 2004). Approximately 100 mg of each isolate was packed into a 4-mm rotor. Samples were packed in several 5–10 mg portions by applying a good amount of downward pressure using a specialized tool with an outer diameter of just under 4 mm so as to tightly fit into the rotor. The rotor was filled up to the height that allowed for a tight fitting of the rotor cap. Care was taken so as not to damage the specialized cap's blades (turbines), which are used to spin the rotor at the speed of 14 kHz. To monitor the spinning speed by the sensing device (built into the probe), one half of the rotor's bottom edge was then clearly marked with a continuous black line with a marker, while the other half was left unmarked, and hence, remained light (slightly off white—the inherent color of the zirconia rotor material). The rotor cap blades were then once again confirmed to be both clean and undamaged. The sample was then lowered into the NMR MAS probe, and spun up in stages (5, 8, 10, 12, and finally 14 kHz; the rotor was allowed to spin for ∼2 min at each spinning speed). This approach allows for better spin speed stability, limiting the possibility of rotor explosion, which can be highly damaging to the probe and will certainly result in a sample loss. As the sample is spun up in stages, it continues to improve the packing of the rotor by pressing the sample against the walls of the rotor, and hence, creating a small empty cylindrical space in the middle of the rotor. If at any point during sample spin up there is an instability in the spinning (spinning speeds fluctuating up and down), then the rotor should be removed and checked for any cap blade damage and to ensure that the continuous black mark is close to half of the bottom edge of the rotor. Cap replacement or a remarking of the rotor with a black marker is the most typical easy fix. Otherwise, the rotor needs to be repacked.
The NMR spectral window was subdivided into the following chemical shift regions: 0–60 ppm alkyl (∼20 ppm for methyl groups of alkyl chains, ∼30 ppm for methylene, ∼45 ppm for methine, and ∼54 ppm for methoxyl), 60–90 ppm for O-alkyl (∼72 ppm with 20 ppm spread for C2–C6 carbons of cellulose, hemi-cellulose, and similar polymeric carbohydrate structures), 90–110 ppm for di-O-alkyl (anomeric carbons in carbohydrates; can also be associated with C2 carbons in guaiacyl and syringyl lignin structures as well as the C6 carbon in syringyl), 110–160 ppm for aromatic (110–137 ppm C-C and C-H; 137–160 ppm C-O and C-N), 160–190 ppm for carbonyl/amide, and 190–220 nm for ketonic carbons (Almendros et al., 2000; Keeler et al., 2006; Kögel-Knabner, 1997; Lattao et al., 2008; Lorenz et al., 2000; Thorn et al., 1989, 1992; Thorn, 1994; Thorn and Cox, 2009). Glycine was used as a reference for the chemical shift.
EPR analysis
Samples were analyzed, in the solid state, for the presence of radicals without any prior modifications. Fifty milligrams of each sample was placed into a 4-mm internal diameter, Suprasil EPR tube. The EPR data were acquired at room temperature using a Bruker model EMX 10/2.7 spectrometer under the following instrumental conditions: microwave frequency of 9.67 GHz, microwave power of 2 mW, center field at 3,452 G, sweep width of 150 G, resolution of 2,048 points, receiver gain of 1×10⁴, modulation frequency of 100 kHz, time constants of 1.28 ms, and sweep time of 41.94 s. Five scans were acquired for each spectrum.
A fresh 2,2-diphenyl-1-picrylhydrazyl (DPPH) standard was used to calibrate both the field position and radical concentration. Radical concentrations in terms of spins per gram were calculated based on the integrated area of the appropriate isolate EPR signal in comparison to the integrated area of the DPPH standard.
Results and Discussion
Two different resonance methods utilizing magnetic fields to induce population difference were used in this study, namely, NMR (13C solid-state cross-polarization technique) and EPR.
NMR analysis
Solid-state 13C NMR results for the three different Suwannee River organic matter samples are shown in Fig. 1, with the corresponding integration data being presented in Table 2. Table 2 also includes data for a number of IHSS isolates (www.humicsubstances.org/thornnmr.html, last visited on September 13, 2014). To reduce possible confusion, the following labeling will be used: (1) the current samples, that is, samples new to this study, will be respectively referred to as May 2012 HPOA, May 2012 TPIA, and May 2012 RO (designated as 2R101N on the IHSS Web site); (2) the IHSS HA (1S101H) and FA (1S101F) collected in 1982–1983 and the calculated HPOA will be referred to as HA 1S101H, FA 1S101F, and HPOA 1S101C, respectively; (3) the IHSS RO (1R101N) collected in 1999 will be referred to as RO 1R101N; and (4) the IHSS HA (2S101H) and FA (2S101F) collected in 2003 and the calculated HPOA will be referred to as HA 2S101H, FA 2S101F, and HPOA 2S101C, respectively. Note that all efforts have been made to make this labeling scheme as consistent with the IHSS labeling as possible.
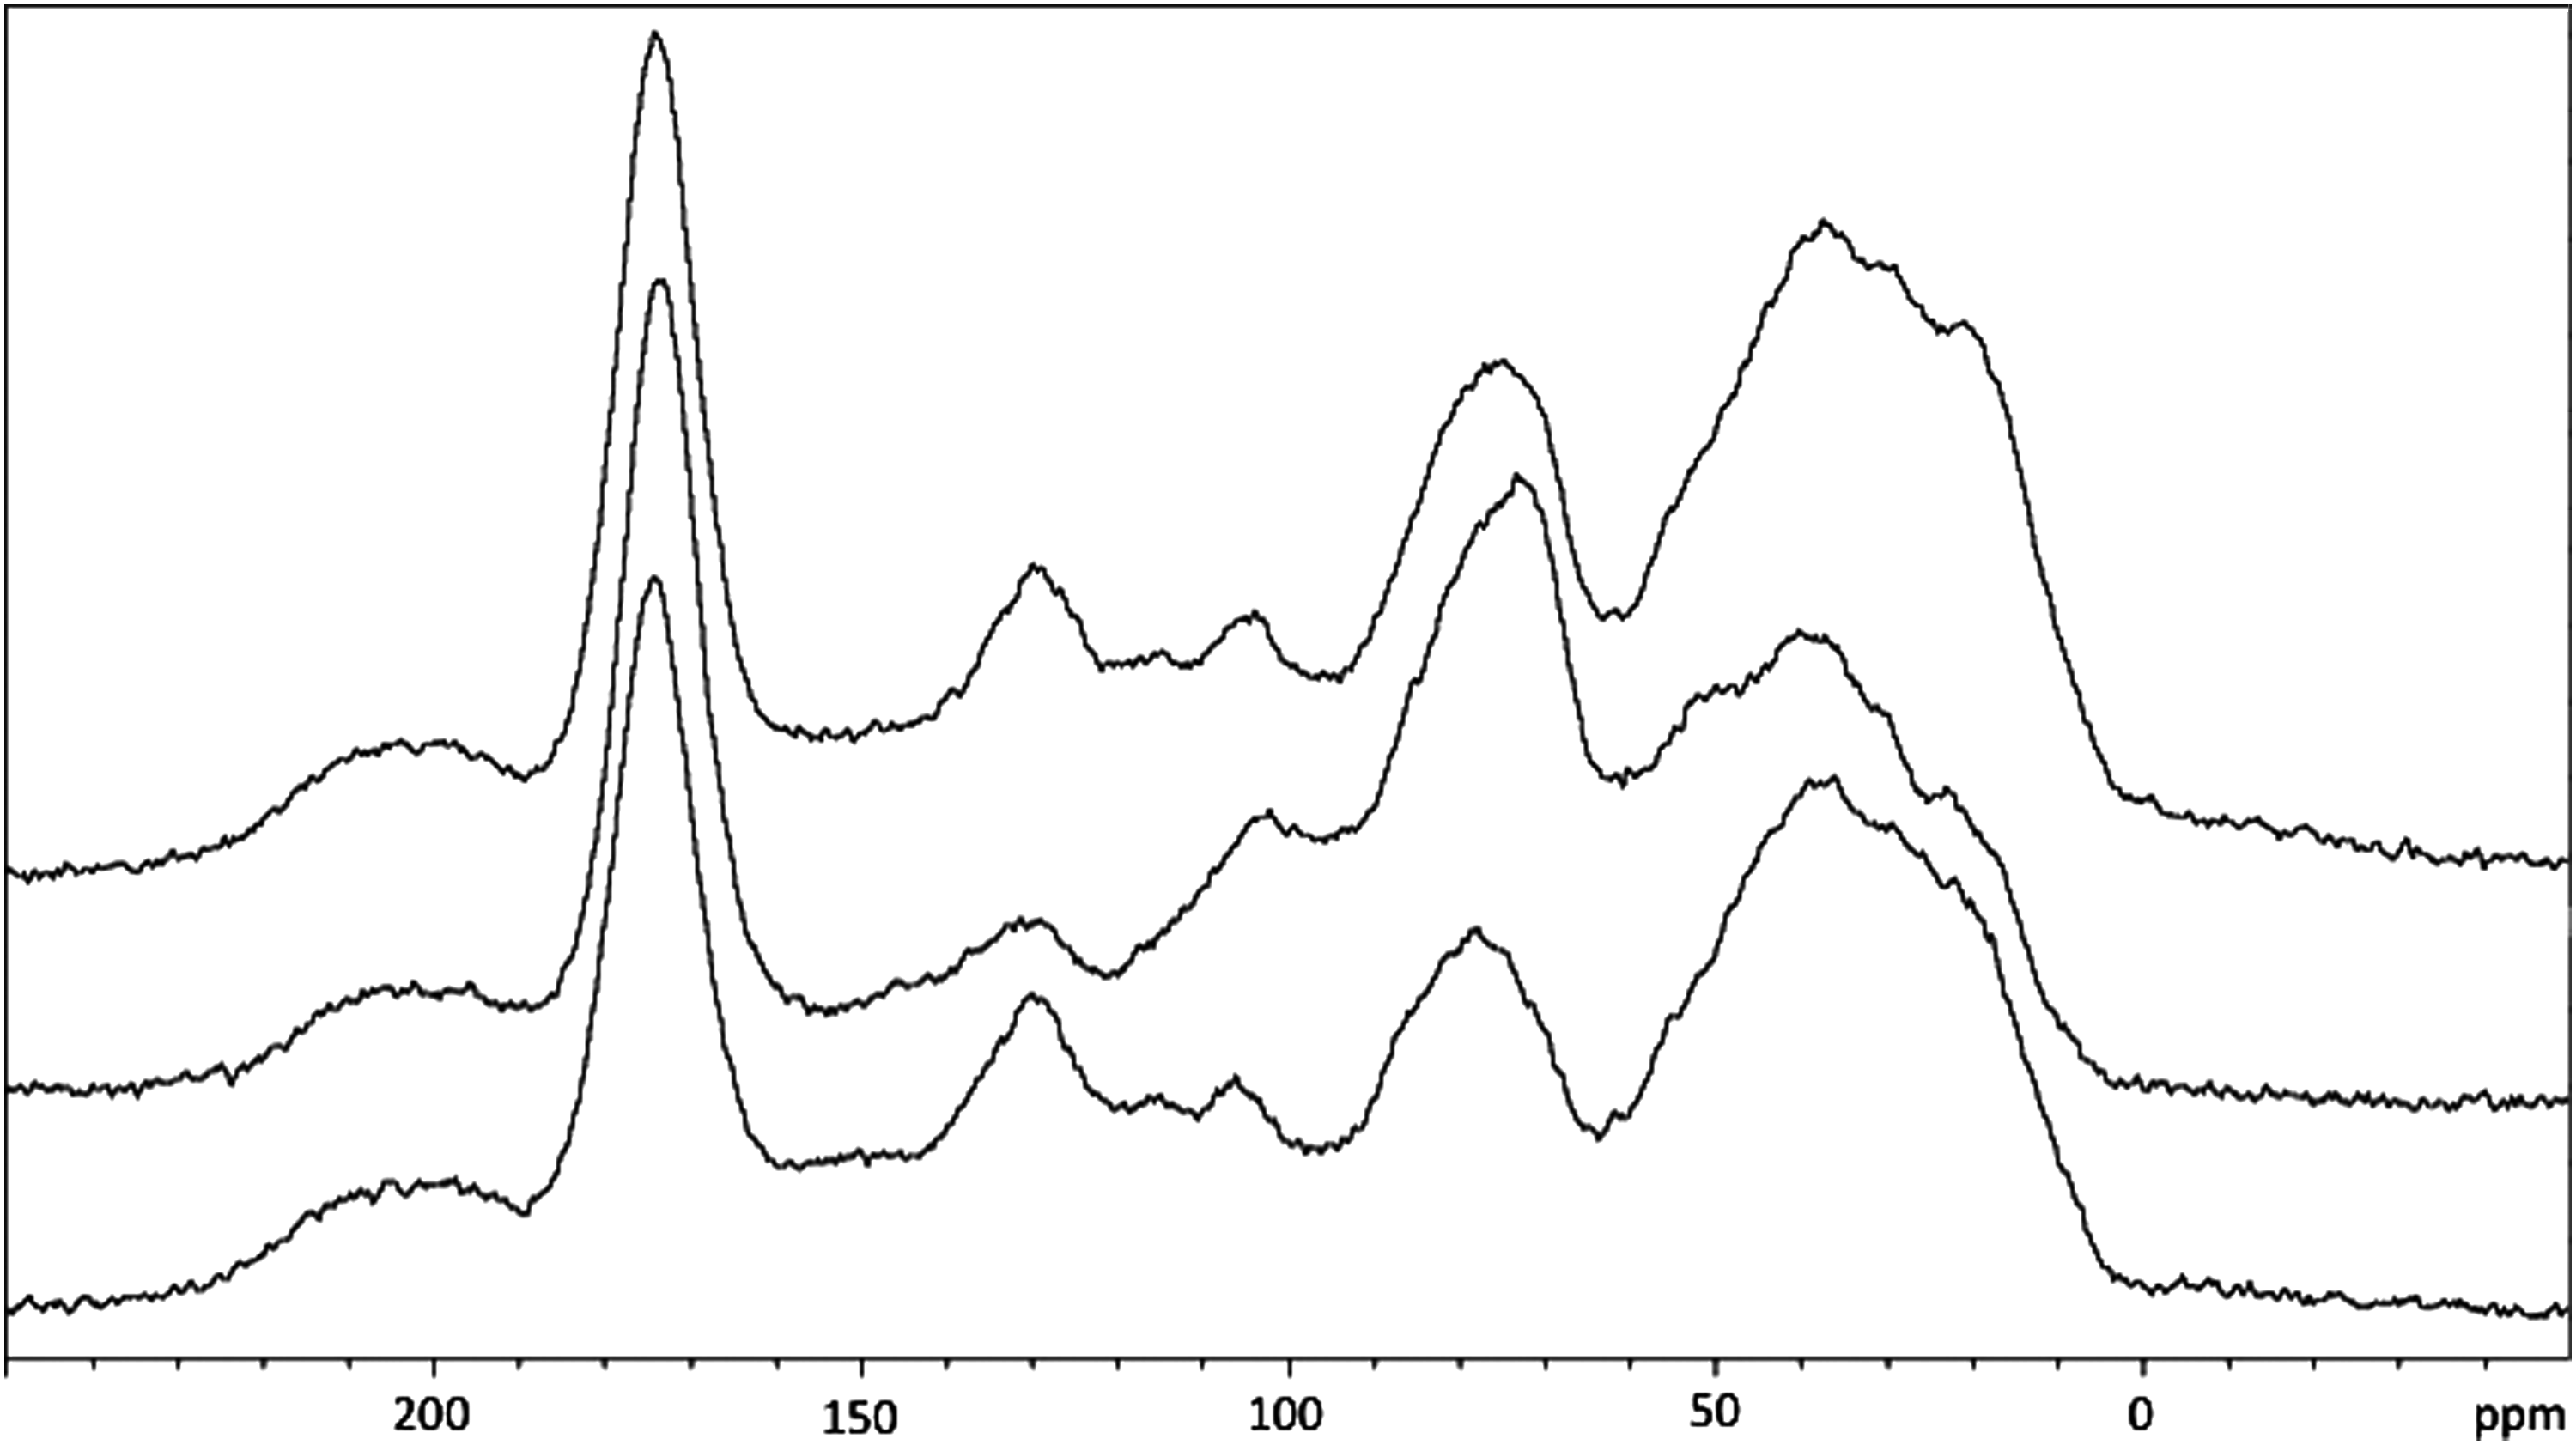
13C Ramp cross-polarization magic angle spinning nuclear magnetic resonance spectra of the May 2012 HPOA, May 2012 TPIA, and May 2012 RO isolates, from bottom to top, obtained with 40,960 scans.
Calculated as follows: (X×0.80)+(Y×0.20), where X and Y are the appropriate values for the May 2012 HPOA and TPIA isolates, respectively.
Calculated as follows: (X×0.87)+(Y×0.13), where X and Y are the appropriate values for the FA 1S101F and HA 1S101H isolates, respectively.
Calculated as follows: (X×0.71)+(Y×0.29), where X and Y are the appropriate values for the FA 2S101F and HA 2S101H isolates, respectively.
www.humicsubstances.org/thornnmr.html (in some cases, the percentage sums to 101%), last accessed September 13, 2014.
The Suwannee-River-standard fulvic and humic acids reported on the IHSS Web site for both the 1982–1983 and 2003 collections were derived from the HPOA isolate. By combining the data for the HA and FA isolates reported on the IHSS Web site [i.e., mathematically weighing them in terms of a fraction (the percentage they accounted for in the initial HPOA sample) of the XAD-8 (HPOA) isolate from which they were derived], it is possible to compare the IHSS XAD-8 data (1S101H and 1S101F as well as 2S101H and 2S101F) with those reported here (May 2012 HPOA). This has been done and the data are reported in Table 2, as HPOA 1S101C and HPOA 2S101C. The exact formulae used are reported in the footnotes of Table 2. The same approach was used to calculate an RO sample from the May 2012 HPOA and May 2012 TPIA NMR data, which will be referred to as May 2012 Calc. RO.
Integration data
Integration data reveal that the May 2012 TPIA isolate is higher in O-alkyl content and lower in aromatic and alkyl contents than the May 2012 HPOA isolate. In terms of carbonyl content, the May 2012 HPOA and May 2012 TPIA isolates are very similar, as is the case for ketonic and anomeric carbon contents. The May 2012 RO isolate is between the May 2012 HPOA and May 2012 TPIA fractions in terms of aromatic and O-alkyl contents. Compared with the May 2012 TPIA and May 2012 HPOA isolates, the May 2012 RO isolate is higher in alkyl content and essentially equivalent in terms of carbonyl, anomeric carbon, and ketonic contents. If the May 2012 HPOA and May 2012 RO isolates were equivalent to the IHSS commercially available humic acids (HA 1S101H and HA 2S101H) and fulvic acid (FA 1S101F and FA 2S101F) combined (HPOA 1S101C and HPOA 2S101C) and RO 1R101N Suwannee River isolates, respectively, then the results presented here could be compared with the available liquid-state 13C NMR data of previous Suwannee River samples. However, due to differences between the solid- and liquid-state NMR techniques used, only very rough comparisons are possible. We will go forward with this comparison but, due to these points, only grosso modo differences will be discussed.
Carbon-13 NMR results show that the HPOA 1S101C and HPOA 2S101C isolates and the May 2012 HPOA isolate, from this study, appear to be nearly identical (±3%) in terms of carbon speciation (Table 1), except for the aromatic, O-alkyl, and alkyl regions. In fact, the carbon distribution data for the HPOA 1S101C and HPOA 2S101C isolates and the May 2012 HPOA isolate are within ±5%, except for the aromatic region. This closeness of the results provides some confidence when comparing the liquid 13C NMR data for the isolates reported on the IHSS Web site and in Thorn and Cox (2009) to the solid-state 13C NMR data reported here, especially in the grosso modo fashion, as will be done here.
As the isolates reported on the IHSS Web site (www.humicsubstances.org/thornnmr.html, last visited on September 13, 2014), in Thorn and Cox (2009), and here were isolated in essentially the same manner, a direct comparison is possible, especially for the RO isolates (May 2012 RO and RO 1R101N) and TPIA [May 2012 TPIA and Thorn and Cox TPIA (from May 1995 sampling)] isolates. In terms of the carbon speciation, it was found that May 2012 RO isolate reported here is lower in the aromatic but higher in the aliphatic carbon content than that for the RO 1R101N isolate. Turning to the TPIA isolates, it can be seen once again that the isolate reported in Thorn and Cox (2009) (Thorn and Cox TPIA) and the May 2012 TPIA isolate yielded similar carbon distributions. However, once again, the aromatic content is lower while the aliphatic content is higher for the more recently isolated sample (May 2012 TPIA). In addition, it can be seen that the more recent isolate has a higher O-alkyl content. If one compares the HPOA 1S101C, HPOA 2S101C, and May 2012 HPOA data, then the same trends to those discussed earlier hold, whereby, with time, there is a decrease in aromatic content and an increase in alkyl content. The biggest change is seen between the HPOA 1S101C and the May 2012 HPOA data. Also, as with the TPIA isolates, there is an increase in O-alkyl content with time, as illustrated by HPOA 1S101C and HPOA 2S101C. Finally HPOA 2S101C and May 2012 HPOA have essentially the same O-alkyl content.
On aggregate, the NMR data show chemical change, especially in terms of its aliphatic and aromatic nature, among Suwannee River samples collected at different times. This intriguing observation may be worthy of a future systematic and rather ambitious investigation that, ideally, utilizes the same isolation method and identical NMR techniques in order to fully determine whether there is a temporal trend. Changes in inputs—mainly due to changes in flow patterns between samplings (breaking of dams and stills) leading to differential aerobic conditions, climate change, and human activities—offer other possible explanations for the observations (Fang et al., 2005; Freeman et al., 2004; Green et al., 2014; Larsen et al., 2011; Stanley et al., 2012; Zang et al., 2010).
A more realistic approach involves comparison of the data collected on the studied samples with those obtained for samples isolated and analyzed in the same manner, preferably in the same laboratory. Accordingly, the data presented here were compared with those reported by Lattao et al. (2008) on two HPOA and TPIA isolates isolated from two water bodies in Southern Louisiana. Overall, this comparison reveals that Suwannee River samples have higher aliphatic, lower carbohydrate, lower aromatic, and almost equivalent carbonyl carbon contents. However, none of these differences are very large (all fit within 10% of each other), which indicates, as does the discussion that comes later, that Suwannee River RO isolates are good representative samples for aquatic riverine NOM.
Spectral data
Integration of regions on an NMR spectrum can provide useful information, especially for complex heterogeneous samples, such as DOM isolates. Figure 1 consists of the 13C ramp-CP-MAS NMR spectra for the three Suwannee River isolates under consideration in this work. These spectra are characterized by the six regions reported in Table 2. In the following headings, differences in the spectra are summarized by region, in which the reported ppm shift ranges should all be viewed only as approximate.
Alkyl (0–60 ppm) region
All three isolates (May 2012 HPOA, May 2012 TPIA, and May 2012 RO) consist of a broad peak between 5 and 55 ppm, with underlying peaks. These underlying peaks are most apparent in the May 2012 TPIA isolate. Closer inspection reveals four different peaks centered at approximately 20, 30, 40, and 53 ppm. These locations are only approximate due to peak overlap; however, based on previous work on HA 1S101H, HA 2S101H, FA 1S101F, and FA 2S101F (IHSS; Thorn, 1994; Thorn and Cox, 2009) and other organic matter isolates (Lattao et al., 2008), the carbon speciation of these peaks can be assigned to the following carbon types: methyl, methylene, methine, and methoxy (an O-alkyl originating from lignin parent materials), respectively. The RO isolate's spectrum has clear methyl, methylene, and methine peaks, while the methoxy peak is apparent as a weak shoulder. The May 2012 HPOA isolate displays weak methyl and methylene peaks and a weak methoxy shoulder. The spectrum for the May 2012 RO isolate is a combination of the May 2012 HPOA and May 2012 TPIA isolates.
O-alkyl (60–90 ppm) region
For all three isolates (May 2012 HPOA, May 2012 TPIA, and May 2012 RO), this region consists of a well-defined peak centered at 70 ppm with a spread of 20 ppm. This region's signature is assignable to the C2–C6 carbons of cellulose, hemi-cellulose, and other carbohydrate structures, such as glucose, galactose, mannose, fructose, ribose, and xylose (as listed on the IHSS Web site), as well as ether and noncarbohydrate alcohol carbons. The May 2012 TPIA spectrum also has an underlying peak centered at 80 ppm illustrated by a minor shoulder spanning between 70 and 90 ppm. Once again, the May 2012 RO spectrum appears to be a hybrid of the May 2012 HPOA and May 2012 TPIA spectra.
Di-O-alkyl (90–110 ppm) region
In the May 2012 HPOA and May 2012 RO spectra, this region consists of a well-defined peak centered at 102 ppm. In the May 2012 TPIA spectrum, this feature is a less-defined peak at the same location; however, this entire region is more dominant than in either the May 2012 HPOA or May 2012 RO spectra, which is also consistent with the larger O-alkyl peak in the May 2012 TPIA spectrum. The strength of the di-O-alkyl feature in the May 2012 TPIA isolate means that it significantly overlaps with the O-alkyl features, resulting in the di-O-alkyl peaks being larger but less defined compared with the same feature in either the May 2012 HPOA or the May 2012 RO spectrum.
Aromatic (110–160 ppm) region
Once again, the spectra of the May 2012 HPOA and May 2012 RO isolates are closer to each other than either one is to the May 2012 TPIA isolate spectrum. In the May 2012 HPOA and May 2012 RO spectra it can be seen that this region consists of two distinct peaks centered at 115 and 130 ppm. These peaks can be assigned to protonated and nonprotonated carbons, respectively. The signal assignable to the nonprotonated region is more dominant in the May 2012 HPOA isolate. Neither the May 2012 HPOA nor the May 2012 RO isolate has a distinct signal in the phenolic region (145–160 ppm); however, the May 2012 TPIA isolate has a shoulder in this spectral region.
Carbonyl/amide (160–190 ppm) and ketonic (190–220 ppm) regions
For all three samples, the carbonyl/amide peak is rather tall and featureless. There is a hint of a shoulder at a lower field for both the May 2012 HPOA and May 2012 RO isolates. In regards to the ketonic peak, it is rather broad and featureless; it is less prominent for the May 2012 TPIA isolate than for the May 2012 HPOA or May 2012 RO isolate.
The May 2012 HPOA isolate can be viewed as more hydrophobic than the May 2012 TPIA isolate, as it is the one that is sorbed by the XAD-8 resin, with the May 2012 TPIA isolate remaining in the aqueous phase. The NMR findings are consistent with the May 2012 HPOA isolate being more hydrophobic, as evidenced by its higher content of alkyl and aromatic moieties, and with the May 2012 TPIA isolate being more hydrophilic due to the higher content of O-alkyl moieties.
The 13C NMR spectra in Fig. 1 obtained for DOM isolates discussed in this work are rather broad and featureless compared with the 13C NMR spectra that are typically obtained for simple organic compounds. There are simply too many features to resolve, leading to significant overlap that blurs out the fine details. Multidimensional methods, both in the liquid and solid states, have been shown to resolve this issue with limited success (Cook et al., 2003; Cook, 2004; Lattao et al., 2008). However, the vast majority of the times when 13C NMR is used to analyze DOM, fine details are not needed to obtain quantitative or semiquantitative carbon speciation data. For example, to obtain the data reported in Table 1 on a modern NMR instrumentation using about 100 mg of DOM requires just over one hour of NMR time. Figure 2 shows 13C NMR spectra for the same samples as in Fig. 1, collected under the same conditions, but with one-fifth the number of scans. In terms of time and NMR instrumental costs, these spectra are five times cheaper, with the signal-to-noise ratio decreasing by only a factor of
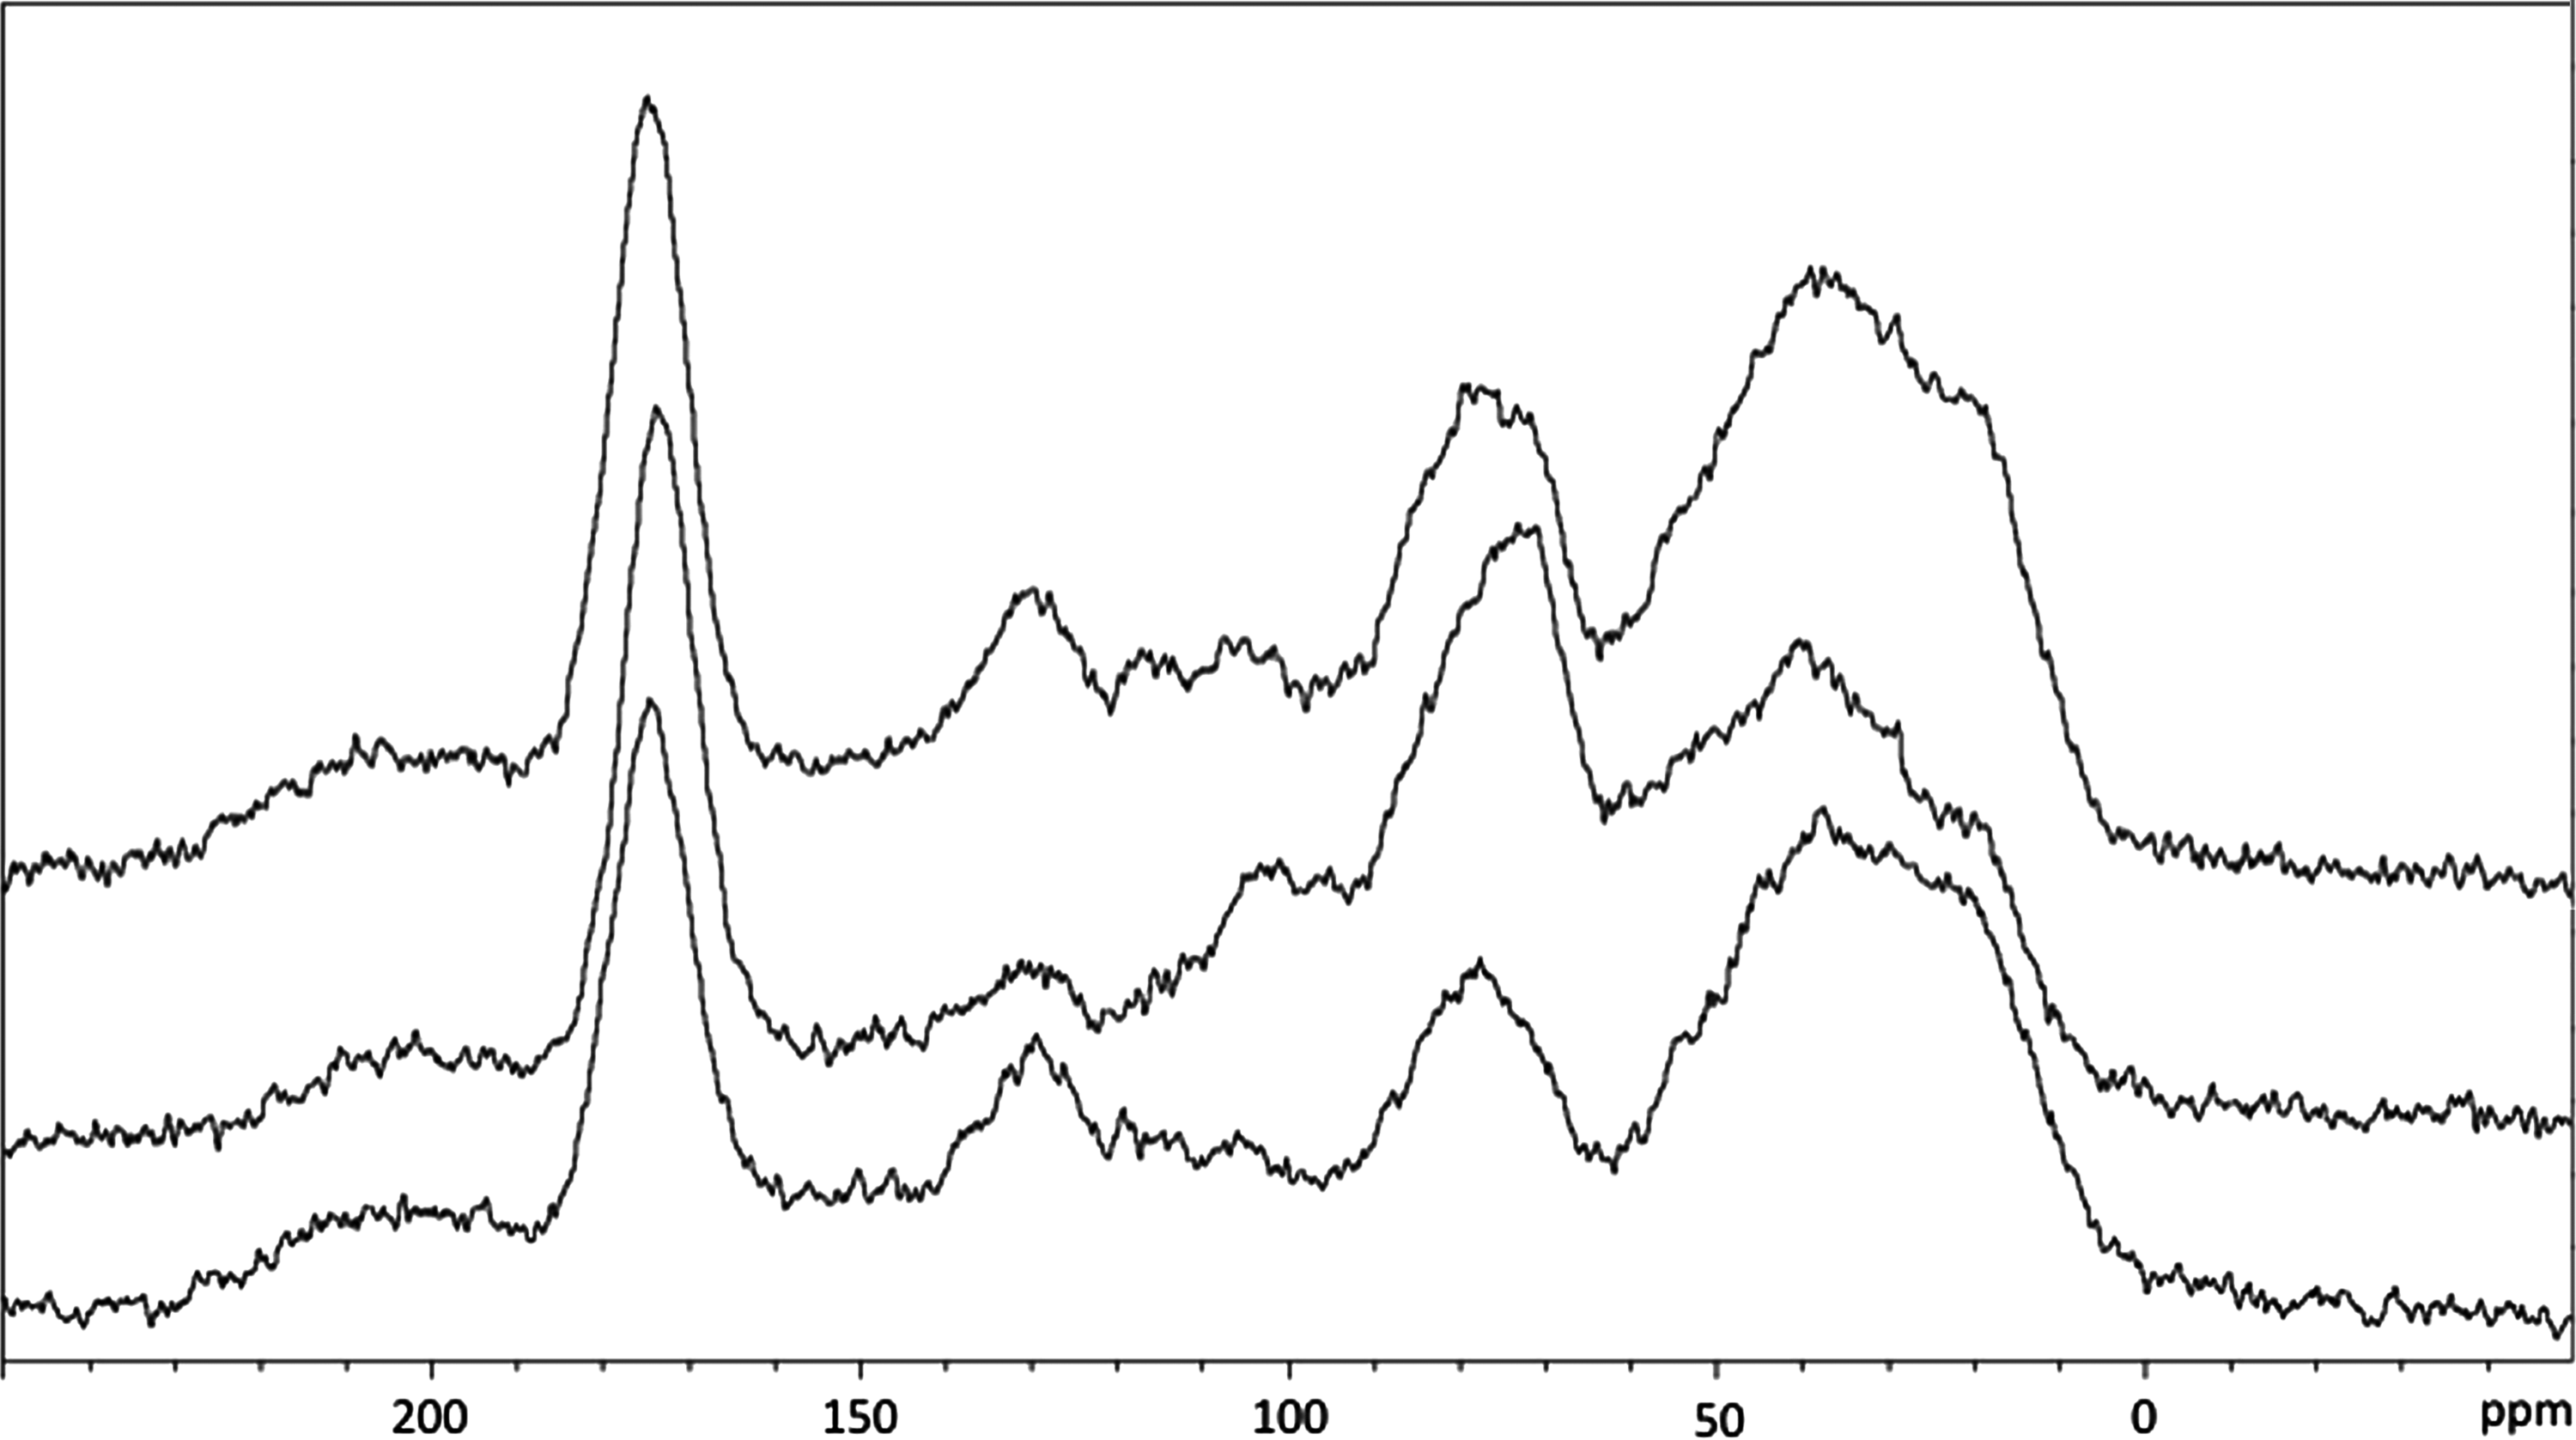
13C Ramp cross-polarization magic angle spinning nuclear magnetic resonance spectra of the May 2012 HPOA, May 2012 TPIA, and May 2012 RO isolates, from bottom to top, obtained with 8,192 scans.
Overall, the just discussed 13C NMR results, including the determination of the structural relationship among the different isolates, are consistent with previously reported data on a range of Suwannee River organic matter isolates (Thorn, 1994; Thorn and Cox, 2009) as well as those for other riverine DOM isolates (Lattao et al., 2008). Once again, this re-enforces the point that the Suwannee River RO isolate is a representative riverine DOM sample.
EPR analysis
EPR data can be broken into three major types, namely, the g-factor, ΔH (peak-to-peak line width), and spins per gram; where the g-factor gives information on the chemical make-up of the radical, ΔH provides information on how homogeneous the radicals are in terms of chemical make-up and local environment (the broader, the less homogeneous), and spins per gram is a quantitative measure of the amount of unpaired electrons (radicals) in a gram of sample.
The g-factor
Due to the chemical make-up of radicals, there is a spread of where unpaired electron signals appear. For the three May 2012 DOM isolates (May 2012 HPOA, May 2012 TPIA, and May 2012 RO) reported on in Table 3, the spread is from 2.0041 (for the May 2012 RO isolate) to 2.0045 (for the May 2012 HPOA isolate) and is near the upper limit of those reported for other humic substances in the literature, which generally range from about 2.0030 to 2.0046 (Ariese et al., 2004; Jezierski et al., 2000; Paul et al., 2006) and higher than those previously reported for Suwannee River HA 1S101H and FA 1S101F, which have g-factors of 1.9994 and 2.0040, respectively (Saleh et al., 1994). The high values for the Suwannee River samples reported here are, however, in line with organic radicals rich in oxygen groups (Jezierski et al., 2000), and are very close to the g-factor of a semiquinone-benzoquinone complex, H2Q/Q (Ariese et al., 2004). All in all, the three isolate radicals appear to be fairly similar in chemical composition.
Calculated as follows: (X×0.80)+(Y×0.20), where X and Y are the appropriate values for the May 2012 HPOA and TPIA isolates, respectively.
N.D., not determined.
ΔH
Due to their complex heterogeneous nature, DOM samples are known to give broad EPR spectra. As can be seen from the data presented in Table 3, the May 2012 TPIA isolate has the most diverse set of radicals, while the May 2012 RO isolate has the least diverse set of radicals, with the May 2012 HPOA isolate being in between. This spread of radicals can also be seen in the EPR spectra, as presented in Fig. 3 (Note that spins per gram cannot be read directly from these spectra due to spread of the width of the signal [ΔH] and the fact that packing efficiencies for the different isolates were variable.).
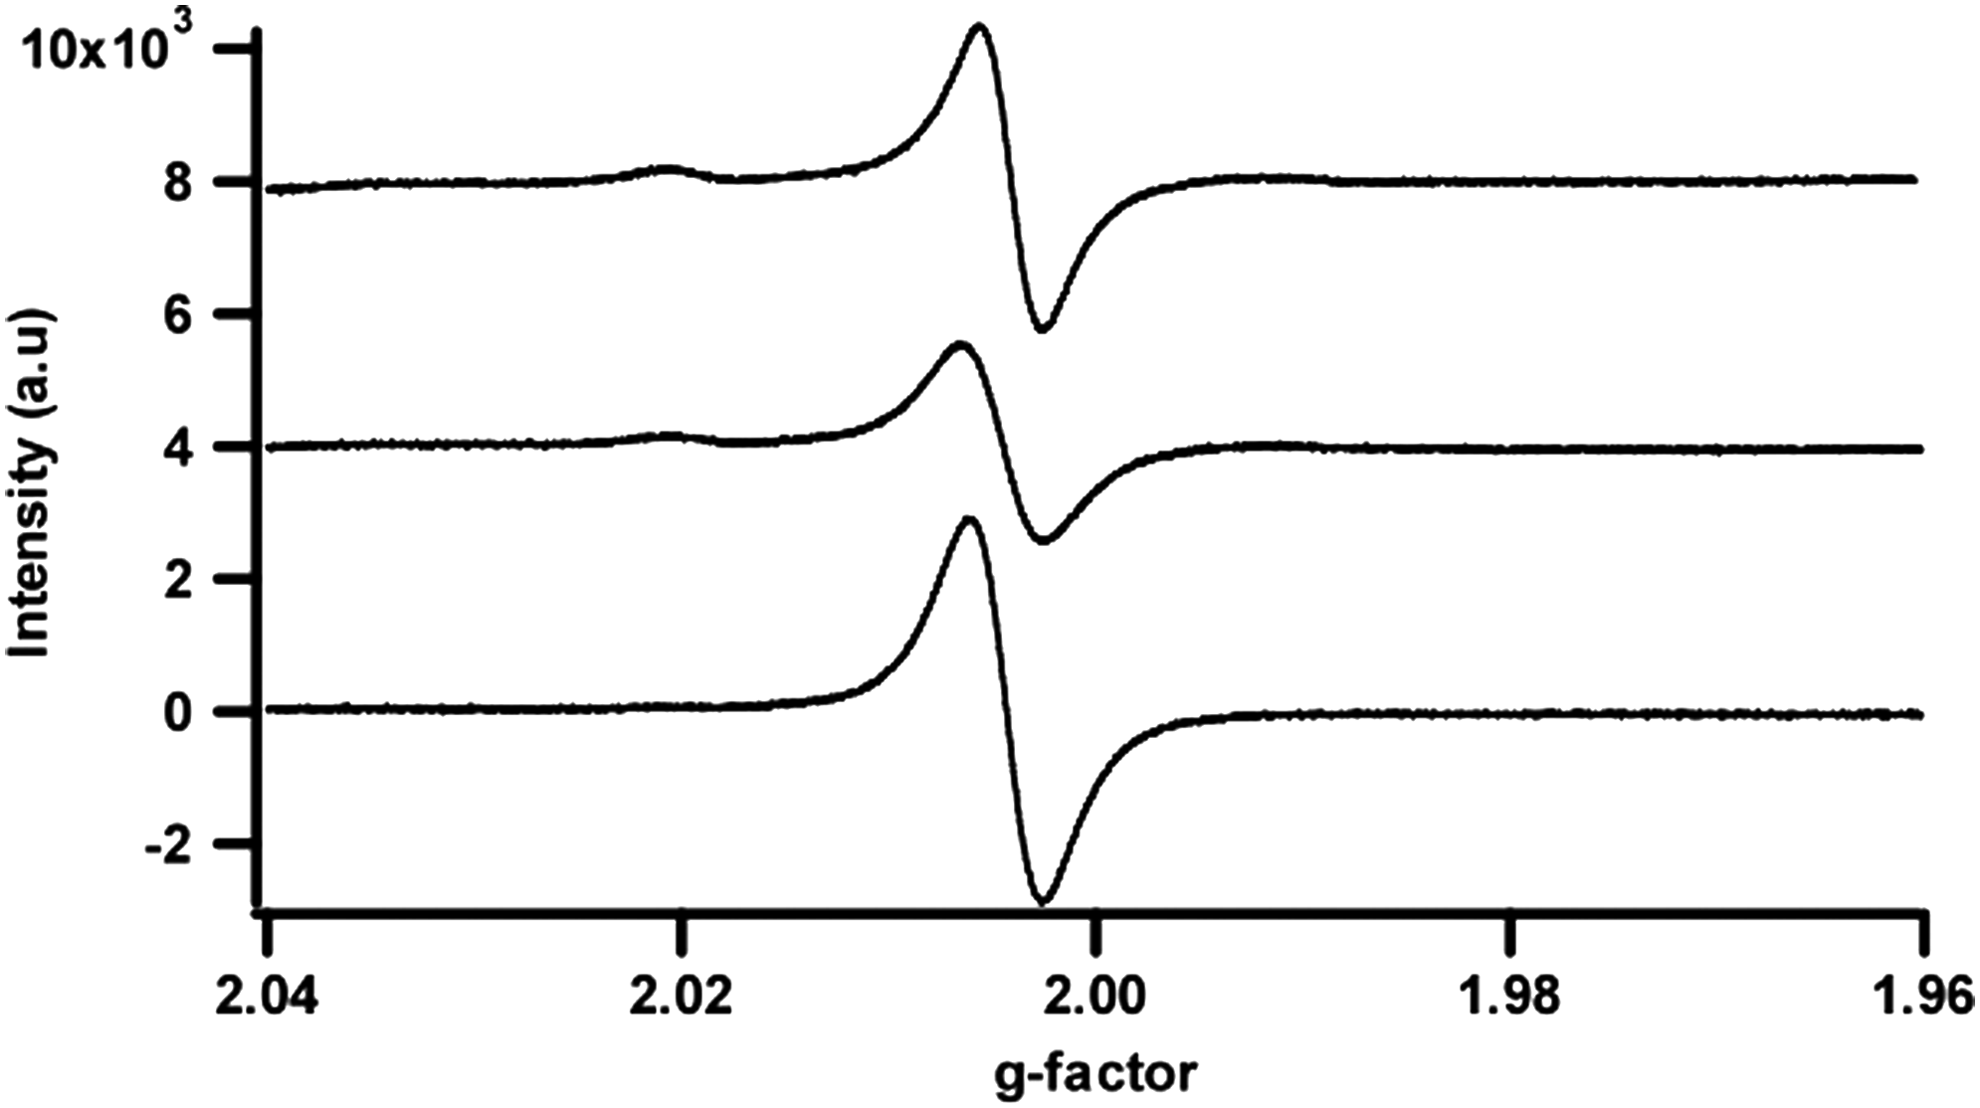
Electron paramagnetic resonance spectra of the May 2012 HPOA, May 2012 TPIA, and May 2012 RO isolates, from bottom to top, obtained with five scans.
Spins per gram
Measurement of spins per gram quantifies the amount of radicals (unpaired electron spins) per gram of sample. Spins per gram values can be viewed as the EPR equivalent to integration in NMR; however, rather than being internally referenced to the sample, an external reference is used. This means that spins per gram is an absolute value rather than a relative value (as is usually the case for NMR integration values, and is the case for the 13C NMR integration values reported here).
Spins per gram values in Table 3 range from 3.59×10¹⁷ (for the May 2012 RO isolate) to 6.38×10¹⁷ (for the May 2012 HPOA isolate), with the May 2012 TPIA isolate having a slightly higher value of 3.93×10¹⁷ than the May 2012 RO isolate. These findings indicate that the May 2012 HPOA isolate has the highest radical concentration and the May 2012 RO isolate the lowest. Generally, NOM samples yield spins per gram on the order of magnitude of 1017 (IHSS; Jezierski et al., 2000; Jerzykiewicz et al., 2002; Paul et al., 2006; Saleh et al., 1994); thus, the data for the isolates reported in this work are in line with these values. While spins per gram is an absolute quantity, there can be variations in the exact number, especially between instruments due to geometrical arrangement, cavity couplings, microwave power, and use of standards. This means that exact comparisons can be often challenging, even more so in case of an addition of base during the isolation procedures as it may induce radicals (Paul et al., 2006) and in the presence of metal ions in the isolates, which may quench the radicals' EPR signal (Giannakopoulos et al., 2006; Jerzykiewicz et al., 2002).
The May 2012 HPOA isolate has 1.6 times more radicals than the May 2012 TPIA isolate. Assuming that the only radicals present are H2Q/Q, then the May 2012 HPOA isolate is more concentrated in H2Q/Q compared with the May 2012 TPIA isolate. This may indicate that (1) the radicals are associated with more hydrophilic moieties; (2) the H2Q/Q radical-forming entities are more exposed in the May 2012 HPOA isolate, and thus, are more prone to radical formation during alkaline conditions used in the isolation of the May 2012 HPOA fraction; or (3) a combination of the first two effects is in play. The concept of exposed radical-forming moieties has been previously put forward to explain the pH dependence of radical formation and the reason behind humic and fulvic acids having different radical concentrations (Paul et al., 2006). From the spins per gram data it could be hypothesized that the more hydrophobic the isolate, the higher its concentration of radicals.
Due to the nature of the isolation method, the May 2012 RO isolate contains fewer radicals than either the May 2012 TPIA or May 2012 HPOA isolate. Since the May 2012 RO isolate is more hydrophilic than the May 2012 HPOA isolate—as shown by 13C NMR data—the aforementioned hypothesis of an isolate's higher hydrophobicity correlating with a higher concentration of radicals appears to be supported. However, the spins per gram data reported by Saleh et al. (1994) for the Suwannee River HA 1S101H and FA 1S101F contradict this notion as it is the FA 1S101F isolate that contains the higher radical concentration even though it is more hydrophilic. This leaves two possible factors: the pH and the metal ion effects.
pH effect
Different pH conditions were used in the HPOA and TPIA isolation procedures compared with that for the RO isolate. This would mean that if the differences seen in the radical concentrations were due to the pH conditions used during the isolation procedures, namely, XAD versus RO, then one would expect to see the largest difference in radical concentrations between the XAD isolates and the RO isolate. This, however, is not the case. In fact, the radical concentration of the May 2012 TPIA and May 2012 RO isolates are very close, when compared the difference in radical concentration between the May 2012 TPIA and May 2012 HPOA isolates. The weighted average of the May 2012 HPOA (80%) and May 2012 TPIA (20%) isolates (to create May 2012 Calc. RO) yields radical concentration of 5.89×10¹⁷ spins per gram. This is a significantly larger than the concentration of radials actually detected in the May 2012 RO isolate sample. A possible explanation for this is that, while sodium hydroxide is used in the RO isolation procedure to wash the membrane filters, this is a less-severe alkaline condition compared with the one used during the XAD isolation procedure, and thus, it should produce fewer radicals. The wider ΔH values for the XAD isolates compared with the RO isolate support this and suggest that the alkaline-formed radicals being different in nature to the native radicals and with a wider range of g-factors. In regards to the XAD isolates, it appears that the May 2012 TPIA isolate radical concentration is chiefly due to the alkaline conditions, resulting in higher g-factor and ΔH values.
Metal ion effect
It has been shown that some metal ions quench radical signals (Giannakopoulos et al., 2006; Jerzykiewicz et al., 2002). The mechanism behind this quenching is thought to be due to antiferromagnetic interactions of the metal ion's d-subshell with the unpaired electrons of the H2Q/Q complex. Based on the data presented in Table 1 from Kuhn et al. (2014a), no trend in dn metal content and radical concentration can be found for the three isolates discussed in this work.
Summary
In rough terms (<50% in any area of comparison), the methods utilizing XAD resins and RO yield DOM isolates with similar carbon speciation distribution. The 13C NMR data reveal that May 2012 RO (2R101N) isolate is a hybrid of the XAD-isolated May 2012 HPOA and May 2012 TPIA isolates, with the May 2012 HPOA isolate being higher in alkyl and aromatic moieties, the May 2012 TPIA isolate being more concentrated in O-alkyl moieties, and the RO isolate being in between in regards to alkyl, O-alkyl, and aromatic moieties. This is somewhat surprising given the difference in how the two different isolation procedures work and the basic principles behind them. In very simple terms, the RO method isolates from the water sample compounds that are unable to cross a membrane, while the XAD-8 and XAD-4 resins, arranged in a series, isolate compounds that are “pulled out” of the water sample. The XAD method uses a large pH swing, from highly acidic (loading step) to highly alkaline (extraction step), while the RO method is gentler in terms of pH. Thus, while surprising, it is reassuring that the two methods yield similar products in terms of carbon speciation.
The XAD isolates (May 2012 HPOA and May 2012 TPIA) have higher radical concentrations than the May 2012 RO isolate, especially the May 2012 HPOA isolate. A possible hypothesis is the alkaline hydrolysis of certain functionalities, resulting in the release of catechol moieties which, in turn, become converted to semiquinone radicals. The difference between the May 2012 TPIA and May 2012 HPOA isolates can be postulated to be due to their hydrophobicity and the exposure of the radical-forming moieties to the alkaline aqueous phase.
The carbon speciation data reveal that the XAD method yields two distinct isolates (HPOA and TPIA) of the DOM within the original sample. Model experiments may be designed to understand how differences between these isolates influence the behavior of DOM samples. The RO isolate, on the other hand, appears to offer a more comprehensive representation of the DOM than either of the XAD isolates and is preferred when one wants to investigate the behavior of the DOM as a whole for a site. With different isolation techniques yielding samples useful for different experimental designs, it is up the experimentalist to determine which isolate best fits the experiment being carried out.
Footnotes
Acknowledgments
Support for this research was provided by the National Institute of Environmental Health Sciences Superfund Research Program for Louisiana State University through grant 2P42ES013648-03. In addition, this material is based upon work supported by the National Science Foundation under the NSF CAREER Award CHE-0547982 and the United States Department of Agriculture (CSRESS: 2009-35201-05819 and CSRESS: 2009-65107-05926). Paulina E. Kolic is thanked for acquiring the NMR data. The authors owe a debt of gratitude to Patricia Maurice, E. Michael Perdue, and Kevin Thorn for providing invaluable technical and historical data on the Suwannee River isolates presented in this article. We thank the anonymous reviewers for inputs that allowed for the development of a more insightful article.
Author Disclosure Statement
No competing financial interests exist.