
Abstract
Abstract
Photocatalytic degradation and removal by adsorption of the Reactive Red 2 (RR2) dye in the presence of different pristine and functionalized one-dimensional (1D), two-dimensional (2D), and three-dimensional (3D) carbon structures were investigated and compared, considering also the loading of catalyst/adsorbent. Previous to photocatalytic and adsorption evaluation, all carbon materials were characterized to verify functionalization, structural changes, and surface properties useful in the removal of this pollutant in water. Materials were analyzed by Raman and infrared spectroscopies, transmission electron microscopy, and besides, the pH of the point of zero charge (pHpzc) was determined by potentiometric titrations, and band gap by ultraviolet–visible spectroscopy through Tauc plot. Removal of RR2 increases with the load of carbon materials. One-dimensional materials showed better performance in the decolorization of RR2 dye, removing the whole color of the solution. RR2 removal values obtained by the photocatalytic and adsorption processes are very similar. Thus, the adsorption process predominates over the photocatalytic activity, only the samples of graphene and graphene oxide present slight photocatalytic activity. The adsorption process was strongly influenced by the carbon material dimension. However, other factors like surface oxygenated groups, surface area, and the shape of the carbon structures, as well as the structure and nature of the dye also play an important role in this process. Experimental adsorption data of all carbon materials were best fitted to pseudo second-order kinetic model, and, it is concluded that physisorption with strong interaction is the process by which carbon materials adsorb to the dye. Thus, the mechanism of RR2 adsorption on carbon materials is by the aromatic rings of the RR2 and π delocalized electrons on carbon materials.
Introduction
O
The adsorption process is considered to be the most efficient method for the removal of synthetic dyes from aqueous effluents (Machado et al., 2011). In this process the dyes are transferred from the water effluent to a solid phase. Subsequently, the adsorbent can be regenerated or stored in a dry place without direct contact with the environment (da Silva et al., 2011). On the other hand, advanced oxidation processes (AOP) are highly effective for the removal of recalcitrant organics from wastewater (Pachhade et al., 2009). Heterogeneous photocatalyst is one of the AOP that offer great potential converting photon energy into chemical energy and, therefore, decomposing organic contaminants (Zhao et al., 2012).
A variety of adsorbents and catalyst materials have been proposed to reduce dye concentration in aqueous solution (Yu et al., 2005; Gupta et al., 2006; Wang and Zhu, 2006; Órfão et al., 2006; Gupta et al., 2007, 2012; Wu, 2007; Pavan et al., 2008; Brostow et al., 2009; Kuo and Lin, 2009; Xing et al., 2009; Aquino et al., 2010; Lin and Lee, 2010; Mittal et al., 2010; Wang and Peng, 2010; da Silva et al., 2011; Ramesha et al., 2011; Zhao et al., 2012; Rahman et al., 2013; Zhou et al., 2013; Öztürk and Malkoc, 2014; Yu and Luo, 2014).
In the last few years, carbon nanomaterials have been proposed as adsorbents for the successful removal of dyes from aqueous effluents, due to their properties such as small size, a large specific surface area, and hollow and layered structures as well. Carbon nanotubes (CNTs) were proposed as an attractive alternative adsorbent for the removal of dye from aqueous effluents (Wu, 2007; Machado et al., 2011). CNTs have been found to be efficient adsorbents with a capacity that exceeds activated carbon (Wu, 2007).
Graphene (GE) and graphene oxide (GEO) also acted as good adsorbents for anionic and cationic dyes from aqueous solutions, respectively (Ramesha et al., 2011). On the other hand, due to their structure with sp2 hybridization of carbon atoms, the GE or GE-based materials are great promise in applications requiring fast electron transfer as photocatalysis (Zhao et al., 2012). Recently, the photocatalytic activity was reported of graphite oxide (GO) in the hydrogen production from water (Yeh et al., 2010) and GEO in the CO2 to methanol conversion (Karthikeyan et al., 2011), but not in the degradation of pollutants in water.
These carbon materials can be classified according to their dimension in one dimensional (1D), two dimensional (2D), and three dimensional (3D). CNTs are considered as one dimensional because they have one dimension outside the nanometer range, where electron delocalization takes place, whereas the electron confinement occurs in two dimensions. Materials as GE and GEO are 2D because they have two dimensions above the nanoscale, thus the conduction electrons are confined across their thickness, but are delocalized in the plane of their sheets. The three dimension of graphite (GRA) and GO is because they do not possess nanoscale in any dimension; therefore the electrons are fully delocalized and they move in three directions (Ashby et al., 2009). Dimensionality plays a critical role in determining the properties of materials (Hu et al., 1999).
Structural and electronic properties of carbon materials have allowed themselves to be postulated as materials with great potential for their use in the remediation of environmental problems. Therefore, in this research, carbon materials with different features such as structure, dimension, band gap, surface area, morphology, and content of oxygenated groups were used to evaluate the influence of these parameters on their efficiency as photocatalysts and/or adsorbents in the decolorization of Reactive Red 2 (RR2) dye, which is widely used for dyeing cellulosic fibers (Maas and Chaudhari, 2005).
Experimental
Materials
Multiwalled CNTs (produced by chemical vapor deposition) were purchased from Sunnano Company, 10–30 nm in outer diameter, 1–10 μm length, and purity 80%. GRA rods, spectro grade (ash content <2 ppm) were obtained from Electron Microscopy Sciences. RR2 dye was obtained from Sigma-Aldrich Company. The structure of RR2 is shown in Fig. 1. Its molecular size was obtained from the Jmol, an open-source Java viewer for chemical structures in 3D. The width and depth of the RR2 molecule were 13.55 and 0.981 Å, respectively.
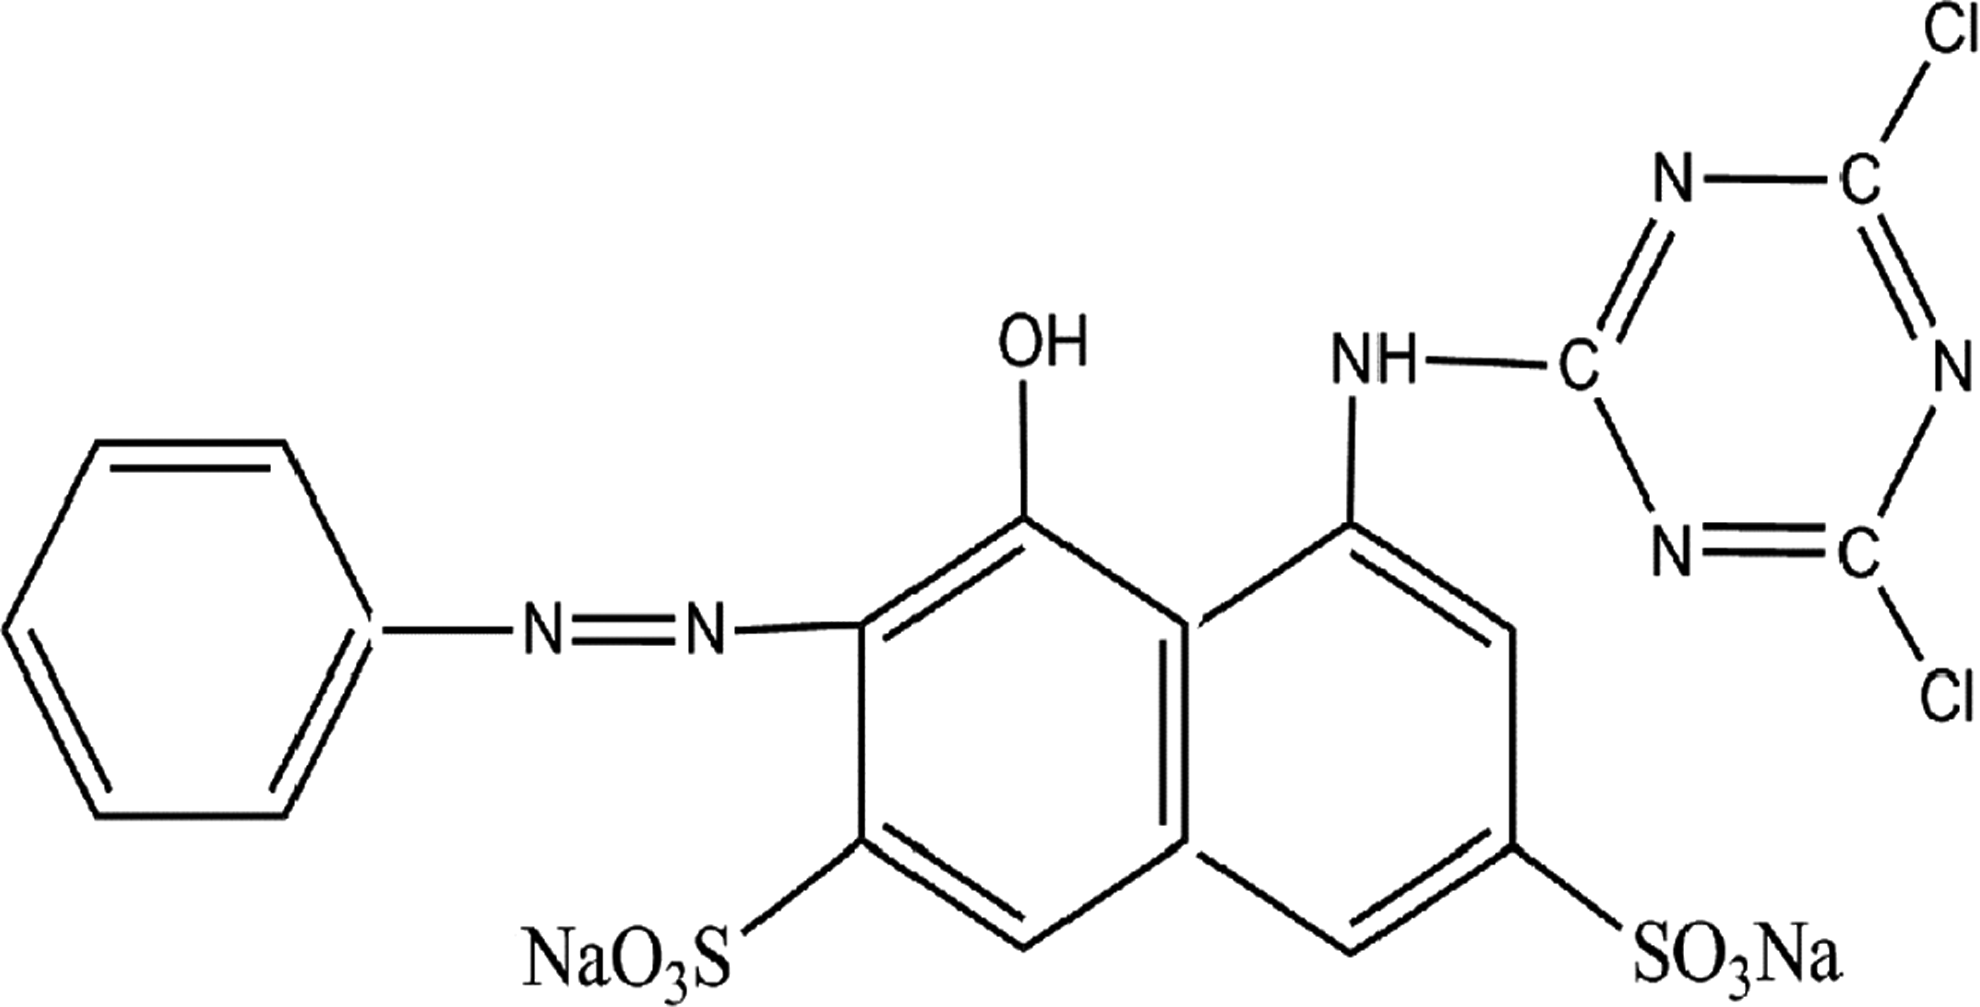
Structure of Reactive Red 2 (RR2).
Sample preparation
CNTs were purified through a chemical and thermal treatment employing the procedure used by Navarro Pardo et al. (2013). The reaction time was of 2 h. Samples obtained were labeled as oxidized carbon nanotubes (OCNTs).
GO was prepared by a modified Hummers method reported by Navarro Pardo et al. (2013).
To obtain the GEO, a dispersion of GO in water (0.01 g/mL) was bath sonicated for 3 h at 40 kHz. The resulting solid was dried at 65°C for 24 h.
The chemical reduction of GEO to obtain GE was based on the literature procedure (Zhang et al., 2010). A GEO aqueous dispersion of 100 mL with a concentration of 1 mg/mL was heated to 95°C, then 352 mg of ascorbic acid was added and left to react for 20 min. The mixture was centrifuged and the solid was washed with distilled water until neutral pH and then dried at 65°C.
Characterization of carbon materials
Fourier transform infrared spectroscopy was taken with a Bruker Vector 33 spectrometer. Raman spectra were taken with a DilorLabRaman II micro Raman spectrometer with He-Ne laser (632.8 nm) as excitation source. Ultraviolet–visible (UV-vis) spectroscopy was taken with a HACH DR 5000 with wavelength of 200–800 nm. Transmission electron microscopy (TEM) images were obtained using a JEOL-1010. The surface area determined by N2 adsorption–desorption isotherms were recorded on a BELSORP-miniII BEL JAPAN at liquid nitrogen temperature (77 K). The pH of the point of zero charge (pHpzc) of carbon materials was determined by potentiometric titrations based on the procedure reported by Mahmood et al. (2011).
Photocatalysis and adsorption experiments
Photocatalysis experiments were conducted in a quartz reactor at room temperature (25°C), with a RR2 concentration of 30 mg/L, and volume of 30 mL in all experiments. The catalysts/adsorbent concentrations were 0.1, 0.5, 0.75, and 1 g/L. An 8-W UV lamp (254 nm) was employed, with a distance of 5 cm from the UV lamp to the reactor. Before radiation, the RR2 solution was magnetically stirred for 15 min. The reaction system was irradiated and stirred constantly for 60 min. To compare the performance of the carbon materials in the photocatalysis and adsorption experiments, these latter were carried out for 75 min under the same conditions as that of photocatalytic experiments, but without radiation. The RR2 concentration was measured using a spectrophotometer (HACH DR 5000) at 538 nm. Each experiment was performed twice and experimental results are average values.
Batch kinetic experiments
All dye adsorption experiments were conducted in glass containers of 100-mL under ambient conditions. The concentration of the dye solution was 30 mg/L, the employed volume 50 mL in all experiments, and the adsorbent concentration 0.75 g/L. The adsorption system was stirred constantly for 120 min. Several aliquots of the dye solution were taken at given time intervals and centrifuged; the adsorbent from the dye solution was separated and then analyzed by a UV-Vis spectrophotometer at 538 nm. Each experiment was performed twice and experimental results are average values.
The adsorption efficiency was calculated using the initial concentration (Co) and time t concentration (Ct) of the dye solution. To calculate the adsorption capacity (qt), the initial concentration (Co) and the equilibrium concentration (Ce) of the dye solution, the adsorbent mass and the dye solution volume (Machado et al., 2011; Öztürk and Malkoc, 2014) were used.
Kinetic models
To investigate the mechanism of adsorption of RR2 on the carbon materials, three kinetic models were analyzed.
(1) Pseudo first-order model can be written as:
where qe and qt are the adsorption capacities (mg/g) at equilibrium and time t, respectively and K1 is the pseudo first-order rate constant of adsorption (1/min).
(2) The pseudo second-order model can be expressed as follows:
where k2 is the pseudo second-order rate constant of adsorption (g/mg · min). The values of qe and k2 parameters can be obtained from the slope and intercept of the plot of t/qt against t.
(3) The Elovich model is presented by the following equation:
where α is the initial adsorption rate (mg/g · min) and β is the desorption constant (g/mg). α and β parameters are determined from the slope and intercept of the linear relationship obtained of the plot qt against ln t.
Results and Discussion
Raman spectroscopy
Figure 2 shows the Raman spectra of all carbon samples. The GRA spectrum shows two characteristic bands. The G band is attributed to the arrangement characteristic of graphitic carbon and usually assigned to the E2g phonon of carbon sp2 atoms (Akhavan, 2011). The D band is assigned to local defects and disorder, especially at the end of the GE and GRA platelets (Graf et al., 2007). G and D bands are both first order.
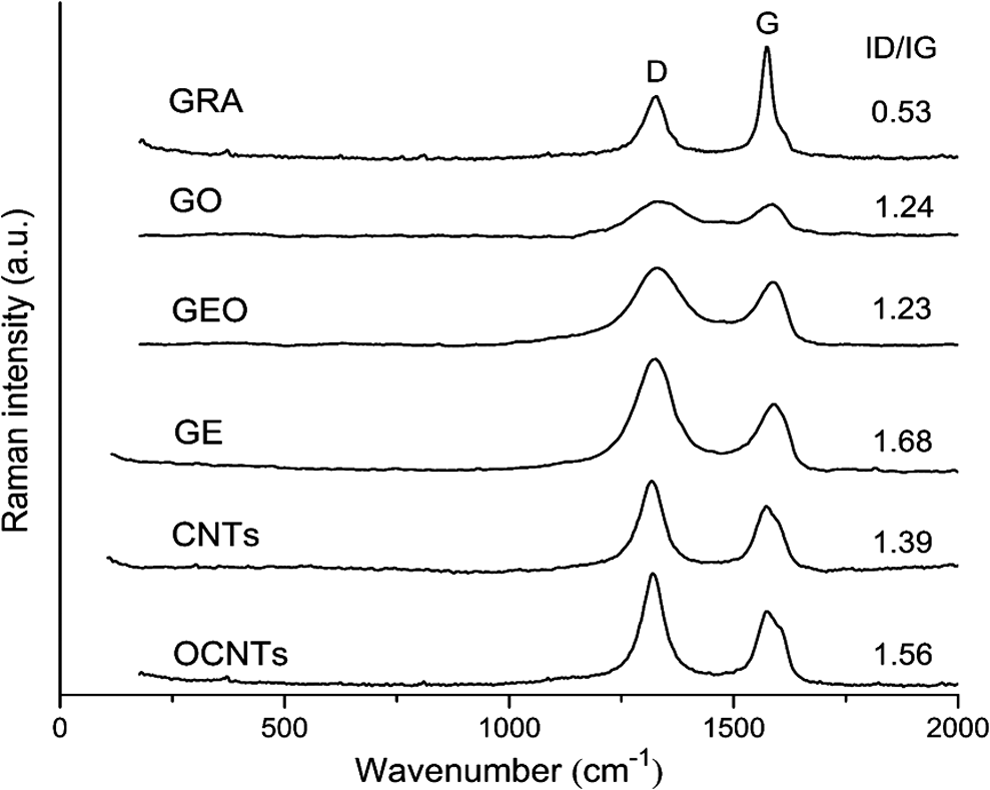
Raman spectra of carbon materials.
In the GO spectrum, a decreasing in the intensity and widening of the D and G bands with respect to the GRA spectrum are observed. Moreover, the (ID/IG) ratio of GO increases with respect to GRA indicating a higher disorder in the graphitic network and suggests the incorporation of functional groups on the carbon backbone (Jeong et al., 2008). The D and G bands in the GEO spectrum do not show a change in position, but they show a slight thinning, which is attributed to ultrasonic exfoliation (Haubner et al., 2010). In GE spectrum a thinning and increase in the intensity of the D and G bands are observed, especially in the first. This indicates a restoration of the graphitic layers. The increase in the ID/IG ratio of GE is due to the formation of small crystallites or graphitic domains, where borders act as defects (Jimenez-Cervantes et al., 2015).
In CNTs, the G band indicates the presence of crystalline graphitic carbon and it is related to the GRA tangential E2g Raman active mode, due to two atoms in the GE unit cell vibrating tangentially one against the other (Su et al., 2008; Luo et al., 2009). The D band is usually attributed to the presence of amorphous or disordered carbon in the CNT samples (Datsyuk et al., 2008), and is related to the phonon region close to the k-point GRA Brillouin zone. The relative intensity of this band can provide direct evidence of covalent modification and defect concentration (Luo et al., 2009). The ID/IG ratio in OCNTs increases with respect to CNTs; this is due mainly to the formation of sp3 hybridized carbon sites on CNTs walls by the addition of functional groups.
Infrared spectroscopy
Infrared (IR) spectra of all carbon materials are shown in Fig. 3. As it can be seen, there is a large difference between the GRA and GO spectra. While GRA does not show IR absorption, new absorption bands are found in the GO spectrum and this is due to the chemical oxidation process applied to pristine GRA. At 839 cm−1 a band corresponding for aromatic C–H deformation (Yeh et al., 2010), 943 cm−1 for epoxy stretching, 1,083 cm−1 for C–O stretching (Yeh et al., 2010; Zhang et al., 2010), 1,226 cm−1 for epoxy C–OH stretching (Zhang et al., 2010; Nguyen-Phan et al., 2011), 1,292 cm−1 for primary alcoholic C–OH bending, 1,355 cm−1 for tertiary alcoholic C–OH bending, 1,618 cm−1 for bending of water (HOH) contribution and skeleton vibrations of unoxidized graphitic domains (Yeh et al., 2010; Thuy-Duong et al., 2011), and 1,701 cm−1 for C = O stretching of carboxylic groups are found.
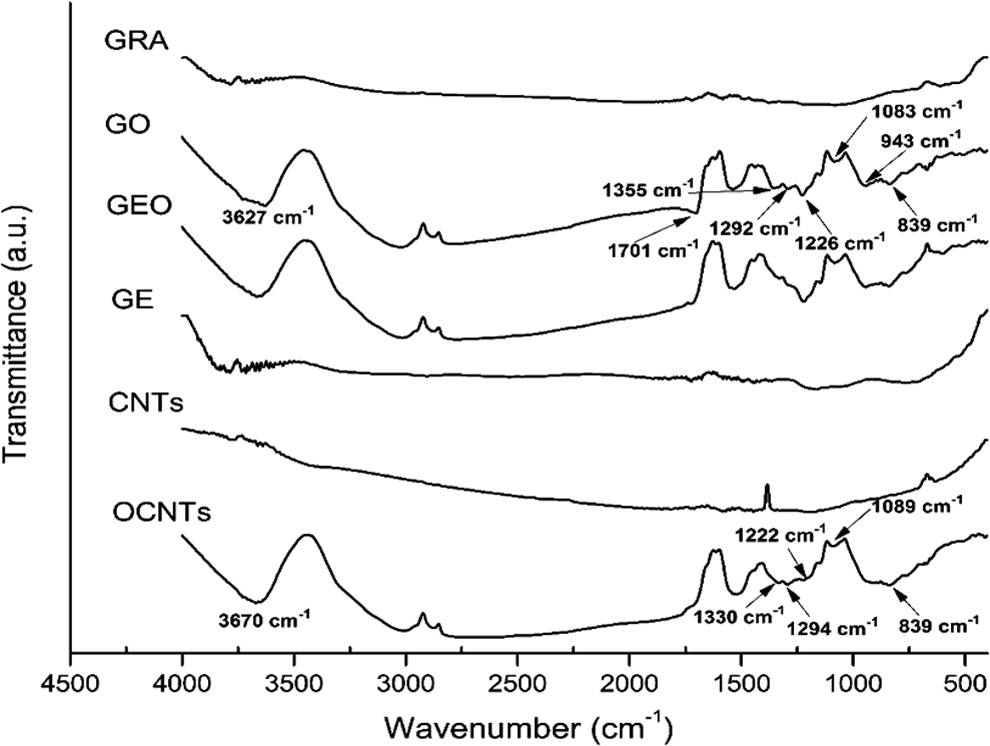
Infrared spectra of carbon materials.
GEO spectrum shows the same absorption bands as the GO, which correspond to oxygenated groups. In the GE spectrum, most of the oxygenated group bands disappear due to the reduction process with ascorbic acid.
Similarly in the GRA spectrum, CNTs do not show absorption in the IR. In the OCNTs spectrum new bands are observed with respect to CNTs spectrum, which is attributed to the oxidation process applied to CNTs. The bands at 1,294 and 1,330 cm−1 correspond to O–H bending of primary and tertiary alcohols, respectively. The peak at 1,089 cm−1 correspond to C–O stretching (Ren et al., 2013), while the band at 1,222 cm−1 is attributed to stretching vibration C–O in phenols (Chen et al., 2012). At 839 cm−1 an aromatic C–H deformation is found, while a small band at 1,614 cm−1 is assigned to stretching vibration of aromatic rings in the surface of CNTs (Chen et al., 2012). Finally, at 3,670 cm−1 shows the corresponding band due to the stretching vibrations of hydroxyl group OH unlinked.
Transmission electron microscopy
TEM images of carbon materials are shown in Fig. 4. In the GO image (Fig. 4a), a lot of carbon layers are found identified by a dark color, unlike with the images of GEO and GE (Fig. 4b, c, respectively), where transparent carbon layers can be observed, indicating the presence of less sheets. This is attributed to the sonication and reduction processes. In both images it is observed that the carbon layers are wrinkled due to the scrolling of sheets (Ren et al., 2013).
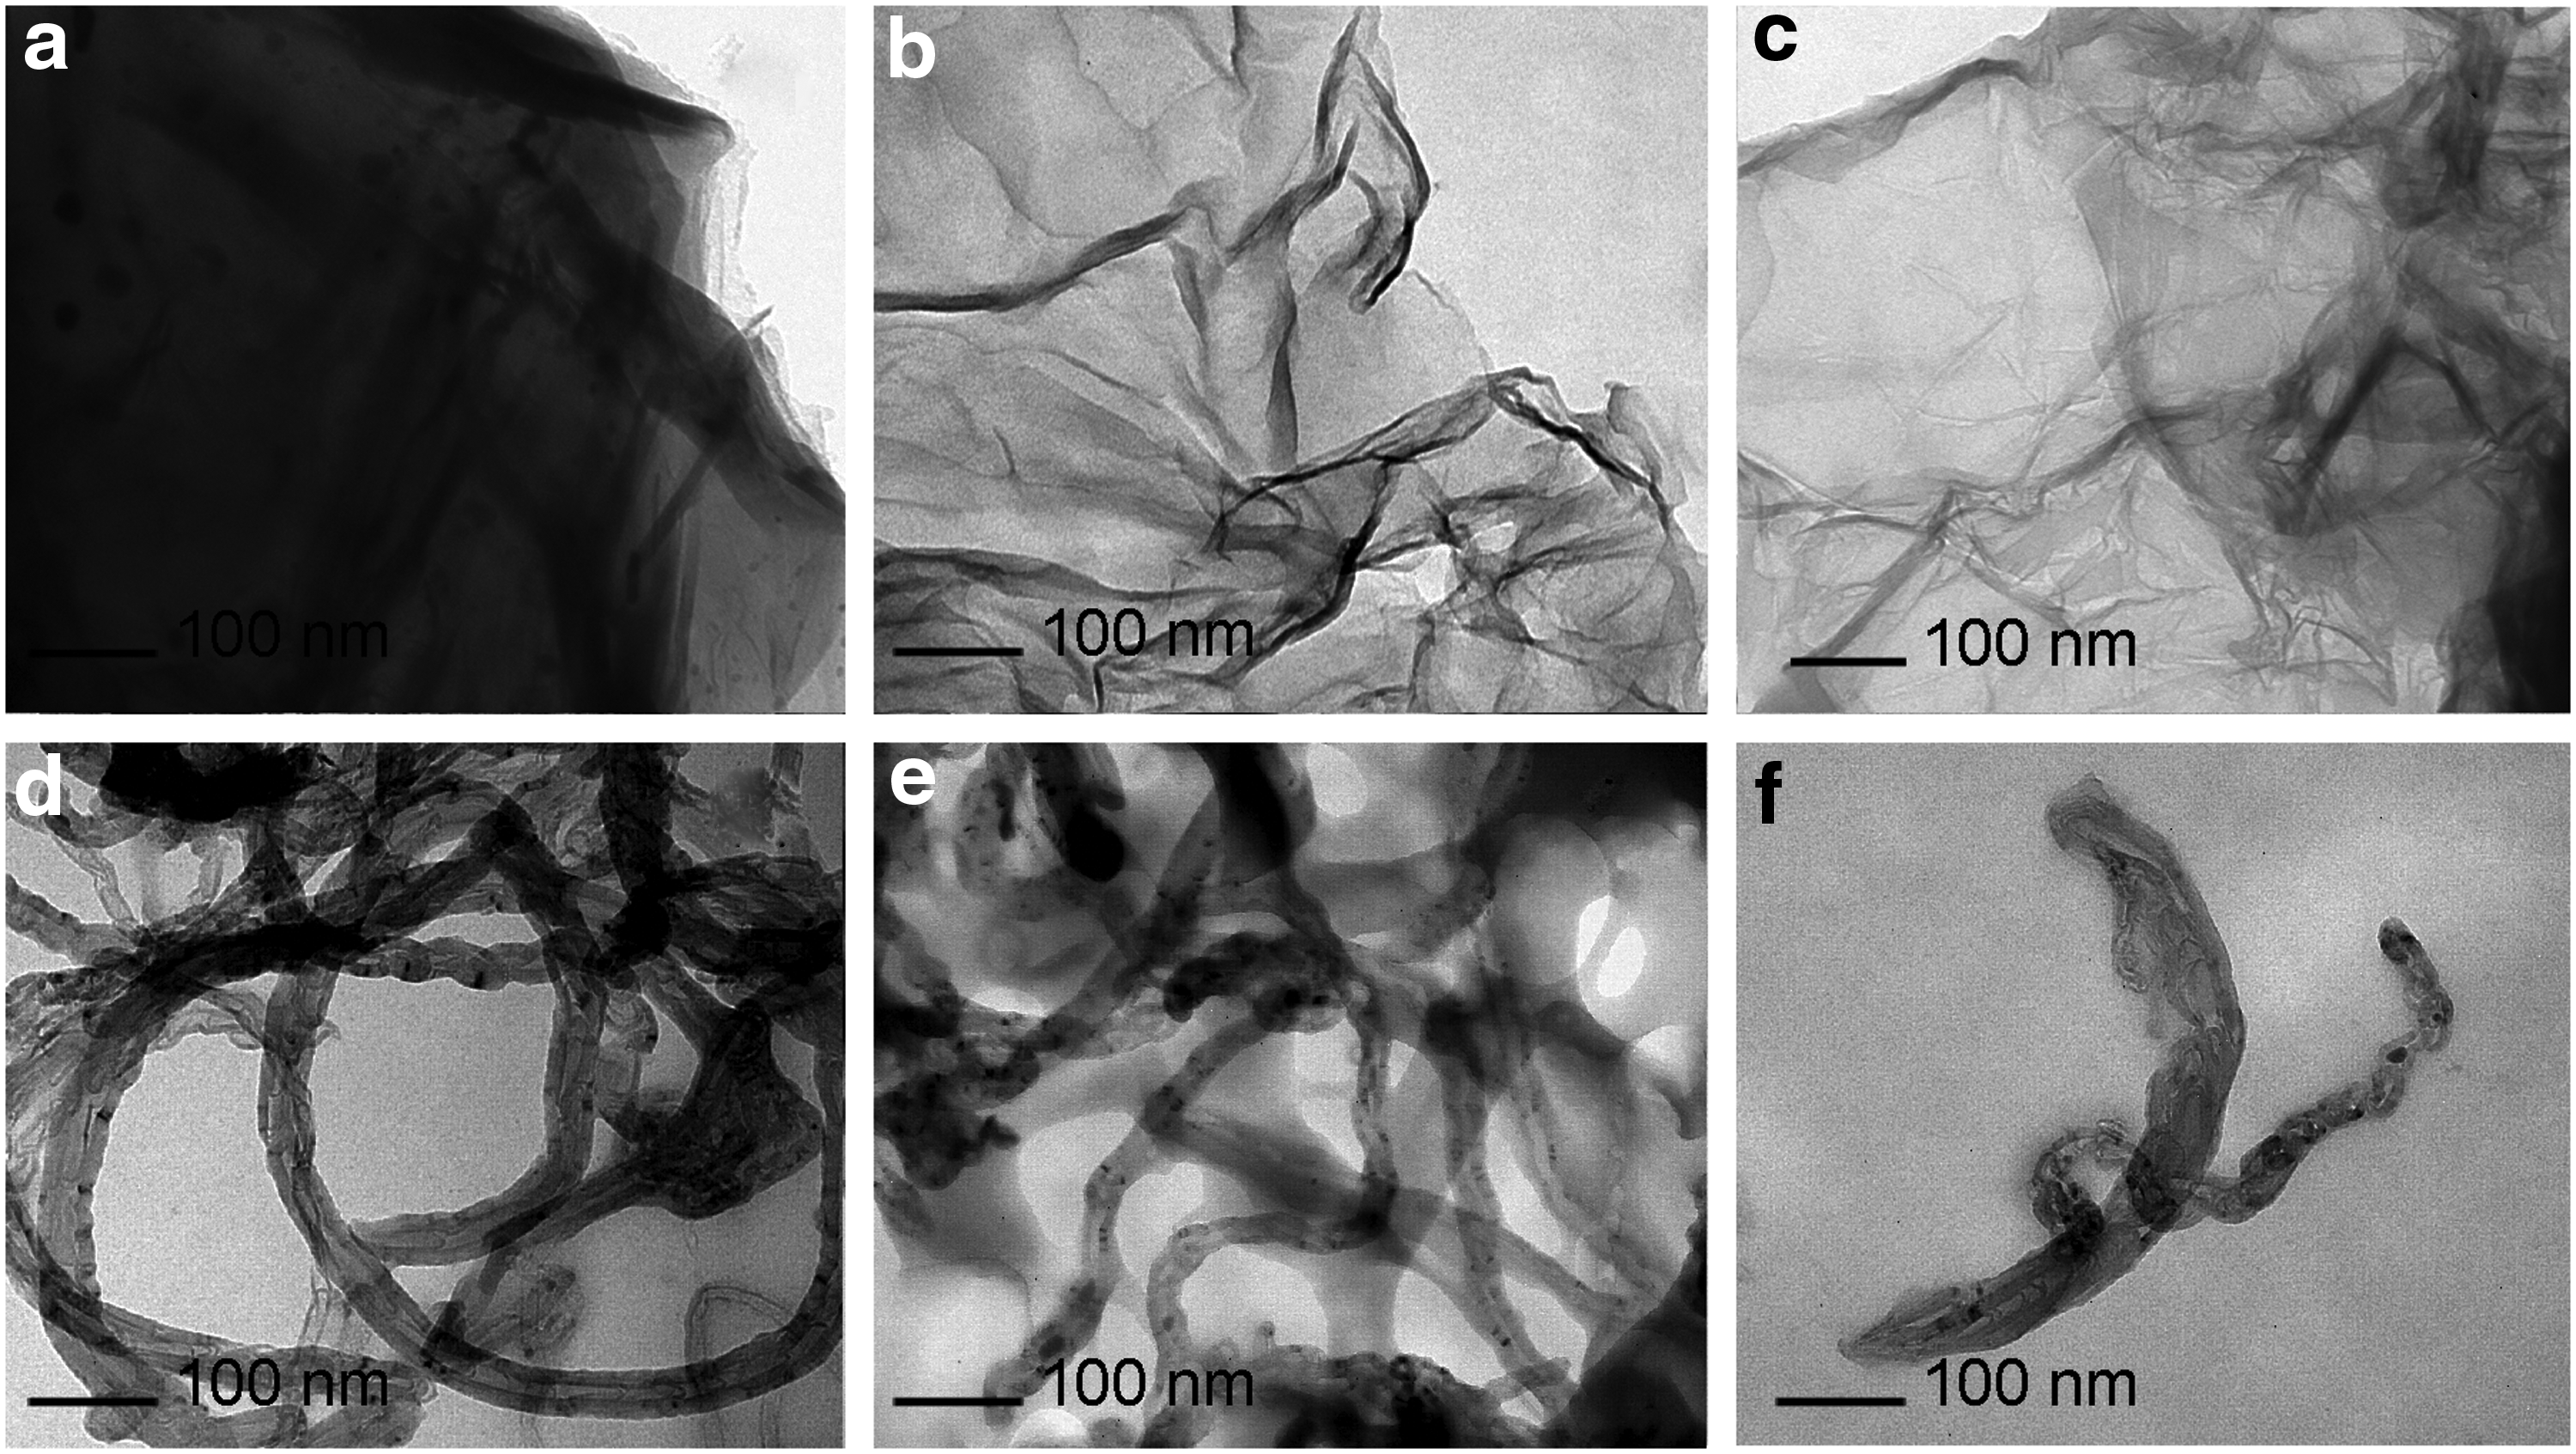
Transmission electron microscopy micrographs of
Pristine and oxidized CNTs are shown in Fig. 4d, e, and f, respectively. It can be seen that CNTs are curved and entangled with each other and contain amorphous carbon on their surface. Also, it is observed that the walls of CNTs are intact and most of the ends are closed. After the CNTs oxidation process (Fig. 4e), it can be seen that some CNTs have damaged open ends and walls, which is attributed to the action of acids (Fig. 4e, f) (Su et al., 2008). The entanglement of the CNTs persists after the oxidation process.
Determination of surface area
Table 1 shows the specific surface area of all carbon materials. This property is the main factor determining the physical adsorption capacity (Li and Li, 2010; Fan et al., 2011; Ren et al., 2013). The increase of surface area in GO and GEO with respect to GRA is due to the action of the oxygenated groups that increase the interlayer distance. The GE presents a lower surface area than GEO, which can be attributed to stacking of the sheets after the reduction process. The CNTs show a decrease in surface area after the oxidation process, which is attributed to the removal of amorphous carbon.
GRA, graphite; GO, graphite oxide; GEO, graphene oxide; GE, graphene; CNTs, carbon nanotubes; OCNTs, oxidized carbon nanotubes.
Determination of optical band gap
Figure 5a shows the absorbance spectra for all carbon materials. The GO and GEO spectra show two absorption peaks at 225–230 and ∼300 nm assigned to π–π* transitions of C–C and n–π* transitions of carbonyl groups (Marcano et al., 2010; Ramesha et al., 2011). The GE absorption peak at 266 nm corresponds to π–π* transitions of C = C chromophore, indicating an increased electronic conjugation of the GE sheets due to the reduction process (Fernández-Merino et al., 2012). The same transition is observed in GRA spectrum. CNTs and OCNTs show an absorption band at 251 nm corresponding to π plasmon.
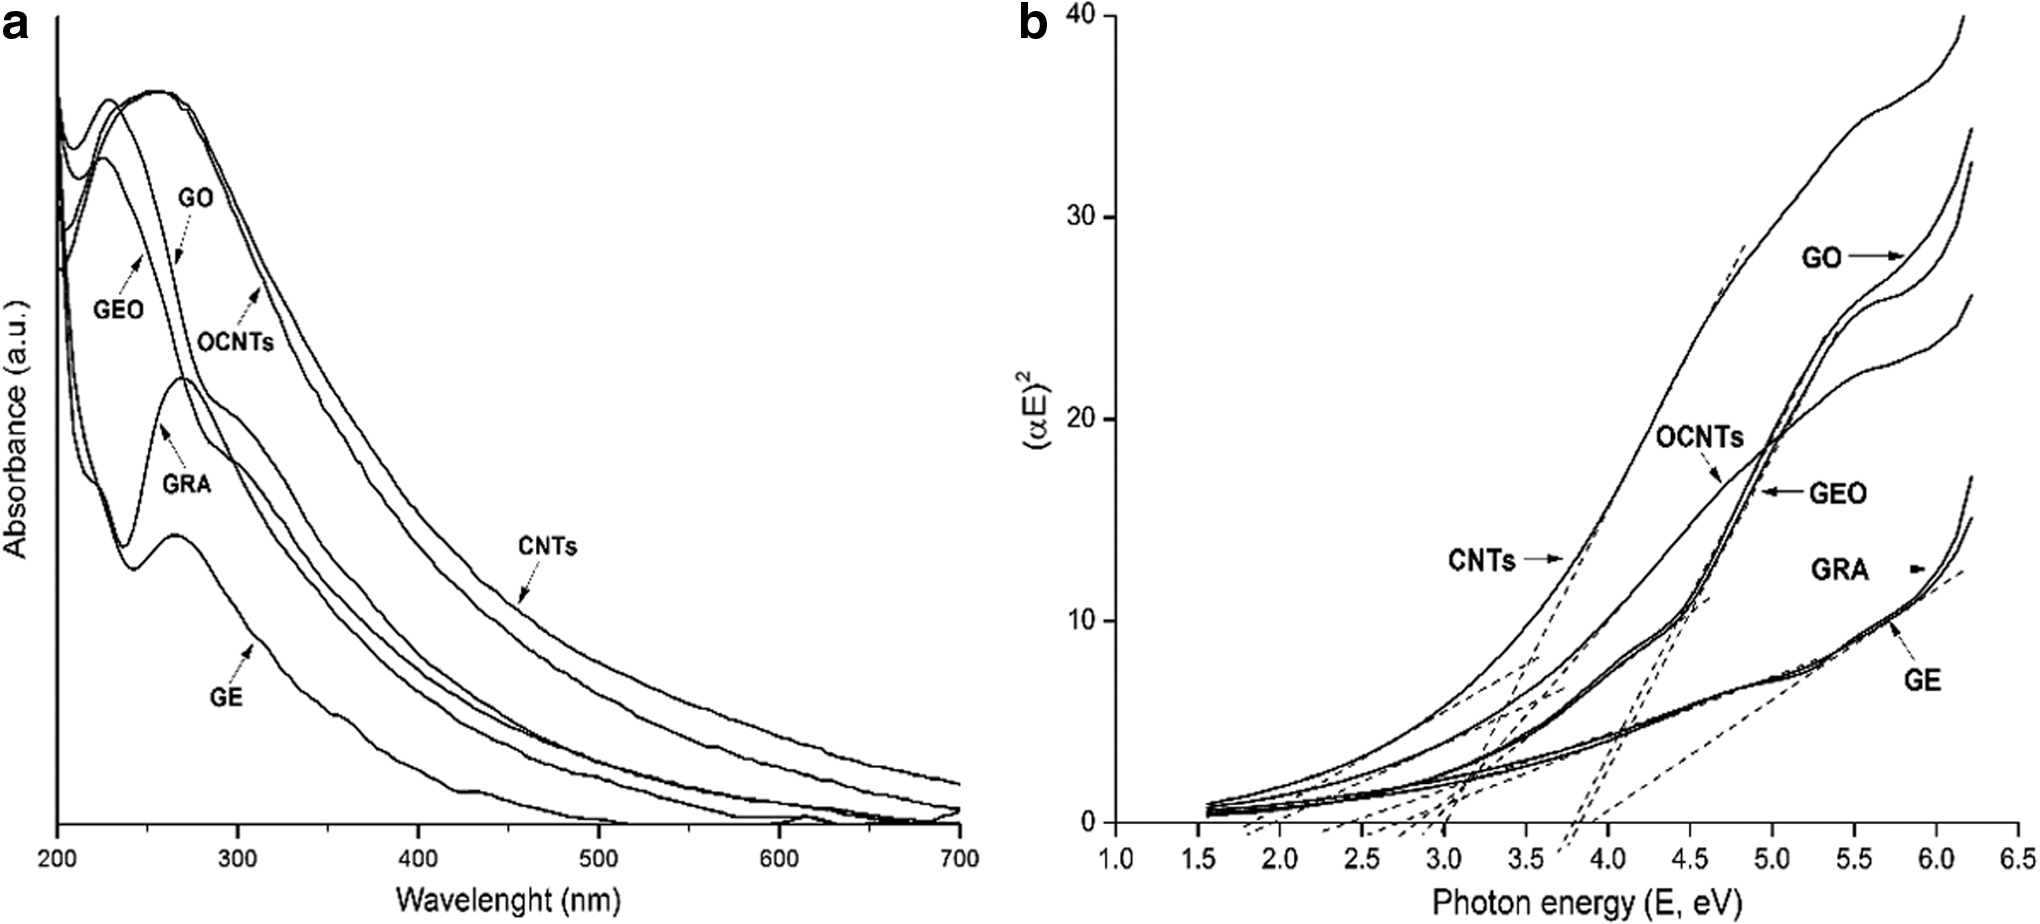
The direct band gaps of all carbon materials was determinate using the Tauc plot, following the procedure reported by Yeh et al. (2010) and are summarized in Table 2. These values favor a possible photocatalytic activity using UV radiation.
Point of zero charge
The pHpzc of all carbon materials was obtained from the potentiometric titration data using the following equation:
where σo is the surface charge density (μC/cm2), F is the Faraday constant (C/mol), Ca and Cb are the concentrations (mol/dm3) of acid and base, [OH−] and [H+] are the adsorption densities of OH− and H+, respectively, and m and S are the mass (g) and surface area (m2/g) of the carbon material, respectively (Mahmood et al., 2011).
The surface charge densities were plotted against the pH of the suspension. The pHpzc from all carbon materials are summarized in Table 3.
Acidic functional groups in the material surface have a significant effect on the pHpzc. Higher concentration of acidic functional groups is related with lower pHpzc value (Chen et al., 2012). If the pHpzc value of the adsorbent material is higher than the pH value of the contaminant solution, the surface of the adsorbent material is positively charged, and it is negatively charged in the opposite case. The surface charge of the adsorbent material and the anionic or cationic character of the dye molecule are very important to determine if the electrostatic interactions are favorable or not. The pHpzc values of the carbon materials used are below (GO, GEO, and OCNTs) or close (GRA, GE, and CNTs) to the pH of the RR2 solution (pH 6.7). This indicates that they have a negative and neutral surface charge, respectively.
Photocatalysis and adsorption experiments
The results of RR2 removal obtained in photocatalysis and adsorption experiments are shown in Fig. 6. In photocatalysis tests, the catalysts with highest performance in RR2 removal are CNTs and OCNTs, which reach almost completely the dye removal. The GEO also shows good dye removal above 73%, followed by GE with a removal performance around 40%. The influence of catalyst concentration is not remarkable in CNTs and OCNTs, but it is with materials like GEO, GO, GE, and GRA, in that order. The RR2 removal improved with the increase of catalyst concentration. The experimental error obtained for these results is of 1.51%.
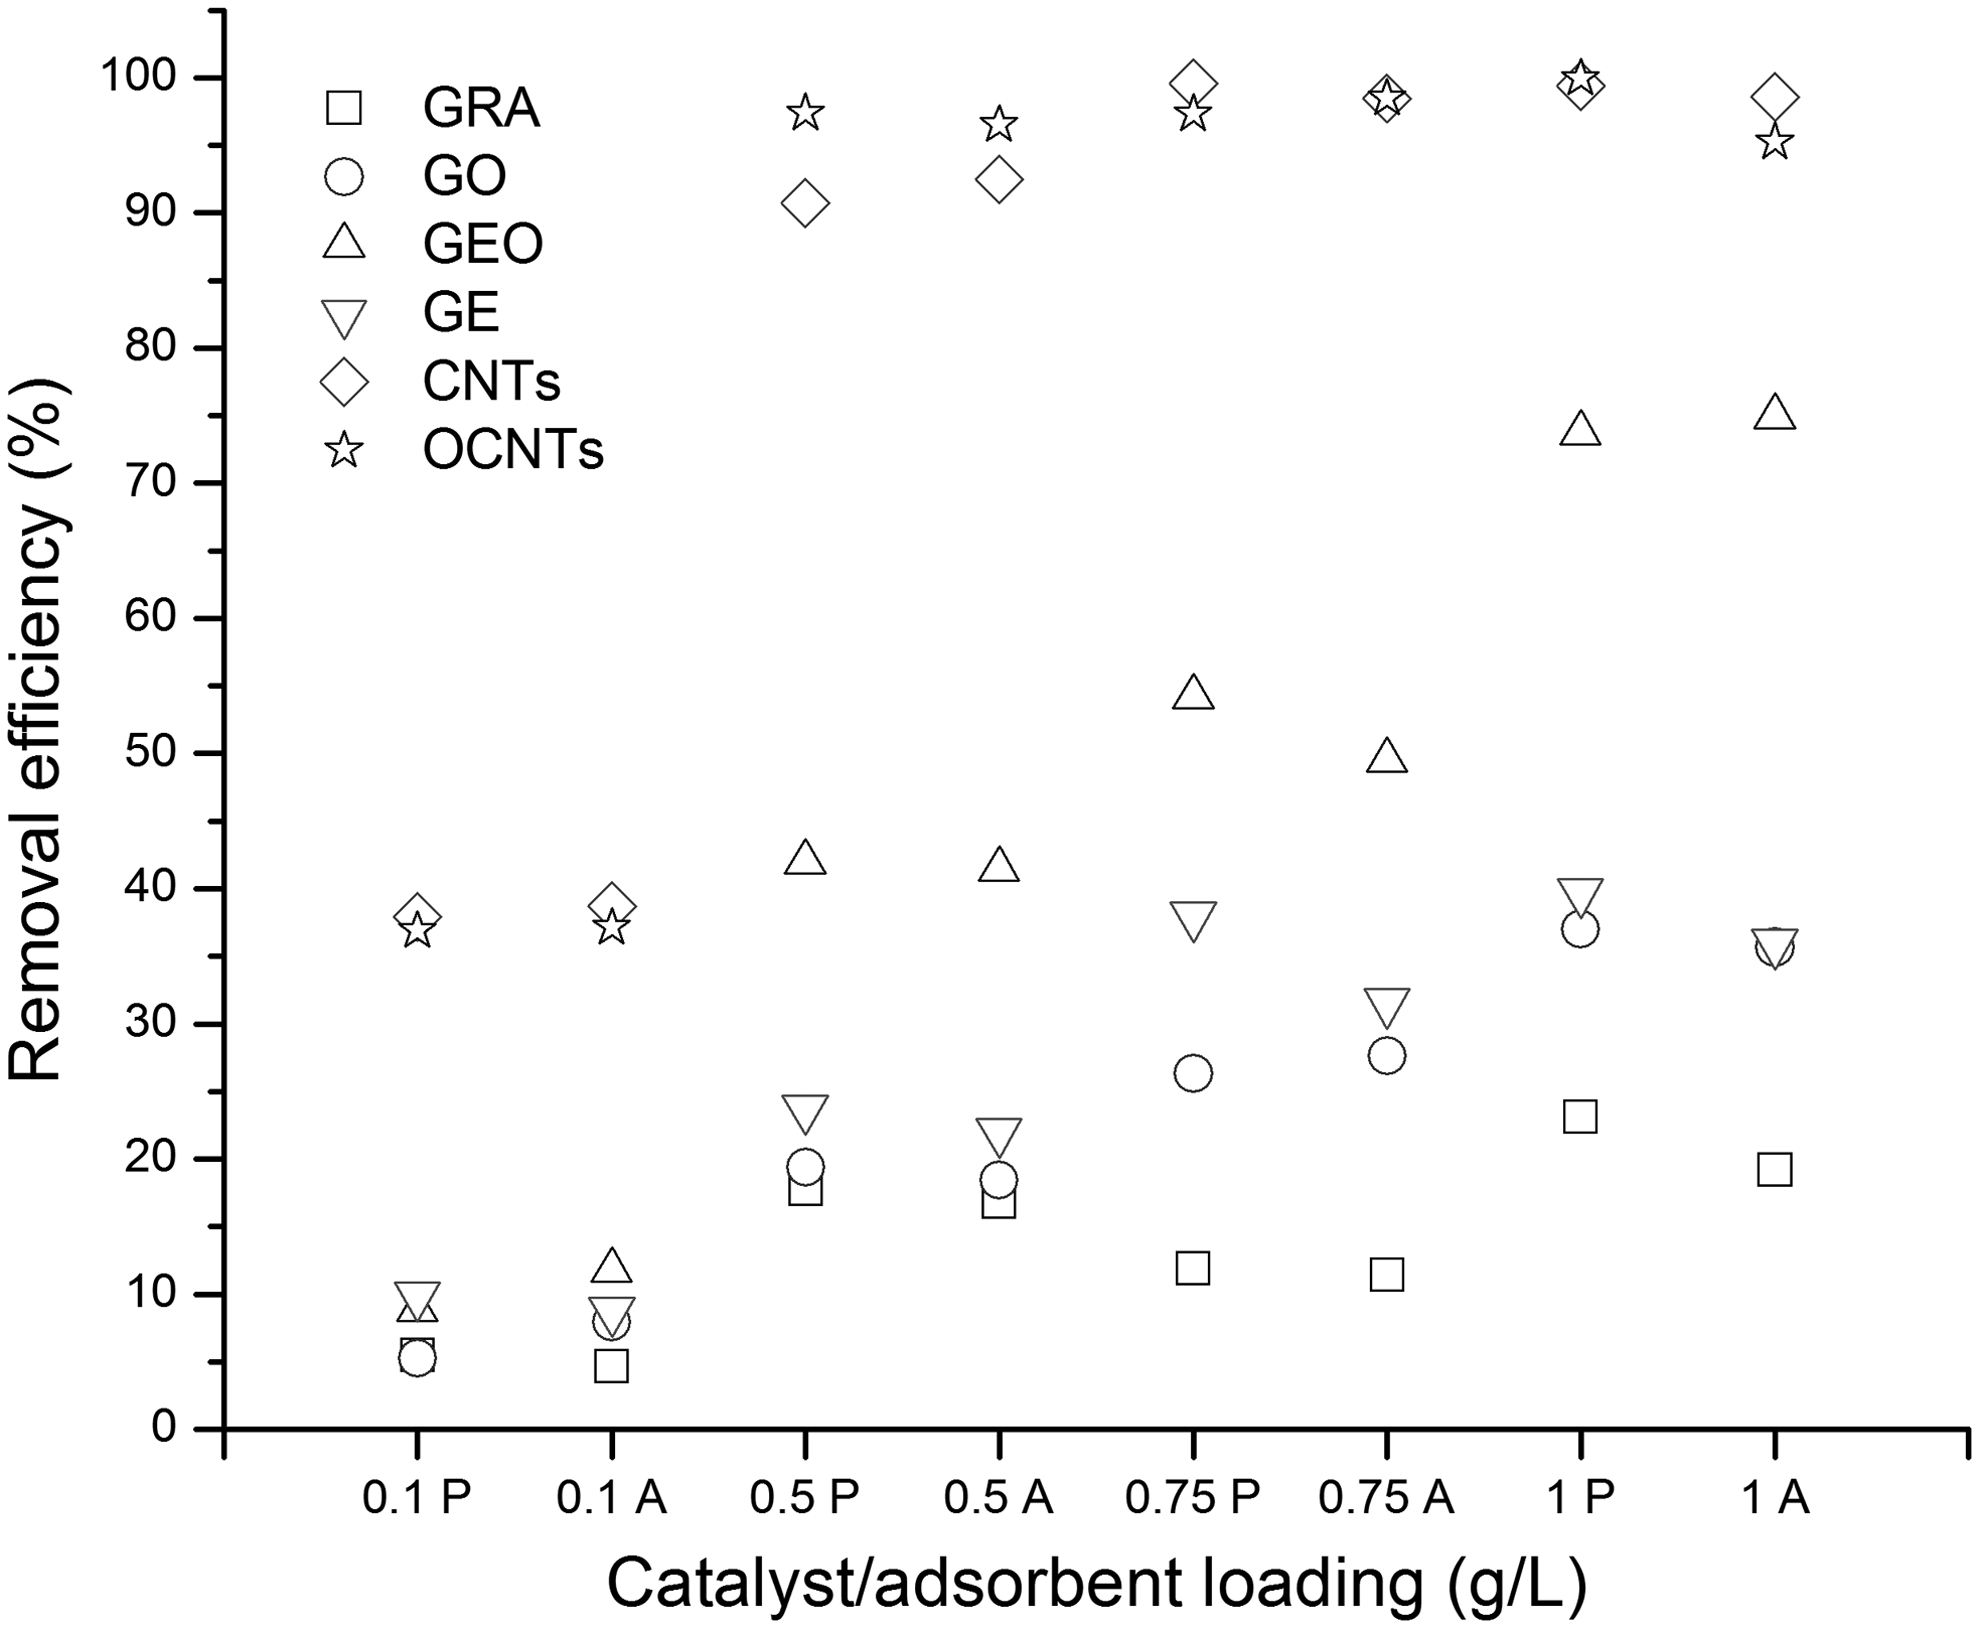
Comparative graph of RR2 removal efficiency obtained in photocatalysis and adsorption experiments with different concentrations of catalyst/adsorbent.
The removal efficiency obtained for the different carbon materials in the adsorption and photocatalysis experiments is very similar and this indicates that the removal of RR2 is conducted mainly by the adsorption process. Only the samples of GEO and GE show a little increment in the removal of RR2 in the photocatalytic tests with respect to the adsorption tests. Although the increments are 6% and 5% for GE and GEO, respectively, these are found over the experimental error, indicating that there is a photocatalytic effect in GEO. This corroborates the reports about the photocatalytic activity of this material (Karthikeyan et al., 2011); also it is possible that some functional groups that remain in the GE structure produce similar behavior than GEO. On the other hand, the GO that also has been reported as a photocatalytic material does not show this activity on the removal of RR2.
The RR2 molecular structure and the shape, in that this is adsorbed onto the adsorbents, may have an influence on the results of the photocatalysis. The low and null photocatalytic activity of the different carbon materials could be enhanced by modifying the operating conditions as the UV lamp power, the distance between the UV lamp and the reactor, and the introduction of the lamp inside the reactor. This behavior has been observed recently (Bustos-Ramirez et al., 2015), although the pollutant molecule also seems to be important in this process.
As mentioned previously, the pHpzc values of the carbon materials indicate the negative and neutral surface charge that these materials possess. On the other hand, the RR2 is an anionic dye and negatively charged due to its sulfonate groups (RSO3−) (Wu and Yu, 2009). As a result of that, it is deduced that the electrostatic interaction between the adsorbent and adsorbate is not favorable. Thus, it is suggested that the main mechanism of RR2 adsorption on carbon materials is through the aromatic rings of RR2 and π delocalized electrons present in the aromatic structure of the carbon materials.
However, it is observed that the removal of RR2 dye with the carbon materials is influenced by different factors. Adsorption of RR2 increases on GO with respect to the GRA; in this case, it is suggested that this difference is due to greater spacing found between the graphitic layers in GO caused by oxygenated groups, and also, it coincides with the surface area available.
The difference in the dye removal performance between the GO and GEO is attributed to the two dimension of GEO, inasmuch as, smaller number of layers increases the surface area, thereby increasing the available sites for the adsorption of RR2 molecules. The considerable lower removals in GE with respect to GEO are attributed to the stacking of the graphitic layers after the reduction process, because the majority of the oxygenated groups are eliminated, thereby, the surface area available for adsorption is reduced; in addition, the hydrophobic character of GE made the dispersion difficult in the aqueous solution of the dye; the opposite effect occurred with GEO.
The hydrophilic and hydrophobic characters of OCNTs and CNTs, respectively, have no significant influence on the RR2 removal. Their high efficiency of removal of RR2 is attributed to factors such as 1D (shape), surface area, hollow structure, and entanglement, which allow the addition of external surface and other available sites for the adsorption of contaminants, such as intratubular, interstitial channels, and external grooves (Agnihotri et al., 2006; Ren et al., 2011). Unlike the CNTs, in 2D carbon nanomaterials (GEO and GE), the available sites for adsorption are found only on the external surface and maybe in the interplanar space in GEO. On the other hand, the macrostructure of the 3D materials as GRA and GO, reduce the available sites for the adsorption of the dye.
According to the molecule size, this may have accessibility to adsorb on all available sites aforementioned of the 1D materials. In 2D materials the molecule can be adsorbed on the external surface and maybe this can penetrate into the interplanar space. By its structure and according to the results, in 3D materials, the adsorption could be limited only to the external surface.
Adsorption kinetic
Studies of the adsorption kinetic are very important in the treatment of aqueous effluents because they provide essential information on the mechanism of the adsorption process (Machado et al., 2011). The adsorption kinetic of RR2 on carbon materials is shown in Fig. 7.
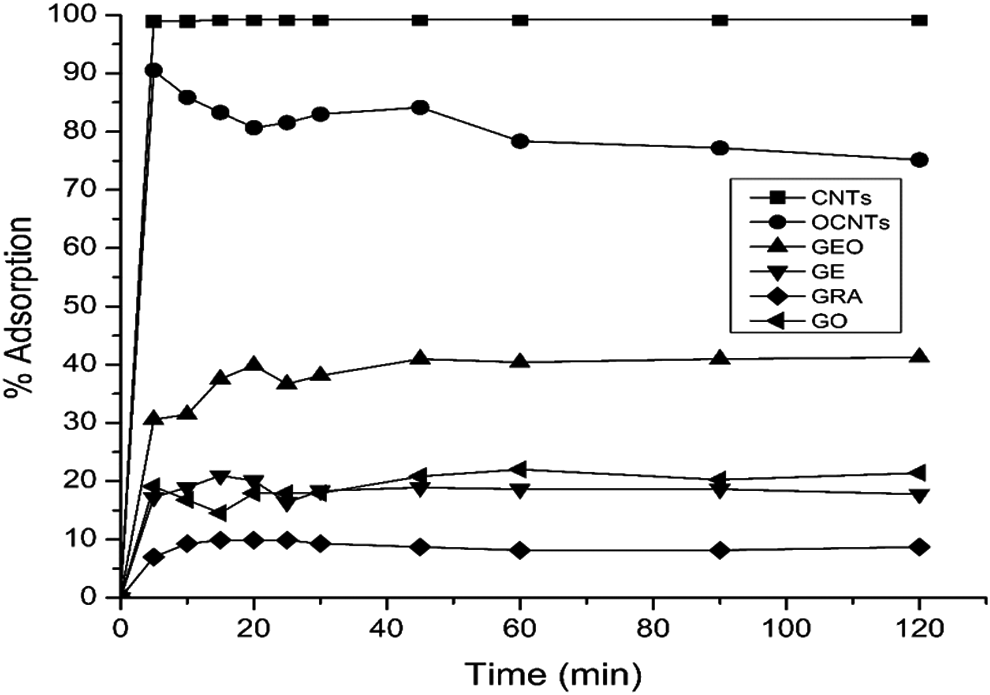
Effect of contact time on RR2 adsorbed by CNTs, OCNTs, GEO, GE, graphite (GRA), and GO.
The removal of RR2 has a rapid adsorption stage, which is attributed to the adsorption of RR2 molecules on the external surface of the different carbon materials. In OCNTs an important desorption process can be seen. It can be attributed to the presence of oxygenated groups on the surface of CNTs, which do not allow that some molecules of RR2 interact with aromatic rings, and these are desorbed. A similar effect has been found in other reports (Franz et al., 2000; Pereira et al., 2003; Ramesha et al., 2011). The surface area of the different materials employed plays an important role in their adsorption capacity; however, not all materials show a relationship between the surface area and the removal of dye. Factors, such as the oxygenated groups on the surface of the carbon materials, the shape, the dimension, and the character of the dye molecule play an important role on the removal of this dye.
In Table 4 are summarized the kinetic parameters obtained for the pseudo first-order, pseudo second-order, and Elovich models. The pseudo second-order model shows the best R2 values suggesting that the adsorption experimental data are described by this kinetic model. This model describes that the adsorption process is controlled by chemisorption, which involves valency forces through sharing or exchange of electron between the solvent and the sorbate (Zhao et al., 2013). However, some investigations about adsorption dyes on CNTs, where the experimental adsorption data were well fitted to pseudo second-order model, suggested that the adsorption of dyes onto CNTs was through a physisorption process and not a chemisorption process (Wu, 2007; Kuo et al., 2008; Yao et al., 2010).
Considering the CNTs nature, that is the material with the best performance on the removal of RR2 and where there are no superficial groups for the interaction with the dye, it is suggested that the adsorption of RR2 onto the carbon nanomaterials is through a physisorption process, but with strong interactions.
Conclusions
Carbon allotropes of one, two, and three dimensions in their oxidized forms and pristine or reduced structures were probed as photocatalysts and adsorbents of RR2 dye in water. Carbon structures studied here possess the same hybridization, but with different dimension, and together with structure and functionalization, give a variety of carbon materials with different features. Results show a clear predominant adsorption process over photocatalyst activity in all samples for this dye.
Under neutral conditions, pristine and oxidized CNTs were the structures with best performance on the RR2 removal, followed by GEO. The results suggest that these three carbon nanostructures are promising materials for the removal by adsorption of RR2 dye in wastewater. It is suggested that the adsorption of RR2 on carbon materials is mainly due to the aromatic rings of the dye structure and π delocalized electrons on the aromatic structure of carbon materials. In OCNTs, oxygenated groups have no significant influence on the RR2 removal; however in GO and GEO it plays an important role, allowing an important increase of the surface area with respect to GRA.
There is no direct relationship between the surface area of the carbon materials and the adsorption of RR2, indicating that the removal of dye is also influenced by other factors like the shape and the carbon nanostructure dimension. The one dimension of CNTs allows them to have an arrangement (entangled), which produce different available sites for adsorption. In 2D carbon materials the available sites for adsorption only are found on the external surface and maybe in the interplanar space, while in 3D materials these available sites are reduced due to the macrostructure.
In spite of different parameters discussed before, such as surface area, functional groups in the surface, dimension of carbon material, and carbon form, they produce different adsorption capacities in carbon materials to remove RR2 in water; the adsorption experimental data of RR2 on all carbon materials were well fitted to the pseudo second-order kinetic model.
Even though only two materials show slight photocatalytic activity, these results give evidence that GEO and GE (chemically reduced) could be researched deeply as photocatalyst to remove some organic pollutant in water as it has been demonstrated very recently in other researches (Bustos-Ramirez et al., 2015). The adsorption results suggested that CNTs, OCNTs, and GEO can be considered as alternative adsorbents of cationic and anionic dyes and other organic contaminants with aromatic structure from wastewater. The nature of the different organic contaminants and the carbon materials could be modified with the pH to improve the interaction between them.
Footnotes
Acknowledgments
The authors thank INB-UNAM and Ms. María de Lourdes Palma Tirado for her assistance in TEM; CINVESTAV Querétaro, Dr. Sergio Jiménez, and Mr. Francisco Rodríguez for their assistance in micro-Raman spectroscopy; Dr. Genoveva Hernández Padrón for her assistance in spectroscopy technique; and CG-UNAM, Dr. Arturo Gómez Tuena, and Mr. Manuel Albarrán Murillo for their assistance in the graphite milling. Article in memoriam: Dr. Adolfo M. Espíndola-González (1977–2014).
Author Disclosure Statement
No competing financial interests exist.