
Abstract
Abstract
The frequency and severity of extreme weather-related episodic events have increased in recent years. These ephemeral events have been shown to dramatically change water column conditions in affected aquatic systems. Impacts of a representative storm event in New York's Hudson River (HR) and Estuary (HRE) are evaluated. Hurricane Irene struck the United States Atlantic Coast in August 2011with heavy rainfall throughout the HR watershed as it moved inland. Using automated sensor systems, the River and Estuary Observatory Network characterized the watershed impacts of this event on hydrodynamics, and sediment transport in the HRE. Recorded data showed dramatic increases in stream discharge (e.g., from 110 to 3300 m3/s at Cohoes, NY), especially in the upper HR, and changes in hydrodynamic conditions throughout the HRE (e.g., an order of magnitude increase in water current velocities, continuous downstream flow irrespective of tidal stages). Storm-related sediment load represented a major portion of the estimated total annual load. Contribution of episodic events to mobilization and transport of sediment-bound contaminants (e.g., polychlorinated biphenyl) from the HR superfund site was demonstrated through observed changes in suspended sediment size distribution and rapid increases in bed shear stress (e.g., from 0.2 to 4.4 N/m2 at Fort Edward, NY). Strong, Irene-induced flood currents prevented sediment resuspension normally associated with flood tides in estuarine river reaches. This study provided critical insight with respect to hydrodynamic and sediment dynamic variability during episodic events for improved transport modeling and impact evaluation of the HRE.
Introduction
I
Tropical storm Irene, ranked as one of the costliest storms in U.S. history, passed along the Northeast coast of the United States on August 28–29, 2011 (NOAA, 2012) and produced intense precipitation and flooding in the Hudson River watershed (Ralston et al., 2013). Irene first struck the United States as a category 1 hurricane in eastern North Carolina, then moved northward along the Mid-Atlantic Coast before making final landfall as a tropical storm in the New York City area. Irene-associated precipitation events equaled a 200-year flood event in some parts of the watershed (Yoon and Raymond, 2012). In this article, we evaluated impacts of this event on changing hydrodynamics and sediment transport throughout the Hudson River and Estuary (HRE).
The HRE is separated at the Troy Dam into two hydrodynamically distinct regions (Fig. 1) including the Lower Hudson River (LHR), a tidally influenced reach extending 243 km from the Battery at the southern end of Manhattan to Troy, New York (Blumberg and Hellweger, 2006), and the freshwater Upper Hudson River (UHR) reach, upstream of Troy. It is estimated that the UHR accounts for 70–80% of the freshwater flow and sediment supply to the HRE (Wall et al., 2008). Any significant flooding event in the UHR, therefore affects environmental conditions of the LHR.
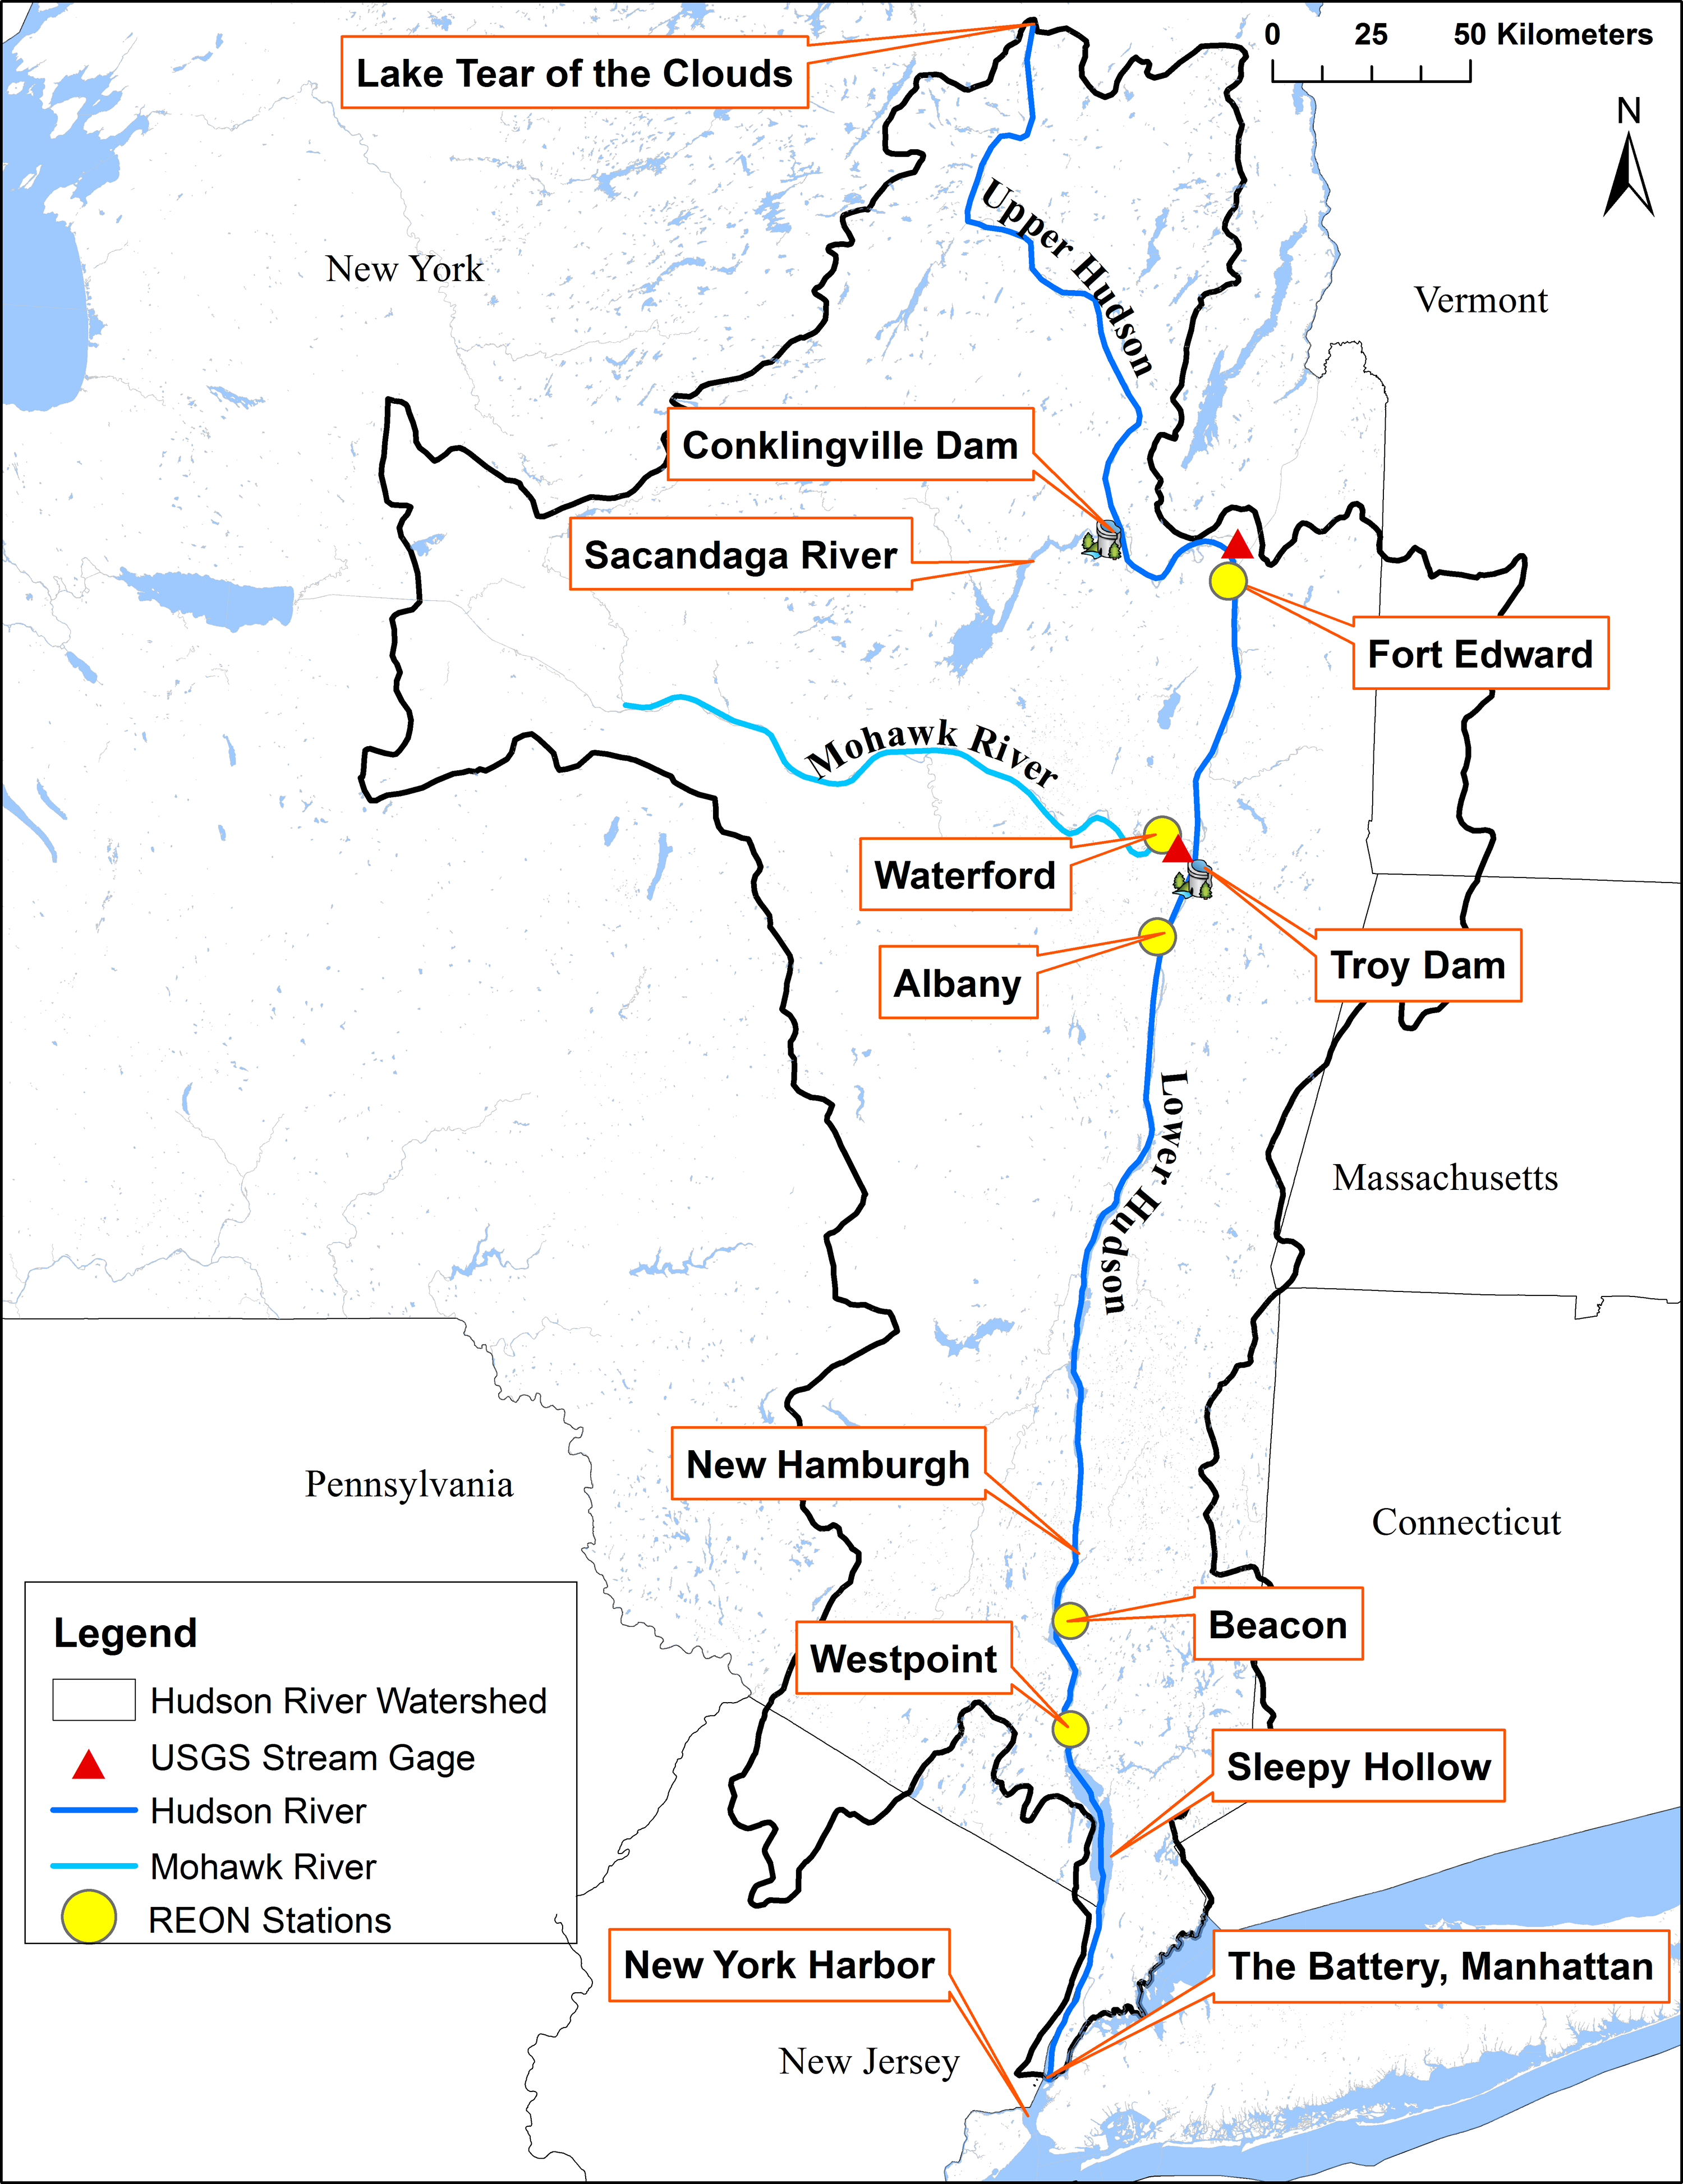
Study area and major geographic features of the HRE, and locations of REON and USGS monitoring stations. HRE, Hudson River and Estuary; REON, river and estuary observatory network; USGS, United States Geological Survey.
The riverbed of the Hudson River near Ft. Edward, New York was contaminated with polychlorinated biphenyls (PCBs) due to waste water discharges from two capacitor manufacturing plants between1947 and 1977. Being a dense nonaqueous phase liquid, much of the contamination was sequestered in the river sediments near Fort Edward (NY). Water velocities near the bottom boundary layer during elevated river flow events in the mid-1970s were found to resuspend PCB-contaminated sediments at hotspots in the UHR with subsequent transport to the downstream locations (USEPA, 2012). Thomann et al. (1991) reported that long-term, chronic releases of PCBs from the sediments accounted for the PCB inventory in the water column. Islam et al. (2011c) pointed out sediment resuspension and advection as potential mechanisms for sediment and sediment-bound PCBs transport during a flood event. The observations have demonstrated the need to quantify both bed shear stress and suspended sediment dynamics to better evaluate the environmental impact of extreme events.
Miller (2013) also showed that tropical storms Irene and Lee were responsible for significant sediment loads from a combination of freshly eroded sediments and resuspension of benthic sediments and suggested the potential for impacts on critical ecological functions in ecologically sensitive benthic habitats including fish spawning and nursery, foraging, and water quality. Considering these factors, Miller (2013) emphasized the need for research to characterize sediment transport dynamics, especially during extreme weather-related episodic events, in support of HRE Habitat Restoration Plan development. Sediment deposition along navigational channels, between Fort Edward and the Battery-Manhattan (Fig. 1) and subsequent remedial dredging was also noted as a potential impairment to the HRE.
Numerous modeling studies have been conducted to understand both short and long-term effects of extreme episodic events on hydrodynamics and sediment transport in the HRE (Wall et al., 2008; Orton et al., 2012; Ralston et al., 2013). Orton et al. (2012) examined the role of physical processes in controlling total water level variations along the LHR during severe storms. However, the relative role of physical processes in changing water current structure, especially bottom shear stress, which determines the fate and transport of sediment and associated contaminants in the waterbody were not evaluated. Ralston et al. (2013) investigated the fate and transport of terrigenous sediment to the LHR during two tropical storm-driven major flow events, and showed that two-thirds of the new sediment remained trapped in the tidal freshwater river more than 1 month after the storms. Uncertainty in the model boundary conditions due to lack of observational datasets (Ralston et al., 2009), especially during extreme episodic events, undermined credibility of the model results. These and other previous studies evaluated impacts of an extreme episodic event either on LHR or UHR, but none investigated the resulting changes of hydrodynamic and environmental conditions in the entire HRE due to this type of extreme episodic event.
River and Estuary Observatory Network (REON)-measured high frequency datasets collected during Irene provided an opportunity to characterize hydrodynamic and sediment transport variability in the entire HRE to expand our knowledgebase and improve models used to assess the overall impacts of these types of extreme episodic events on the waterbody. In this article, our investigation of Irene's impact on the HRE addressed the following objectives:
• quantified freshwater flux to UHR due to this flooding event and subsequent effects on hydrodynamic conditions of both the UHR and LHR; • analyzed the relative contributions of freshwater influx and tidal forces in controlling the net direction of water movement in the LHR; • compared the sediment load generated by Hurricane Irene to the overall annual load, and characterized sediment transport dynamics in the waterbody to shed light on the transport of contaminants (e.g., PCBs) adsorbed to sediment particles; • determined how high freshwater influx changed bed shear stress and contributed to sediment resuspension events; discussed their implications on buried sediment and associated PCBs contaminant transport in the water column; • evaluated Irene's effects on salinity and suspended sediment concentrations (SSCs) in the estuarine section of the HRE.
Description of the Observatory Network
It has been recognized that routine monitoring programs fail to sample at sufficiently high frequencies to capture the transitory effects associated with episodic events. Manual monitoring techniques in severe weather conditions have generally been considered infeasible. REON has addressed these shortcomings in the HRE through the development and application of a network of integrated sensors, robotics, and computational technology distributed throughout the river. Data presented in this article were acquired from three sensor platform types: (i) FRVP, (ii) MRUP, and (iii) FADCP. The fixed robotic vertical profiler (FRVP) periodically casted a water quality sensor suite vertically through the water column to measure water temperature, salinity, dissolved oxygen, particle concentration and size distribution, and fluorescence. The FRVP operation has been described in detail in Islam et al. (2010a). The mobile robotic undulating platform (MRUP) utilized an instrumented undulating tow-body (SeaSciences, Inc.; Acrobat) tethered behind a research vessel to measure the same set of water parameters captured by the FRVP, but did so “synchronically” over a highly resolved spatial regime (Islam et al., 2011a). The water quality sensors supported on the FRVP and MRUP included a particle size analyzer (LISST; Sequoia Sciences, Inc.); a dissolved oxygen sensor (Optode; Xylem, Inc.); a conductivity, temperature, and depth sensor (SBE 37 SIP ‘‘Microcat’’; Sea-Bird Electronics, Inc.); and an optical backscatter (OBS) sensor (BB-FL2; WET Labs, Inc.). Along with the water quality sensors, 1200 KHz downward-looking acoustic doppler current profiler (ADCP) was mounted on FRVP and MRUP to measure vertical profiles of water velocity and acoustic backscatter intensity (ABS) that was used as a surrogate measurement of suspended particle concentration (Gray and Gartner, 2009; Fuller et al., 2013).
Sensor sampling protocols varied depending on the sensor and deployment platform type. ADCPs on the FRVP and fixed acoustic doppler current profiler (FADCP) measured water velocity profiles every minute from an ensemble of 45 pings, whereas ADCPs on the MRUP collected data every 30 s from an ensemble of 30 pings. Water quality sensors on the FRVP measured hourly variation of water quality parameters at five different depths (∼20% depth interval). FADCPs were deployed for year-round monitoring, whereas the FRVPs were deployed spring through fall, and decommissioned before river ice formation. REON platforms were installed at locations indicated in Fig. 1 (solid yellow circles) with specific location information provided in Table 1. Stream flow data used in this study were obtained from two USGS (United States Geological Survey) stream-gauging sites indicated in Fig. 1 (red triangles).
HRE, Hudson River and Estuary; FADCP, fixed acoustic doppler current profiler; FRVP, fixed robotic vertical profiler; LHR, lower Hudson River; PCB, polychlorinated biphenyls; USGS, United States Geological Survey; UHR, upper Hudson River.
Data Quality Assurance and Quality Control
Each monitoring platform along with the sensor suite was tested in waterbodies in proximity to our research laboratory at Clarkson University, NY before their target deployment in the HRE. Test deployments facilitated any needed troubleshooting and provided the opportunity to verify the performance of each component and sensor. Both automated and manual methods were employed in a four-tiered process to maintain data quality from monitoring nodes in the REON. At the first tier, predeployment laboratory calibrations were performed on each instrument. In the automated second tier, postprocessed results were filtered to remove outliers and improperly formatted data. At the third tier, filtered data were visually inspected through our web site in near real-time on a daily basis. Any observed data anomalies were subjected to detailed analysis (e.g., spatial-temporal analysis, sensor synergy) and if necessary, any questionable sensors were inspected, cleaned, and recalibrated or replaced as necessary. At the fourth tier, data were periodically verified through comparison of data collected at two different systems (i.e., MRUP and FRVP). This was accomplished using a MRUP sensor package that was essentially colocated with a FRVP, and the two systems were operated simultaneously. When the difference between the MRUP and FRVP measurements did not agree within three standard deviations of the MRUP measurements, then those FRVP measurements were marked as questionable and were not used in data analysis.
Methodology
Surrogate relationships between OBS sensor measurements and SSC were developed in laboratory calibrations. Field-measured SSCs may have differed from actual values due to OBS response dependencies on particle size, shape, type, and other factors. To evaluate impacts of variable hydrodynamic conditions on river bed sediment scour in response to Irene-associated precipitation events, bed shear stress, τ, was estimated from water velocity measurements assuming fluid velocity in turbulent flow at a certain point is proportional to the logarithm of the distance from that point to the “wall” or boundary of the fluid regions (Wilcock, 1996; Cheng et al., 1999), and expressed as
where, u* = (τ/ρ)1/2, ρ = fluid density, u = time-averaged streamwise velocity at height z above the bed, z0 = bed roughness length, and k = von Karman's constant (taken to be 0.40). Equation (1) was applied within a near-bed region well below the free surface and above the local influence of individual bed roughness elements (Wilcock, 1996). However, logarithmic velocity profiles were found to closely approximate velocity throughout the flow depth under steady uniform subcritical flow conditions (Ferro and Baiamonte, 1994). Generalizing the depth of the near-bed region, where the eqn (1) applies, was not possible due to the site-specific variability in hydrodynamic and geomorphologic conditions. Researchers have taken a site-specific approach and considered different proportions of flow depth as the near-bed region [e.g. 15% in Bridge and Jarvis (1997, 1982); 20% in Bridge and Jarvis (1976); over 50% in Ferguson et al. (1989) and Ferguson and Ashworth (1992)]. In this study, near-bed shear stress was determined by analyzing velocity datasets measured in the lower 50% of the water column where observed velocity data followed a logarithmic profile. Ten vertical profiles of water velocities measured over 10 min were used to calculate bottom shear stress through fitting the least squares line [u vs. ln(z)].
REON monitoring datasets have been made publicly available in real-time using our existing cyber infrastructure as described in Islam et al. (2010b). We developed software using MATLAB toolboxes (The MathWorks, Inc.) to (1) query the REON observational database and extract datasets for the period of interest; (2) convert raw sensors responses into meaningful units through application of calibration coefficients; (3) remove outliers; and (4) generate contour plots to visualize temporal variability of measured parameters.
Results and Discussion
Irene resulted in near-record stream flows at many HR tributaries and caused massive flooding in several parts of the HR watershed (Yoon and Raymond, 2012; Orton et al., 2012). Waters draining from the UHR region have been described as generally “flashy” due to large inputs of precipitation at higher elevations and limited water storage as a result of shallow surface material deposits (Chen et al., 1984). Flows in the LHR have been characterized as tidally dominated under normal conditions. REON datasets, presented in the following sections, have provided valuable insights regarding the impacts of Irene and similar weather-related episodic events on both the UHR and LHR.
Impacts on hydrodynamics at the UHR
The effects of tributary inflows from the Sacandaga and Mohawk Rivers, resulting from Irene's >150 mm of precipitation (Dhillon and Inamdar, 2013), on the UHR were evaluated. The USGS stream gauging station (#01357500) on the Mohawk River at Cohoes, NY (Fig. 1, red triangle), 2 km downstream from the REON site at Waterford, NY, showed that stream flow rates increased by a factor of ∼30 over pre-Irene flows (i.e., from 100 to 3300 m3/s) between August 26 to Sept 3, 2011 (Fig. 2).
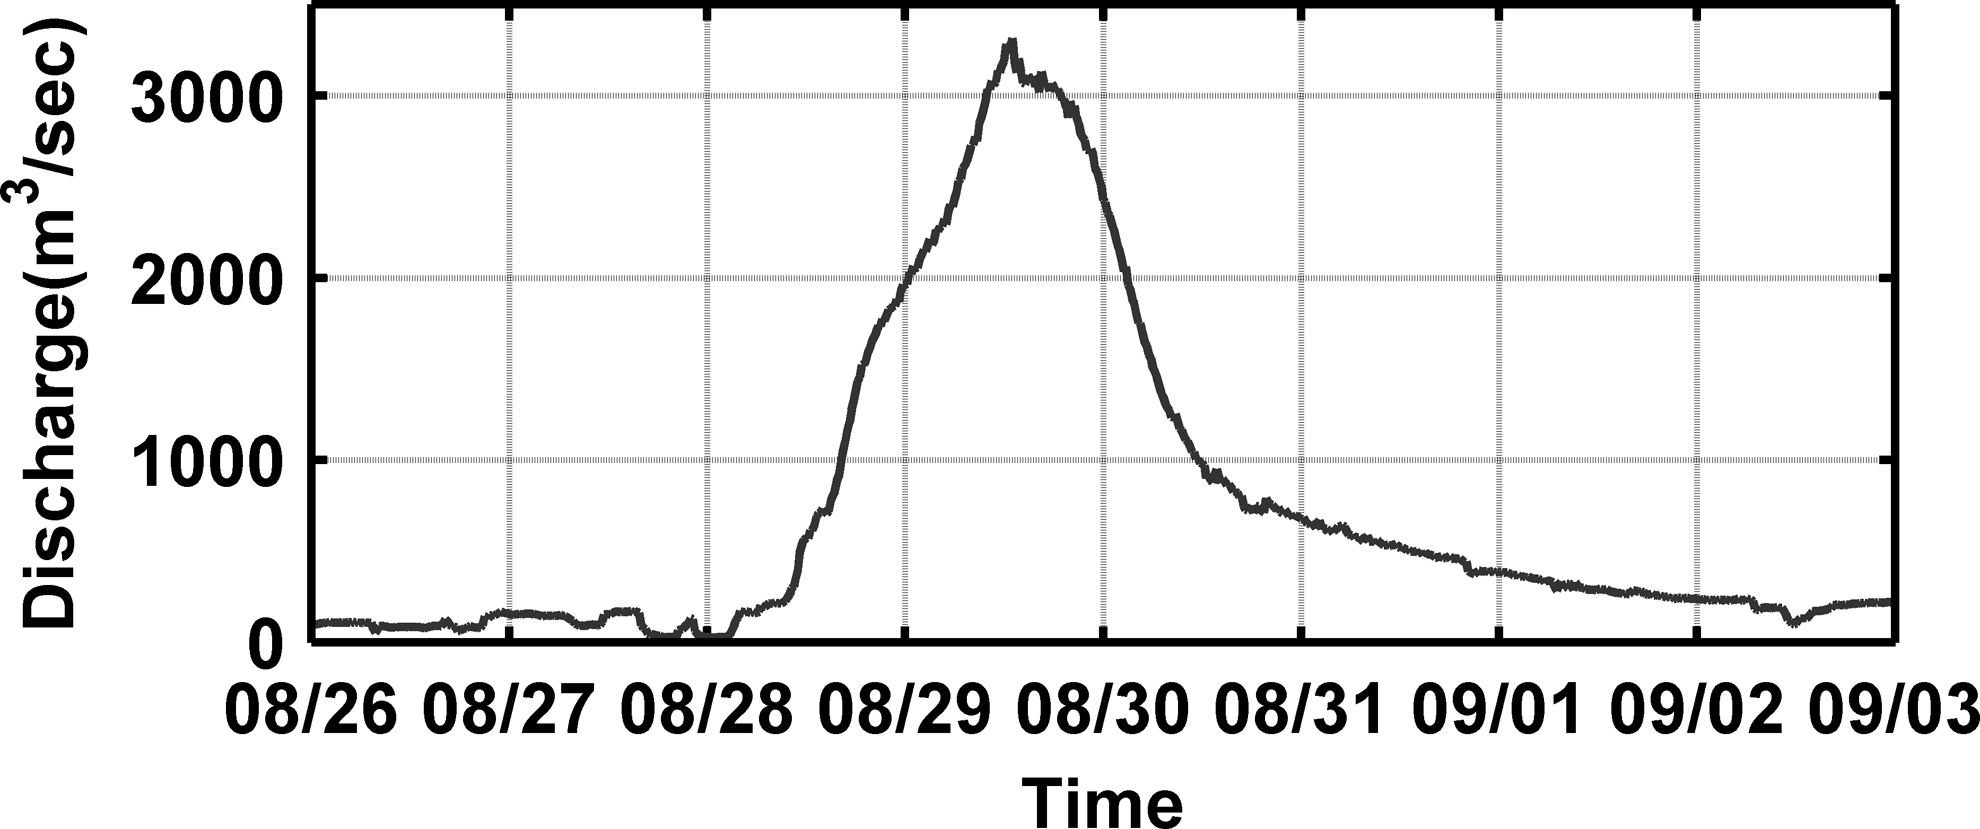
Mohawk River flow observations from USGS stream gauging station (#01357500) at Cohoes, NY located 2 km downstream from REON Monitoring site at Waterford, NY for period August 26 to September 03, 2011.
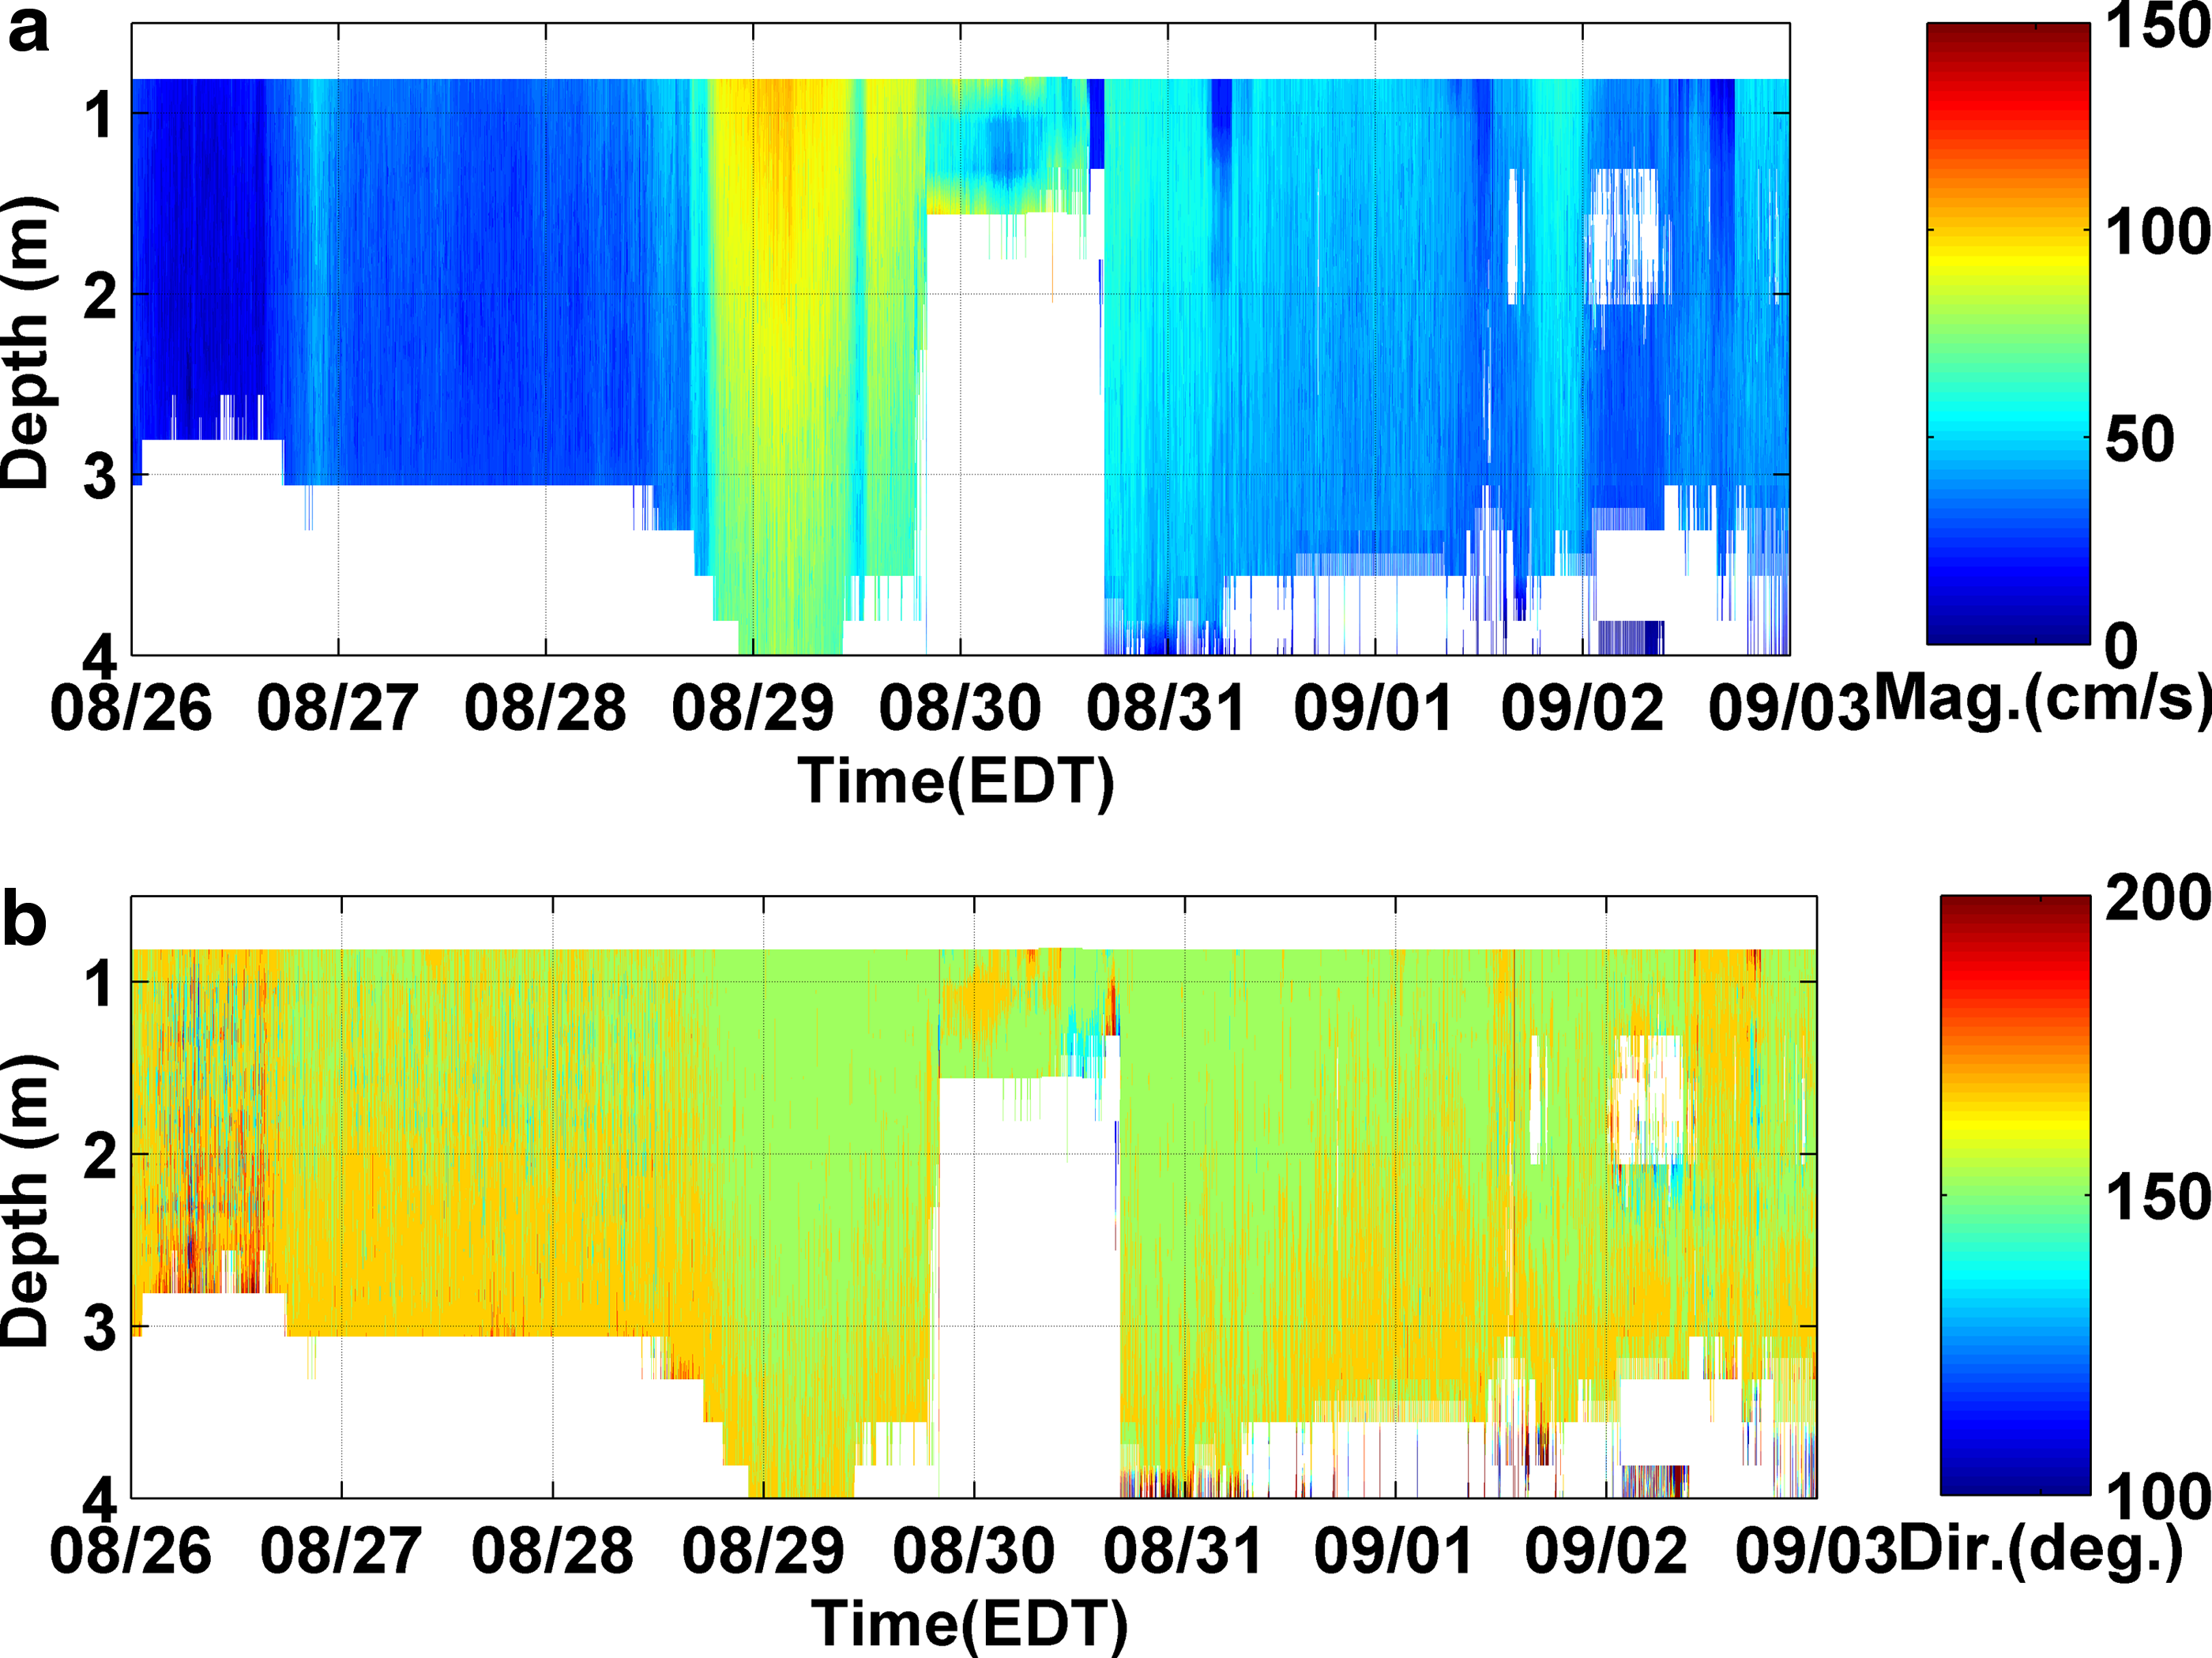
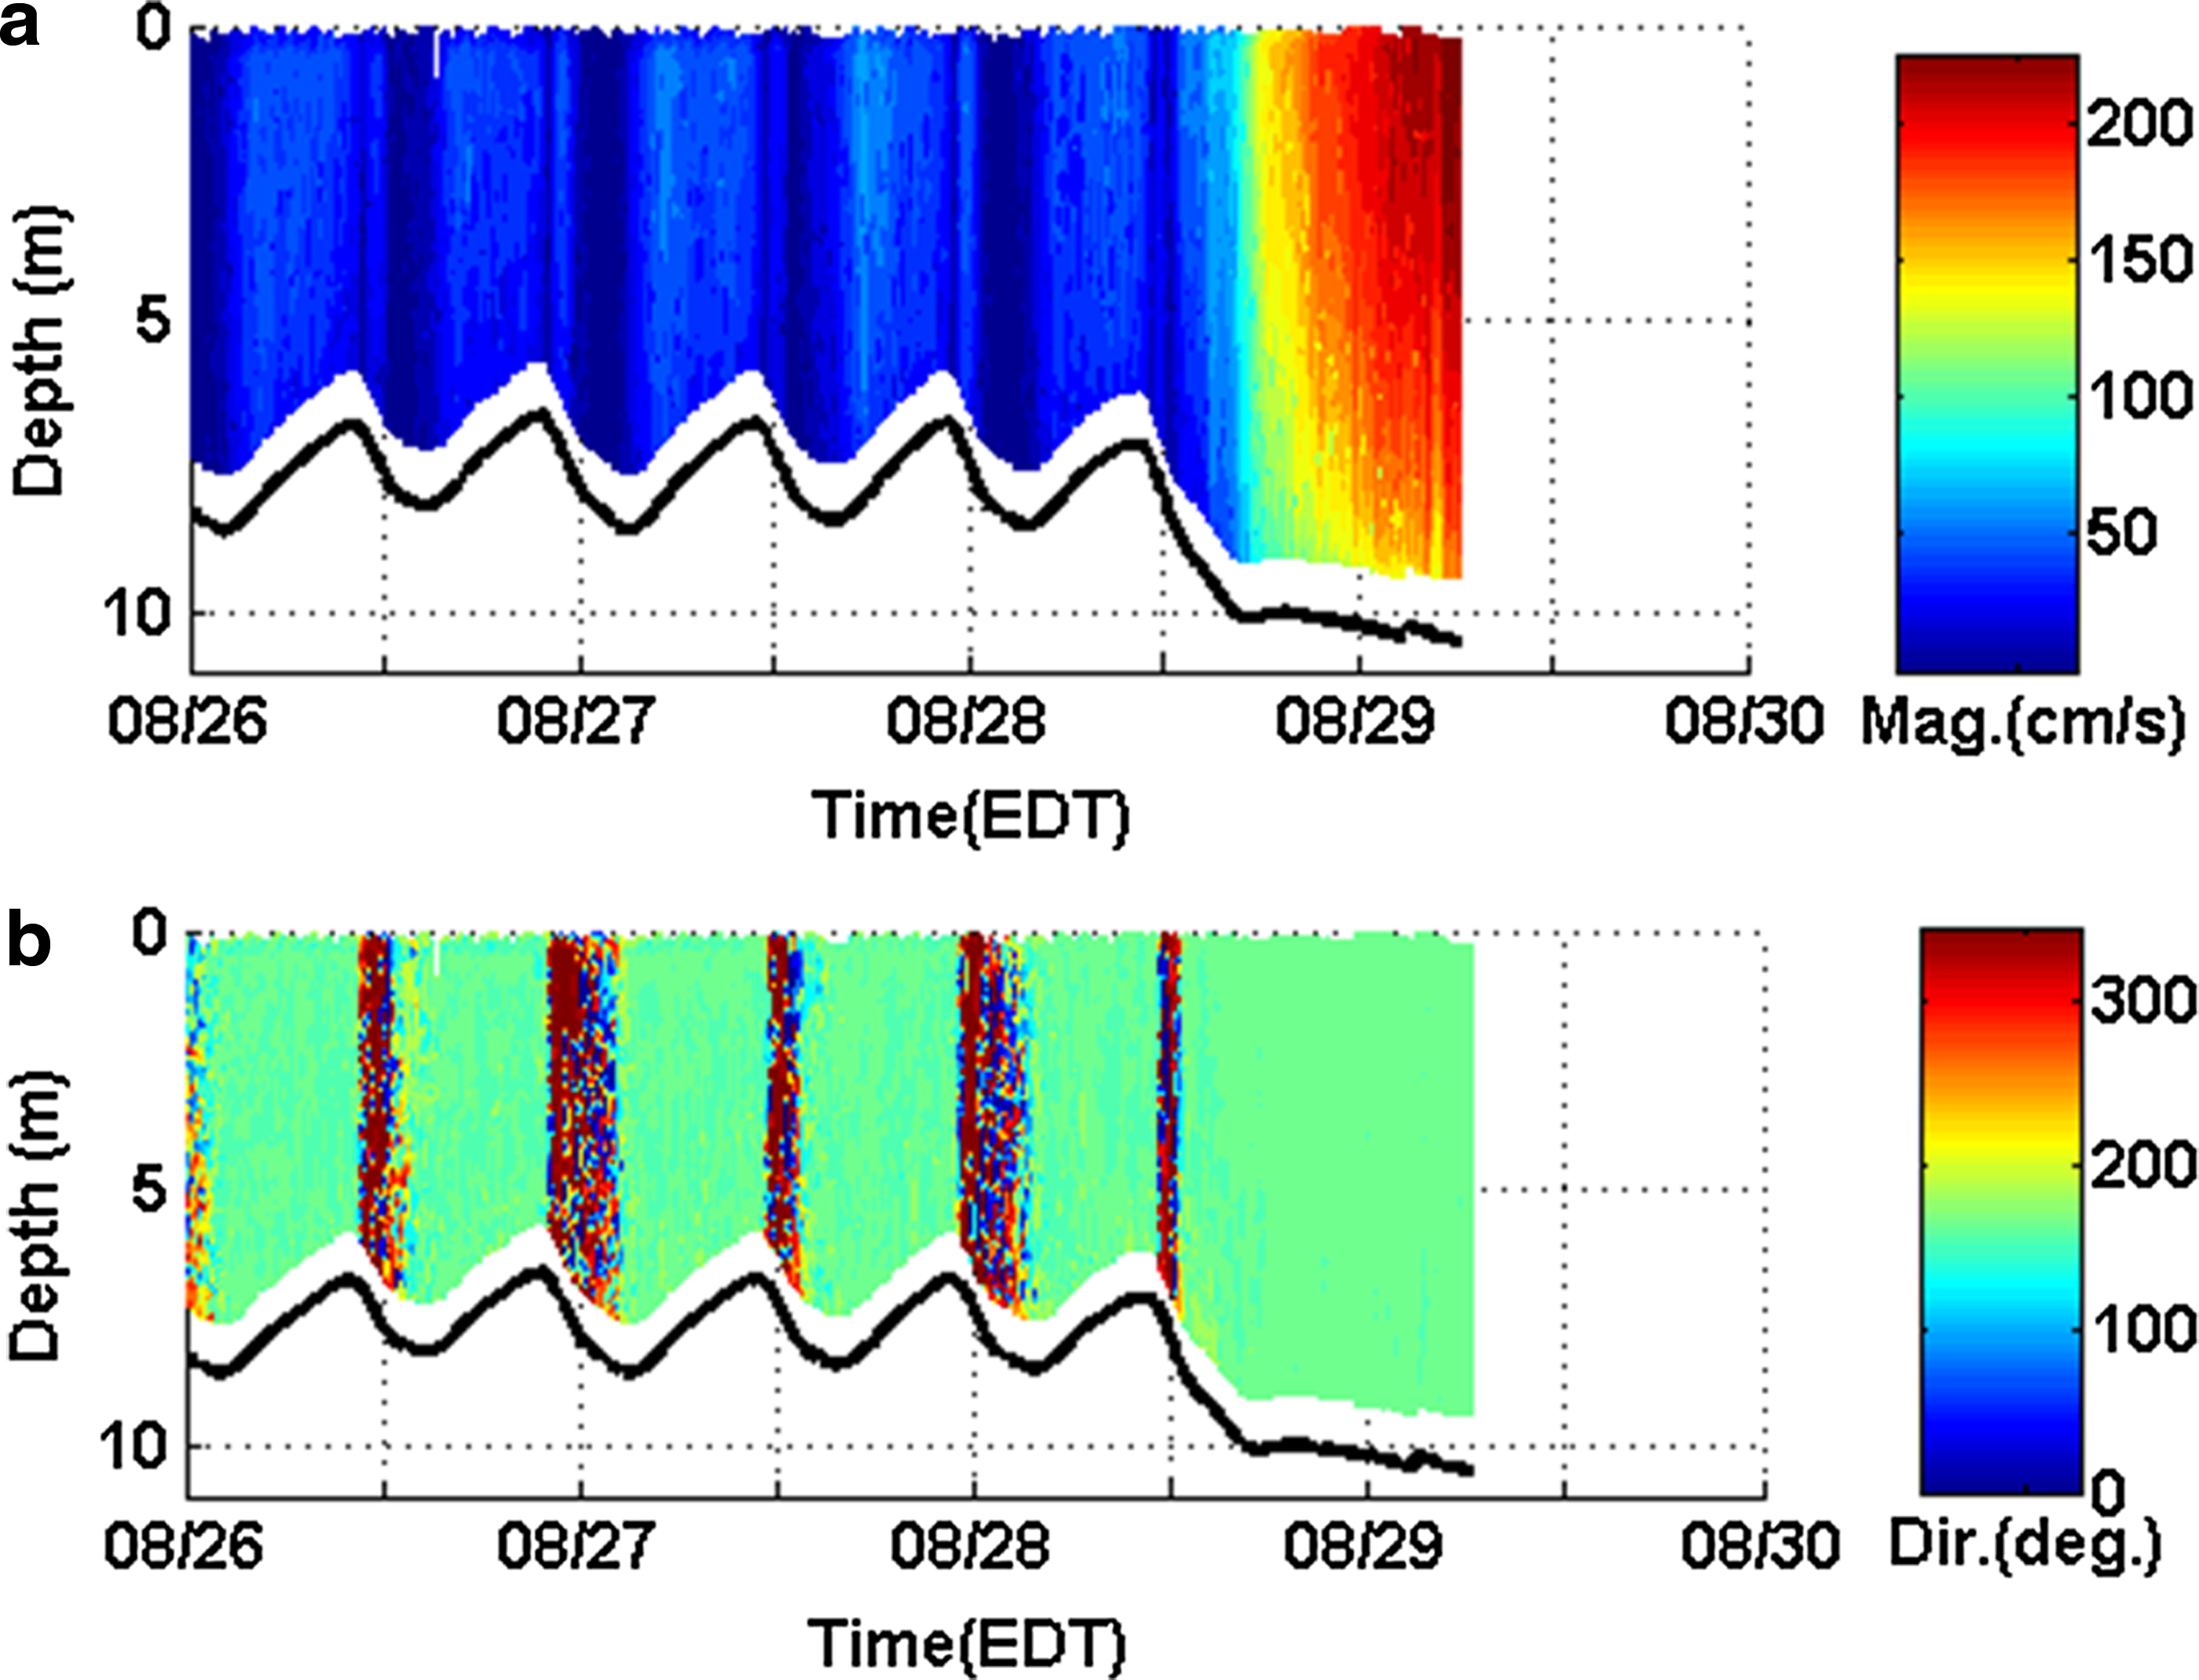
This sudden flow increase had pronounced impacts on the hydrodynamic conditions of the river. On August 29, water velocity showed a rapid increase (Fig. 3a) from 10 cm/s (blue contour) to 140 cm/s (red contour) in a downstream direction to the south (Fig. 3b, green contour). A maximum water velocity magnitude of 140 cm/s was recorded at ∼02:30, just before complete equipment loss, when the stream flow measured at the USGS gauge (#01357500) was ∼2200 m3/s. Thus, the maximum flow velocity was suspected to have been much higher when discharge peaked at 3300 m3/s (Fig. 2).
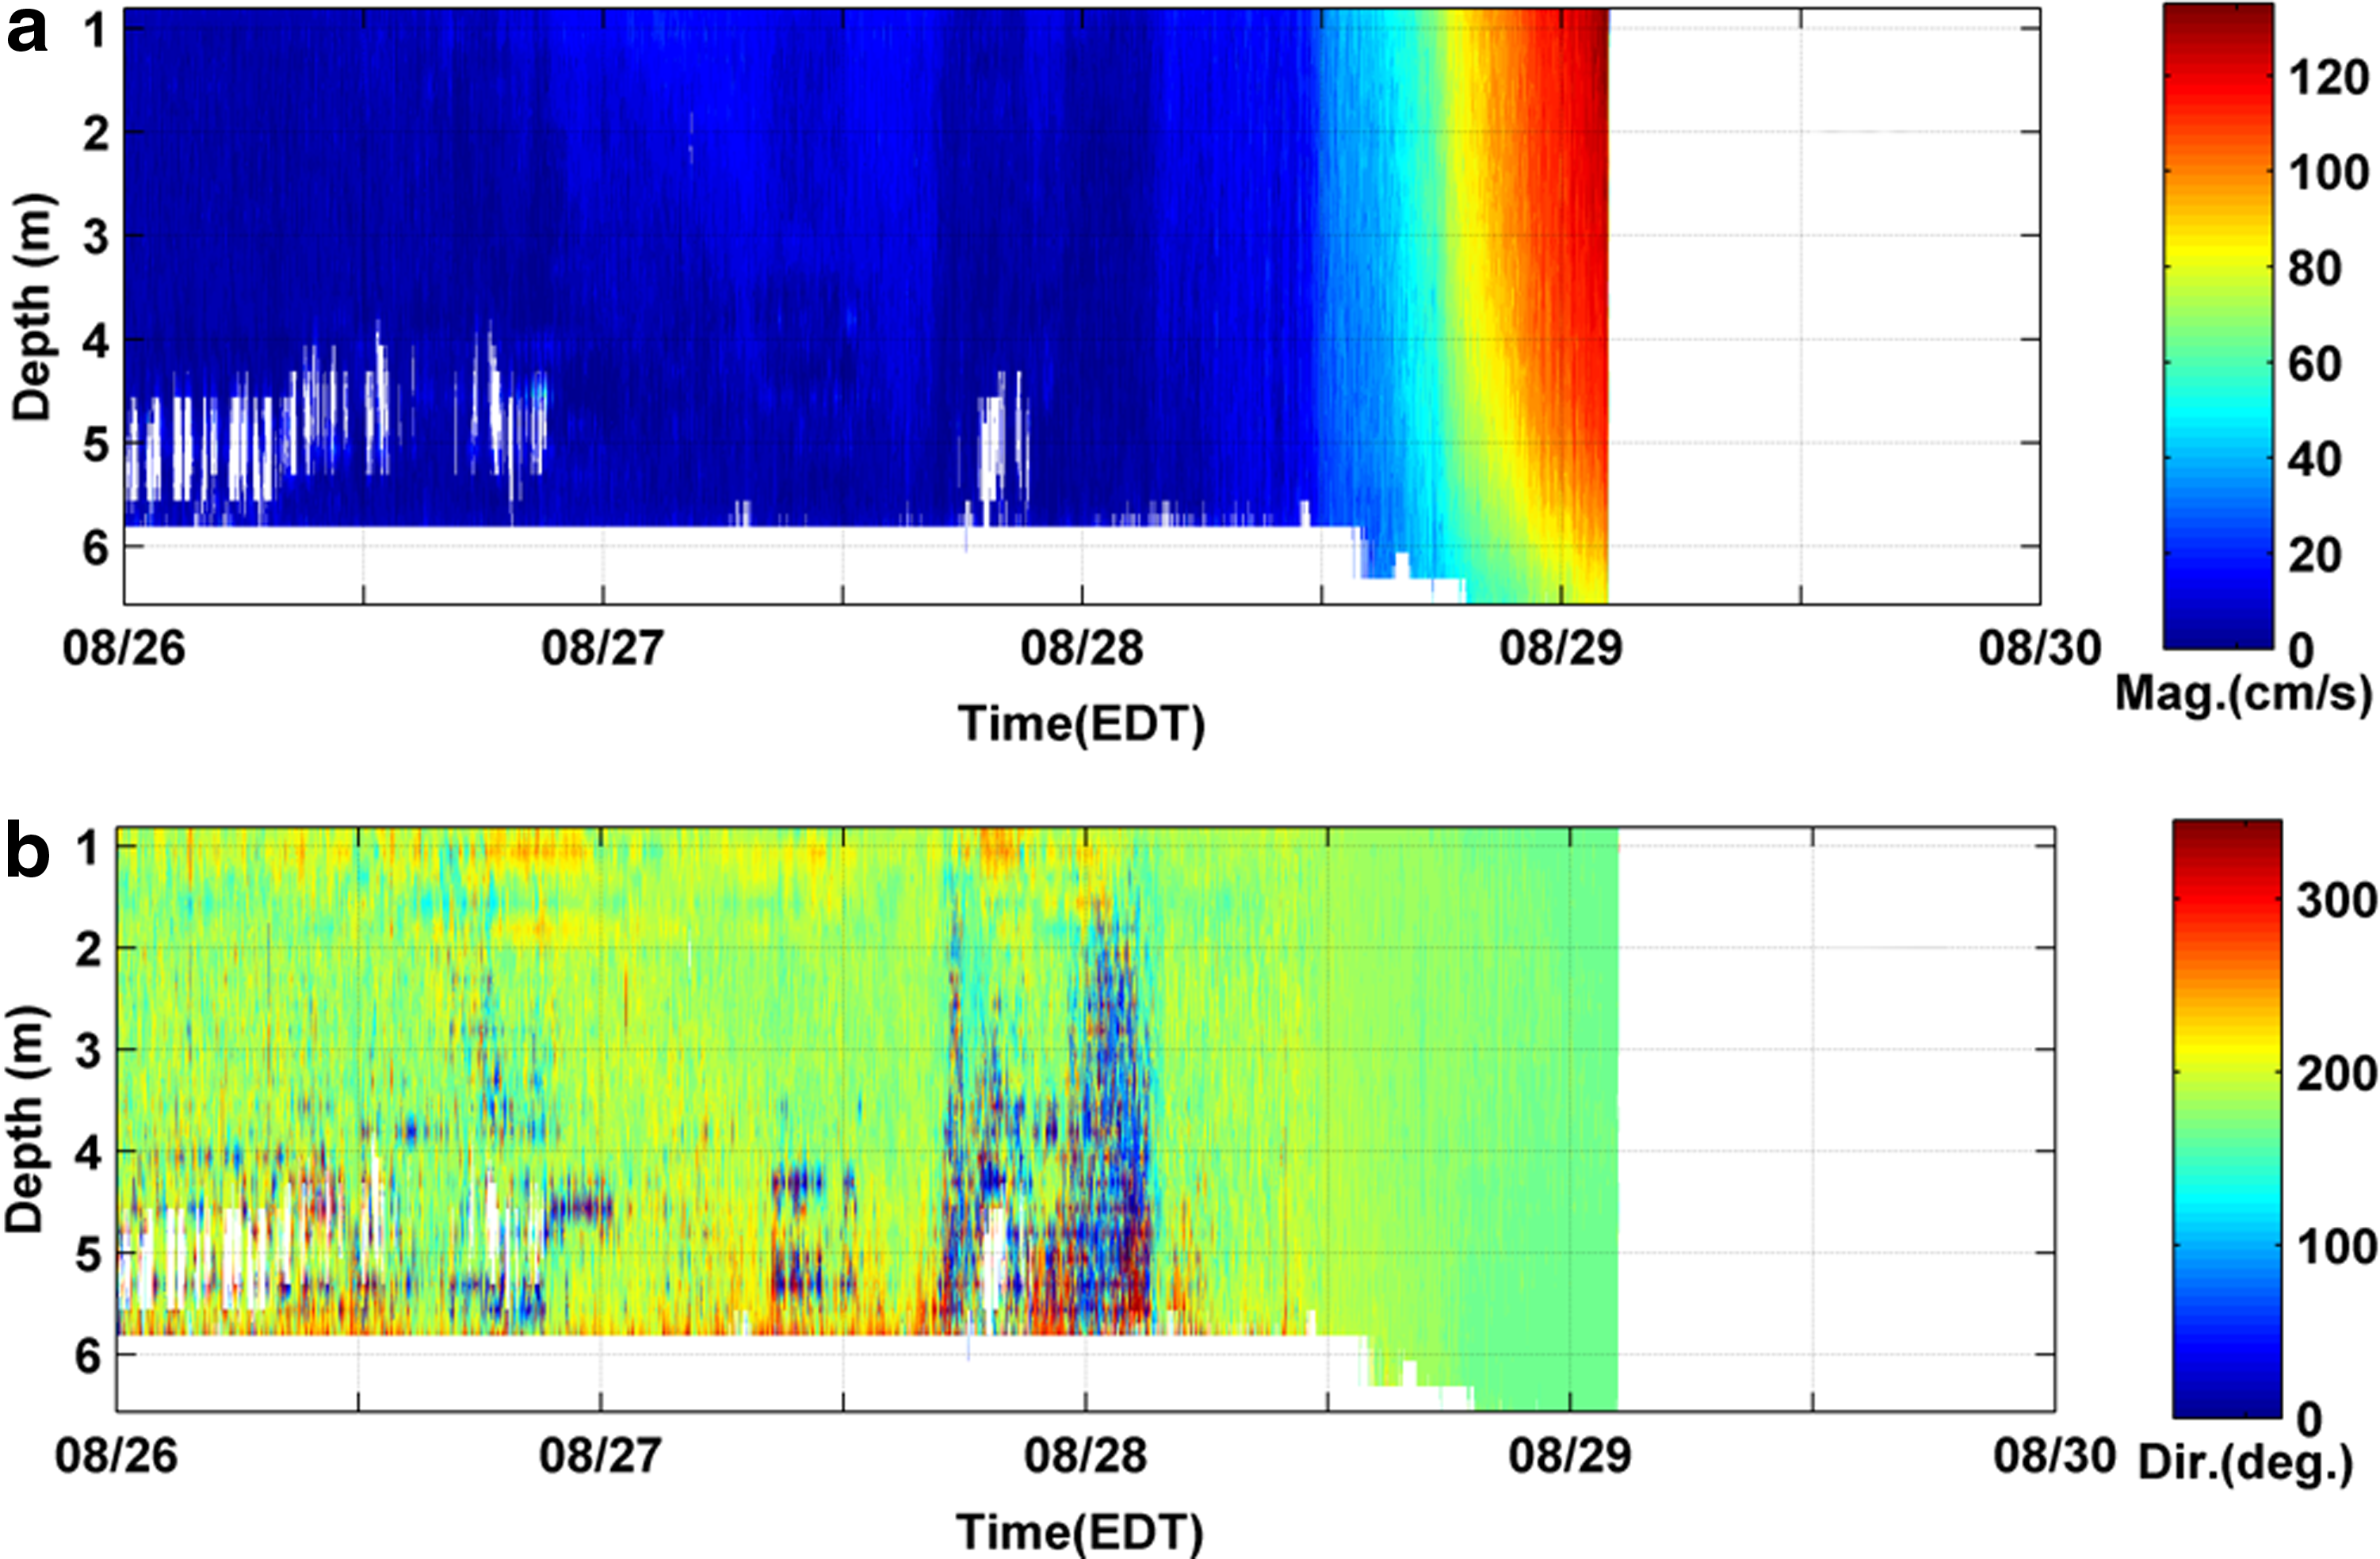
Vertical water velocity profiles from downward looking ADCP at REON monitoring site on Mohawk River at Waterford, NY for period August 26 to August 29, 2011:
The USGS stream gauging station (#01327750) at Fort Edward, NY (Fig. 1) recorded a relatively modest increase (factor 3×) in stream flow, from ∼200 to ∼600 m3/s in the main branch of UHR between August 27 and August 29 (Fig. 4). This observed change in stream discharge would have been much higher if the (upstream) Sacandaga Lake reservoir had not buffered the peak flow as suggested by a storm-induced average inflow of 567 m3/s into the reservoir on August 28 (HRBRD, 2011). The reservoir dampened stream flows did not increase until the evening of August 28 when the excess water was released from the reservoir with distinct changes to the river's hydrodynamic conditions as recorded at the REON monitoring station at Fort Edward. On August 28, there were concurrent increases in stream flow (Fig. 4) at the USGS station (#01327750) and water velocity magnitude from 20 (blue contour) to 90 (yellow contour) cm/s (Fig. 5a). Flow direction throughout the observation period was generally to the south, ∼160° from north, (Fig. 5b, green to yellow contour). The data gap between evening of August 29 and afternoon of August 30 (represented as blank spaces in Fig. 5) occurred due to obstruction of the ADCP acoustic beam path by an adrift dock that was lodged in the platform moorings. However, recorded quality-controlled data at the platforms (Figs. 2–5) provided evidence of dramatic changes in the UHR hydrologic and hydrodynamic conditions, which had profound impacts on sediment transport in the waterbody.
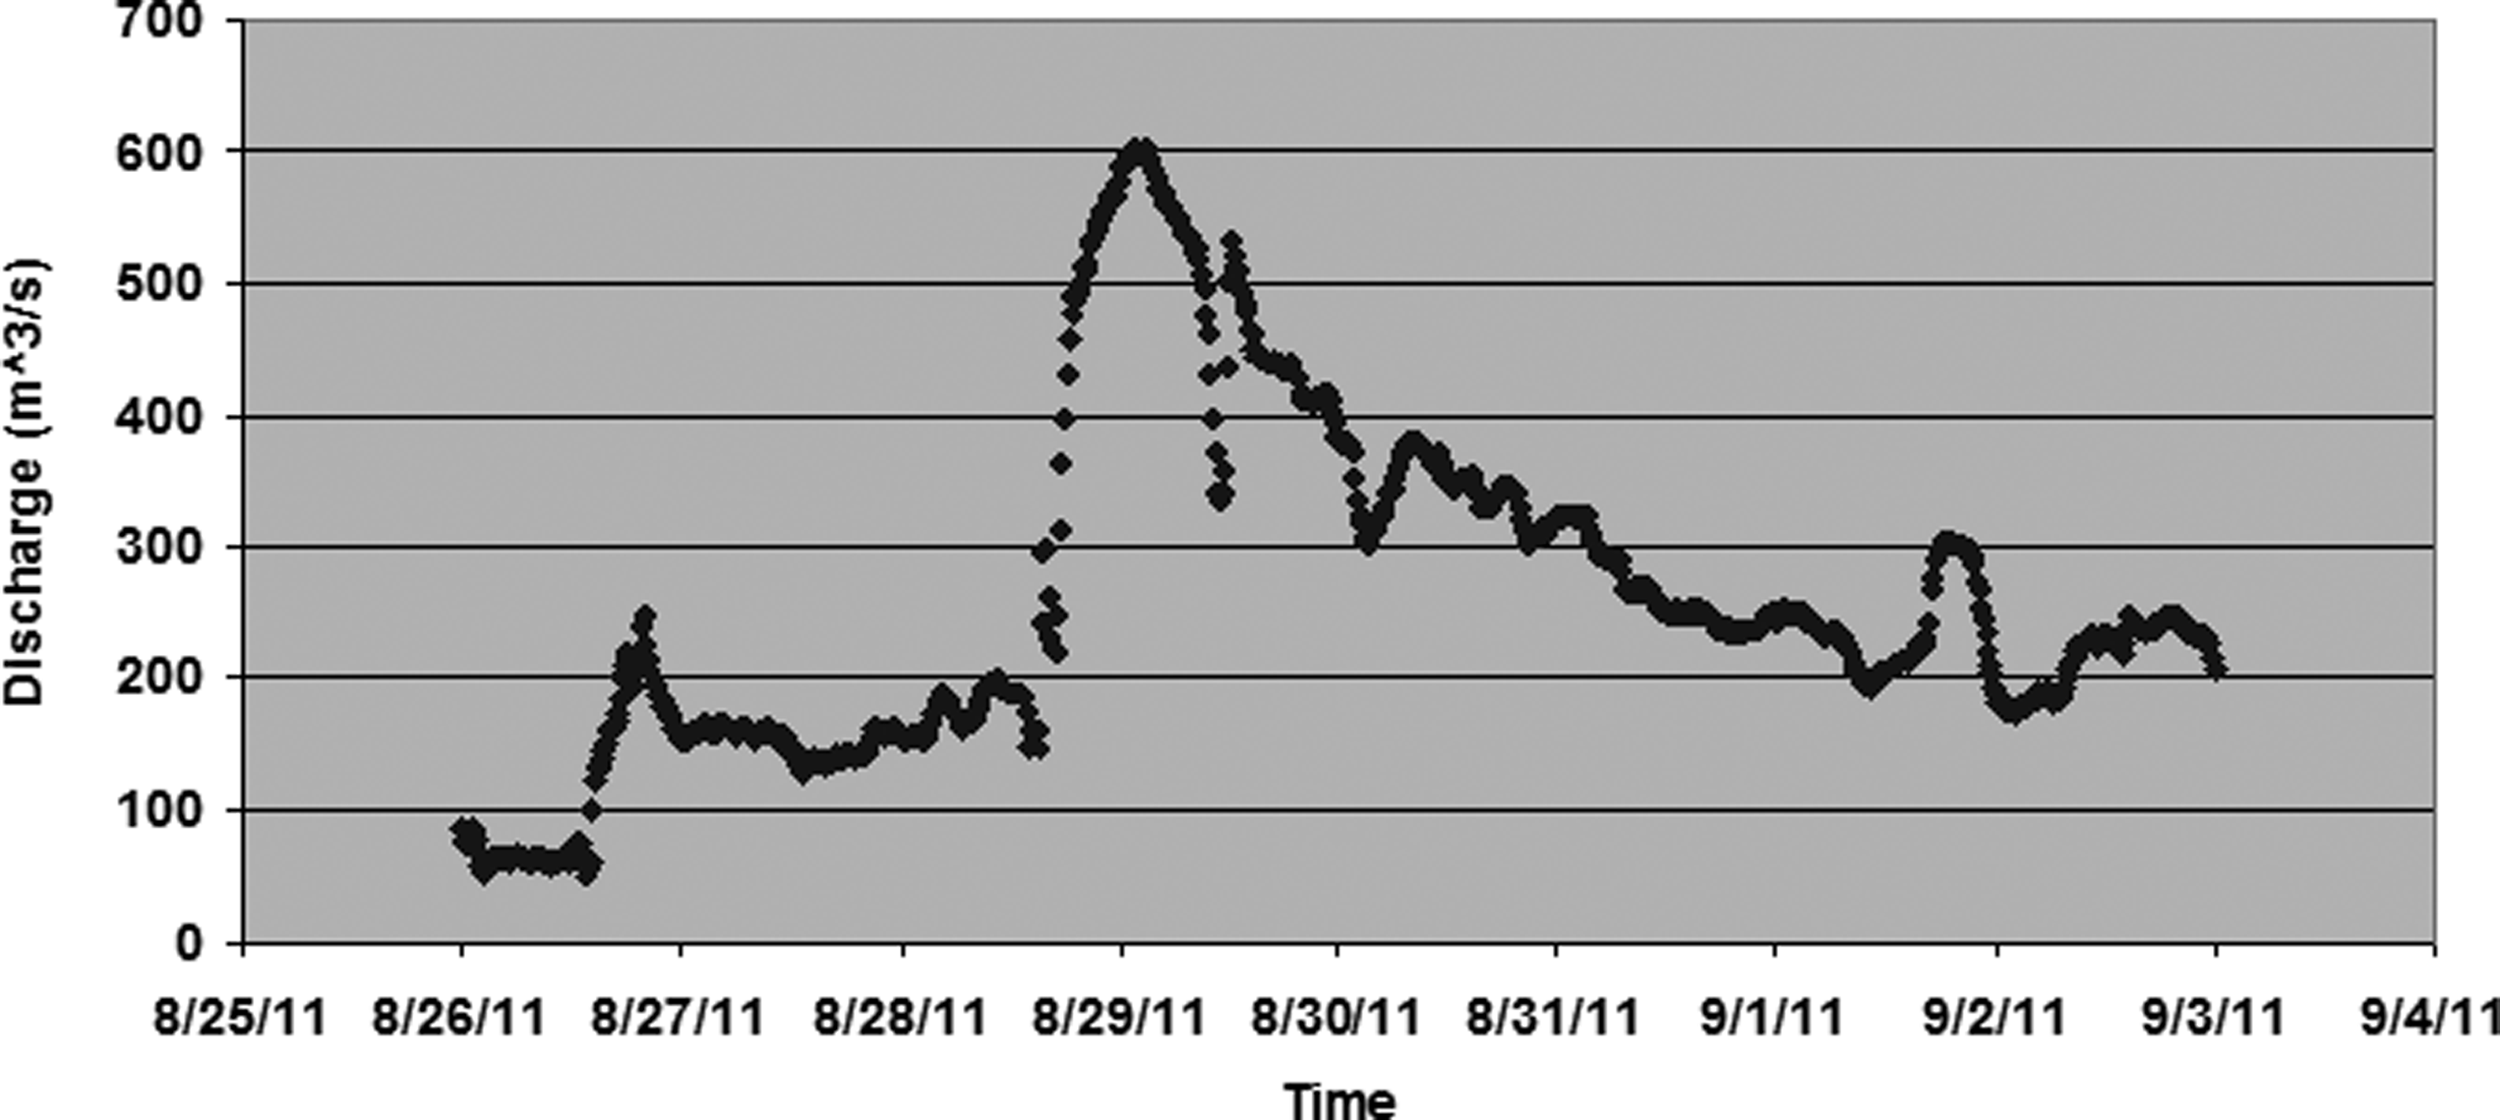
Hudson River flow observations from USGS stream gauging station (#01327750) at Fort Edward, NY for period August 25- September 03, 2011.
Vertical water velocity profiles from downward looking ADCP at REON monitoring site on Hudson River at Ft. Edward, NY for period August 29-September 03, 2011:
Impacts on sediment transport in the UHR
Strong turbulence associated with high water velocities were shown to carry contaminated bottom sediment from the UHR Superfund dredging site (Tofflemire et al., 1979). To assess exposure potentials of sediment-bound hydrophobic-contaminants (e.g., PCBs) it was necessary to characterize sediment dynamics during this episodic event. A time series plot of measured data at the Fort Edward, NY monitoring station showed coincident increases in particle concentration (denoted by blue line) and stream discharge (denoted by black line) during Irene (Fig. 6). Solid red circles indicated when the LISST sensor was cleaned and field-calibrated. Significant biofouling of the optical sensor (i.e., gradual accumulation of waterborne organisms on the sensor surfaces) was evident as a sharp decline in particle concentration after field-calibration on July 28. Measured particle concentration data indicated relative changes in water column particle concentrations as significant and concurrent spikes in both Irene-induced stream discharge (∼90 m3/s to 470 m3/s to 214 m3/s) and particle concentration (24 μL/L to 86 μL/L to 30 μL/L) occurred over a short time period. The effect of optical fouling on the LISST-100 response during the storm observation period was illustrated as a reduction in particle concentration to near prestorm concentrations following cleaning of lens on Sept 4 (Fig. 6, red circle). The suspended solids concentration was corrected by subtracting the biofouling contribution from the measured particle concentration data (Fig. 6). This modified concentration dataset was used to estimate the storm-related total sediment load as the sum of the sediment flux at the observation site over the time period when sediment concentrations exceeded prestorm concentrations. Sediment flux at each time interval was determined as the product of volumetric stream discharge; sediment volume concentration; sediment density (assumed 2,600 kg/m3); and length of the time interval. The total estimated sediment flux over the 4 day storm event was 9,700 metric tons, compared to 29,687 metric tons estimated from a 138-day deployment of our fixed robotic profiler in 2011 at Ft. Edward. Thus, the storm-related sediment flux that spanned approximately 1% of a year represented approximately 10% of the annual sediment flux at Ft. Edward.
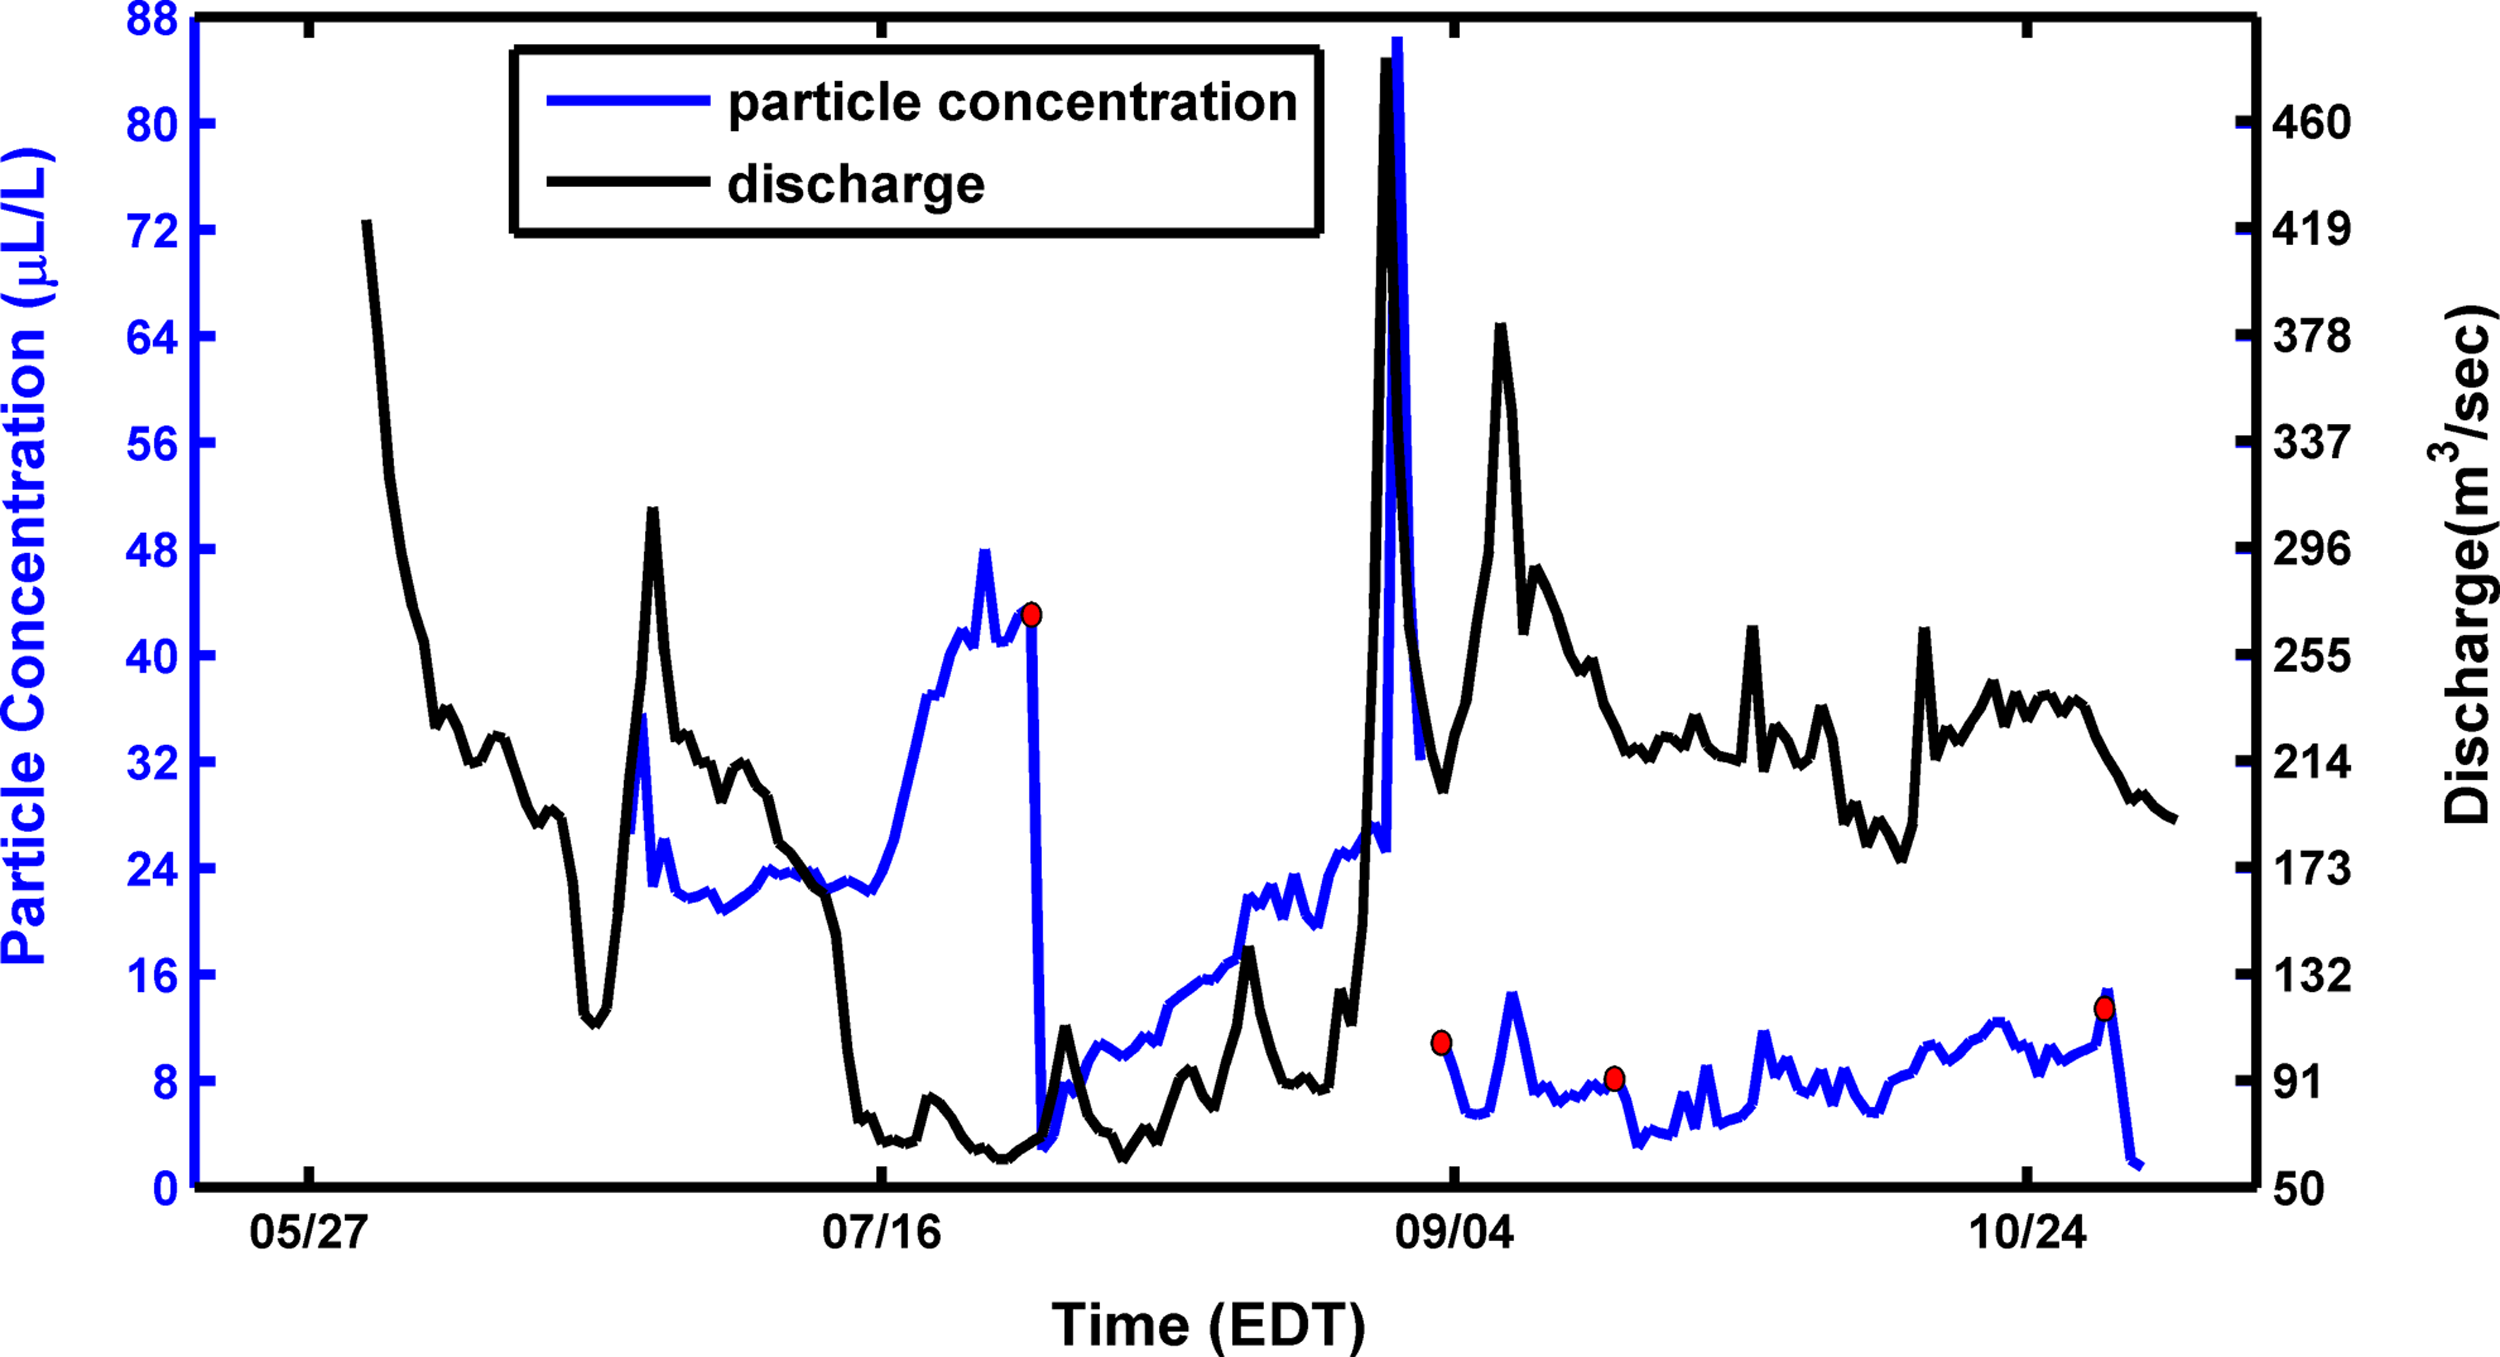
Hudson River stream discharge measured at USGS gauging station (#01327750) (black-line) and depth-averaged particle concentration (blue line) at Fort Edward, NY for the platform deployment time period in 2011. Note: red-colored solid circles denote the time when the LISST- sensor lens was cleaned and field-calibrated.
Vertical water quality profiles with the LISST (Fig. 7a) showed that SSCs increased rapidly from 20 to 110 μL/L. Similarly, the OBS sensor showed a spike in suspended particle concentrations (Fig. 7b) but was unable to resolve maximum particle concentrations that exceeded the OBS upper detection limit of 25 μL/L. Sediment resuspension may have contributed to the increased particle concentrations. Through application of ADCP velocity profiles to equation 1, bed shear stresses were calculated and compared to critical bottom shear stress to evaluate whether the turbulence in storm-induced flow was sufficient for sediment resuspension at Fort Edward, NY (Fig. 8a) and Beacon, NY (Fig. 8b). At Fort Edward, the bed shear stress increased from 0.2 to 4.2 N/m2 that coincided with increased SSCs (Fig. 7a, b) However, the elevated particle concentrations may have originated as influx of washed-out sediments from the watershed, as opposed to in situ resuspension.
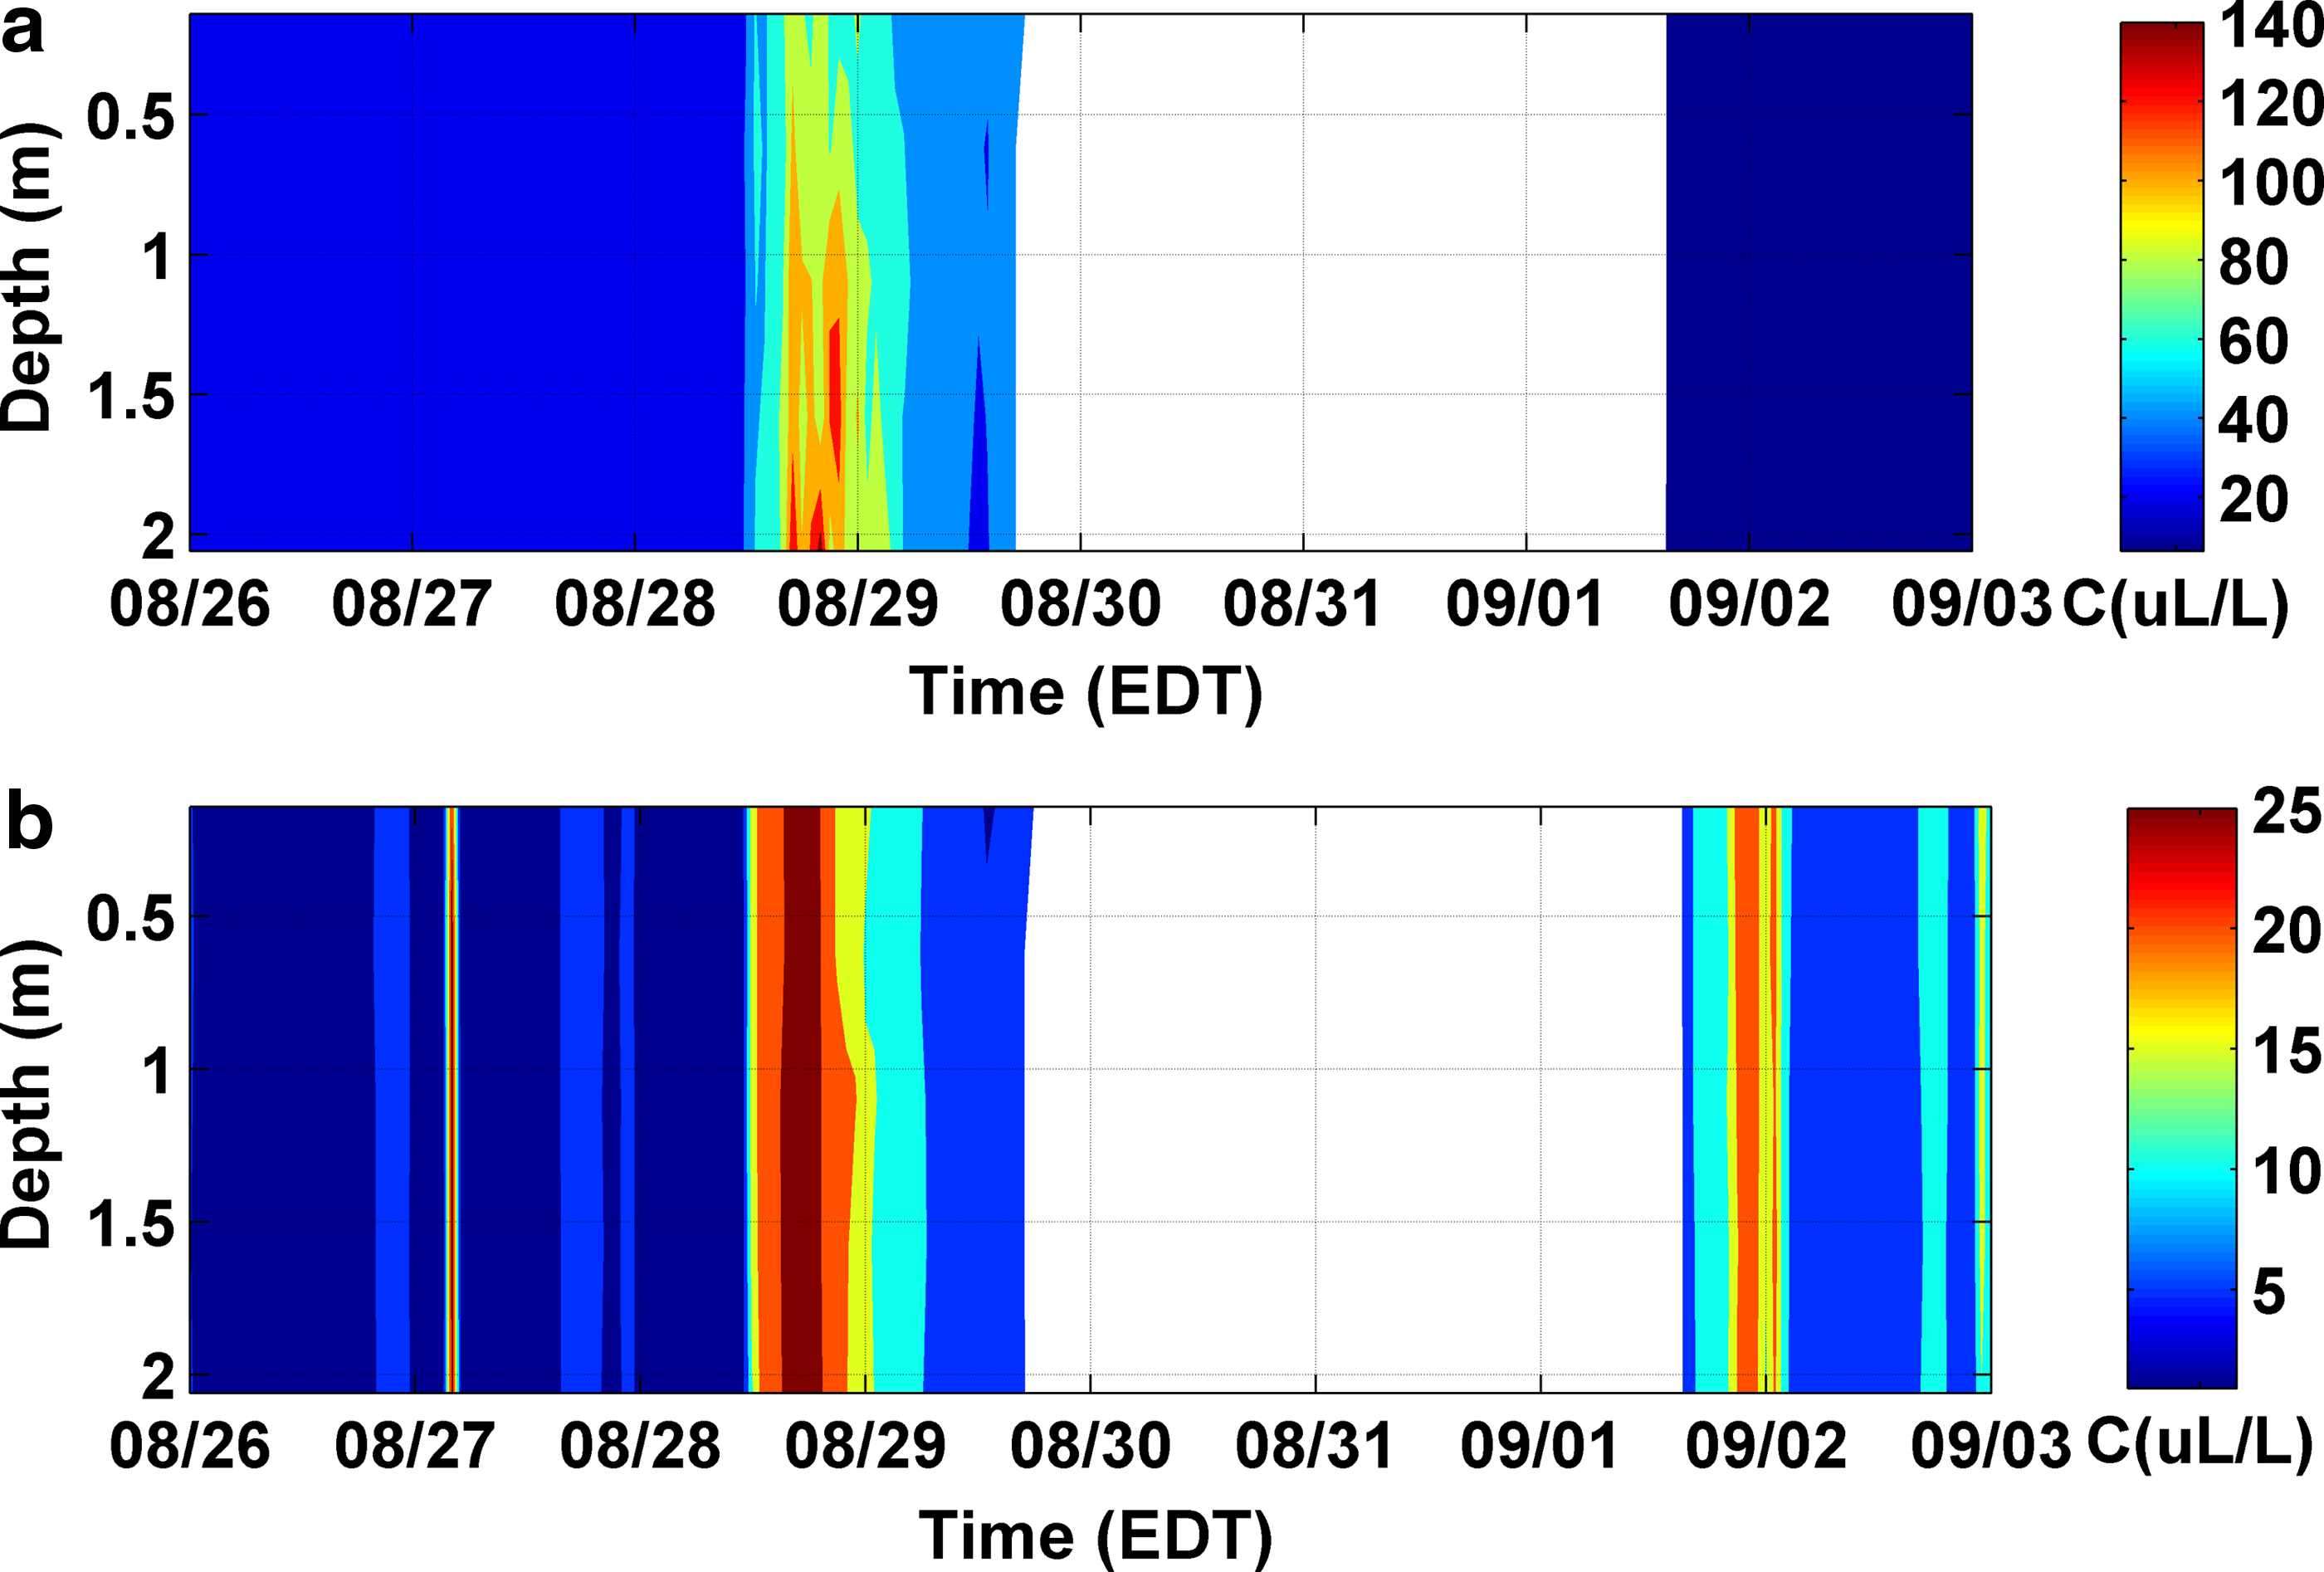
Total particle concentration measured in the Hudson River at Ft. Edward, NY with
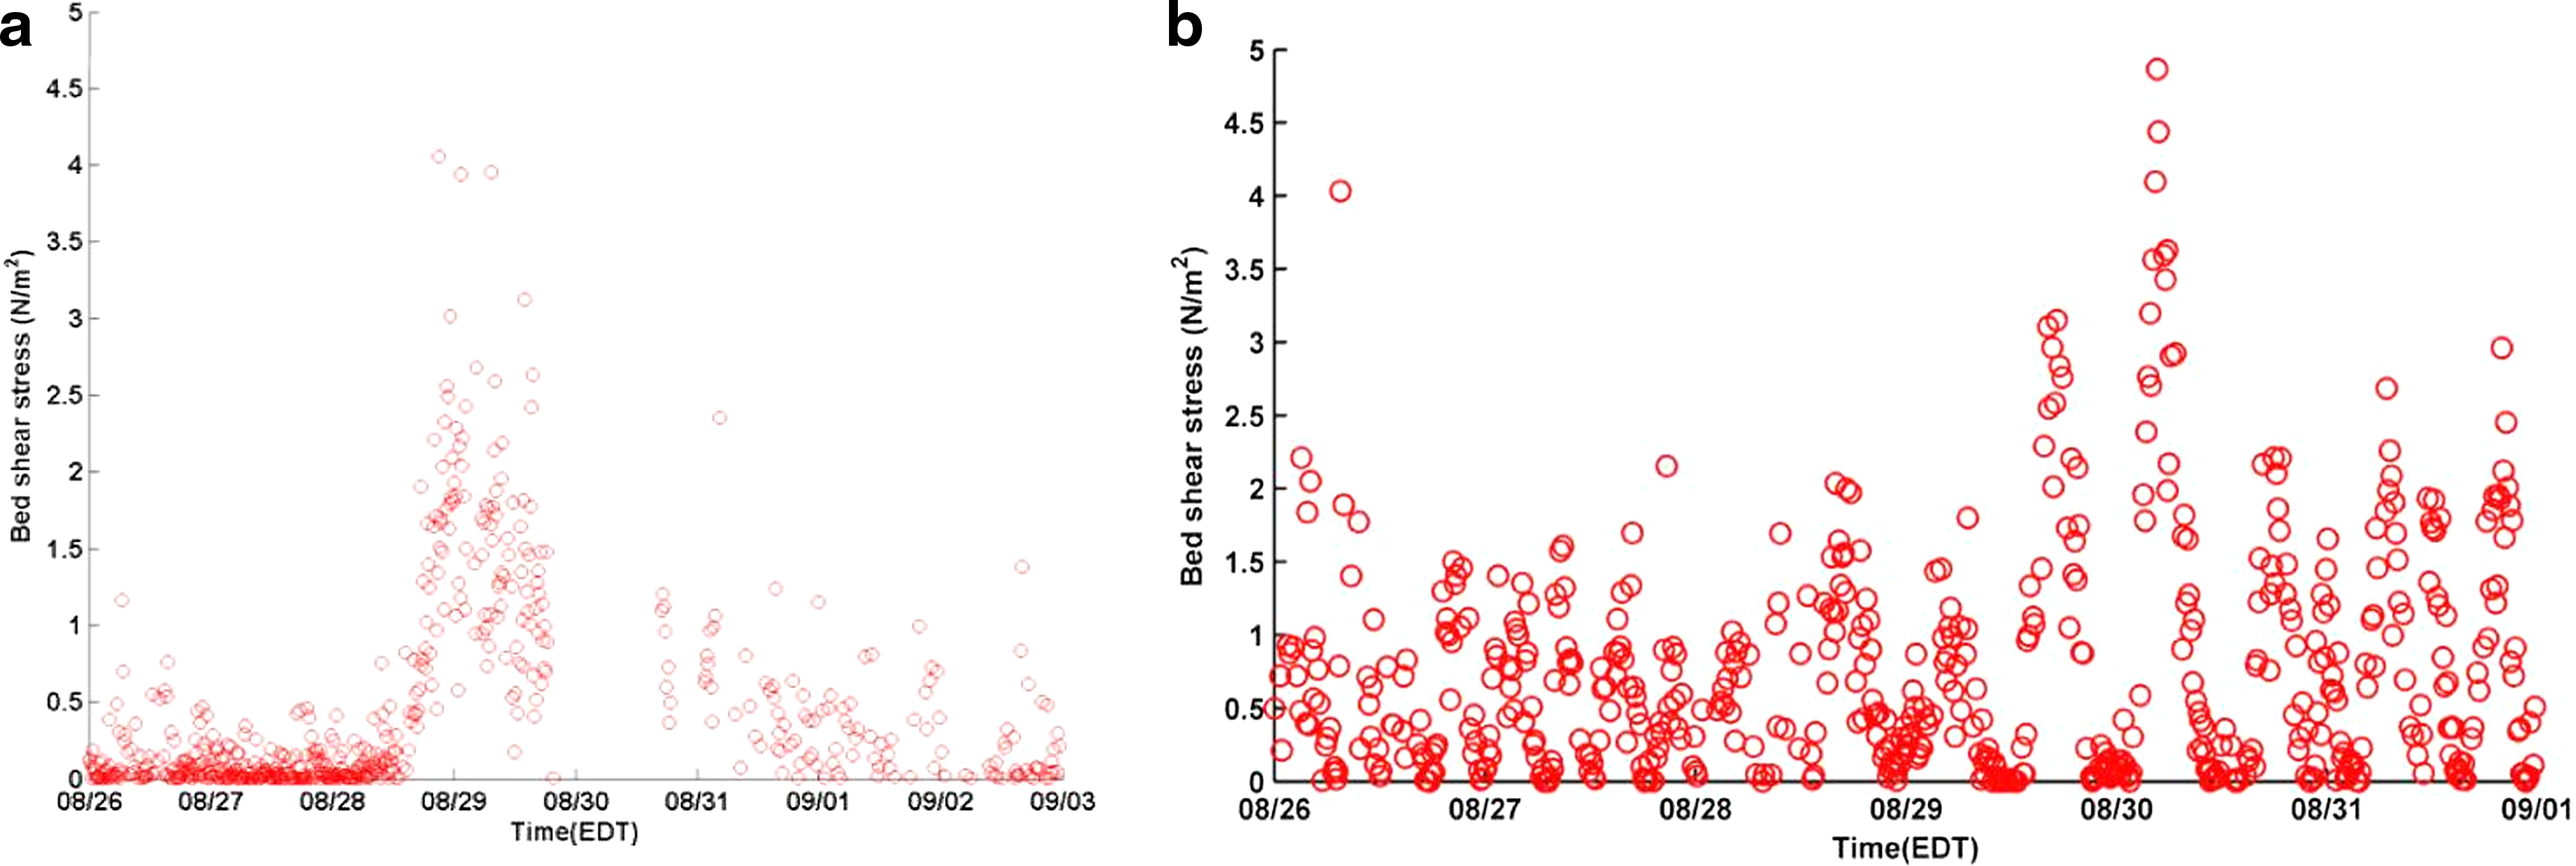
Variation of local bed shear stress in the Hudson River at
Ralston et al. (2008) suggest the integration of measured SSC and bed shear stress data to evaluate the relative contributions of sediment resuspension and watershed drainage mechanisms to total water column sediment concentrations. Information on the bed shear stress dynamics during high flow events may also be useful to evaluate longevity and effectiveness of granular material caps used to isolate and immobilize residual contaminated sediments after remedial dredging activities as conducted at the HR Superfund site (HRDP, 2011). The correlation between bed shear stress and observed flow regimes may be applied in the design of effective caps.
The important roles of particle concentration and size distributions in contaminant transport processes have been well documented (Garton et al., 1996). In comparison to large particles, increased contaminant adsorption capacity per unit particle volume and longer fluid residence times have been attributed to larger surface area to particle-volume ratios and lower Stoke's settling velocities associated with smaller particles (Garton et al., 1996; Sterling et al., 2004). Vertical profile data, collected with a LISST-100 at Ft. Edward (Fig. 9) during the passage of Irene, initially showed a sharp increase in the depth average particle concentration (violet trace) with a significant decrease in the average particle diameter at all measurement depths (blue, green, red, and cyan traces). Within a couple of hours, the average particle size increased with a concurrent decrease in depth averaged particle concentrations. Distinct changes in both particle size and concentration, coincided with an initial increase and subsequent decrease in bed shear stresses (Fig. 8a), suggested the potential for significant mobilization of particulate bound contaminants into the water column through an in situ resuspension event.
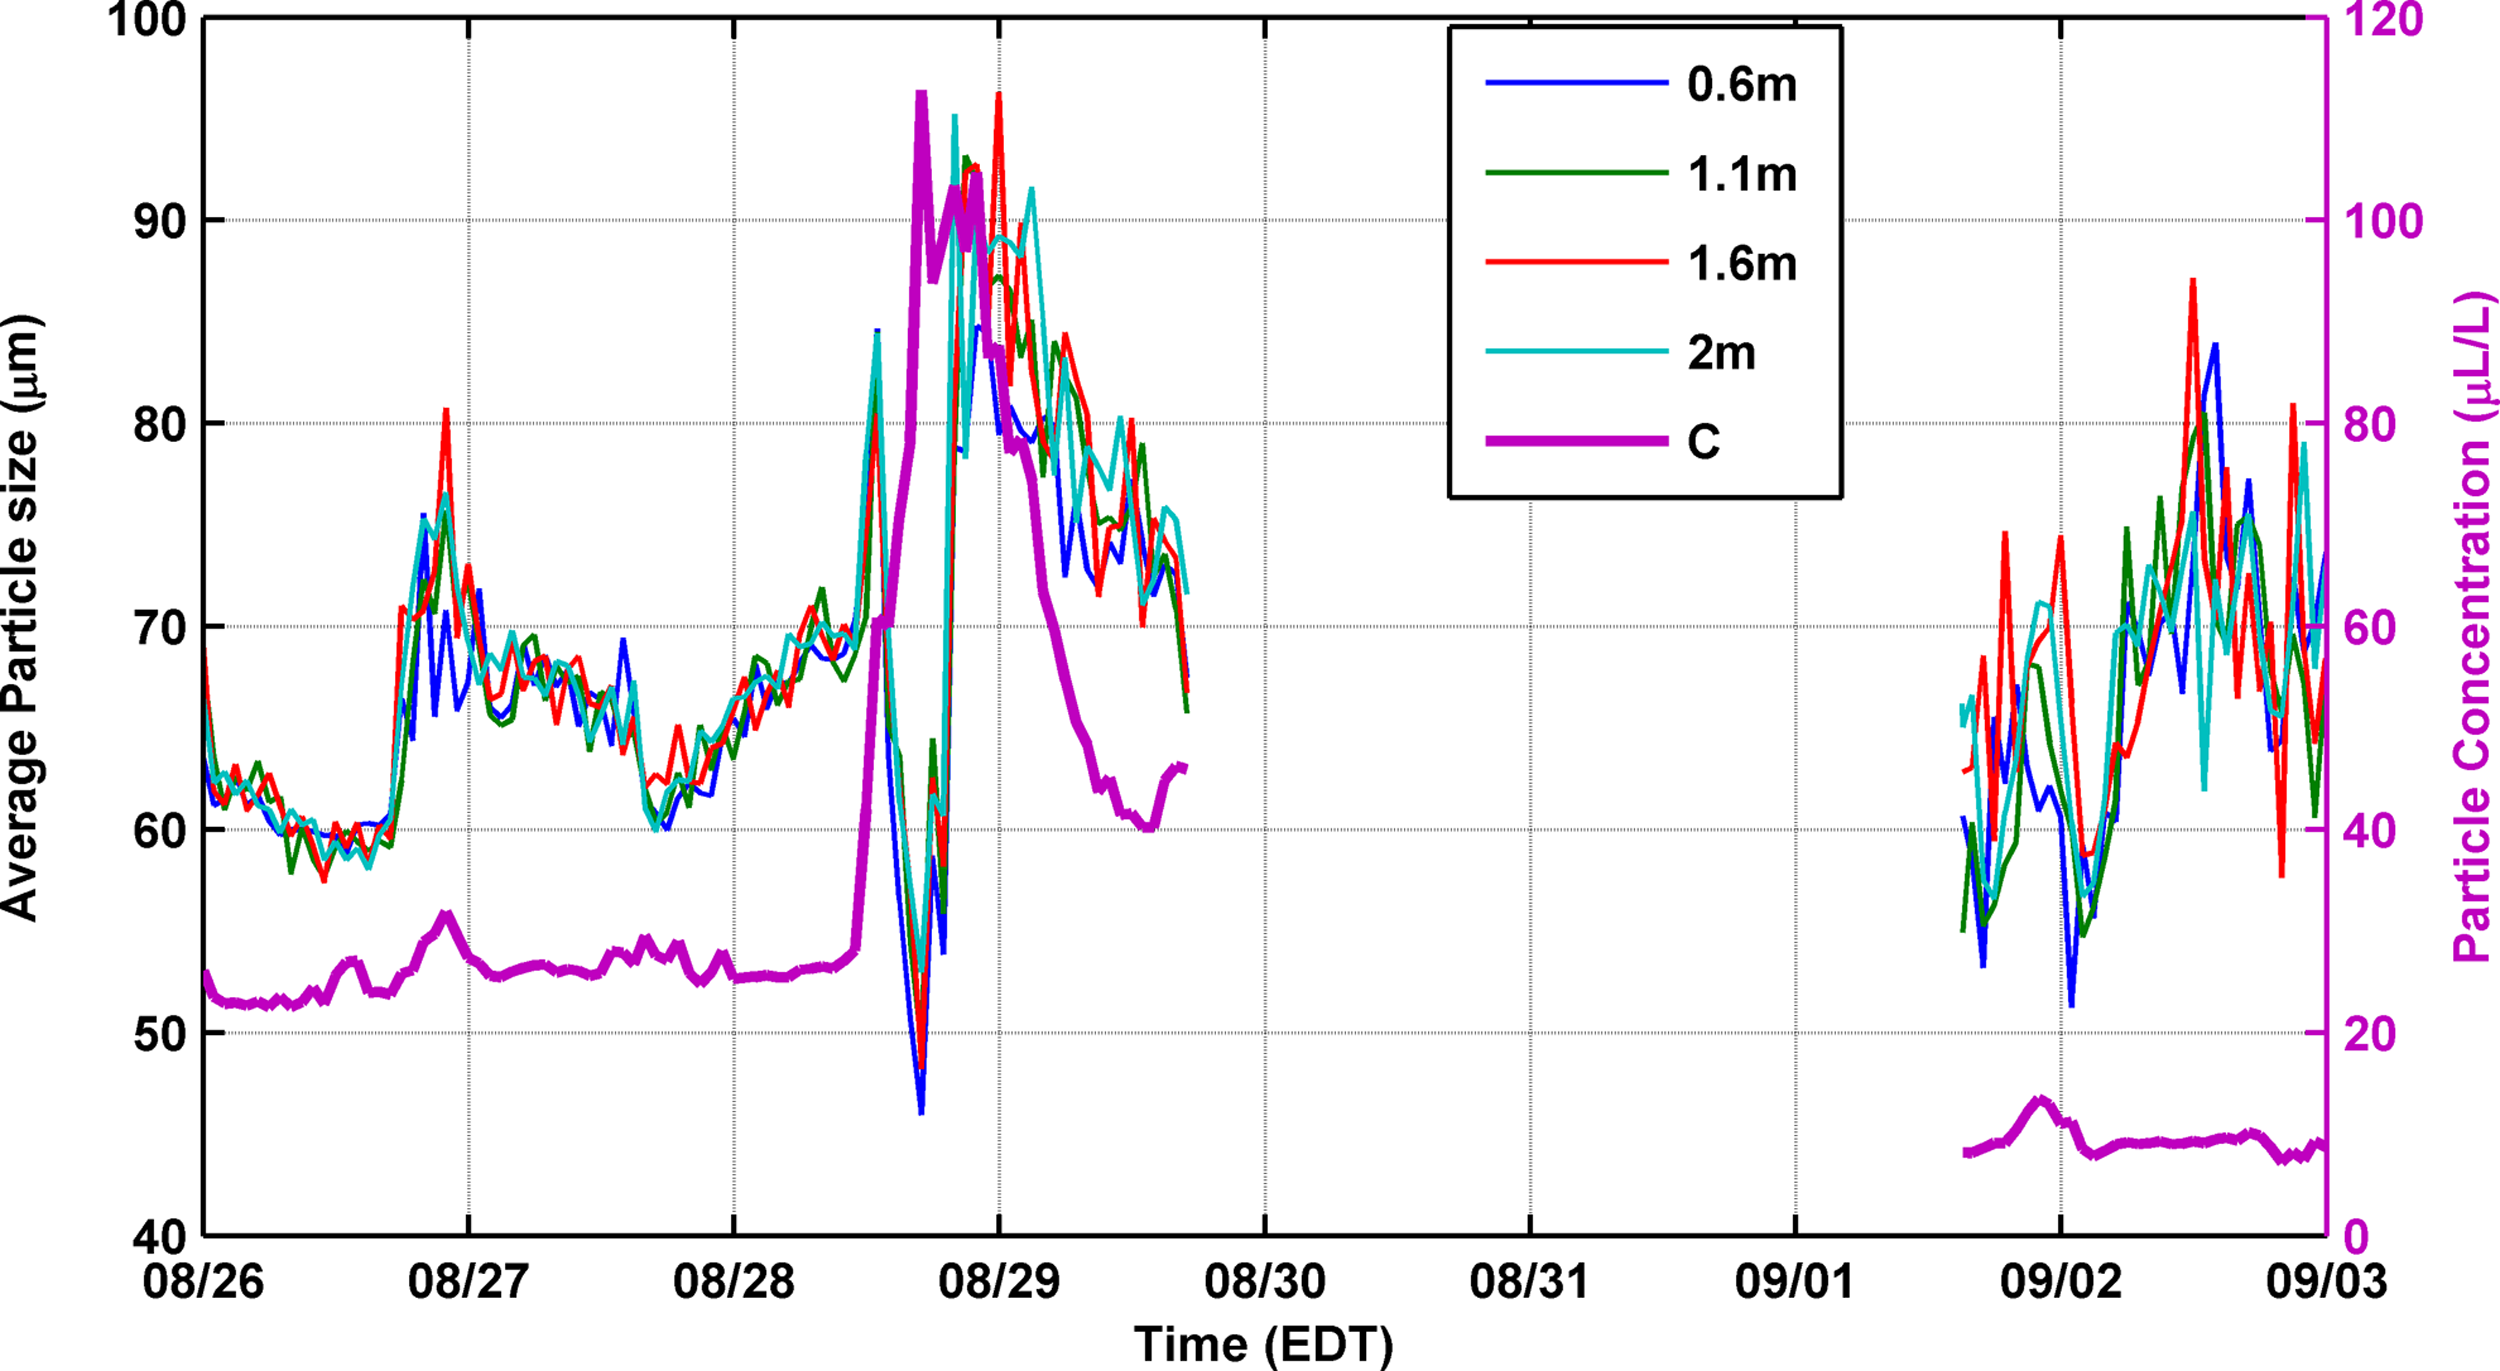
Time series plot of mean particle diameter and average concentration in Hudson River, at Fort Edward, NY for period August 26 to September 3, 2011. Mean particle diameters (μm) at profile depth intervals of 0.6, 1.1, 1.6, and 2.0 meters are represented by blue, green, red and, cyan traces, respectively. Depth averaged particle concentration is represented by violet trace.
In the Mohawk River, storm-related increases in discharge (Fig. 2) and current velocity (Fig. 3a) were coincident with increases in SSCs measured with the LISST-100 (Fig. 10a) and OBS (Fig. 10b). In comparison to the fractional contribution of storm flux to the total annual sediment flux determined at the Ft. Edward site, an even higher fraction of the storm-related contribution to total annual flux was suggested at Cohoes, NY where both volumetric stream discharge and sediment concentration increased 2 orders of magnitude during the short duration before instrumentation loss. Bed shear stresses increased from a prestorm condition of 0.2–11 N/m2 at storm peak flows and suggested a possible in situ sediment resuspension event. While some suspended sediment may have originated upstream origins, an evaluation of colored dissolved organic matter (CDOM) concentrations (Fig. 10c) indicated otherwise. Washed-out sediments and associated humic substances were identified as major CDOM sources in aquatic systems (Duursma, 1974; Laane, 1981; Berger et al., 1984; Hayase et al., 1987). Particle concentration profiles (Fig. 10a, b) showed an increase in particle concentrations at mid-day August 28 while increases in CDOM (Fig. 10c) concentrations were not apparent until late in the evening on Aug. 28. The premise that the initial particle concentration increase was due to a resuspension mechanism was supported by the observed lag time that occurred before the observed increase in CDOM concentration. CDOM concentrations increased throughout the water column through midnight on August 28 after which particle concentrations exceeded the detection limits of both the OBS and LISST-100.
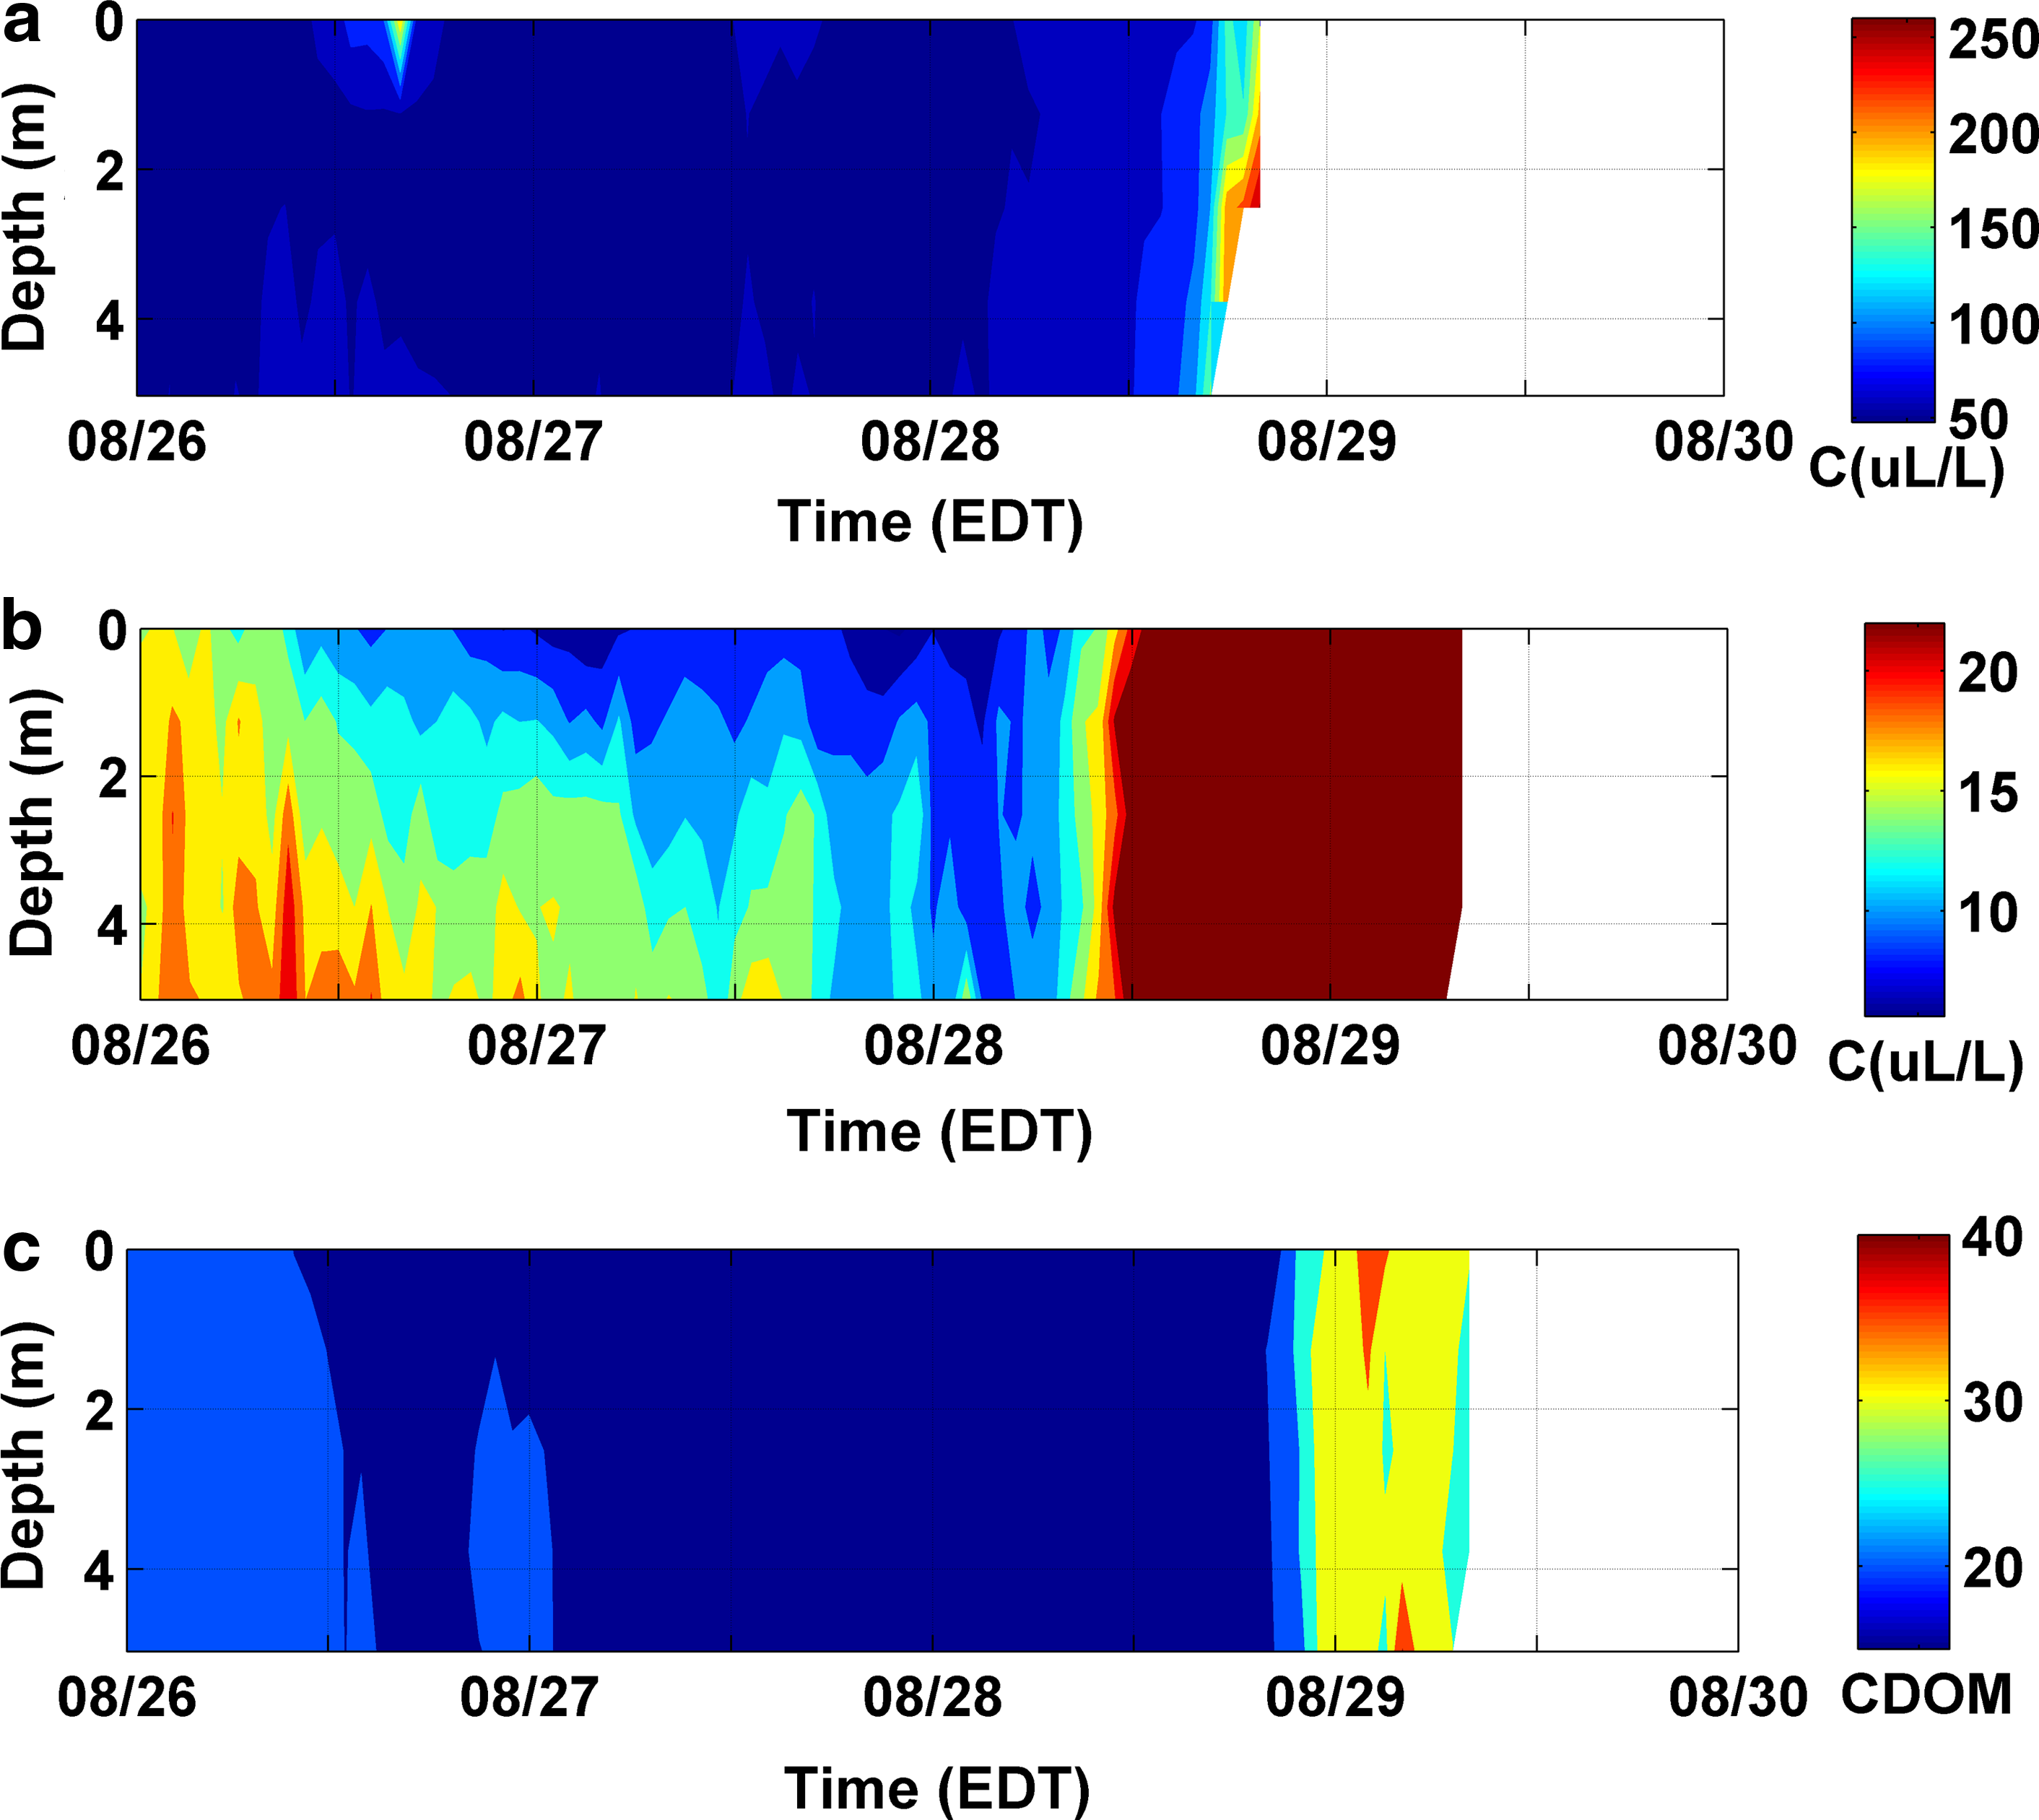
Vertical suspended sediment and CDOM concentration profiles from REON monitoring site on Mohawk River at Waterford, NY for period August 26 to early morning of August 29, 2011:
Impacts on Hydrodynamics at LHR
Dramatic changes in hydrodynamic and stream flow conditions in the UHR (Figs. 2–5) affected the hydrodynamic conditions in LHR. The FADCP installed at Albany (Fig. 1) captured the effects of storm-related flows from the UHR on the LHR with respect to river discharge rate, water velocity, and river stage height. Flow velocity dramatically increased from 50 cm/s (blue contour) to 220 cm/s (red contour) in response to the precipitation runoff event indicated by rapid increase storm-related stage height to a maximum depth of 10.5 meters above the bottom mounted FADCP (black trace) (Fig. 11a, b). The tidal influence under normal flow conditions (i.e., before storm flow) was demonstrated through semi-diurnal variations in both stage height above the FADCP (Fig. 11a, b) and a flow reversal (Fig. 11b) where flows were toward the north (red contour) and south (green contour) at flood and ebb tides, respectively. The influence of the storm-related river flows, was represented as a nearly constant stage depth of 10.5 m, resulted in an attenuation of the tidal signature as indicated by a reduction in the magnitude of diurnal stage height variations and constant downstream flows (i.e., to the south) represented as green contour (Fig. 11b) irrespective of tidal stages. The maximum observed flow velocities were recorded just before total loss of the FADCP on the morning of August 29 when a discharge of 2300 m3/s was recorded upstream in the Mohawk (Fig. 2). Based on the observation that flows in the Mohawk peaked mid-day on August 29 at >3300 m3/s (Fig. 2), it was predicted that peak storm-related flow velocities would have exceeded those observed at Albany.
Vertical water velocity profiles from bottom mounted upward looking ADCP at REON monitoring site on Hudson River at Albany, NY for period August 26–August 29, 2011:
Under base flow conditions, in the tidal-dominant estuarine section of the HR, bi-directional flow was in accordance with tidal forcing, as demonstrated by both velocity magnitude and direction measured at the Beacon and West Point monitoring stations. After Irene impacted the area, the normal tidal signature was interrupted and water moved downstream irrespective of tidal stage as illustrated in time series vertical profiles of water velocity magnitude (Fig. 12a) and direction (Fig. 12b) measured at Beacon. Similar patterns in water velocity magnitude and direction changes were observed at the West Point monitoring site during this time frame (data not presented in this article). Moving downstream, the intensity of this short-term effect dwindled due to the increased influence of tidal forces, changes in cross-sectional areas and loss of momentum due to the frictional effects along the river bottom. Spatial variability of this effect was illustrated through comparison of Figs. 11 and 12. These short term changes in hydrodynamic conditions significantly altered net downstream water flow patterns with possible impact to estuarine condition and sediment transport rate.
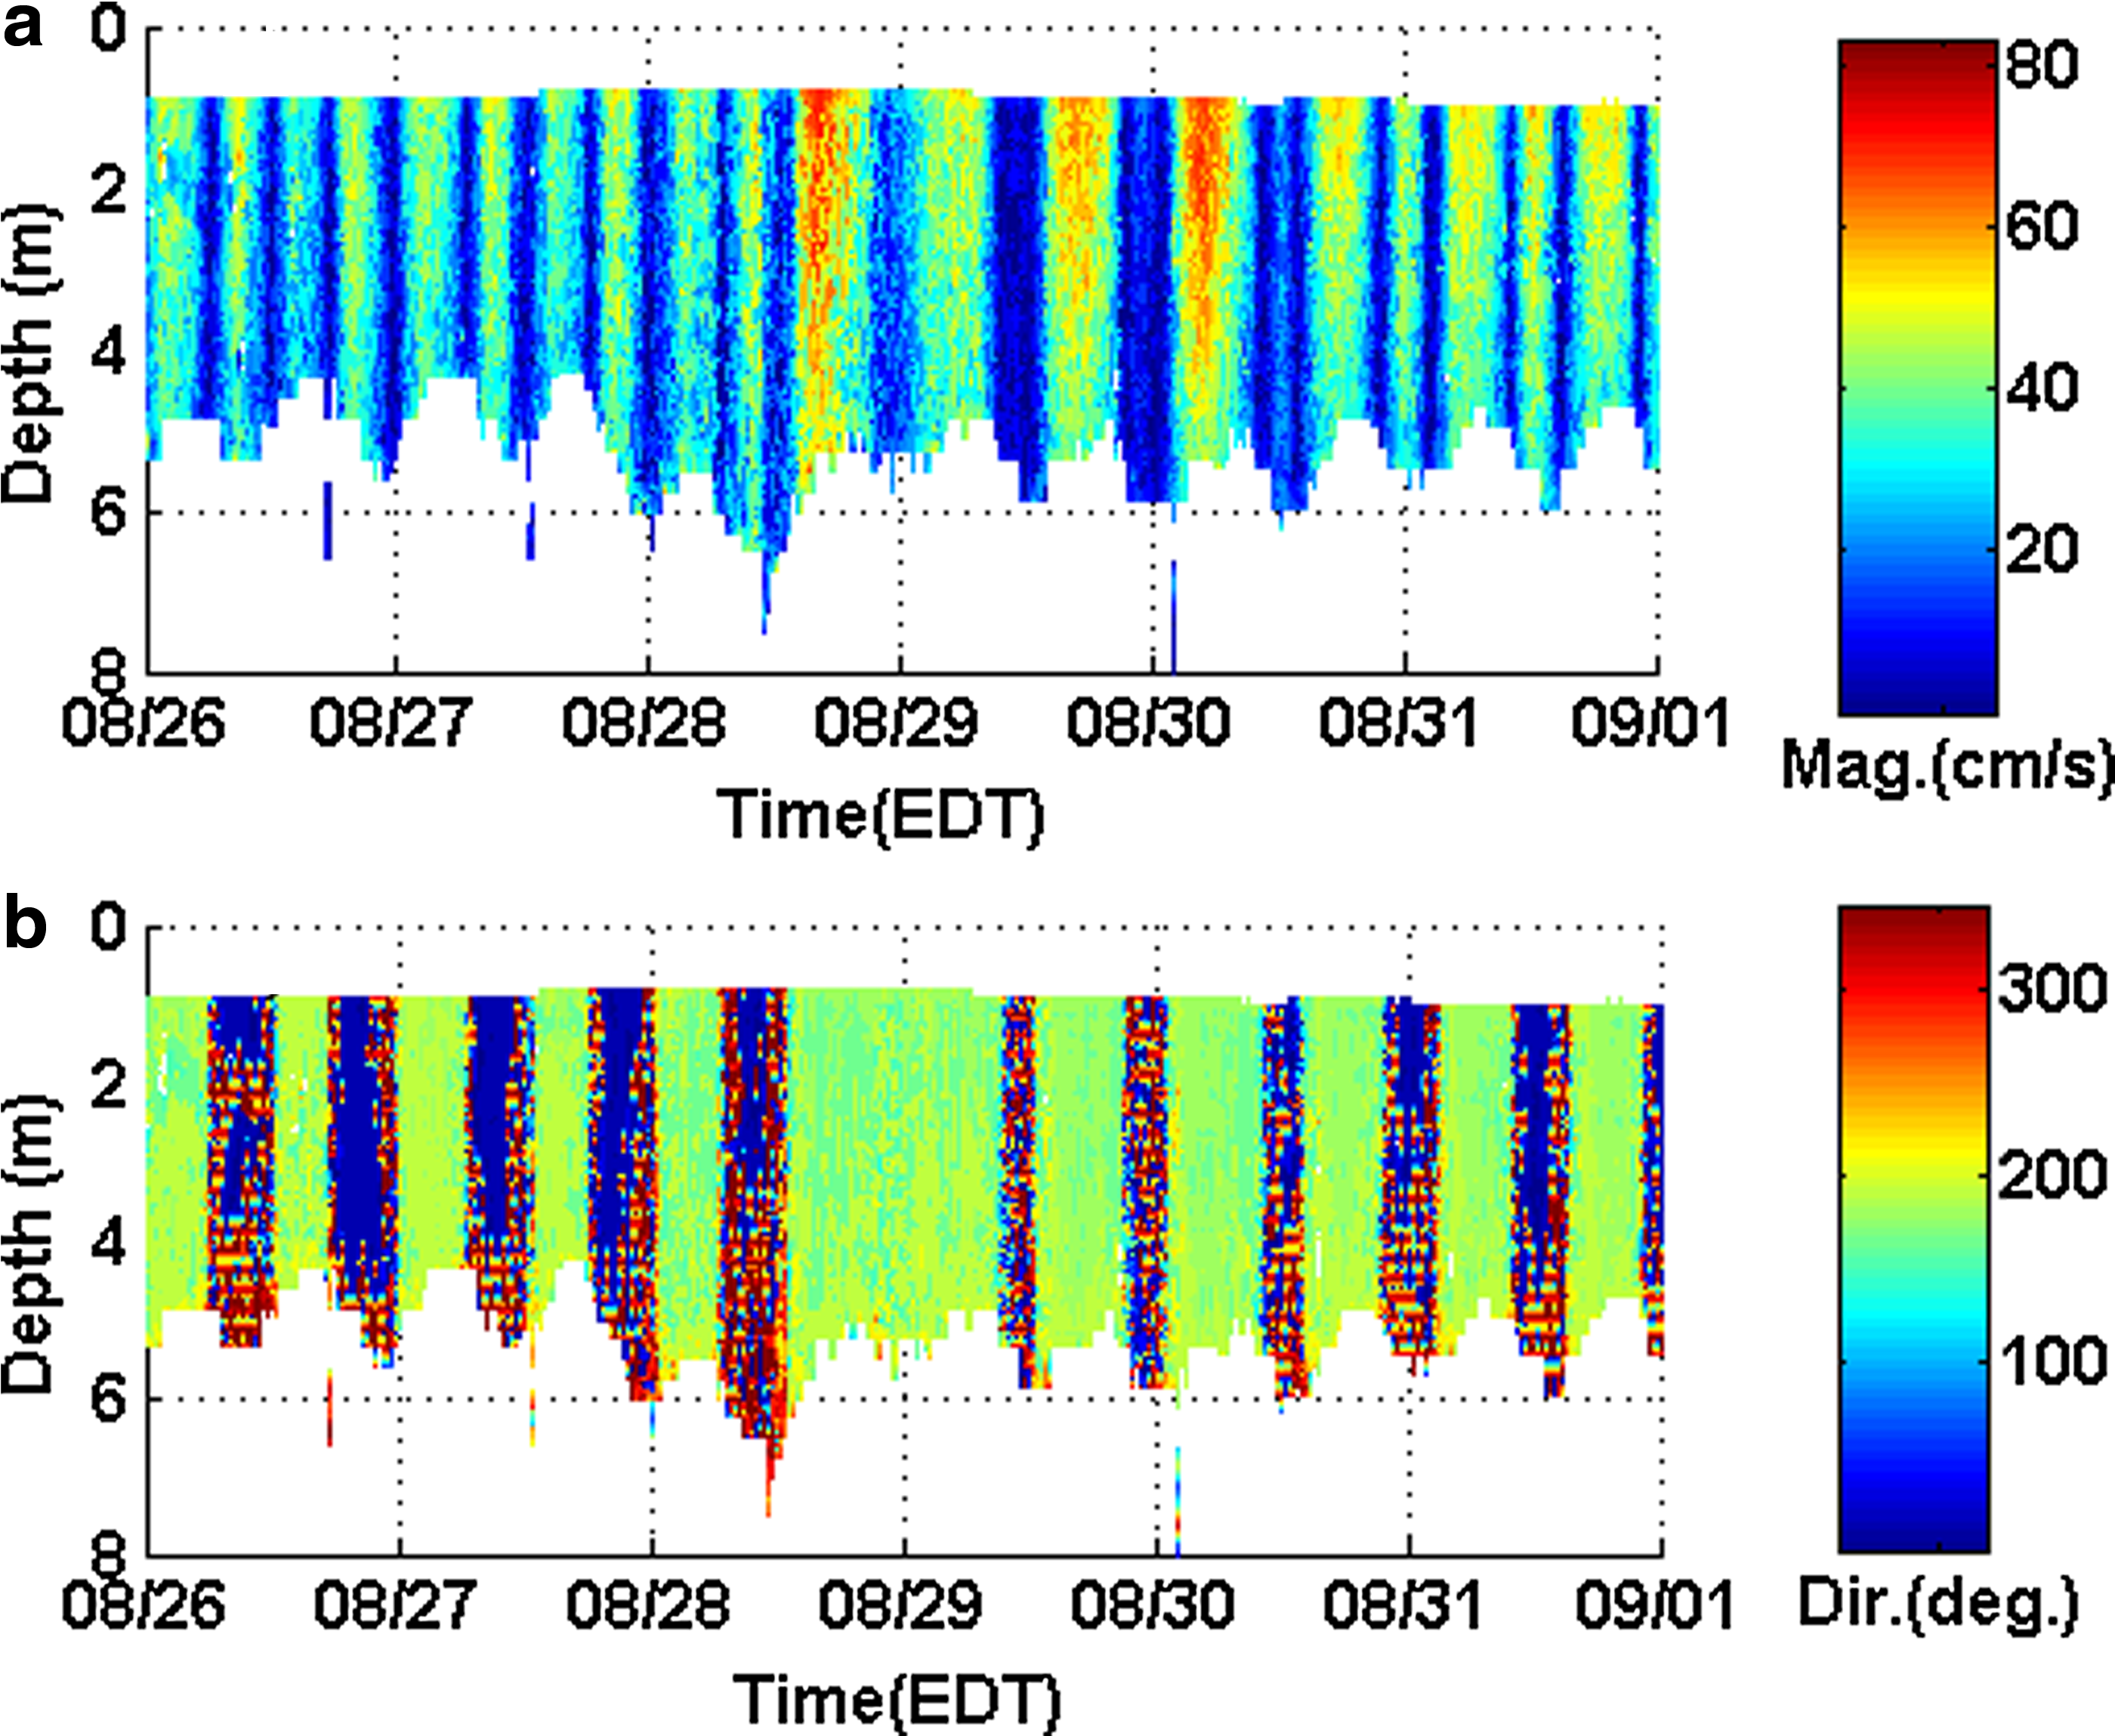
Vertical water velocity profile from downward looking ADCP at REON monitoring site on Hudson River at Beacon, NY for period August 26, 2011 to September 1, 2011:
Impacts on sediment transport at the LHR
The relative SSC variation at the Albany monitoring site was inferred from the vertical profile of ABS intensity measurements. The ADCP sensor at the site recorded an increase in ABS from 65 to 90 dB in the early morning of August 28 (Fig. 13: color change from blue to red represents increase in ABS intensity from 55 to 95 dB) with a concurrent increase in water level and velocity (Fig. 11) due to a large volume of freshwater inflow from the UHR. As SSC has an exponential relationship with ABS (Gray and Gartner, 2009; Fuller et al., 2013), this 25 dB increase in ABS represented a dramatic increase in SSC resulting from a combination of in situ resuspension and washed-out sediment from upstream water shed drainages.
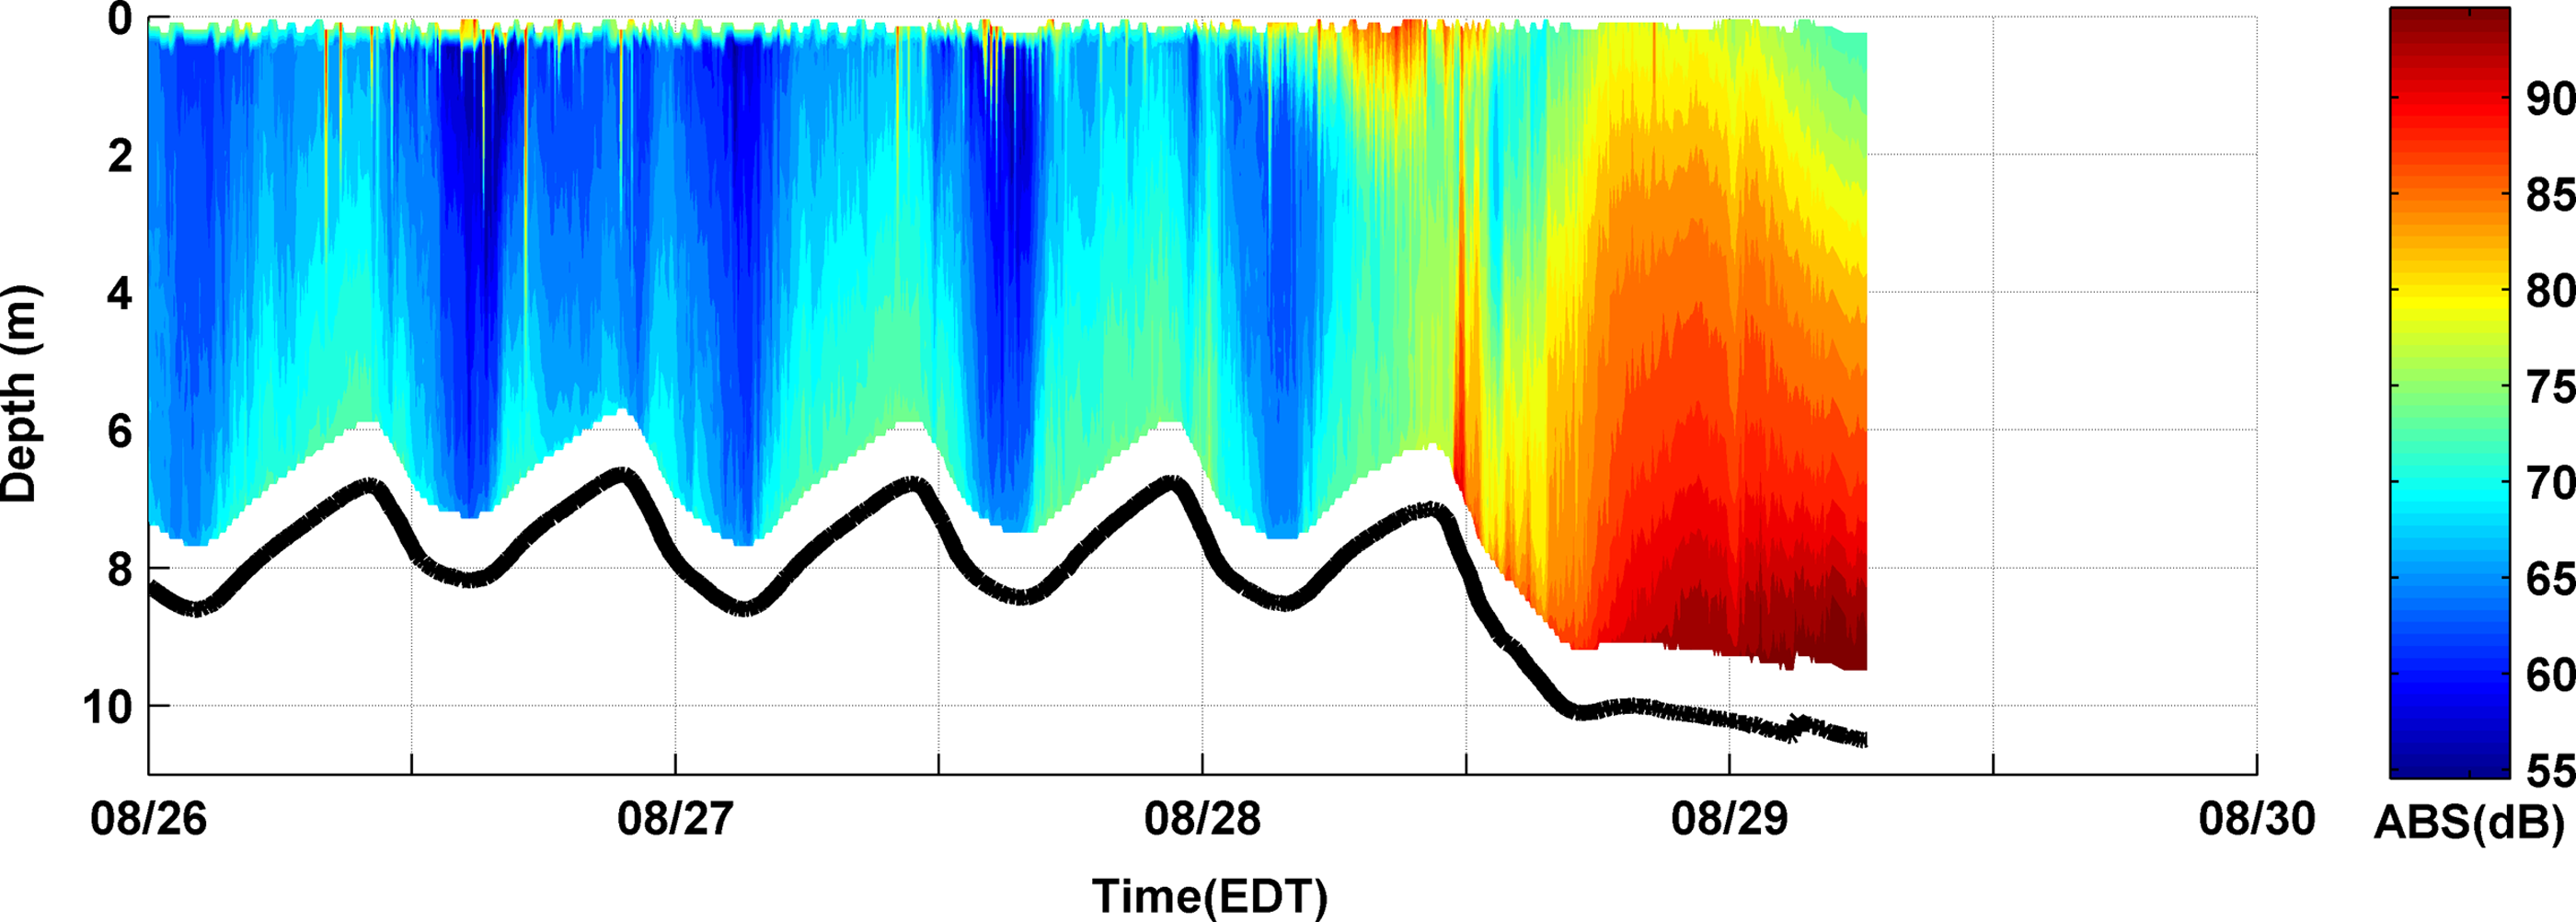
Vertical profile of ABS intensity from upward looking ADCP at REON monitoring on Hudson River in Albany, NY for period August 26 to the early morning on August 29, 2011. Note: Solid black line represents river bed and depth axis represents the variable height of the water column above the ADCP. Abrupt termination of data on August 29, 2011 due to total flood related loss of the ADCP. Color change from blue to red represents increase in ABS intensity from 50 to 100 dB. ABS, acoustic backscatter.
The influx of high volume of freshwater and associated sediment loadings may have affected particle dynamics in tidal dominant estuarine sections of the HRE. While the particle size analyzer installed at Beacon, NY (Fig. 1) failed to resolve particle concentrations due to the highly turbid conditions that exceeded the optical sensor's maximum detection limit, ABS intensity measurements showed increases from 60 to 80 dB at ebb tides from mid-day of August 28 (Fig. 14). Interestingly, ABS levels (i.e., surrogate measurements of SSC) did not increase at flood tides after mid-day of August 28. In comparison, ABS levels increased at both flood and ebb tides under normal tidal conditions. Before August 28, bed shear stresses (Fig. 8b) varied with flood and ebb tides under normal tidal conditions with coincident and proportional changes in particle concentrations (Fig. 14). After mid-day August 28, bed shear stress dramatically increased only at ebb tides (Fig. 8b) with a significant and concurrent change in the observed particle concentration. At flood tide, bed shear stress was reduced due to opposite directional movement of tidal flow and freshwater influx and insufficient to resuspend the bottom sediments.
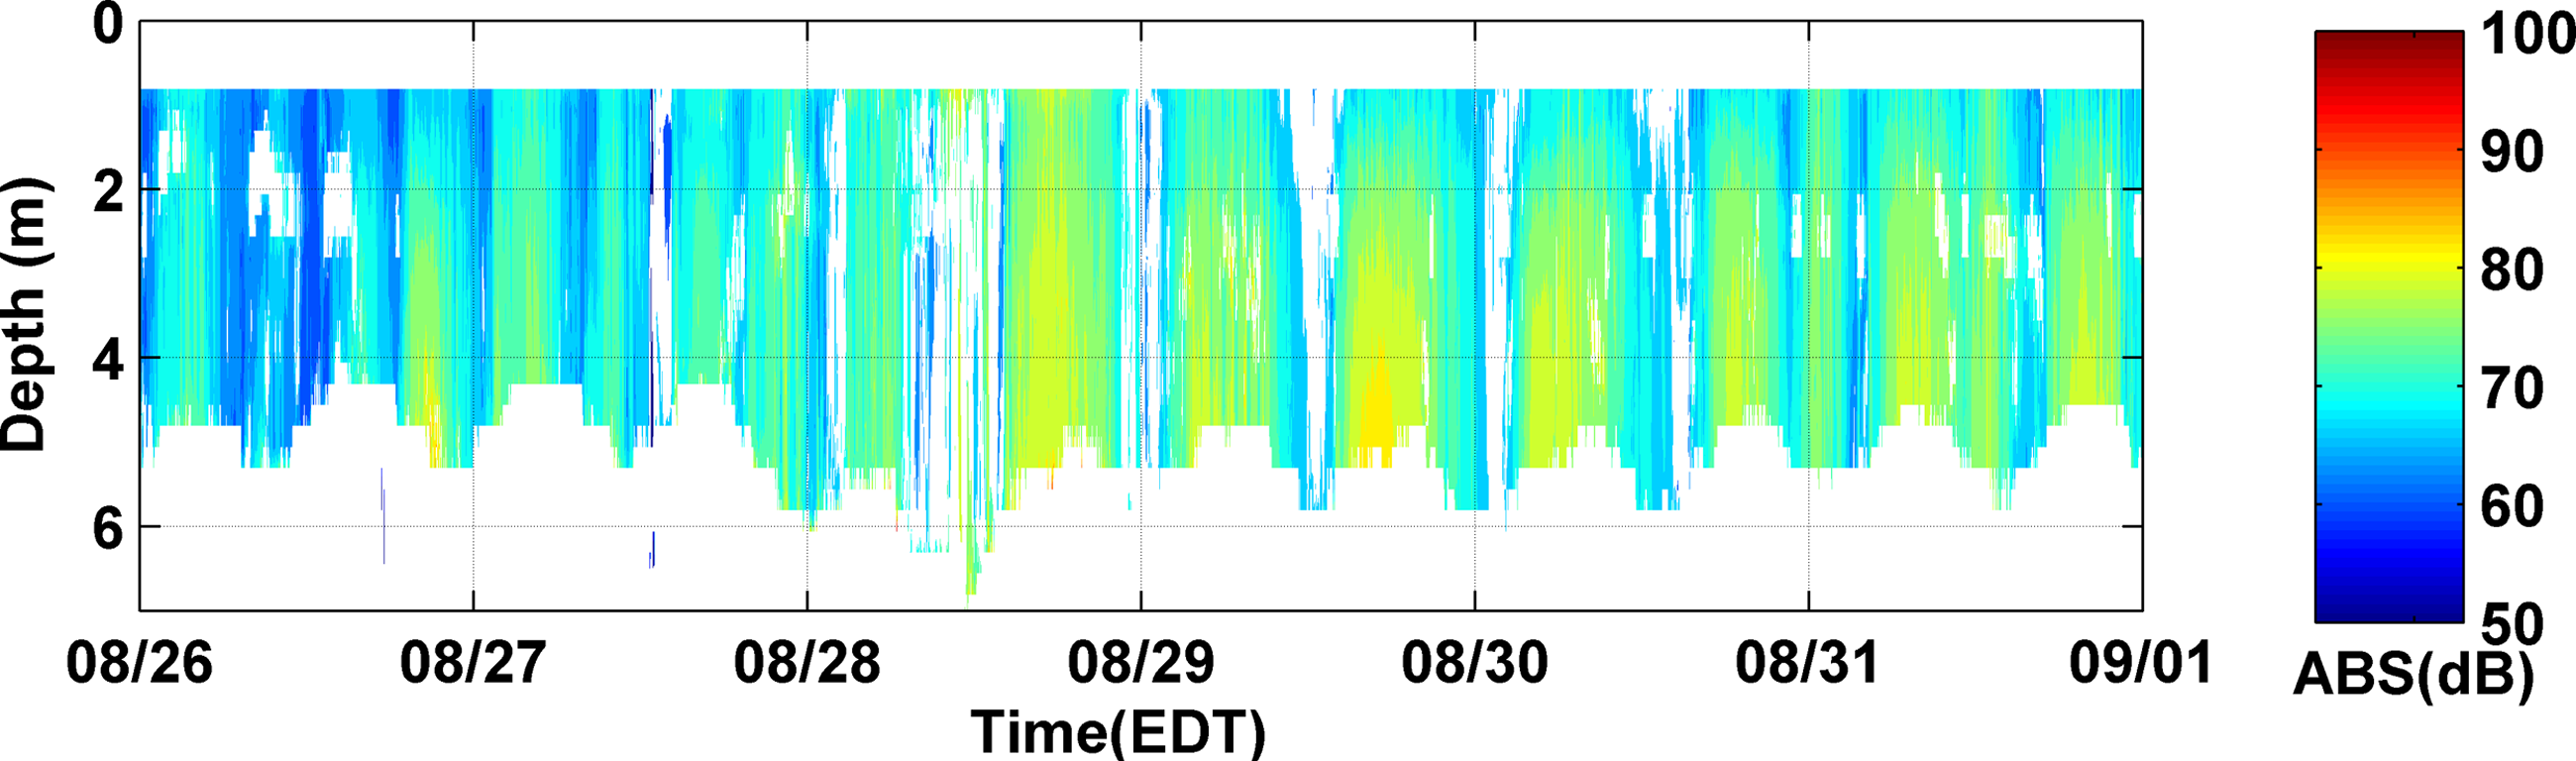
Vertical profile of ABS intensity from downward looking ADCP at REON monitoring site on Hudson River at Beacon, NY for period August 26 to September 01, 2011. Note: Color change from blue to red represents increase in ABS intensity from 50 to 100 dB.
Irene induced freshwater influx from the UHR may have pushed the salt-front further downstream with potentially significant impacts to particle transport in the water column (Orton and Kineke, 2001). Studies have shown the destabilization of particle suspensions under relatively high ionic strengths, where the destabilized particles readily flocculated with proportionate increases in particle settling velocities (Sterling et al., 2004; Billuri et al., 2015). Electrical conductivity measurements collected at Beacon, NY, located at the transition zone between the estuarine and fresh water, showed a drop in the conductivity (i.e., salinity) from 300 to 150 μS/cm (Fig. 15) when storm induced runoff reached the location. The observed drop in conductivity suggested the occurrence of a concurrent particle stabilization effect (i.e., particles remain suspended). Particle aggregation and subsequent particle settling processes were expected in the lower reaches of the estuary where longitudinal salinity gradients were found to be more distinct (Islam et al., 2011b). A downstream shift of the salt-front due to Irene's runoff may have resulted in a downstream shift of the zone where these processes occur and the area potentially impacted by contaminated sediments from upstream sources would have been extended.
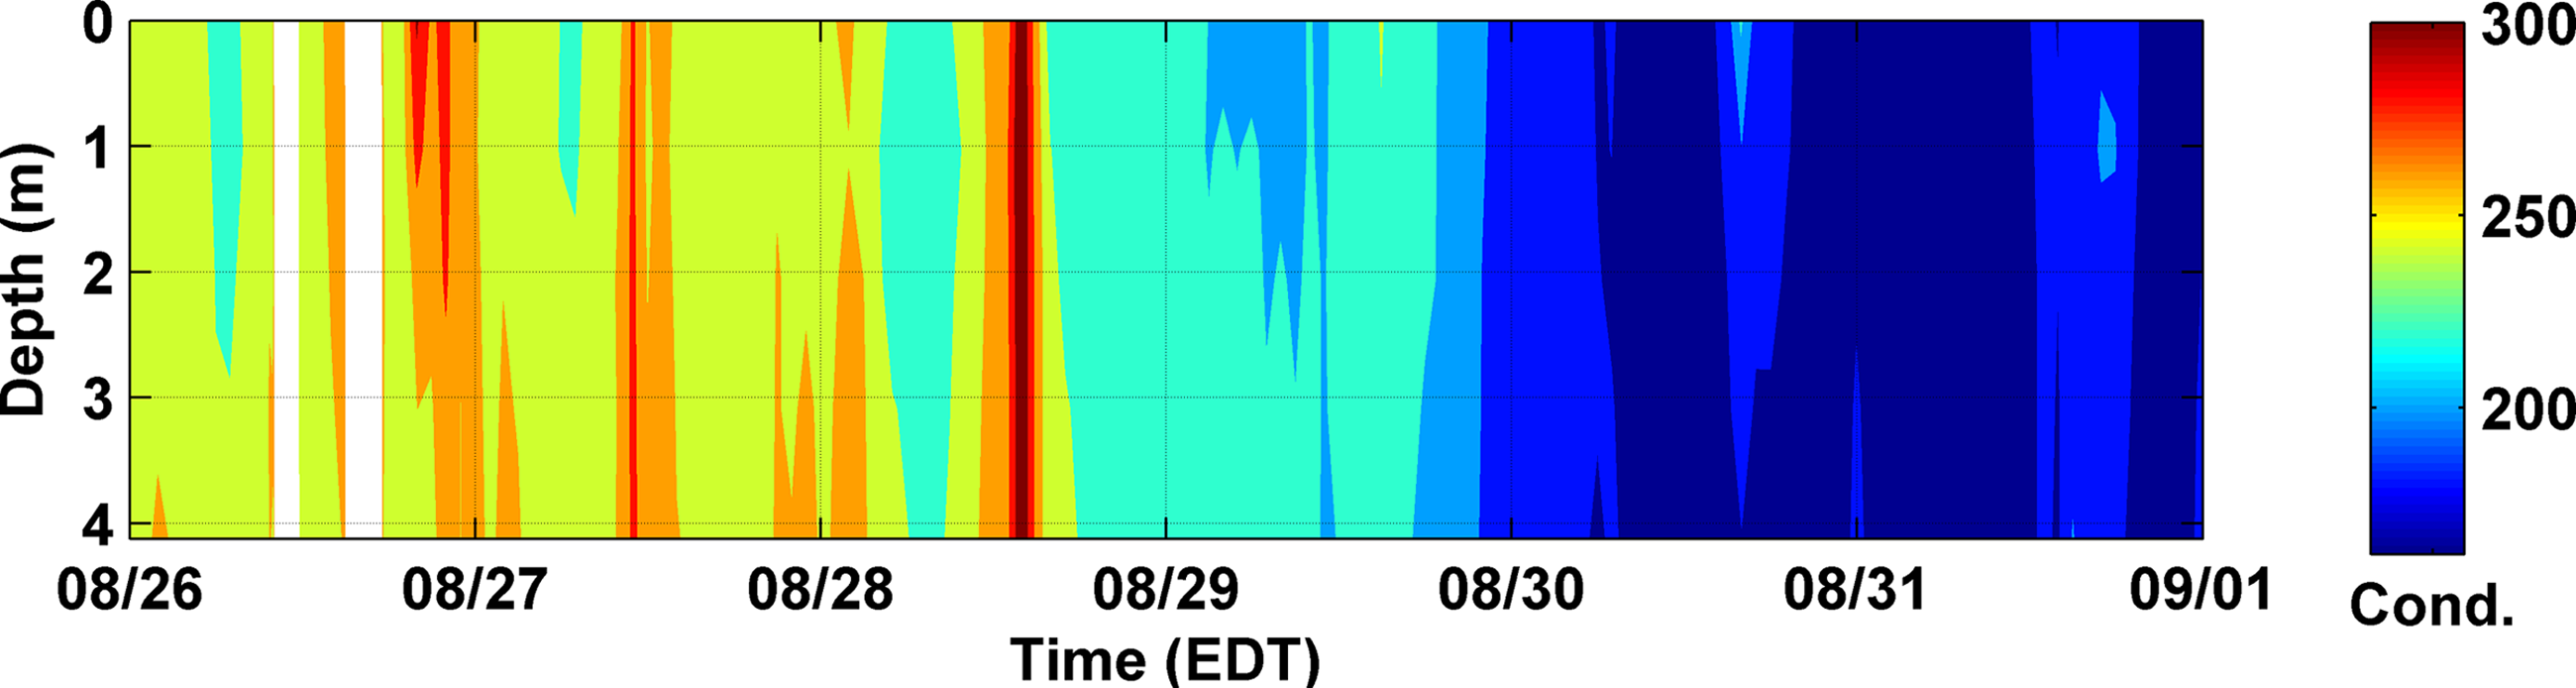
Vertical profile of conductivity (μS/cm) at the REON monitoring site in Beacon from August 25 to August 31, 2011.
Conclusions
Assorted automated sensors systems comprising both the REON and USGS monitoring networks were able to capture the dramatic impacts of Hurricane Irene on the hydrodynamics and sediment transport along the HRE. As Irene caused significant precipitation events in the Upper Hudson watershed, freshwater inflow generated from this event affected the hydrodynamics and sediment transport, with significant implications to transport of sediment-bound contaminants throughout the HRE. Intensity of water velocity magnitude along the UHR increased an order of magnitude compared to normal flow conditions. In the LHR, tidal influences were briefly overwhelmed where downstream flows continued irrespective of tidal phase. Suspended sediments originating as both washed-out sediment from the watershed drainages and in situ resuspension mechanisms increased the particle concentrations significantly along the entire reach of the HRE. Effects of this single storm event to the overall suspended sediment loading represents a major portion of the annual sediment load. High freshwater inflows from the UHR changed the salinity levels along the estuarine section of the river, potentially altering the salt-front location that can affect particle dynamics. Model integration of presented and post-Irene datasets from REON is suggested to resolve short- and long-term effects of this event on the HRE. This improved understanding will then guide water resource managers in developing optimum strategies to minimize/adapt the impacts of weather-related extreme episodic events.
Footnotes
Acknowledgments
Funding for this work was provided by the Beacon Institute for Rivers and Estuaries at Clarkson University and the National Science Foundation (grant no. CBET-1058422 and CBET-0821531). Thanks go to the REON field engineering team especially, Patrick O'Brien, James Paley, and Russ Nelson for their support in the data collection effort.
Author Disclosure Statement
No competing financial interests exist.