
Abstract
Fecal indicator bacteria can be used as a surrogate to pathogenic microorganisms to monitor fecal contamination in water bodies. Increased concentrations of fecal bacteria may pose public health risks associated with swimming and other recreational activities at beach sites. This study was carried out during the summer and early fall of 2013 to monitor Escherichia coli and Enterococci as indicator bacteria at Bradford Beach, along the shoreline of Lake Michigan in Milwaukee, WI. Enumeration of bacteria in beach sand and water samples was performed using the IDEXX Most Probable Number method. Deionized (DI) water and phosphate-buffered saline (PBS) were used as the eluents for bacterial enumeration. The EPAs CANARY event detection software was used to analyze bacterial concentrations and identify anomalous water quality events. CANARY was deemed to be a useful statistical tool for analyzing fecal indicator bacteria concentration and providing timely information on beach contamination to reduce public health risks associated with pathogens. The model results indicate that beach sand can act as a potential reservoir for bacteria to survive longer than in water. In addition, the concentration of E. coli enumerated in DI water was higher than in PBS. The analysis of E. coli concentration in beach sand indicates the possibility of establishing a relationship between the results obtained using the two eluents. Furthermore, a correlation between the algal level and bacterial count was identified. The results from the CANARY software indicate that the presence of algae has a significant impact on the bacterial concentration.
Introduction
Indicator bacteria are used as surrogates for disease-causing microorganisms because pathogenic microbes are present at very low concentrations in water and direct tests are expensive. There is a direct positive correlation between the concentration of fecal indicator bacteria such as Escherichia coli and Enterococci and the occurrence of gastrointestinal illness in humans (Wade et al., 2003). Epidemiological studies indicate that illness in swimmers can be quantitatively linked to indicator bacteria in coastal waters contaminated with wastewater and urban runoff (Yamahara et al., 2009).
The coliform bacteria E. coli and Enterococci from the bacterial group streptococci are found in the feces of humans and other animals. These bacteria can synthesize ATP under aerobic or anaerobic conditions, allowing them to survive in various environments. Other commonly tested fecal indicator bacteria are fecal coliform, total coliform, and fecal streptococci. Previously, by using the ratio of fecal coliform to streptococci, the origin of the contamination (human or nonhuman) could be determined. However, this method is no longer recommended by the U.S. EPA owing to reliability issues.
Guidelines developed by the U.S. EPA indicate that E. coli and Enterococci are appropriate indicator bacteria for monitoring recreational water (U.S. EPA, 2018). In marine systems, Enterococci play a crucial role in public health outcomes, and E. coli is considered a significant contributor to contamination in freshwater systems (Halliday and Gast, 2011). The presence of E. coli is carefully monitored in freshwater bodies in Wisconsin, where different advisory limits are declared for different threshold values of E. coli concentration. According to the Wisconsin DNR, when the E. coli concentration at a beach is 235 colony-forming unit (CFU)/100 mL, the health department posts a yellow caution sign. A red “Closed” sign is posted to indicate an elevated public health risk when the concentration level reaches 1,000 CFU/100 mL. In 2012, the EPA recommended new statistical standards that incorporate threshold values and the geometric mean for indicator bacteria to determine the water quality for recreational access at the beach (U.S. EPA, 2018).
Conventionally, nearshore waters are tested for indicator bacteria to monitor recreational water quality. However, people with exposure to beach sand without contacting water were found to be affected by E. coli, which suggested that exposure to beach sand is a possible reason for the sickness (Byappanahalli et al., 2003; Alm et al., 2006; Ishii et al., 2006; Bonilla et al., 2007). Besides gastrointestinal diseases, other adverse health outcomes associated with beach sand and water include skin, respiratory, and ear infections. Yau et al. (2009) investigated skin-related health conditions because of recreational exposure to fecal indicator bacteria and reported a statistically significant correlation between bacteria levels in marine water and skin-related effects. Beach water can also be affected by cyanobacteria, which can produce cyanotoxins resulting in adverse human health conditions (U.S. EPA, 2012).
Previous studies have indicated that bacteria may be more viable in sand than in water because of easier attachment to sediment particles (Whitman and Nevers, 2003), the presence of sufficient nutrients and fewer predators in sediment (Thupaki et al., 2013), and a lower inactivation rate of bacteria owing to less exposure to ultraviolet (UV) radiation. In addition, fecal indicator bacteria could survive in sand without a recent source of human fecal contamination (Nevers et al., 2014). Re-suspension of sediments under the water column can significantly increase fecal contamination by releasing bacteria in submerged sediments near sewage outfalls. In response to nutrient deprivation in submerged sediments, bacteria form endospores, producing highly resistant cells for the preservation of their genetic material.
A comprehensive review by Vestby et al. (2020) indicated the potential of bacterial biofilms to cause diseases of the digestive, cardiovascular, auditory, reproductive, urinary, and respiratory systems. Another important factor contributing to the occurrence and survival of indicator bacteria is the presence of Cladophora algae. Doucette (1995) investigated the association between bacteria and harmful algal blooms and suggested that the production of pathogenic bacteria and phycotoxins is generally attributed to algal species. The results indicated that Cladophora algal mats acted as reservoirs for the indicator bacteria E. coli and Enterococci.
The bacterial contamination level of nearshore waters is affected by the concentration of bacteria in beach sand. Researchers have reported that bacteria are mobilized from beach sand to the water column by high tides in California beaches (Yamahara et al., 2007). Several recent studies discussed the dependence of bacterial counts in water on their concentration in beach sand. However, the exact relation between them and the effect of bacterial mobilization on the health of swimmers has not been well established. Understanding the significance of the relationship between the presence of bacteria in sand and public health risk is complicated because of the lack of a widely accepted method for bacterial enumeration in beach sand.
There are several published methods for extracting bacteria from sand, including simple handshaking of the sample and complex methods using light sonication, mechanical shakers, and modified buffer solutions. Although shaking methods are most frequently used for bacterial enumeration, they differ in the shaking duration, type of shaking, type of eluent, eluent-to-sand ratio, and eluent composition. Selecting the optimal extraction method with effective eluents is essential for ensuring accurate recovery of indicator bacteria from sand.
Boehm et al. (2009) compared different extraction methods for bacterial enumeration in sand to determine the approach that produced the highest recovery. Five different eluents were tested based on the physical characteristics of the extraction method, and the results indicated that 2-min handshaking in phosphate-buffered saline (PBS) or deionized (DI) water with a 30 s settling time, 1 rinse step, and a 10:1 eluent-to-sand ratio produced the highest recovery of indicator bacteria. However, selecting the appropriate eluent type based on its physical characteristics depends on the sand composition. Other studies also used DI water or PBS as eluents with a shaking duration of 1–2 min to enumerate E. coli and Enterococci in sand (Alm et al., 2003; Sampson et al., 2006; Bonilla et al., 2007; Hartz et al., 2008).
In this study, we used DI water and PBS to enumerate bacteria in beach sand using mechanical shaking with a shaking duration of 5 min, settling time of 5 min, eluent-to-sand ratio of 8:1 (200 mL to 25 g), and PBS composition according to EPA standards: 0.32 g of sodium dihydrogen phosphate, 1.1 g of sodium monohydrogen phosphate, 8.5 g of sodium chloride, and 1 L of distilled water.
This study was undertaken to enhance the knowledge of fecal indicator bacteria levels in beach sand and develop methods for more accurate predictions of public health outcomes from the measured bacterial concentration. The objectives of this study were to examine the concentration and interaction of fecal indicator bacteria in beach sand and water at Bradford Beach along Lake Michigan; to analyze the effectiveness of different types of eluents, that is, DI water and PBS, in enumerating bacteria in beach sand; and to evaluate the impact of algae on bacterial concentration.
We used Bradford Beach as the sampling location because it is one of the top urban beaches and the most visited place for public recreational activities in Milwaukee. Several contamination sources such as storm water discharge and sewage overflow, along with a large population of shorebirds, cause bacterial pollution at Bradford Beach. Analysis of bacterial concentrations at this location could help to develop methods for accurate prediction of public health outcomes as a result of increased contamination with fecal indicator bacteria. The samples were collected in the summer and early fall months because of a consistent trend of elevated bacteria levels in beach sand because of public activities, and 2013 was studied as a representative year.
CANARY, a statistical event detection system, was used to identify abnormal conditions, that is, anomalies in bacterial concentration. Research studies have been performed with CANARY for water quality monitoring in drinking water, surface water, and wastewater systems (Perelman et al., 2012; Leow et al., 2017; Nafsin and Li, 2021). However, studies on the application of CANARY for monitoring bacterial contamination have not been reported. To the best of the authors' knowledge, this study is the first to use CANARY software to monitor bacterial concentrations at a recreational beach. We evaluated the application of CANARY in the analysis of beach water to determine the effectiveness of the software in detecting changes in fecal indicator bacteria concentration and providing timely information on beach contamination and public health risks associated with pathogens.
Materials and Methods
Study area and sample collection
Bradford Beach (Fig. 1) is an urban beach along the shoreline of Lake Michigan, Milwaukee, WI, with location coordinates of 43.0313°N, 87.8737°W. Three different transects were used as sampling locations and remained constant throughout the sampling period by using local landmarks to ensure consistency. These three transects were sampled 3 days per week at 9:15 am. Three samples were obtained from each transect: one sand sample from the swash zone, one sand sample from 6 m inland, and a water sample. The swash zone samples were taken from the beach surface, whereas the 6 m inland samples were taken from the water table so that all sand samples were saturated. During the sampling period, the water table varied from 0.15 to 0.53 m, depending on the precipitation and local topography. Water samples were taken from a depth of ∼0.5 m. The water temperature ranged from 11°C to 23°C with a mean of 15.4°C during the sampling period. Water samples and sand samples were stored in 500 mL plastic bottles and plastic Whirl-Pak bags, respectively, and placed in a cooler with ice until laboratory analysis was performed.
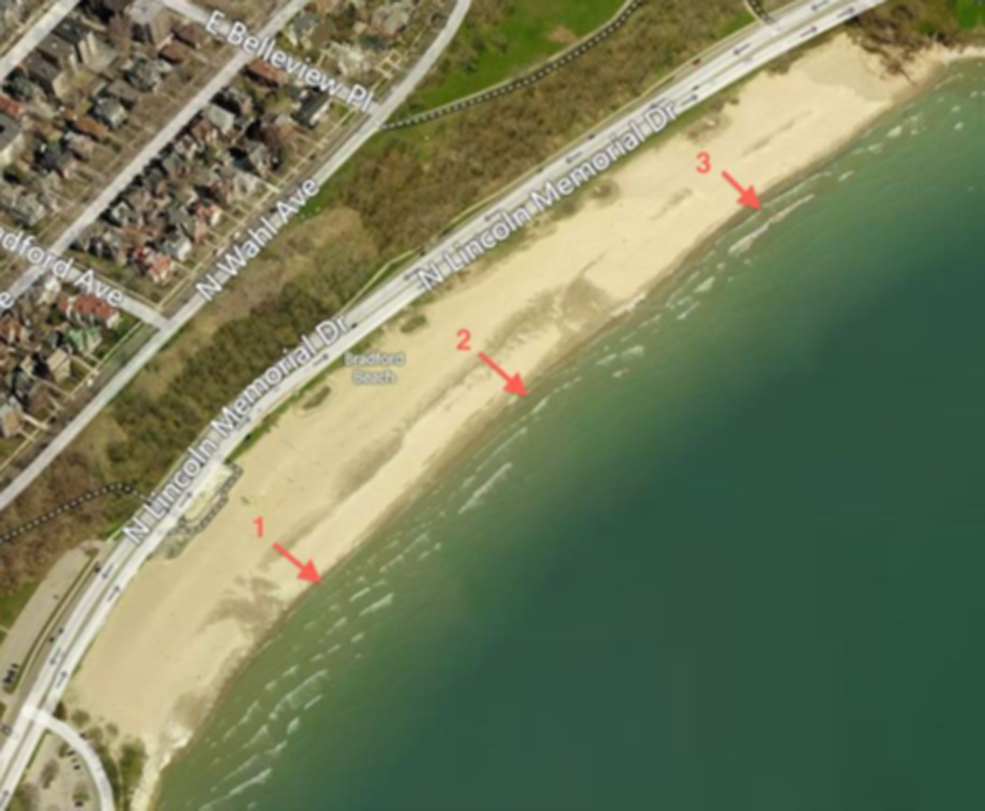
Bradford Beach (Milwaukee, WI) with three sampling locations. Arrows 1, 2, and 3 indicate the sampling location 1 (transect 1), sampling location 2 (transect 2), and sampling location 3 (transect 3), respectively.
Sample preparation
The samples homogenized at 200 rpm using an Excella E24 incubator shaker platform for 5 min to detach indicator bacteria from sand. Before performing the IDEXX Most Probable Number (MPN) analysis, the larger particles in the homogenized samples were allowed to settle for 5 min. To keep the bacterial count within the detection limit of the sampling equipment, 25 g of the sand samples were weighed. After mixing thoroughly and weighing, the sand samples were placed in sterile bottles. Each IDEXX plastic bottle was filled with 200 mL of either of the two eluents (i.e., DI water and PBS). After shaking, the samples were allowed to settle. The 200 mL sample was then placed into two sterile 120 mL vessels, each containing 100 mL. One of the vessels was used for testing and enumerating E. coli, and the other was used for Enterococci. Using the IDEXX Quanti-Tray/2000 method (APHA, 2017), the bacterial concentration in the sample was determined in units of MPN/100 mL.
Ultrapure DI water was produced by the Milli-Q Grad 2 system manufactured by Millipore. Using advanced technologies such as ion-exchange resins, activated carbon, a UV photo-oxidation technique, and 0.22 μm membrane filter, the water was particulate and bacteria-free and had low organics at parts-per-billion levels and high resistivity (8.2 MΩ × cm at 25°C). Negative control tests for E. coli and Enterococci with the two eluents were performed following the IDEXX MPN method. After an incubation period of 24 h at the specific temperature, the Quanti-Tray wells were found to be colorless compared with the IDEXX Quanti-Tray 2000 comparator, which was used as the liquid color or fluorescence reference. For eluents, no fluorescence wells were present for Colilert and Enterolert tests, indicating the absence of bacteria in both DI water and PBS eluents.
Visual classification system for algal level
A rating scale was developed to determine the levels of algae in beach water, with “0” for no algae, “1” for low levels, “2” for moderate levels, and “3” for the high levels of algae. Algal levels were recorded throughout the sampling period with different wave actions near the shore. A rating of “1” indicated a small number of algae visible in the beach water, whereas a rating of “2” indicated a significant number of algae with wave action on the beach. Because of the thick covering in nearshore water, there was no wave action on the beach that led to stagnation, and for that level of algae, the rating was classified as “3,” the highest level on the scale.
According to a report by Kasich et al. (2014), in the absence of additional data, visual evidence can be used to characterize algal blooms as severe (significant cell concentration or surface accumulation is present/visible throughout the water column), moderate (bloom is visible), or minor (little visual evidence of bloom). Visual evidence is used as an initial assessment, which is then refined upon the collection of additional information. In this study, the rating scale based on visual classification was mainly used to identify the presence of algae and maintain consistency in the specific sampling location throughout the sampling period.
Data analysis
Analyses of bacterial data from beach sand and water were performed using the U.S. EPAs CANARY (Hart et al., 2007; Haxton et al., 2013) EDS. The software includes statistical tools to analyze water quality data in real time and in offline mode and thereby identify contamination events. The input data for CANARY can be either a comma-separated value file in offline mode or a link to a database Supervisory Control and Data Acquisition (SCADA) system in online mode (U.S. EPA, 2014).
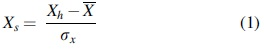
Linear Prediction Correction Filter algorithm in the offline mode of CANARY was used in this study to analyze bacterial concentrations. Based on a historical dataset, the algorithm predicts the current signal value at each time step. The predicted data are compared with the observed data as soon as the actual signal value is available at that time step. The difference between the observed and predicted data, defined as the residual, is calculated and normalized within the software. The algorithm detects a data point as an outlier when the residual value is above the user-defined threshold value (Leow et al., 2017). Once the data point is detected as an outlier, it is no longer used for further predictions. Residuals are normalized with a mean of 0.0 and standard deviation of 1.0 because the water quality signals have different units and magnitude, and normalization allows for combining different signal measurements. The data were normalized using Equation (1).
where Xs is the normalized data, Xh is the historical data, σ
x
is the standard deviation, and  is the mean value.
The software calculates the probability of any contamination event within the Binomial Event Discriminator (BED) window. Depending on the number of outliers detected over a specific time period and whether the probability value exceeds the threshold, the software triggers an “alarm.” For the detection of events, the CANARY algorithm uses binomial distribution theory and produces a binary result (either success or failure) that is further extracted by the BED. The extraction of data by the BED reduces the influence of time steps with unexpected data (Murray and Haxton, 2010).
The configuration parameters of the EDS require optimization for a specific set of data to be analyzed. The optimized parameters in the configuration file of CANARY include the history window, the outlier threshold, the event threshold, and the BED window. During the configuration process of the software, the algorithm selects the optimal values of these parameters and adjusts the BED for an increasing or decreasing probability of anomalous water quality events. Among the configuration parameters, the history window and the threshold are the most significant factors influencing software performance. The optimal configuration parameters selected were history window = 6, outlier threshold = 0.80, BED window = 6, and event threshold = 0.89. The detailed sensitivity analysis for CANARY software is provided in the Supporting Information.
In this study, the measured bacteria levels in beach sand and water were analyzed in the offline mode of CANARY using historical data. However, in online mode, CANARY can analyze datasets in real time, differentiate real events from background variability, and trigger an alarm to alert the operator to take immediate action against possible contamination. Although we were not able to use real-time data in the online mode of CANARY, we observed the effectiveness of the software by using historical data for the detection of anomalies or “events,” which can be useful for the real-time monitoring of bacterial concentrations in beach sand in the future.
Data Analysis and Results
Interaction between bacteria in beach sand and water
CANARY was used to analyze data on E. coli and Enterococci concentrations in samples collected from July 1, 2013 to August 21, 2013. Basic statistical parameters, such as the minimum, maximum, mean, standard deviation, and coefficient of variation (CV) of the input E. coli and Enterococci concentrations used in CANARY, are given in Tables 1 and 2. Bacterial concentrations at different sampling locations were highly variable, with a CV of >100%. A high CV indicates that the data are highly dispersed around the mean value. For E. coli in 6 m inland sand samples, the highest CVs were found at transect 2 for both eluents with 352.43% for DI water and 392.41% for PBS.
Statistical Analysis of Escherichia coli Levels at Different Sampling Locations
DI, deionized; MPN, Most Probable Number; PBS, phosphate-buffered saline.
Statistical Analysis of Enterococci Levels at Different Sampling Locations
For sand samples in the swash zone and 6 m inland, the mean E. coli concentrations were greater at transect 2 than at transects 1 and 3. Similarly, the mean E. coli level in water samples was the greatest at transect 2. For Enterococci in the swash zone, the mean and CV of the bacteria level were higher at transect 3 with both eluents. However, in the 6 m inland samples, transect 2 had the greatest CV and mean concentrations. For Enterococci in water samples, the mean bacterial concentration was 479.73 MPN/100 mL at transect 1, higher than the other two transects. Statistical analysis also indicated significant differences (p < 0.05) between the mean values of log MPN of E. coli and Enterococci in sand and water samples.
Samples were collected on days with no rainfall and days after rainfall events. The rainfall events and associated rainfall-runoff might have affected the measured bacterial concentrations and caused high variations in the bacteria data over the sampling period. Kleinheinz et al. (2009) showed a significant association between rainfall and elevated bacterial counts. A higher standard deviation than the mean value indicates that the data are not normally distributed, and some of the measured values affected by the rainfall event may be significantly higher than all other data. Whitman and Nevers (2003) also reported higher standard deviations than mean E. coli counts in water samples, which resulted in CV >100%. In this study, quality control was assured by following the U.S. EPA statistics for microbiological analysis in the U.S. EPA microbiology methods manual, Part IV, A–C (Bordner et al., 1978). Before performing statistical analysis, the original data were converted into logarithms to obtain a symmetric distribution resembling the normal distribution. The best measure of central tendency for microbiological data is the log transform.
Table 3 provides the results from CANARY for both bacteria in sand samples with different eluents and in water samples. The results indicate that DI water produced a higher number of events than PBS for E. coli. The mean values of the measured E. coli concentration in sand samples at different locations were also greater for DI water than for PBS (Table 1). The detailed statistical analysis supporting this finding is given in Table 4.
CANARY Output (Number of Detected “Events”) for Sand Samples in Swash Zone and in 6 m Inland and Water Samples
Paired t-Test Analysis for Escherichia coli and Enterococci with Deionized Water and Phosphate-Buffered Saline Eluents
For E. coli, CANARY identified a total of eight events with DI water and only four events with PBS. However, for Enterococci bacteria, a total of 10 events were identified with DI water, and a total of 11 events were detected with PBS. Both eluents resulted in the same number of events (four events) for E. coli in the swash zone, whereas no events were detected with the PBS eluent in samples from 6 m inland. In addition, when using DI water, a higher number of events were detected for Enterococci than E. coli in both the swash zone and 6 m inland samples, whereas with PBS, similar numbers of events were detected in the swash zone for both E. coli and Enterococci. With PBS, a significantly higher number of events were found for Enterococci than for E. coli in 6 m inland samples.
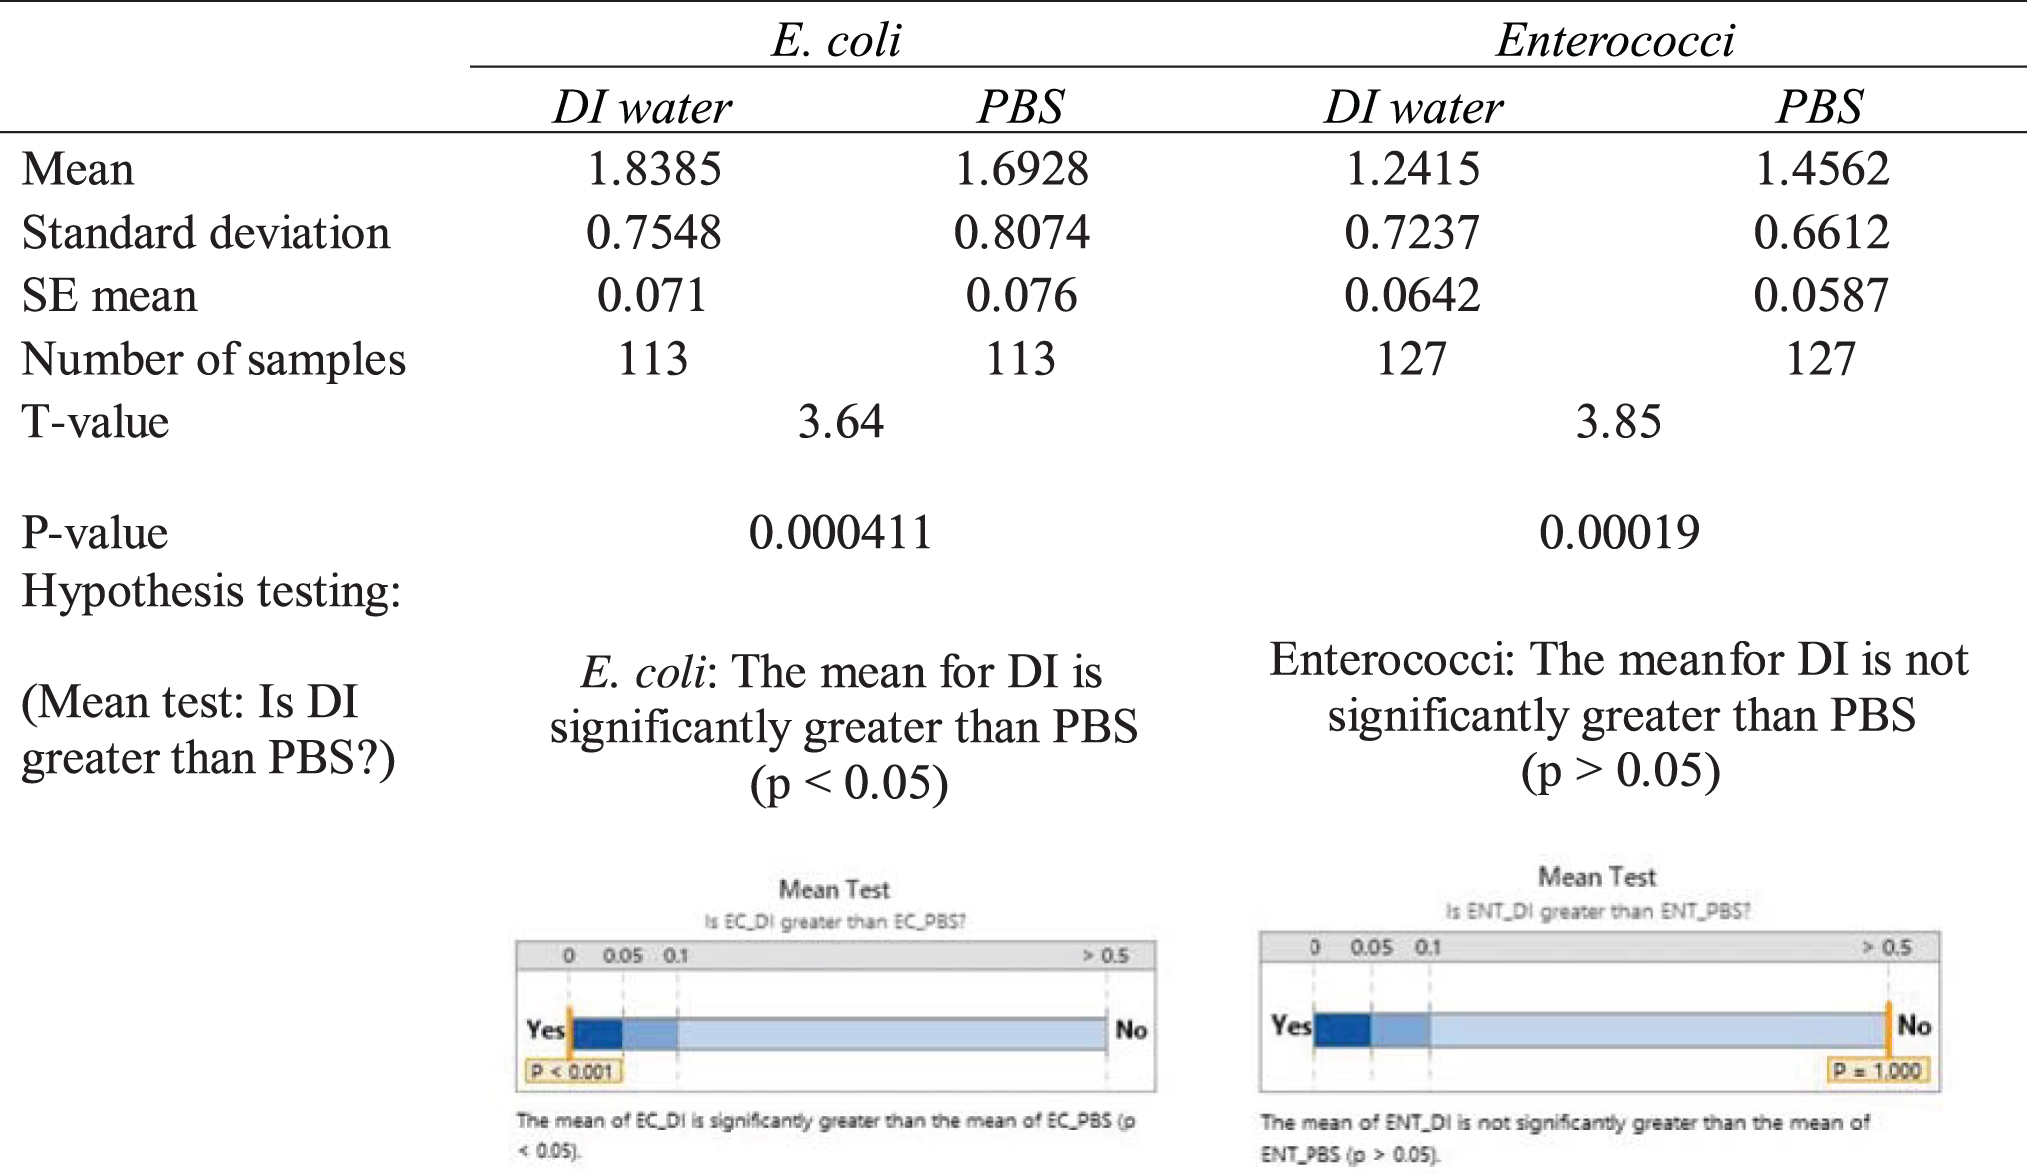
Analysis was performed using CANARY to evaluate the potential of freshwater sand to act as a reservoir of indicator bacteria. This was accomplished by comparing the number of detected events by CANARY that resulted in anomalous water quality in water and sand samples in both the swash zone and 6 m inland for E. coli and Enterococci bacteria. The results indicate that a higher number of events were found for the indicator bacteria in sand samples than in water samples, as given in Table 3 and Figure 2.
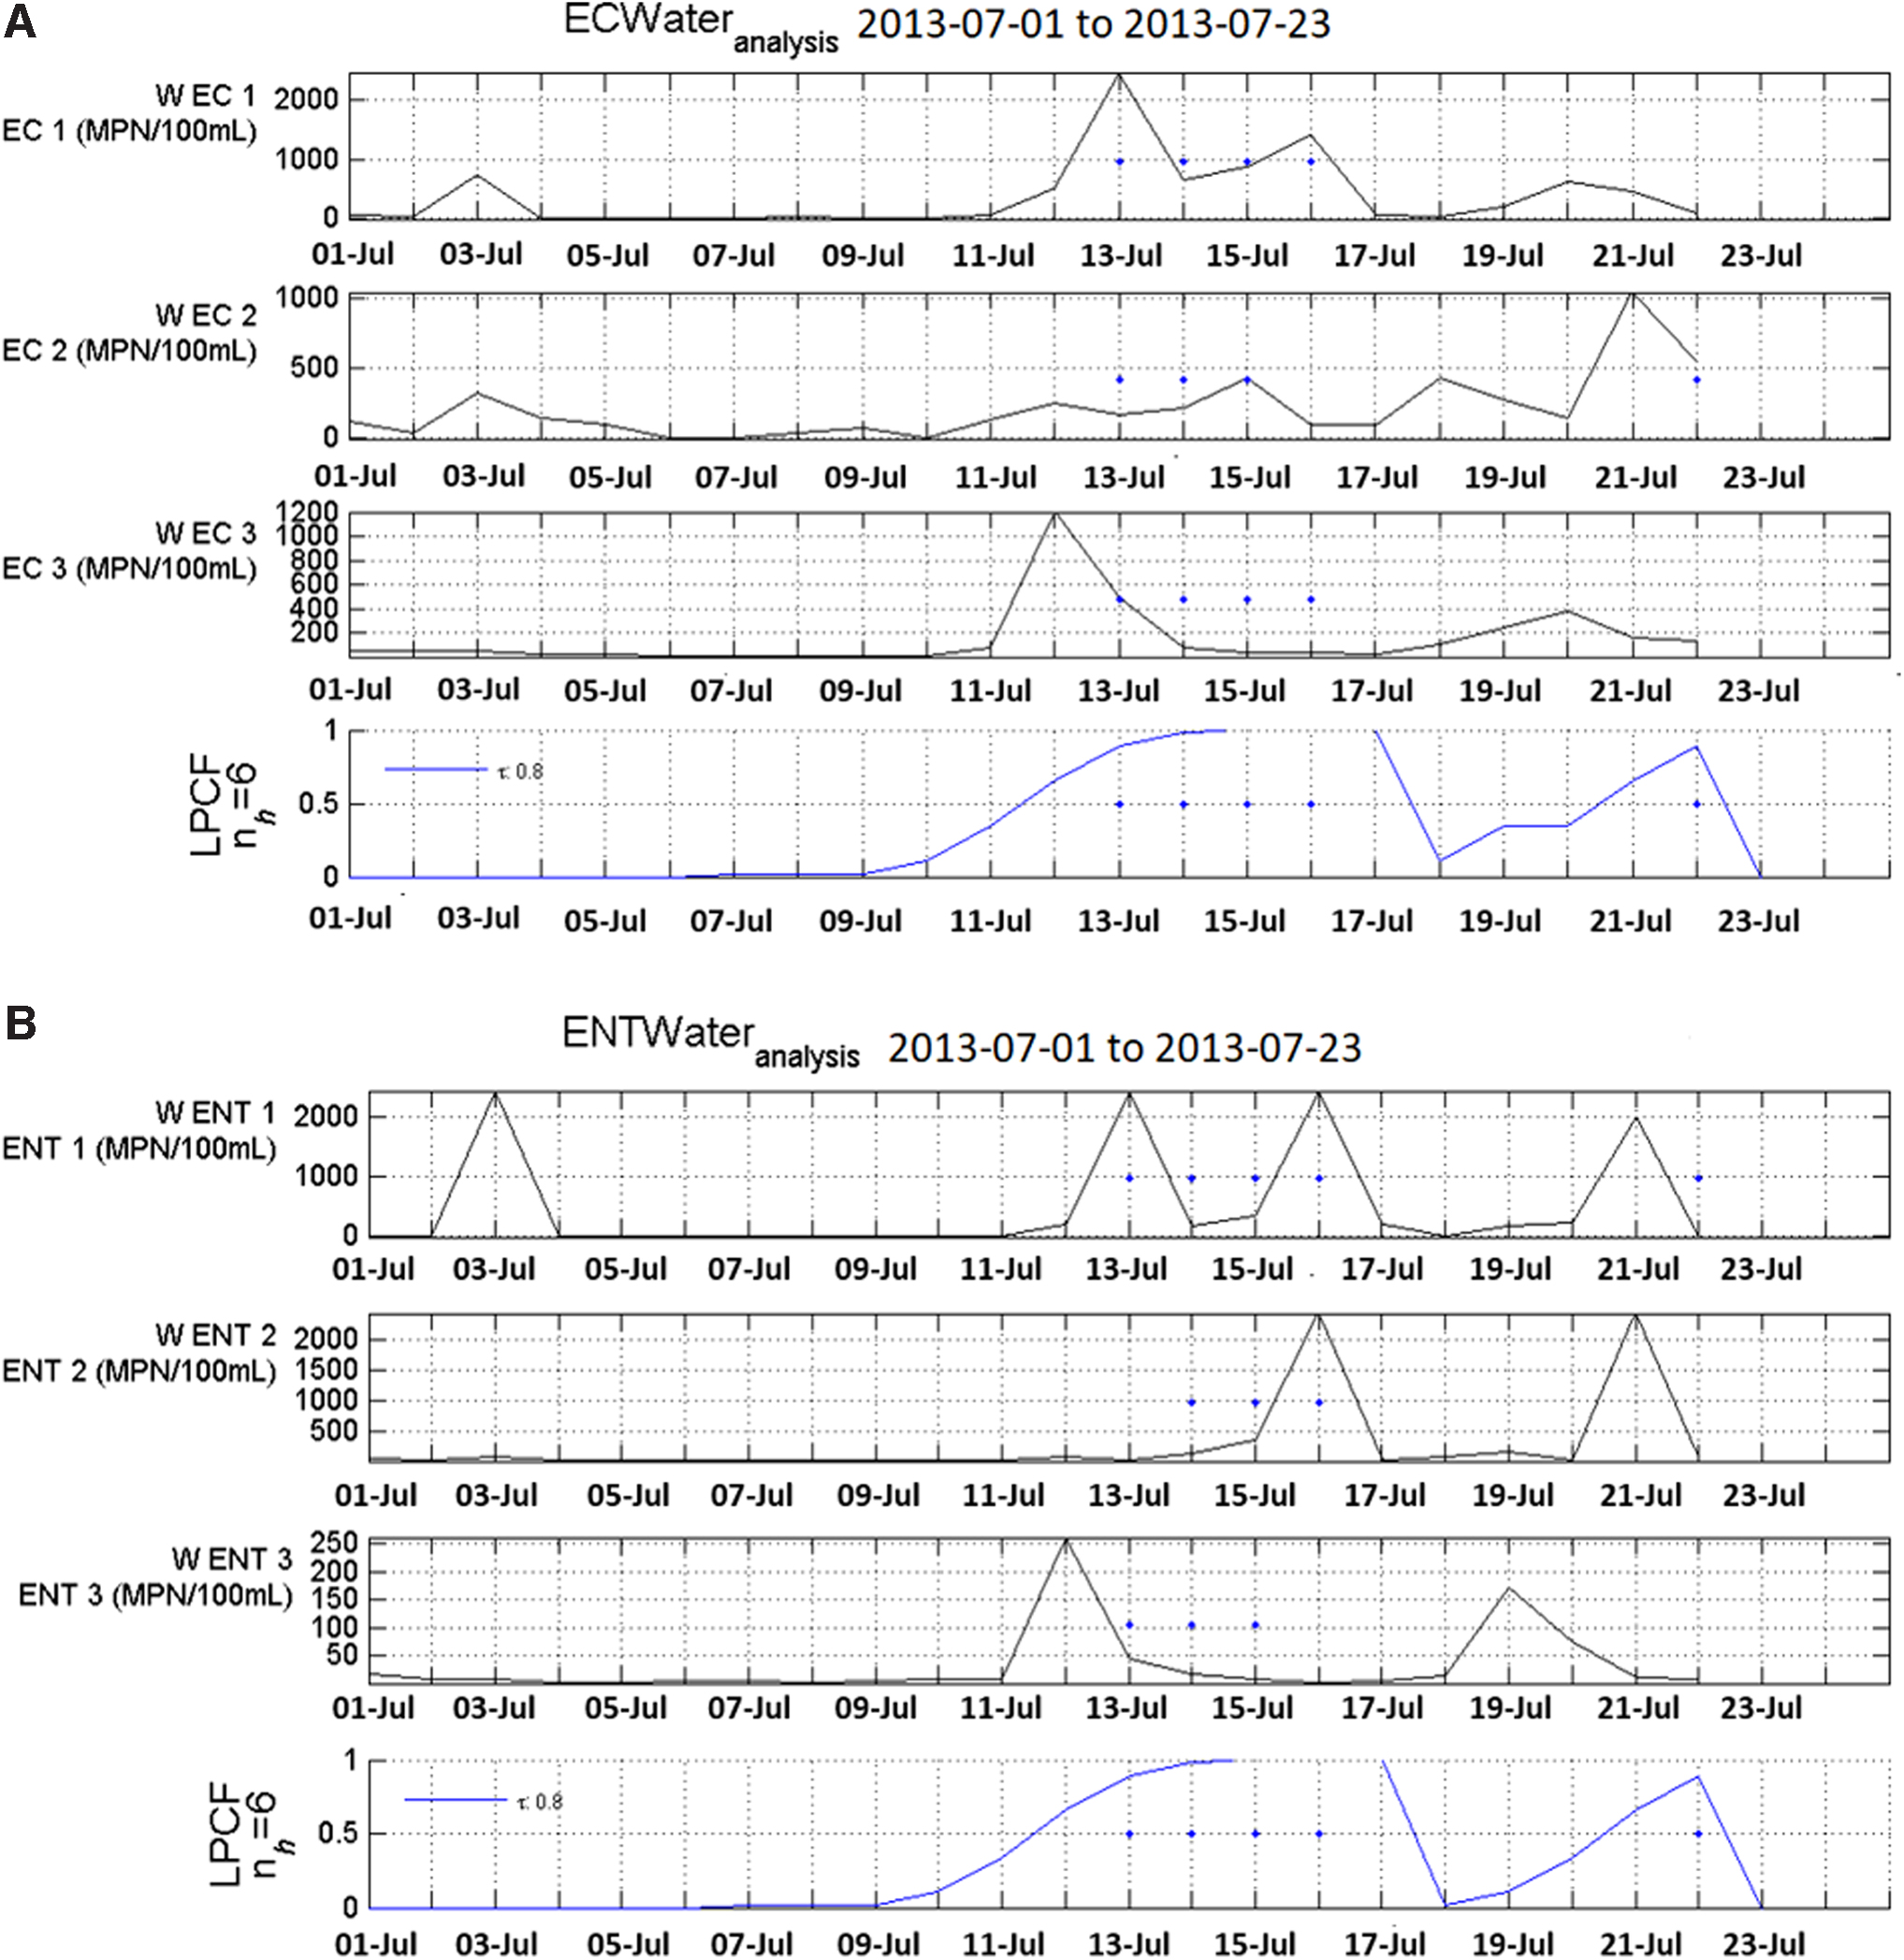
CANARY output for
Figure 2 shows the signal plots of the bacterial data, as well as the event probability plot. The event plot shows the probability that an event will occur at each time step as computed by CANARY. The dots on the event probability plot indicate events. In addition, the dots on the signal plots represent the bacterial data that contributed to the identification of an event at that time. Five events were detected in water samples for both E. coli and Enterococci bacteria, whereas in sand samples, more than five events were detected. In addition, when using PBS, Enterococci appeared to accumulate in sand to a greater extent than did E. coli. These results suggest that freshwater beach sand can be evaluated further for its potential to serve as a reservoir for the survival of indicator bacteria. Additional plots for CANARY outputs are provided in the Supporting Information.
Effect of eluents
A paired t-test analysis was performed using Minitab statistical software for both bacteria to compare DI water and PBS as eluents, as given in Table 4. The results show differences in mean values (log MPN/100 g sand) between eluents for both bacteria. When using DI water, the mean value of log MPN was 1.84 for E. coli and 1.24 for Enterococci, whereas with PBS, the mean values of log MPN were 1.69 and 1.46, respectively. The differences in the mean values of log MPN between the two eluents were statistically significant with p < 0.05 at a 95% confidence level. Hypothesis testing was also performed to analyze whether the mean log MPN value of DI was greater than that of PBS. The results reveal that, for E. coli, the mean of log MPN of DI was greater than that of PBS at the 0.05 level of significance, and the difference in mean values between the eluents was 0.1457 log units.
For Enterococci, there was not enough statistical evidence to conclude that the mean log MPN of DI was significantly greater than that of PBS. Instead, for Enterococci, the mean log MPN of PBS was greater than that of DI water at the 0.05 level of significance (p < 0.001). From the statistical analysis, it appears that DI water produced higher E. coli counts, whereas PBS produced higher Enterococci counts. For the eluent comparison, 113 and 127 E. coli and Enterococci samples were used, respectively, for the entire sampling duration. Figure 3 provides the log MPN values for all samples analyzed with both eluents. The results indicate that the ratios between the two eluents varied highly among samples, and the variability was statistically significant with p = 0.00603 < 0.05 at a 95% confidence level.
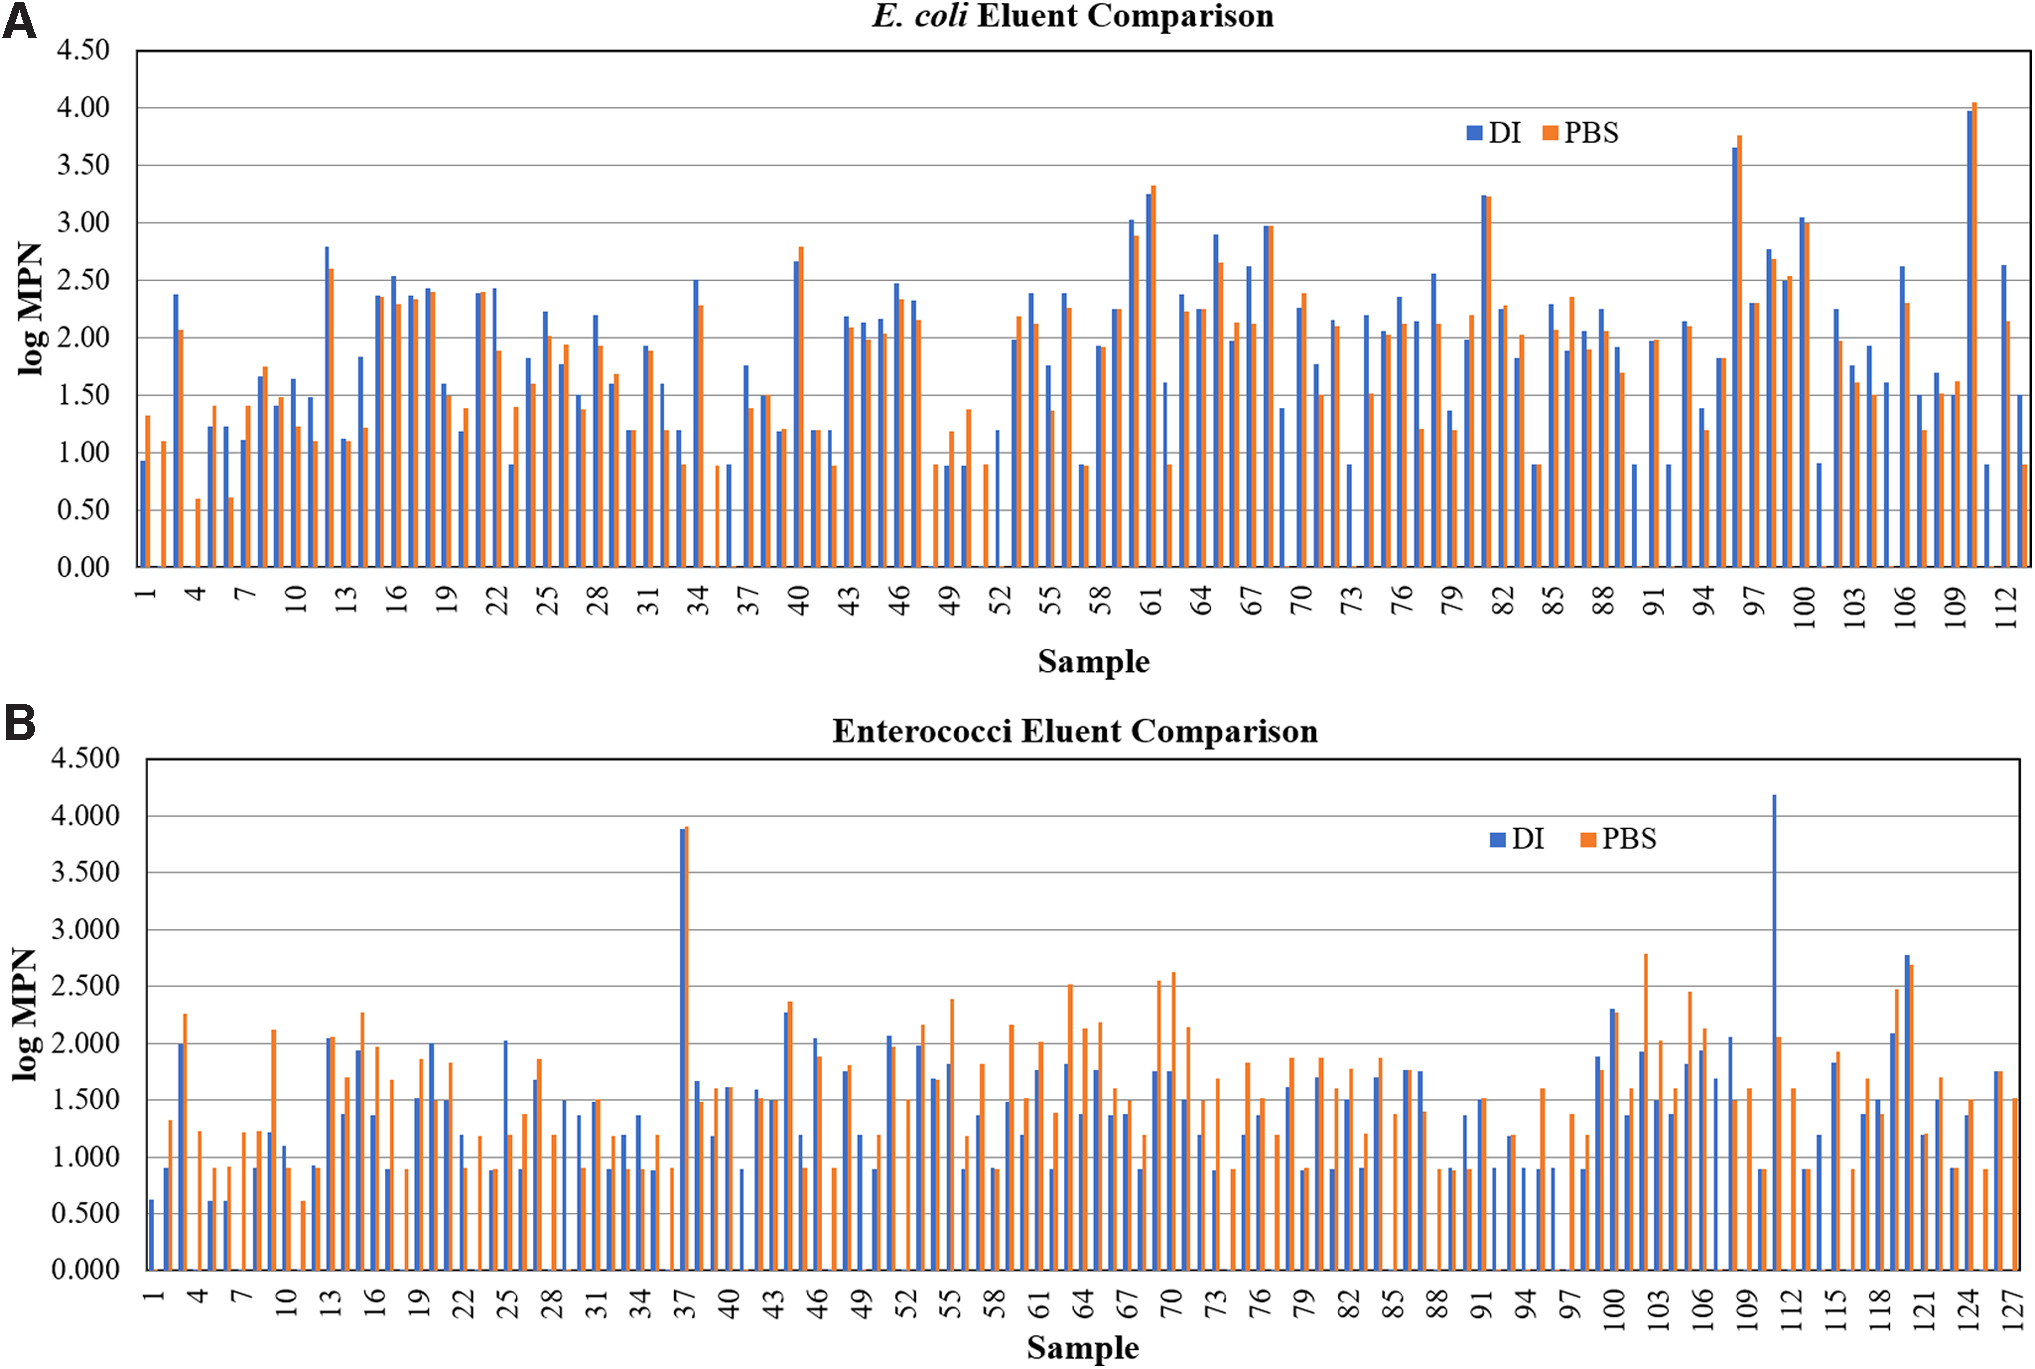
Eluent comparison for
The log-transformed MPNs of bacterial colonies were plotted to show the effects of eluents. The results given in Figure 4 show that, on average, DI water provided higher MPNs than PBS for E. coli. An attempt was made to establish a direct relationship between the two eluents for each group of bacteria. The slope and R2 values for E. coli were 0.92 and 0.73, indicating a relatively strong linear relationship between the MPNs generated from DI water and those from PBS. For Enterococci, the relationship between the results generated from the two eluents is weaker.
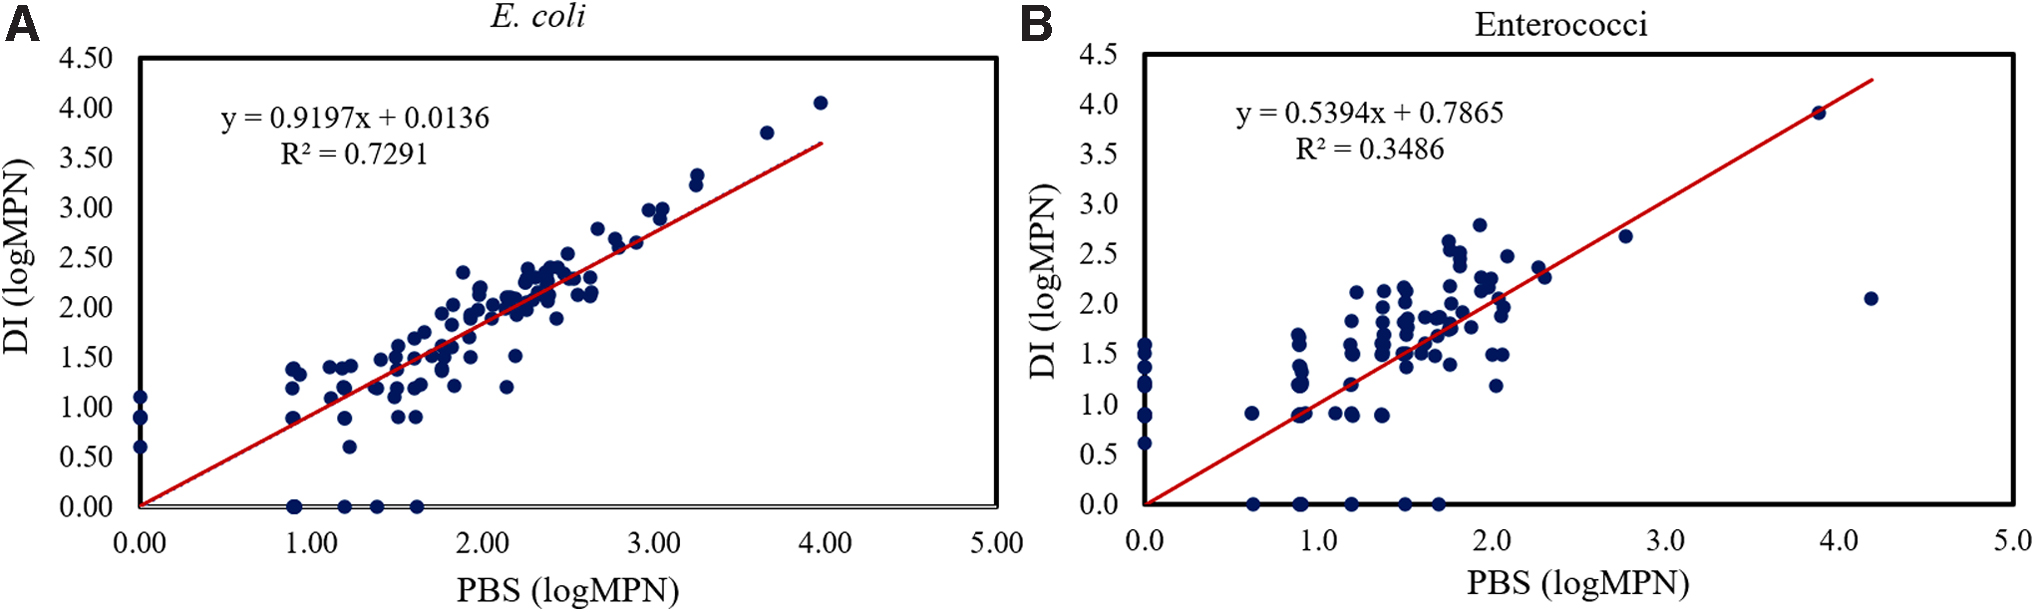
Pearson correlation analysis between the two eluents for E. coli and Enterococci bacteria was performed using Minitab software. As given in Table 5, a strong positive correlation (R2 = 0.854) was observed between the two eluents for E. coli, whereas the correlation between the eluents was weaker (R2 = 0.59) for Enterococci. The correlation coefficients results were statistically significant with p < 0.05 for a 95% confidence level, which indicate that, for E. coli, the association between the eluents can be accurately demonstrated owing to the well-correlated dataset. However, it is difficult to determine the relationship between the two eluents for Enterococci with the highly varied dataset.
Pearson Correlation Analysis Between the Two Eluents for Escherichia coli and Enterococci
CI, confidence interval.
Impact of the algae level on bacterial concentration
CANARY was used to analyze the impact of algae on the bacterial concentration in water samples. Figure 5 provides the output for E. coli and Enterococci counts with algae levels throughout the sampling period. The results indicate a correlation between algae levels and bacterial counts, as the events with the highest bacterial counts often occurred when levels of algae were elevated. It appears that bacterial concentration deviated from its baseline and was detected as an anomaly during the time step when the presence of algae was reported to be high with a rating of 3.
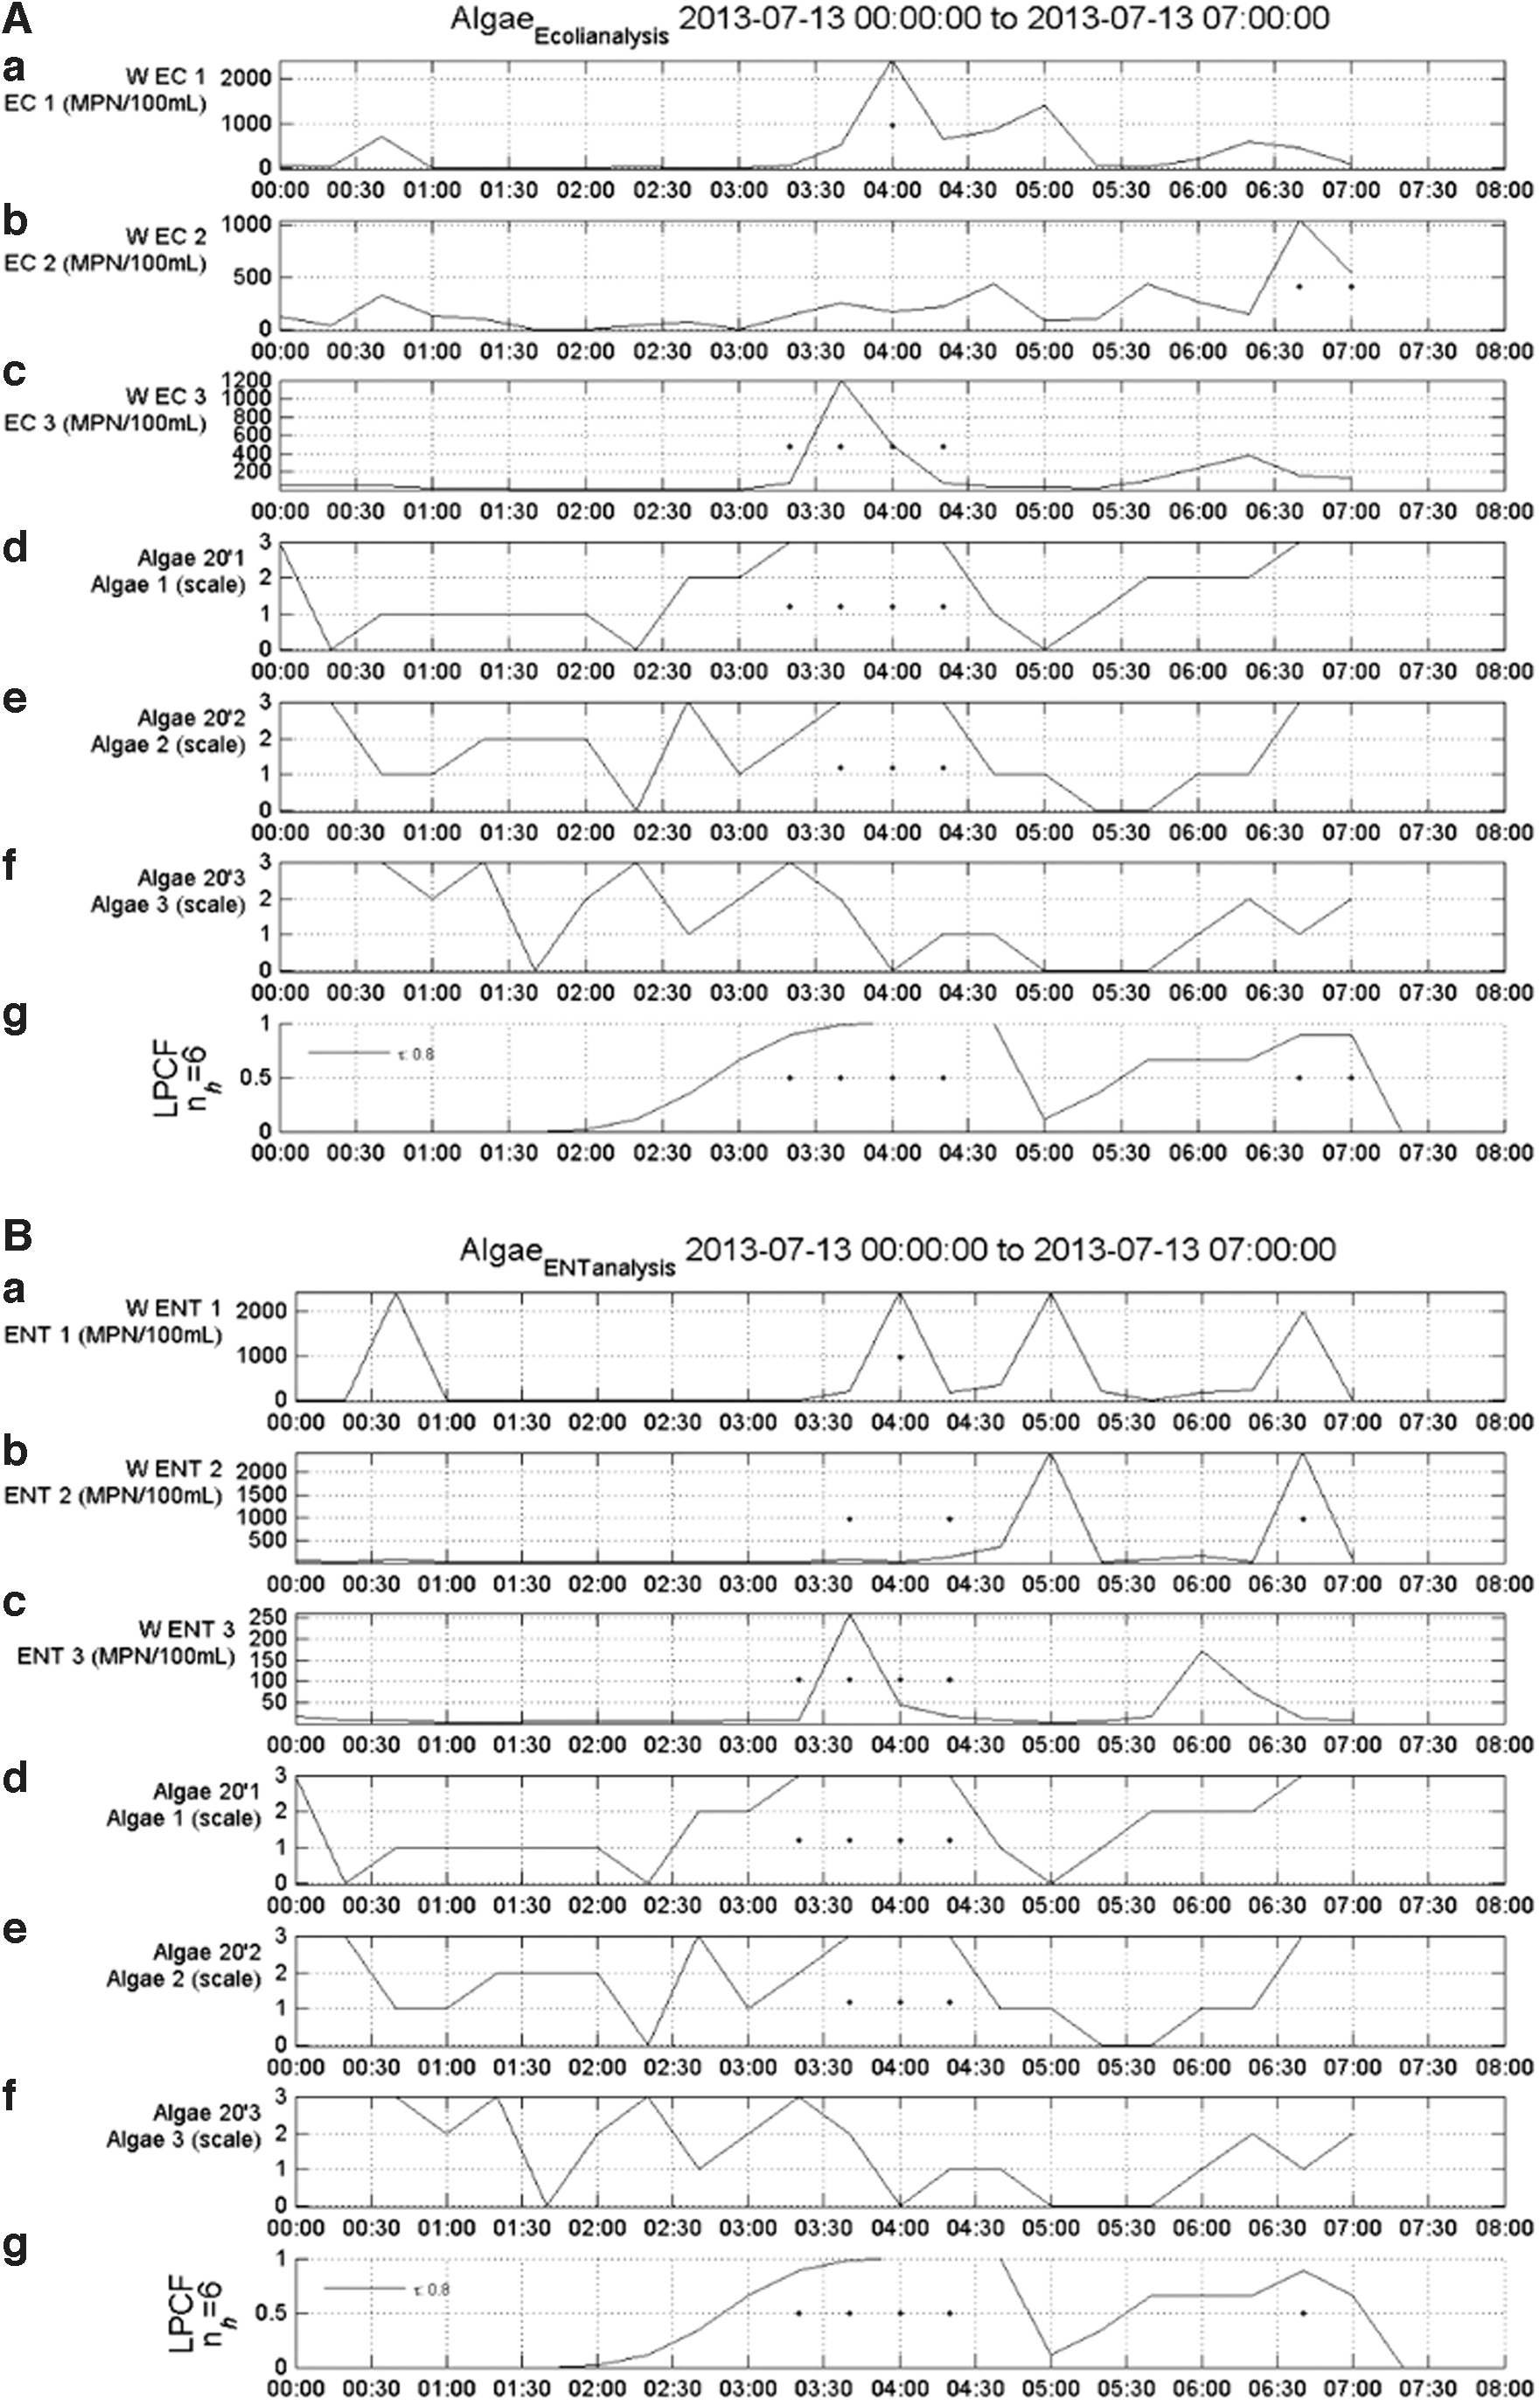
Consequently, events were detected by CANARY during the time step between 03:20 and 04:20 for E. coli, as there were deviations from normal behavior at transects 1 and 3, when the algae level was found to be higher during that period. At transect 2, the presence of algae was more significant, which resulted in detected events during the time step from 06:40 to 07:00, with significant variations in E. coli concentration. The presence of high levels of algae appeared to have a similar effect on Enterococci at the three transects. Figure 5 indicates that events were detected during the time step between 3:20 and 4:20, and there were baseline variations in Enterococci counts at transects 1, 2, and 3.
In addition, the average bacterial counts in water and sand samples collected in the swash zone during summer were determined to have a positive correlation with the presence of algae. In Table 6, it appears that the gradually increasing rating scale of algae at the three transect locations was positively correlated with the average bacterial count, which increased with the level of algae. However, there was an exception to this relationship for the Enterococci counts in water samples. In addition, the results of Pearson correlation analysis indicate a strong positive correlation between the algae level and bacterial concentration, with an R-value ranging from 80% to 95%, as given in Table 7. The correlation between algae level and E. coli in water and swash zone samples was statistically significant at the 0.05 level of confidence. However, for Enterococci, the correlation was not statistically significant (p > 0.05). The reason for this might be the small sample size. With increased sample sizes, the results for Enterococci could be interpreted more significantly.
Average Bacterial Count (Most Probable Number/100 mL) with Different Algal Levels (Scale 0–3) in Water and Sand Samples in the Swash Zone
Pearson Correlation Analysis Between the Algal Level and Bacterial Count
Discussion
In this study, slightly higher E. coli counts were measured when DI water was used as the eluent compared with PBS. An important factor in bacterial adhesion to sand in a beach environment is the electrostatic interactions between the water chemistry and bacteria, which can be predicted by traditional Derjaguin–Landau–Verwey–Overbeek (DLVO) theory. Under most conditions, E. coli, Enterococci, and quartz sand are characterized by electronegativity, with Enterococci being the most electronegative (Yamahara et al., 2007; Chen and Walker, 2012). The surface charge of mineral particles depends on the pH of water. Given the fact that the point of zero charge of quartz is 3 and the pH of DI and PBS solution is circumneutral, it is difficult to explain the difference in bacterial elutriation between DI and PBS. It appears that the bacteria–mineral particle interaction is determined by the cell membrane charge based on ionic strength and ionic species.
Yee et al. (2000) demonstrated the adsorption of bacteria onto mineral surfaces as a function of time, pH, ionic strength, and the bacteria/mineral mass ratio. The data indicated that ionic strength had a strong impact on the interaction between the bacteria and mineral surface. In addition, the adsorption behavior was controlled by the chemical speciation on the surfaces. In this study, the results indicate that the attachment of E. coli to sand was greater than that of Enterococci, which agrees with the energy profiles calculated by DLVO theory, with E. coli predicted to have a lower energy barrier to attachment than Enterococci. Another factor that affects bacterial adhesion to sand is water ionic strength. The repulsive force between sand and indicator bacteria, both of which are electronegative, decreases as the water ionic strength increases. This explains the slightly higher detachment rate for E. coli when DI water was used as the eluent compared with PBS.
In addition to eluent ionic strength, phosphate in PBS, appears to affect bacterial adhesion as the zeta potentials of quartz sand and indicator bacteria decrease because of phosphate. Previous research showed that the addition of phosphate caused the release of attached E. coli from quartz sand (Wang et al., 2011). It is also possible that phosphate competes with bacteria for binding sites on the surface of sand particles. As a result, bacterial adhesion to the sand surface may be reduced.
Although the attachment of bacteria to sand is an important factor, the survival of bacteria in a particular eluent is also important, that is, the osmotic pressure on E. coli, which is a Gram-negative bacteria, can increase because of DI water (Bayer, 1967). Although there is a possibility of increased E. coli cell death in DI water, DI water was found to be a more effective eluent than PBS in this study. This indicates that, for E. coli in DI water, bacterial adhesion efficiency has a greater effect than cell death when compared with PBS. Enterococci, as Gram-negative bacteria, can endure osmotic stress and are therefore mostly unaffected by the osmotic stress in DI water (Lleo et al., 2005).
Interactions between indicator bacteria and environmental factors are very complicated, which emphasizes the need to understand the role of the local environment as a source or sink for bacteria. People generally prefer sandy environments when visiting a water body for swimming and recreational purposes. This highlights the importance of understanding the interactions of environmental factors with beach sand, water, and bather health. Bacteria in water can be affected by many environmental factors. Sand can provide a protected environment that enables the survival of indicator bacteria. In a favorable environment with sufficient nutrients available, less sunlight inactivation, and protozoan grazing, the microbial community may grow, resulting in higher bacterial counts.
It has been observed that bacteria can survive longer in sand than in water because they can more easily adhere to sediment particles than free particles in water (Whitman et al., 2003). Alm et al. (2003) reported that the cultivatable concentrations of E. coli and Enterococci in wet sands were 3–17 times and 4–38 times higher, respectively, than those in water. The presence of bacteria in sand can have significant effects on bacterial counts in water, which requires future research to provide a better understanding.
The results of this study indicate that the presence of algae is an important factor for higher microbial concentrations in beach water. A previous study reported the presence of green algae (Cladophora glomerata) along the shore of Lake Michigan beaches during the summer months. Indicator bacteria such as E. coli and Enterococci can grow on the cell wall of Cladophora algae, which provides favorable conditions that provide sufficient nutrients, a grazing surface, and a suitable environment for attachment (Whitman et al., 2003). Wave and wind actions may release microorganisms into the nearshore of beach sand and water.
However, some other potential contamination sources, such as combined and sanitary sewer overflow, stormwater discharge from outfalls near beaches, wildlife residing or visiting in or near beaches, and runoff from parking lots and other impervious areas near beaches, may contribute to the higher bacteria (E. coli) concentrations detected at the sampling location. Moreover, rainfall events that occurred during the summer months and the stormwater runoff associated with the rainfall may lead to the transportation of contaminants, including fecal coliform, to beach sand and water. Beach water can be contaminated with fecal matter from humans, livestock, and other wildlife and result in microbial contamination of beach sand.
Conclusion
This study was undertaken to analyze bacterial concentrations and develop methods to accurately predict public health outcomes as a result of increased contamination with fecal indicator bacteria. The statistical analysis indicated the possibility of establishing a relationship between the E. coli results obtained using the two eluents, that is, DI water and PBS; however, for Enterococci, the results were less promising because of high variation in the ratios of enumerated bacteria between the two methods. The ability to establish a ratio of bacterial counts among eluents would be a convenient tool with which to compare data collected using different eluents. CANARY may be useful as an early warning system for monitoring beach contamination and may help to identify abnormal conditions.
Footnotes
Authors' Contributions
The original concept and supervision of the research by J.L. and Q.L. and editing by J.L. and N.N.; figures and writing of the article by N.N., B.B., and R.S.
Author Disclosure Statement
No competing financial interests exist.
Funding Information
This work was supported by National Science Foundation (Grant No. 0933230).
References
Supplementary Material
Please find the following supplemental material available below.
For Open Access articles published under a Creative Commons License, all supplemental material carries the same license as the article it is associated with.
For non-Open Access articles published, all supplemental material carries a non-exclusive license, and permission requests for re-use of supplemental material or any part of supplemental material shall be sent directly to the copyright owner as specified in the copyright notice associated with the article.