
Abstract
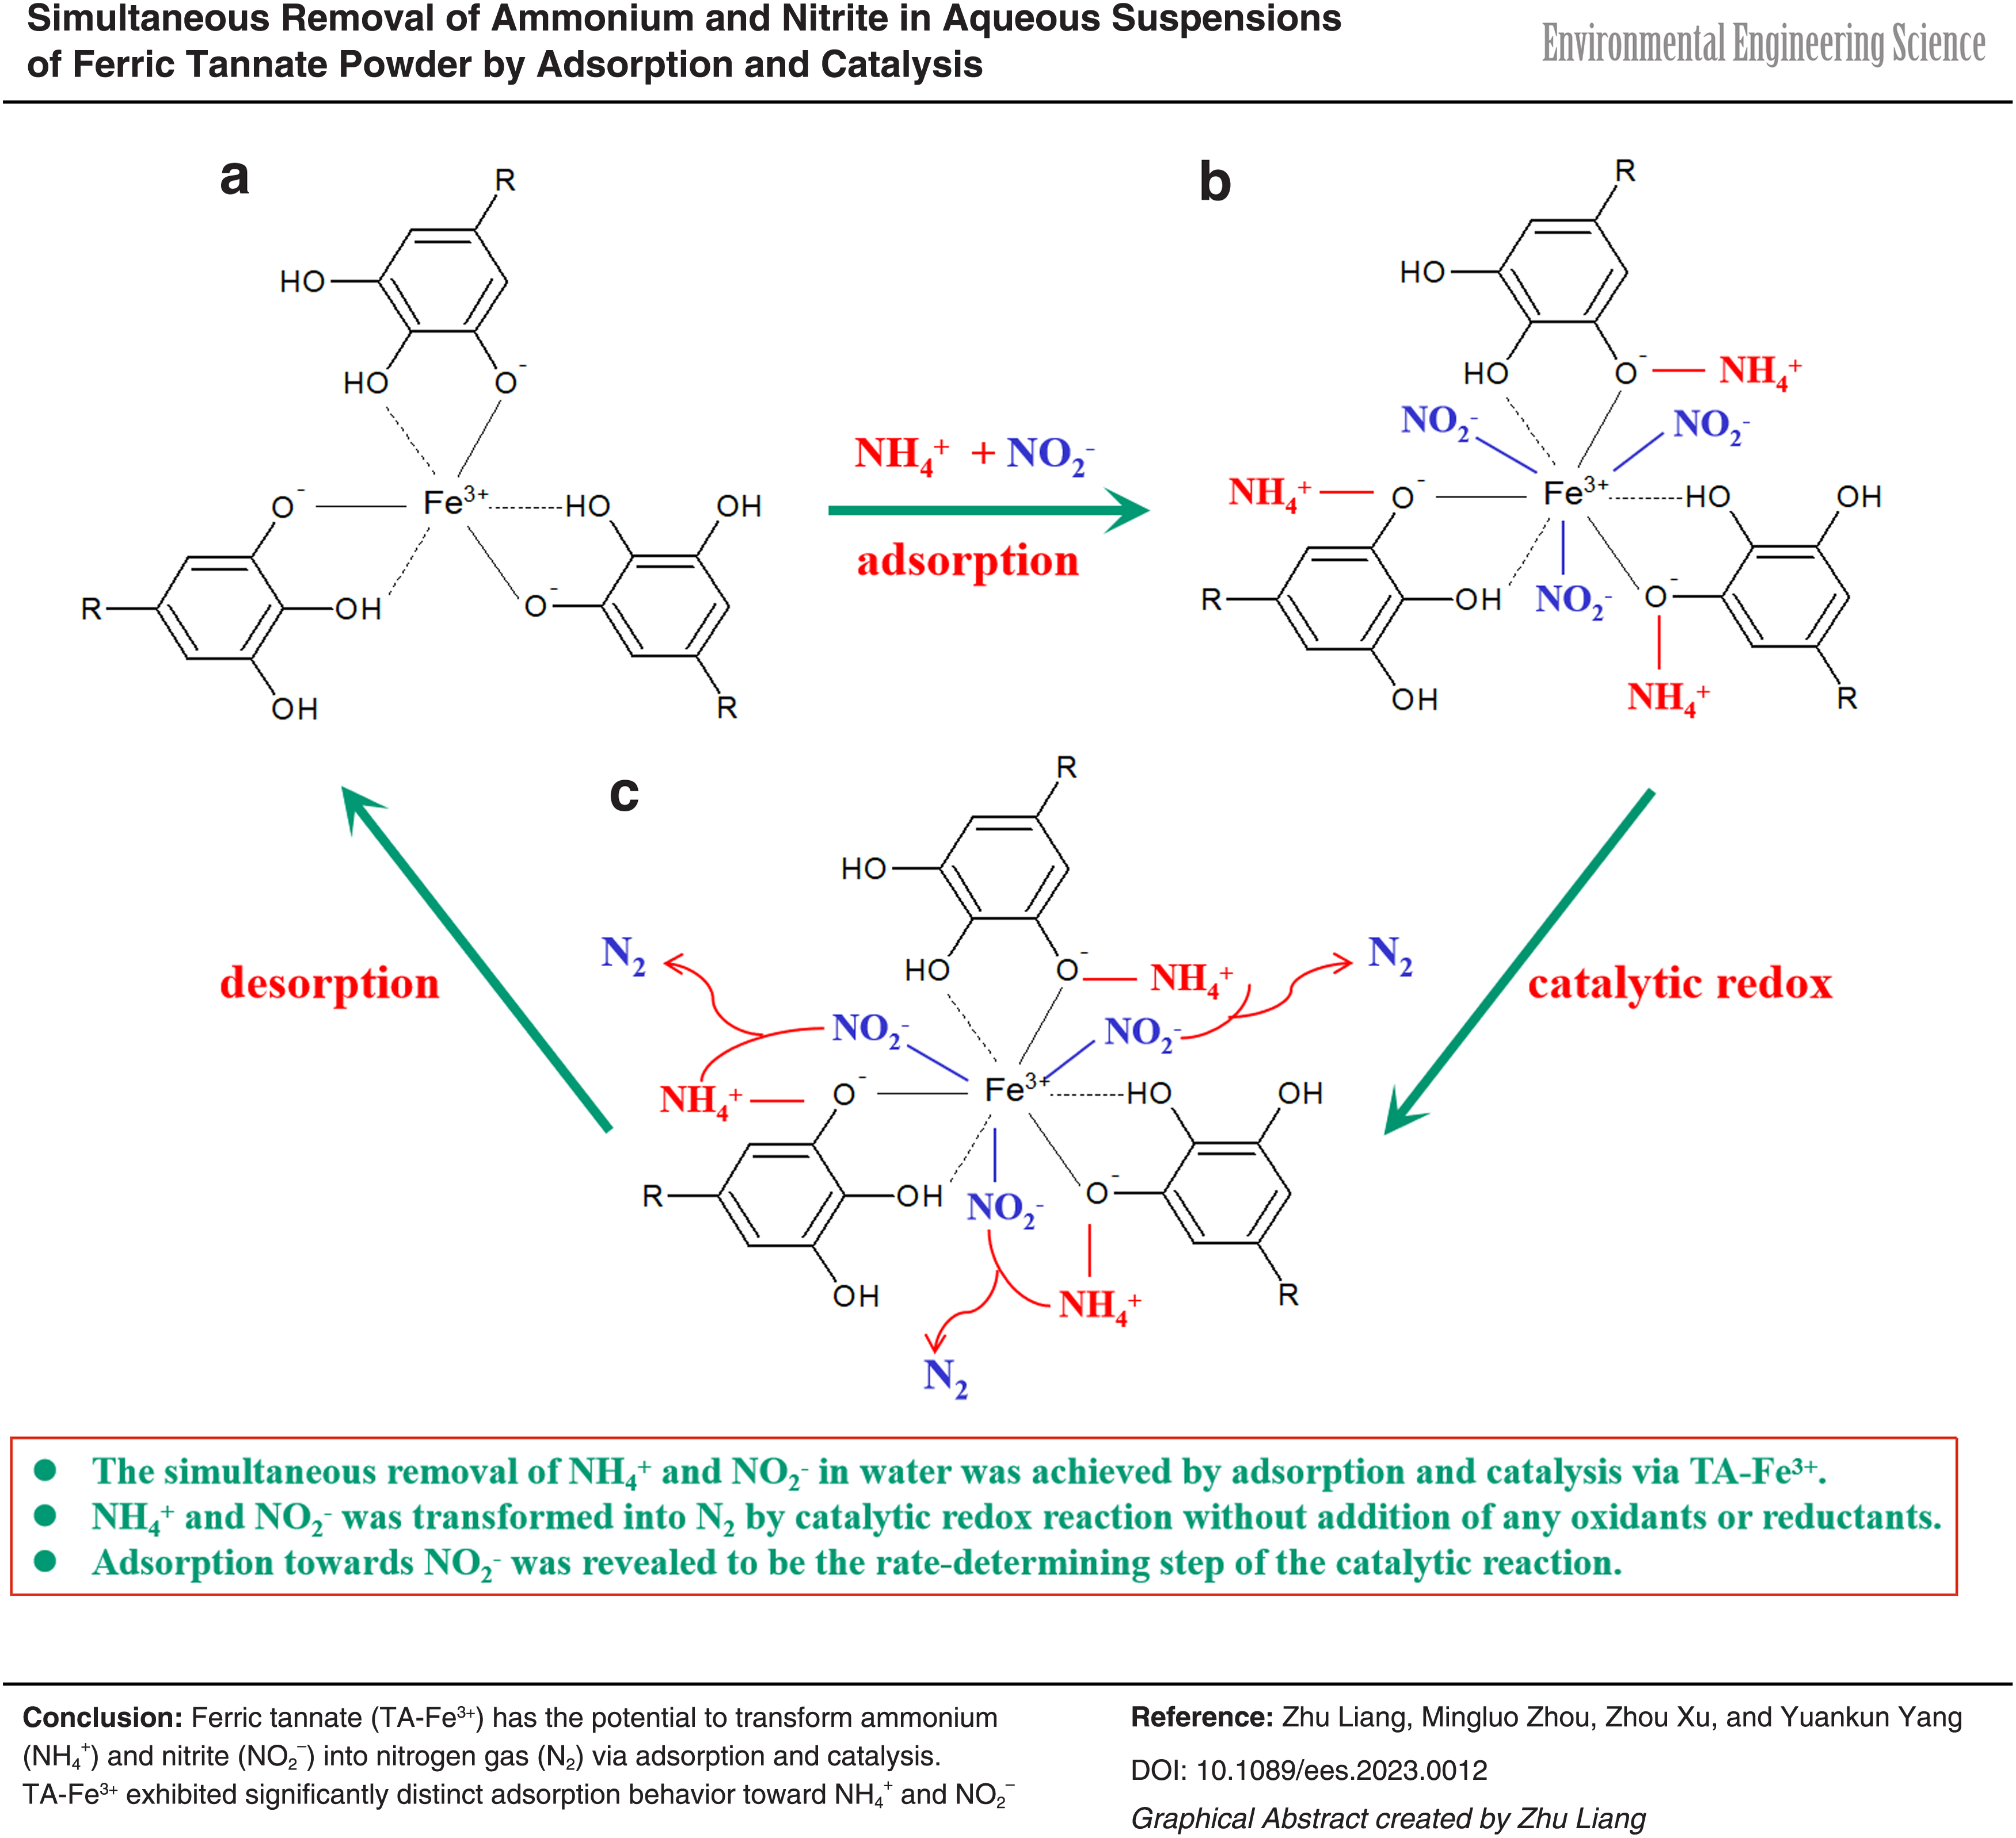
Ferric tannate (TA-Fe3+) has the potential to transform ammonium (NH4+) and nitrite (NO2−) into nitrogen gas (N2) through adsorption and catalysis. Few reports have given detailed account of different adsorption behavior for NH4+ and NO2−, which is important to develop the potential of the material. TA-Fe3+ was synthesized here and its performance as an adsorbent/catalyst for the simultaneous removal of NH4+ and NO2− from water was investigated. Results confirmed the adsorption and catalysis capability of TA-Fe3+ toward NH4+ and NO2−: (1) Following a 24 h adsorption and redox, the concentrations of NH4+ and NO2− in the mixed solution decreased from initial values of 10.71 and 7.14 to 4.28 and 1.64 mmol/L, respectively, and 0.41 mmol/g of N2 was produced with a maximal N2 yield rate of 0.072 mmol/[g·h]. The N2 yield was about 144 times that in the absence of TA-Fe3+; (2) intermediate products such as nitrous oxide (N2O) and nitrate (NO3−) were not detected; and (3) Raman spectrum analysis identified the site of Fe–O bond to be the center of adsorption and catalysis. Moreover, there were interesting findings: (1) TA-Fe3+ exhibited significantly distinct adsorption behavior toward NH4+ and NO2−. External diffusion and internal diffusion exerted a key influence on the adsorption toward NH4+ and NO2−, respectively; NH4+ was adsorbed on TA-Fe3+ in the form of monolayer, and NO2− in the forms of both monolayer and multilayer; (2) TA-Fe3+ was easily regenerated with water; and (3) adsorption toward NO2− was the rate-determining step of the catalytic reaction. These findings will provide valuable enlightenment for the further work to reveal the adsorption and catalysis mechanisms of TA-Fe3+.
Introduction
Ammonium (NH4+)
Anaerobic ammonium oxidation (Anammox) combined with partial nitrification, a novel biotechnology for nitrogen removal, can simultaneously remove NH4+ and NO2− without additional oxidants and reductants (Liang and Liu, 2008). However, an extremely slow growth rate of anammox bacteria limits its wide practical application (Nozhevnikova et al., 2012).
New materials and technologies for nitrogen removal with high purification and energy efficiency have attracted more attention due to the current strain on energy sources and the stringent discharge regulations.
The redox reaction [Eq. (1)] can theoretically occur between NH4+ and NO2− according to their standard redox potential (Table 1) (Fanning, 2000). Thus, ammonium and nitrite in solution can be simultaneously removed without any additional oxidant and reductant through the chemical reaction. However, the reaction requires high temperature and acidic condition for high reaction rate. Adsorption and catalysis are attractive technologies for wastewater treatment due to high removal efficiency (Klimenko et al., 2009; Rashid et al., 2021). If a material can not only adsorb NH4+ and NO2−, but also accelerate the reaction between them through catalysis under moderate conditions, this reaction would be developed as a promising alternative for nitrogen removal from wastewater. On one hand, NH4+ and NO2− can be transferred from solution onto this material by adsorption, leading to the concentrated NH4+ and NO2− on its surface. On the other hand, the adsorbed NH4+ and NO2− can be converted to N2 by catalysis, leading to the regeneration in situ of the adsorbent.
Standard Redox Potential
φ°a in acidic solution; φ°b in basic solution.
NH4+, ammonium; NO2−, nitrite; N2, nitrogen gas.
Furthermore, a novel nitrogen removal process can be formed through the combination of the catalytic redox reaction and biological partial nitrification: first, 50% ammonium in wastewater is converted to nitrite through biological partial nitrification; second, nitrite and the residual ammonium are catalyzed to produce N2 through the Equation (1). Compared with the traditional aerobic nitrification and anoxic denitrification, the process can theoretically save 62.5% energy consumption and 100% supply of organic substrates.
A titanium (IV) oxide photocatalyst was used to realize the simultaneous removal of nitrite and ammonia at room temperature (Hiroshi et al., 2014), but irradiation of UV light was needed. Ferric tannate (TA-Fe3+), a stable metal–polyphenol chelate, is water insoluble and cheaper than precious metals. This chelate has been found to exhibit a rough and porous surface with highly crosslinked network and to be capable of adsorbing both cation through its negative oxygen ions and anion through its ferric ions (Rahim et al., 2020; Xu et al., 2018). This material has been reported and applied in many fields, including antifouling, water distillation, and catalysis (Lin et al., 2020; Magro et al., 2020; Peres et al., 2017; Zhang et al., 2017).
However, research on the catalytic redox reaction in Equation (1) through TA-Fe3+ in wastewater treatment is limited. In this study, we prepared TA-Fe3+ using tannin and ferric chloride, and then evaluated the effectiveness of the TA-Fe3+ powder as an adsorbent/catalyst for the simultaneous removal of NH4+ and NO2− under moderate temperature and neutral conditions. Moreover, by simultaneously monitoring nitrogen yield, the mechanism of adsorption and catalysis was elucidated.
The aim of this article is to aid in the development of new materials for the simultaneous removal of NH4+ and NO2− from wastewater.
Materials and Methods
Materials
TA-Fe3+ raw material was prepared as follows: (1) 5% tannin solution (0.03 mol/L) reacted with ferric chloride solution (0.3 mol/L) for 1 h at room temperature (20°C), and the pH of the reaction mixture was adjusted to 7 through using 0.65 mol/L NaHCO3 solution; (2) the black reaction product was washed with deionized water, separated centrifugally three times, and lyophilized in a freezer dryer at −50°C; and (3) the black TA-Fe3+ powder was stored in a vacuum desiccator.
After the adsorption and catalytic reaction, TA-Fe3+ was collected and dried in a freezer dryer at −50°C for characterization.
Stock solution of NH4+ and NO2− was prepared with ammonium chloride (NH4Cl) and sodium nitrite (NaNO2), respectively.
Tannin, FeCl3, NH4Cl, and NaNO2 were purchased from Sinopharm Chemical Reagent Co., China, with analytical reagent grade.
Experimental set-up
Adsorption tests
All adsorption and catalytic reaction experiments were performed as follows: TA-Fe3+ powder with predetermined weight was introduced into a 100-mL serum bottle. The aliquot deionized water, ammonium, and/or nitrite stock solution were added to obtain a mixture with a certain volume and initial concentration of NH4+-N and NO2−-N. To eliminate atmospheric nitrogen and oxygen in the bottle, the mixed solution was bubbled with highly purified helium for 5 min and the headspace was subsequently swept for 10 min before sealing with a rubber closure. The pH of the mixture was approximately equal to 7 and not adjusted with any acid or alkali. The serum bottle was then placed in a thermostatic shaker and agitated at 180 rpm and 30°C ± 1°C. The suspension was centrifuged and filtered with 0.45 μm membrane for chemical analysis.
The amount of NH4+-N or NO2−-N adsorbed by TA-Fe3+ powder at time t, qt (mmol/g), was calculated as follows:
where C0 and Ct are the concentrations of the initial and final NH4+-N or NO2−-N in the solution at time t (mmol/L), respectively; V is the solution volume (mL); and m is the weight of the TA-Fe3+ powder (g).
The adsorption isotherms of NH4+ and NO2− on TA-Fe3+ powder were determined using Langmuir [Eq. (3)] and Freundlich models [Eq. (4)], respectively.
where qe is the equilibrium adsorption capacity (mmol N/g); qm is the maximum adsorption capacity (mmol N/g); b (L/mmol N) is the equilibrium adsorption constant; and Ce is equilibrium liquid-phase concentration (mmol N/L); K is the equilibrium adsorption constant (L/g); and 1/n is the Freundlich intensity parameter.
Weber–Morris intraparticle diffusion model [Eq. (5)] was used to fit the kinetics data.
where qt is the adsorption capacity (mmol N/g) at time t; kp (mmol N/[g·h1/2]) is the intraparticle diffusion rate constant; C is the particle diffusion equation constant.
Regeneration and reuse test
At the end of adsorption for 24 h, regeneration of adsorbent was finished as the following steps: first, the adsorbent (TA-Fe3+ powder) was centrifugally separated from suspension; and then the separated adsorbent was repeatedly washed and centrifugally filtered with 30 mL deionized water for three times; finally, washing water of total 90 mL in three times was fully mixed and then filtered with 0.45 μm membrane for chemical analysis.
Regeneration efficiency (RE) was calculated by using the Equation (6).
where C0, Ct, and V refer to the Equation (2), Cw is the concentration of NH4+-N or NO2−-N in the washing water (mmol/L), and Vw is the volume of the washing water (mL).
Four successive cycles of adsorption–desorption were conducted to investigate the reusability of TA-Fe3+ powder as the following steps: after adsorption toward NH4+ or NO2− (the initial concentration of 14.29 mmol N/L) for 24 h (referring to Adsorption Tests section), TA-Fe3+ powder (1 g) was desorbed with water (referring to the above regeneration test) and then dried in a freezer dryer for the next cycle. The values of Ct/C0 and qt were used to evaluate the change of adsorption efficiency of TA-Fe3+.
Catalytic reaction
Experiment 1
The comparative tests (Table 2) were conducted to test the catalytic redox reaction and N2 production under the coexistence of NH4+ and NO2−. Samples were taken at different time intervals to observe the variations of compounds in the gas and water with time during the catalytic reaction. To minimize the sampling error, water and gas from Runs 3 and 4 were sampled under the same reaction conditions, respectively. The bottles were sealed and 1 mL gas from the Run 4 bottle was immediately sampled and analyzed as a blank gas sample before the redox reaction.
Experiment Set-Up for Adsorption and/or Catalytic Nitrogen Removal
Experiment 2
To estimate the catalytic effectiveness of TA-Fe3+, a comparative test with/without TA-Fe3+ was performed under the same conditions. Following 24 h of adsorption and reaction, the catalyst was desorbed with deionized water. The total nitrogen (TN) was balanced according to chemical and gas analyses.
Experiment 3
Based on the different adsorption rate of TA-Fe3+ powder toward NO2− and NH4+, effect of two-step adsorption on catalytic reaction rate was evaluated as follows: at the time of adsorption only toward NO2− for 12 h, NH4+ was added in bottle. Hereafter, water and gas samples were taken out for analysis at 1, 4, 6, 8, and 12 h, respectively.
Analytic methods
TA-Fe3+ powder characterization
The surface physical morphology and major elements of TA-Fe3+ were observed using a scanning electron microscope (SEM), coupled with an energy-dispersive X-ray spectroscopy detector (S-3500N; Hitachi Co., Japan). BET surface area, pore diameter, and pore volume were determined by nitrogen adsorption/desorption, using an ASAP2000 surface analyzer (Micromeritics Co., USA). A Mastersizer 2000 (Malvern Co., USA) was employed to measure the particle size. Raman spectrum analysis was performed with a Raman analyzer (JY-HR800, France) under the following parameters: laser excitation line, 532 nm; laser output power, 3 mW; the laser power at the sample, 0.6 mW; and scan time, 100 s.
Chemical analyses
NH4+, NO2−, and NO3− concentrations were determined according to the standard methods issued by the Environmental Protection Agency (EPA) of China. Data were measured in millimole N per liter (mmol N/L). The pH value was determined using glass electrodes connected to a pH meter (320-S, Shanghai, China). N2 and nitrous oxide (N2O) analyses were performed through a Model HP6890 gas chromatograph with a thermal conductivity detector, equipped with an 8-ft molecule sieve column and a Porapak Q column, respectively. Helium was used as the carrier gas.
Results and Discussion
Characteristics of TA-Fe3+ powder
The prepared ferric tannate powder had a rough surface with a high specific surface area of 102.4 m2/g, a relatively homogeneous mesopore structure with average pore diameter of 56 Å and pore volume of 0.14 cm3/g, and an average particle size of 76 μm (Supplementary Fig. S1). These characteristics facilitated efficient adsorption. The raw ferric tannate mainly consisted of C, O, and Fe elements, and that the percentage content of C, O, and Fe were 38.84%, 43.73%, and 15.43%, respectively (Supplementary Fig. S2a).
Adsorption performance of TA-Fe3+ powder toward NH4+ and NO2−
Effects of contact time on the adsorption capability
Supplementary Figure S2b–d showed the appearance of nitrogen element and different percentage contents of N in different samples, suggesting the adsorption of NH4+ or/and NO2− on the TA-Fe3+. The adsorption performances of ferric tannate powder toward NH4+ and NO2− varied significantly with time (Fig. 1). In the Run 1, the NH4+ concentration fell rapidly within half an hour from 14.29 to 3.88 mmol/L with removal efficiency of 72.8% and then gradually reached the minimum value of 2.68 mmol/L and maximum adsorption capacity of 0.58 mmol/g at 4 h. The NH4+ concentration subsequently rose again and stabilized between 7.02 and 7.29 mmol/L after 12 h.
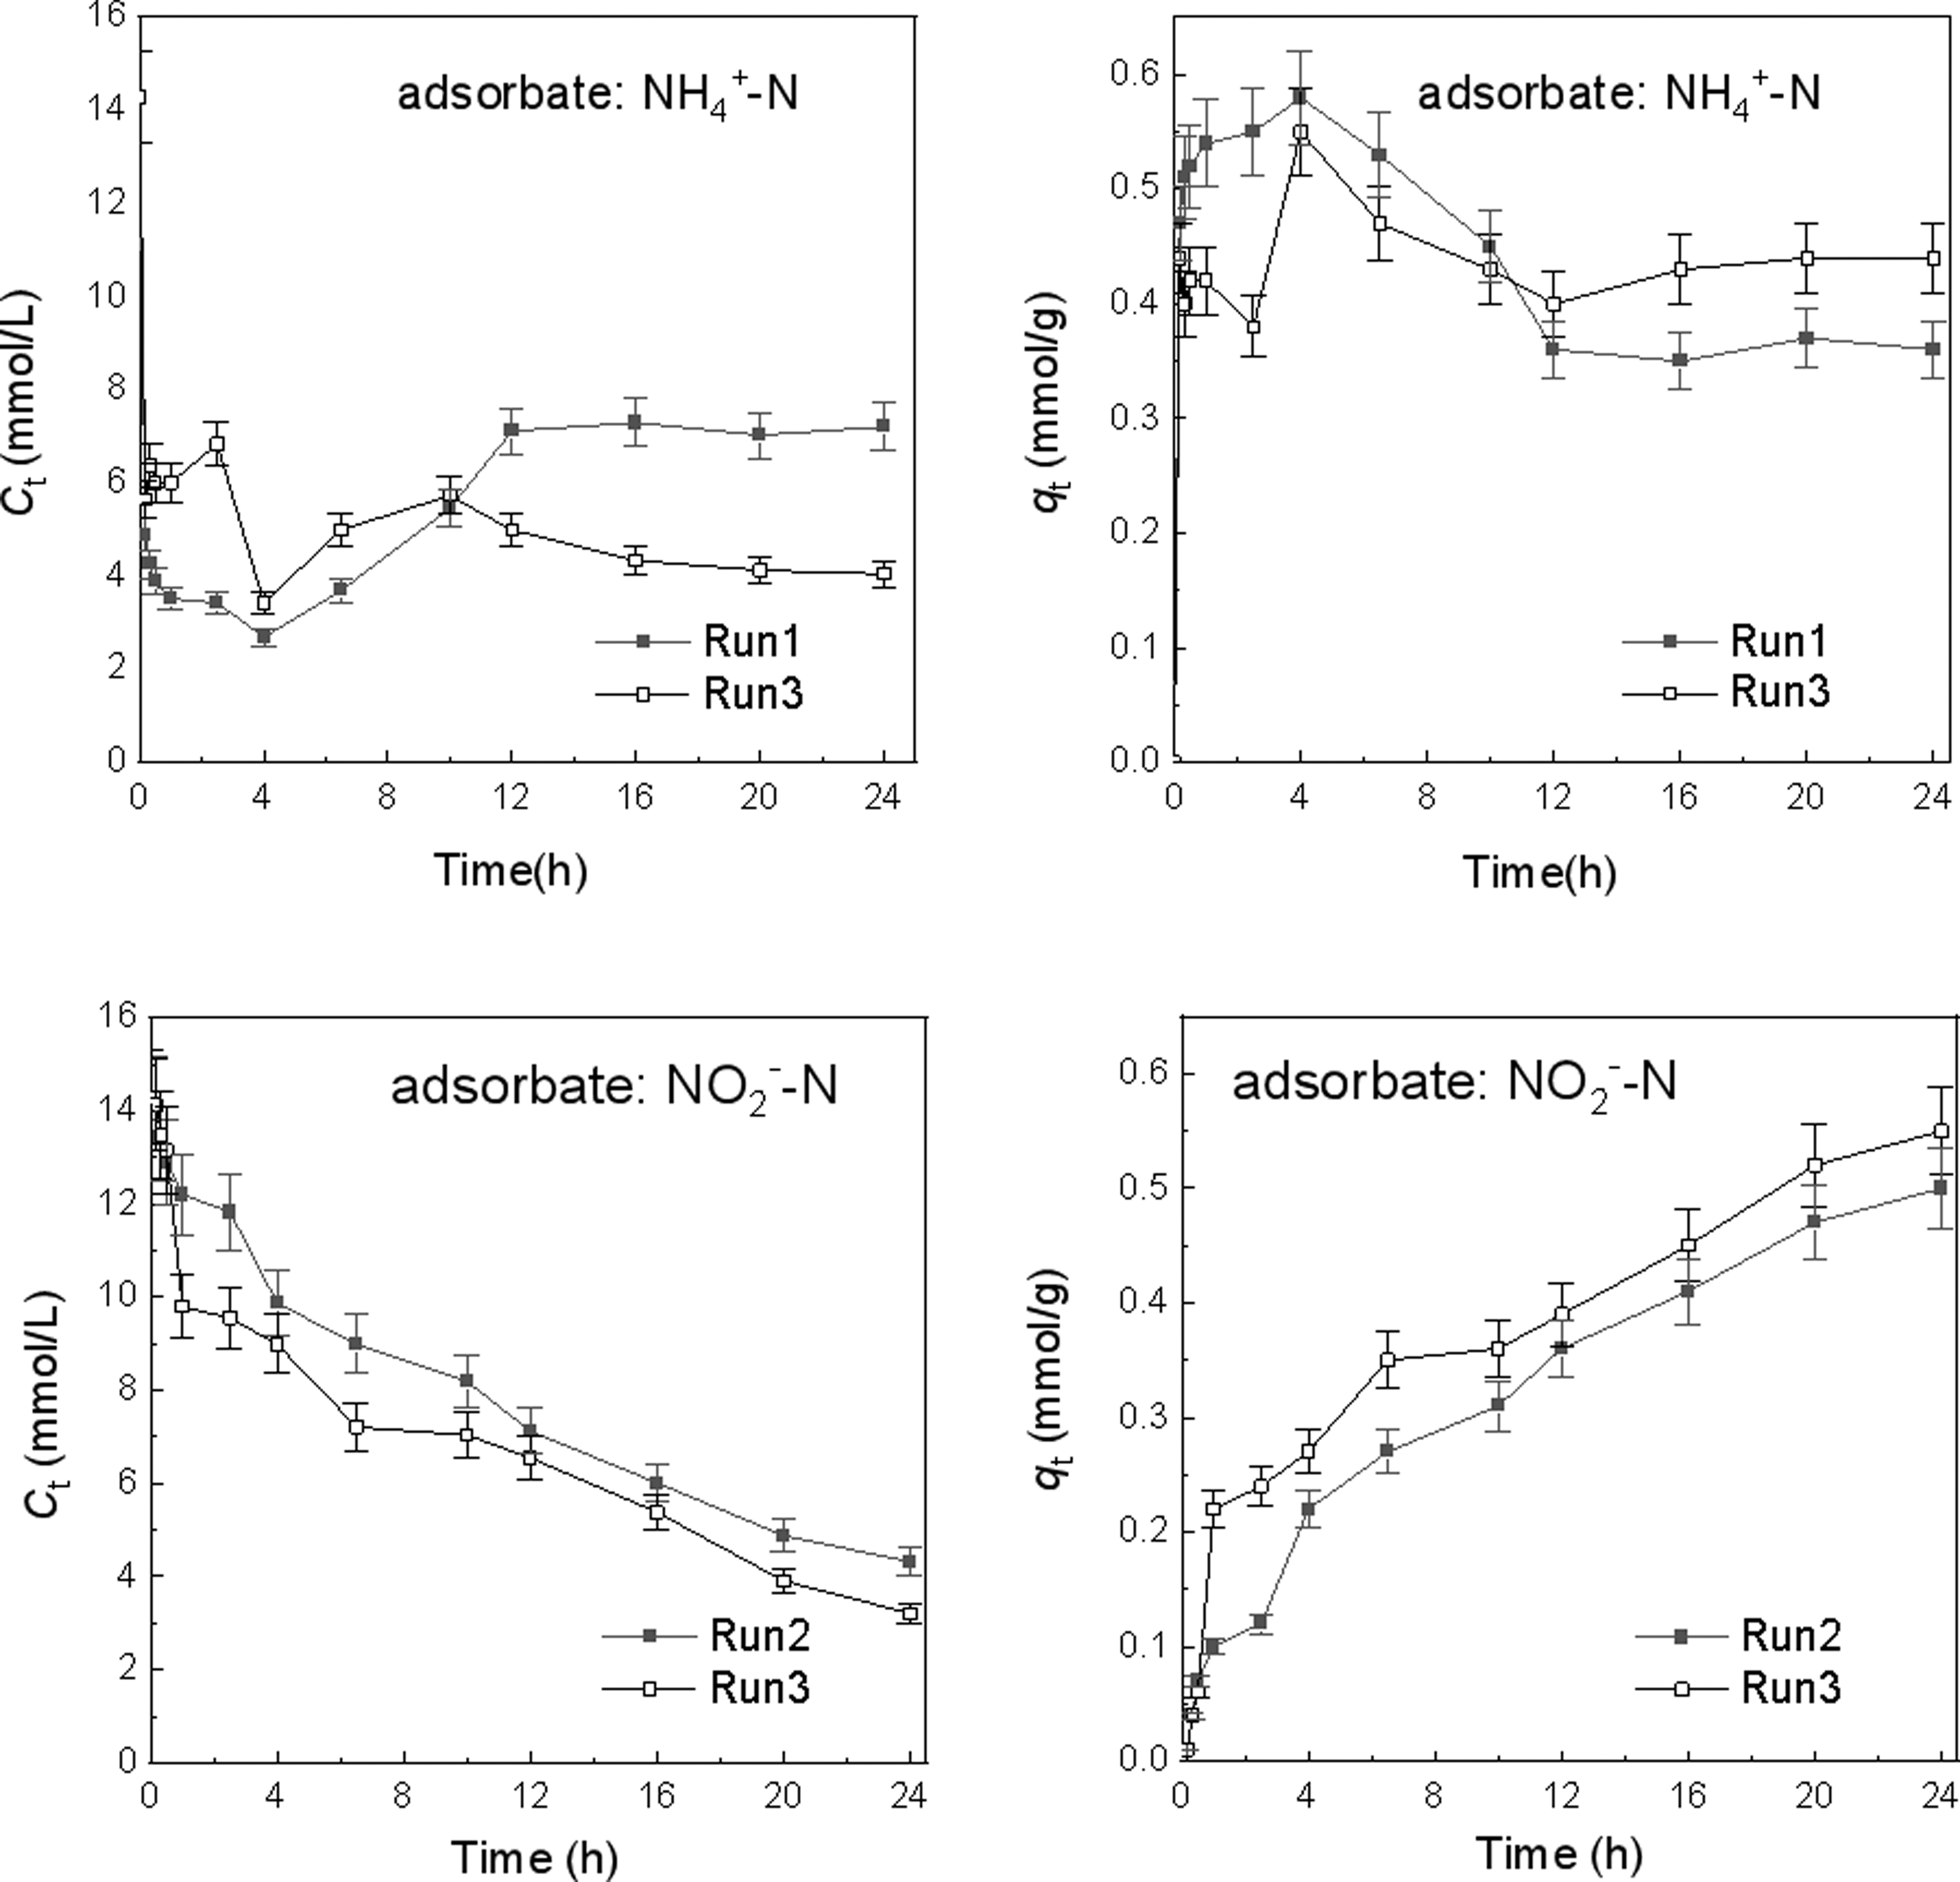
Adsorption rates of TA-Fe3+ toward NH4+ and NO2−. (volume of mixture = 50 mL; initial concentrations of both NH4+ and NO2− are 14.29 mmol N/L; 1 g TA-Fe3+ powder; Run 1: only NH4+ in solution; Run 2: only NO2− in solution; Run 3: NH4+ and NO2− coexisting). NH4+, ammonium; NO2−, nitrite; TA-Fe3+, ferric tannate.
In comparison, the NO2− concentration in Run 2 exhibited a gradual reduction with time, with the adsorption capacity smoothly increasing to 0.5 mmol/g at t = 24 h. In Run 3, NH4+ and NO2− were simultaneously adsorbed by TA-Fe3+, with adsorption trends following those of Runs 1 and 2, respectively. However, q(NH4+) in Run 3 was less than that in Run 1 before 10 h, and subsequently enhanced. In contrast, the q(NO2−) was consistently greater than that in Run 2.
To further characterize the adsorption process, data from Run 1 for NH4+ and Run 2 for NO2− were fitted into the Weber–Morris intraparticle diffusion adsorption model (Arameh and Mousa, 2014; Weber and Morris, 1963). As shown in Supplementary Fig. S3 and Table 3, the intraparticle diffusion model showed a better fit to the experimental data, especially for NO2− with higher relation coefficient (R2) values. The deviation of the plots from the origin indicated that the intraparticle diffusion was not the only rate-controlling step for the adsorption of both NH4+ and NO2−. The adsorption processes for the two N species exhibited three stages: (1) Stage I before 0.5 h was the instantaneous adsorption, that is, external surface adsorption, which had the highest gradient (kp) among the three stages (Table 3); (2) Stage II (0.5–12 h) was intraparticle diffusion process; and (3) Stage III (12–24 h) was the adsorption equilibrium stage.
Fitting Adsorption Parameters of Weber–Morris Intraparticle Diffusion Model
On the other hand, there were obvious differences between the two fitting curves: (1) As for NH4+, almost highest adsorption capacity was acquired during Stage I among the three stages, inferring that adsorption toward NH4+ was mainly owed to external diffusion.
As for NO2−, the Stage II, that is, intraparticle diffusion, contributed more NO2− adsorbed on TA-Fe3+; (2) after a sharp decrease in qt of NH4+ during the later period of Stage II (4–12 h), there was a slight growth and adsorption equilibrium during the Stage III; and (3) the higher kp and lower C for NO2− than those for NH4+ (especially during the Stage II and Stage III), suggested that the intraparticle diffusion exerted more influence on the adsorption for NO2−. The above observations implied that the adsorption process toward either NH4+ or NO2− was controlled cooperatively by external particle diffusion and intraparticle diffusion, and that external diffusion and internal diffusion played an important role in the adsorption toward NH4+ and NO2−, respectively.
Regeneration and reusability of TA-Fe3+
As shown in Table 4, almost all adsorbed adsorbate was able to be released from the TA-Fe3+ powder either in Run 1 or Run 2, meaning that TA-Fe3+ could be easily regenerated with water. In contrast, after 24 h of adsorption in Run 3, the remaining adsorbates were obviously less than those in Run 1 and Run 2, indicating that more NH4+ and NO2− were adsorbed from the solution onto the TA-Fe3+ powder than those in Runs 1 and 2 (Fig. 1). Moreover, the desorbed adsorbates from TA-Fe3+ were not equal to the adsorbed adsorbates, and thus the partial adsorbed adsorbates were not desorbed, leading to a lower RE than those in Runs 1 and 2. The total adsorption capacities increased upon the coexistence of NH4+ and NO2−, and not all of the adsorbed adsorbates were released from TA-Fe3+. These results suggested the occurrence of a reaction between the adsorbed NH4+ and NO2− on the TA-Fe3+ powder.
Regeneration Results
Volume of mixture = 50 mL; initial concentrations of both NH4+ and NO2− are 14.28 mmol N/L; 1 g TA-Fe3+ powder; Run 1: only NH4+; Run 2: only NO2−; Run 3: NH4+ and NO2− coexisting. Nitrate nitrogen could not be detected in all tests.
RE, regeneration efficiency.
Supplementary Figure S4 displayed the reusability of TA-Fe3+. As the number of regeneration cycles increased, there was a slight decrease in the adsorption capacity of TA-Fe3+ and a small increase in the concentration of adsorbates in solution. Despite this, adsorption capacity of TA-Fe3+ for NH4+ and NO2− remained at about 90% and 89% of the original after the fourth regeneration, respectively, suggesting that the TA-Fe3+ powder can be reused to adsorb NH4+ or NO2−.
Adsorption isotherms of NH4+ and NO2− on the TA-Fe3+ powder
The experimental data and theoretical data calculated by both Langmuir and Freundlich models are shown in Fig. 2, and the values of the adsorption isotherm parameters of the two models were listed in Table 5. It was found that the adsorption data of NH4+ on the TA-Fe3+ powder were better fitted to the Langmuir model (R2 = 0.9716) than to the Freundlich model (R2 = 0.8388), and that the adsorption isotherms of NO2− demonstrated strong agreement with the two models with high correlation coefficients and n value more than 1 in the Freundlich model. These findings indicated that NH4+ was adsorbed on the surface of TA-Fe3+ in the form of monolayer, and NO2− in the forms of both monolayer adsorption and multilayer (existence of a heterogeneous surface) (Sari et al., 2007).
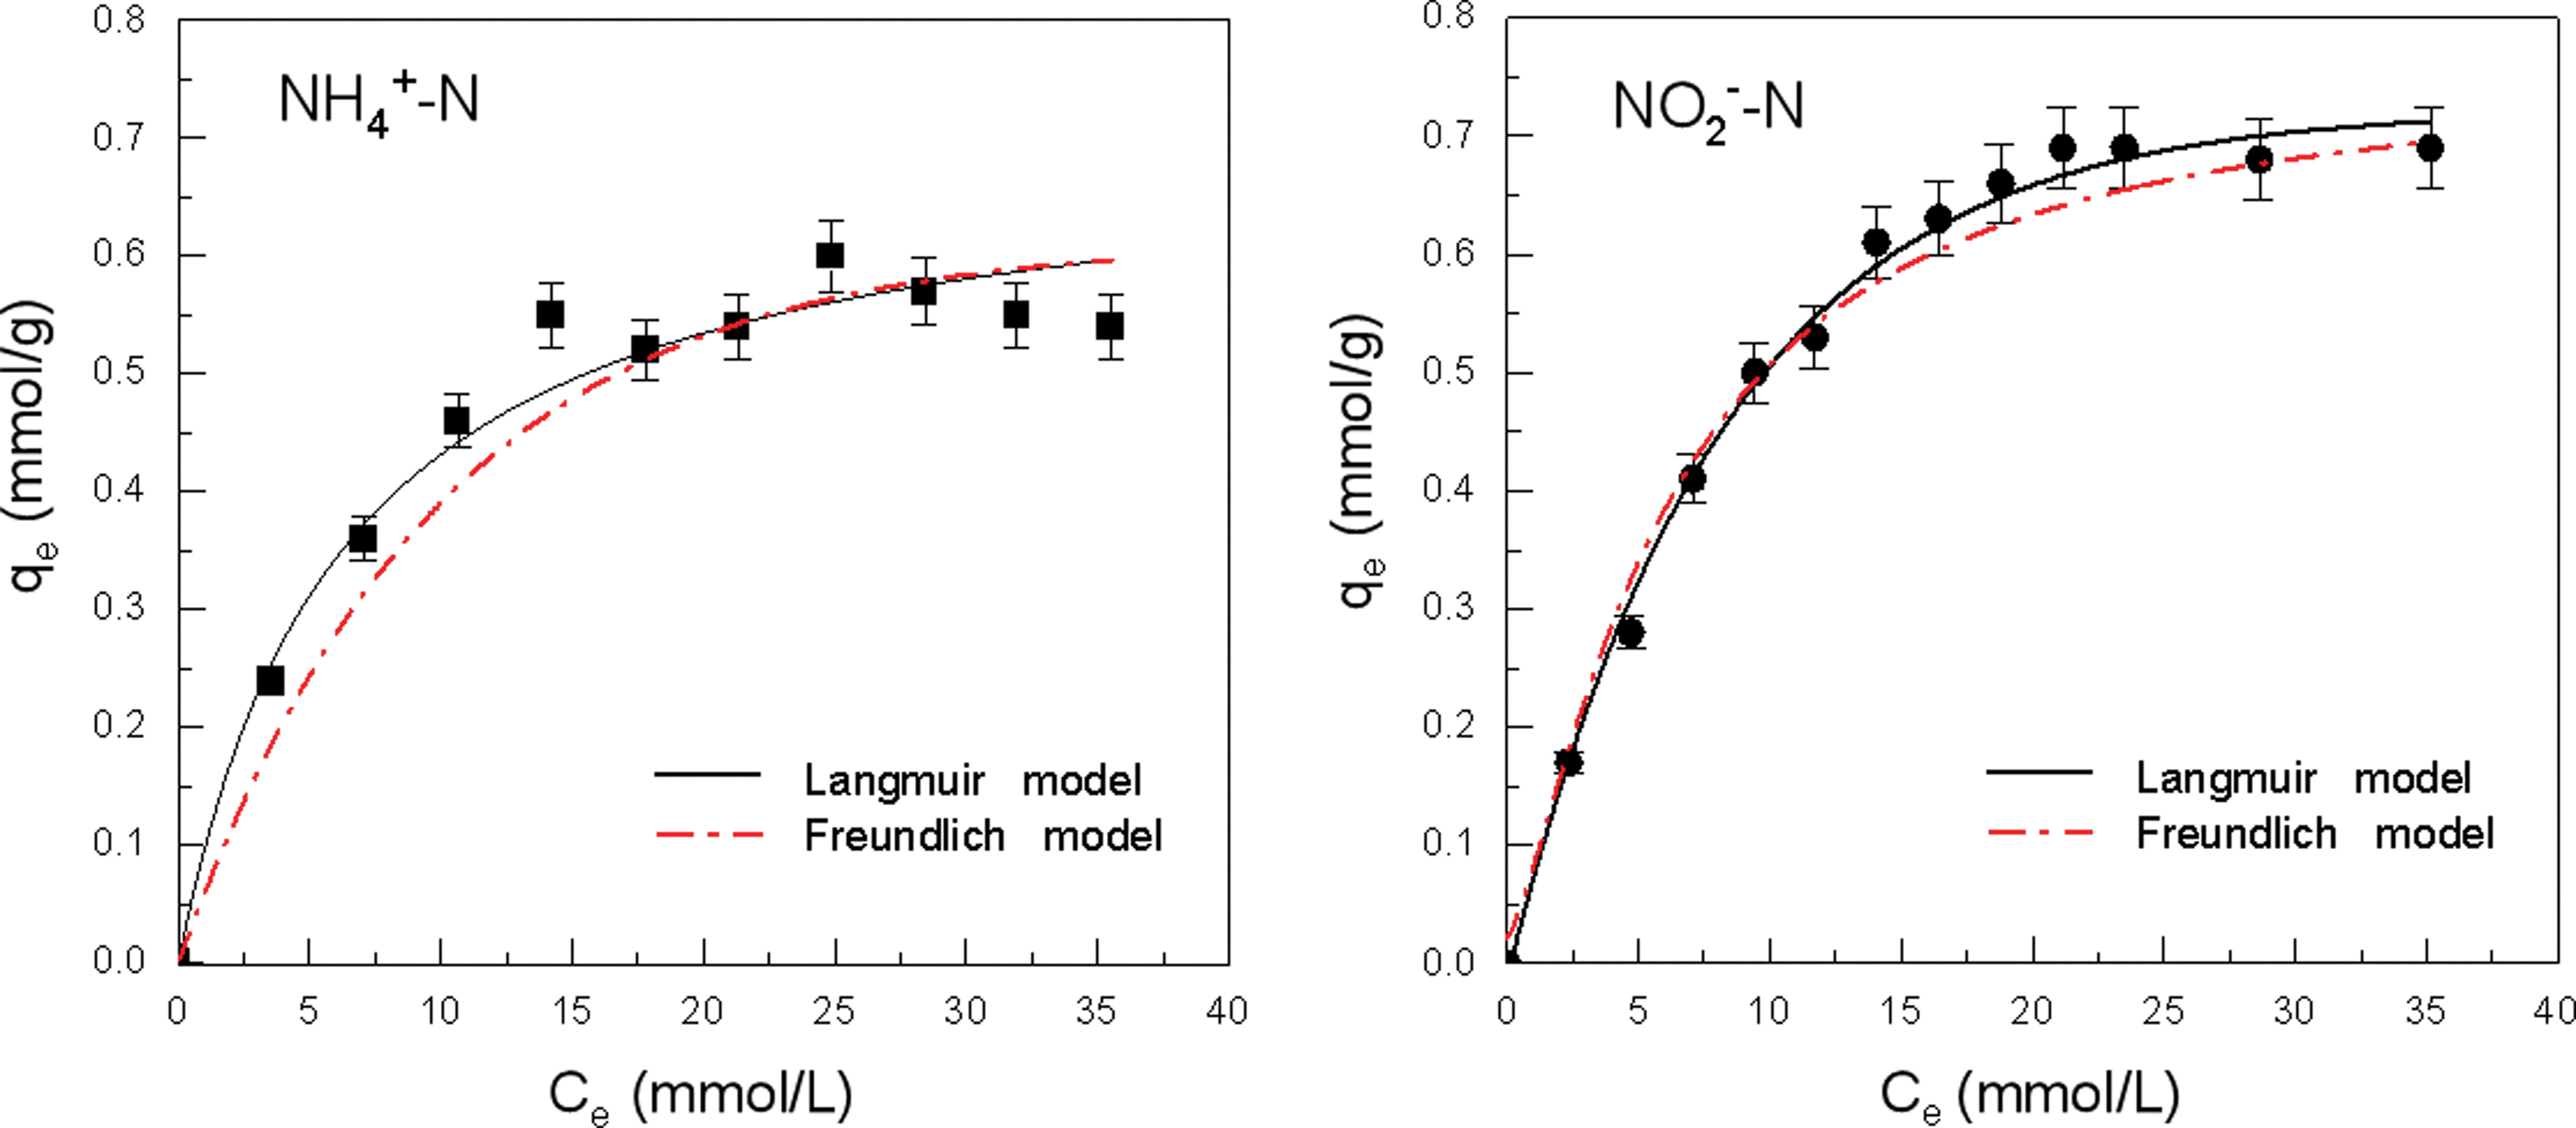
Adsorption isotherms of NH4+ and NO2− on TA-Fe3+ powder for 24 h contact time.
Adsorption Isotherm Parameters for NH4 + and NO2− on TA-Fe3+
Langmuir equilibrium adsorption constant b for NH4+ exceeded that of NO2−, and the adsorption equilibrium was achieved for Ce values close to 14 and 19 mmol/L for NH4+ and NO2−, respectively. More specifically, the adsorption equilibrium for NH4+ could be realized with a lower initial concentration. These observations indicated the higher adsorption rate of TA-Fe3+ toward NH4+ than toward to NO2−. However, the theoretical maximum adsorption capacity (qm) for NH4+ was less than that for NO2− (Table 5). As mentioned in Effects of Contact Time on the Adsorption Capability section, despite the higher adsorption rate of NH4+ than that of NO2− during the initial period of adsorption, the subsequent desorption of parts of adsorbed NH4+ led to the decline in adsorption capacity of NH4+, and the qt of NO2− gradually rose with time and exceeded that of NH4+ after 12 h (Fig. 1; Supplementary Fig. S3). Therefore, the qm of NO2− surpassed that of NH4+ through the 24-h adsorption equilibrium.
Adsorption capability of TA-Fe3+ powder toward NH4+ and NO2−
The aforementioned observations indicated that the ferric tannate adopted in this study could not adsorb anion (NO2−) and cation (NH4+) simultaneously, and was also desorbed by water with more than 95% desorption efficiency. According to the postulated structure of TA-Fe3+ by Ross and Francis (1978), three tannate ions react with one ferric ion to form a stable octahedral coordination compound (Supplementary Fig. S5a). In addition, as the tannin molecules are generally polymers of the basic flavonoid structure, each molecule can react with a number of ferric ions to form a network structure, where many phenolic hydroxyl groups combine with the ferric ions in the form of negative oxygen ions. In the network structure, those phenolic hydroxyl groups with negative oxygen ions on the external surface may serve as the negative function groups to absorb NH4+, and Fe3+ in the interior as the positive function group to adsorb NO2− (Supplementary Fig. S5b), suggesting the electrostatic adsorption for NH4+ and electrostatic attraction combined with coordination for NO2−.
The network structure also implies that TA-Fe3+ is an amphoteric ion exchanger with a special structure, in which negative and positive function groups can attract each other, forming an inner salt band to neutralize part of the charges. This reduces the adsorption force between the groups and the ions with opposite charges in the solution, thus leading to its effective regeneration with water after adsorbing other ions in solution (Hatch et al., 1957).
However, TA-Fe3+ exhibited distinct behavior toward NH4+ and NO2−: (1) despite the initial rapid adsorption toward NH4+, parts of the adsorbed NH4+ were desorbed and released back to the solution, leading to a subsequent rise in the concentration and a fall in the adsorption capacity; and (2) despite the slow adsorption toward NO2−, the adsorption capacity rose gradually.
The desorption of the partially adsorbed NH4+ may be attributed to the following three aspects: (1) many NH4+ rapidly were adsorbed on the external surface through electrostatic interaction, meaning the weak binding affinity and a short diffusion distance for the NH4+ ion from the particle surface to solution; (2) the easy water regeneration property of TA-Fe3+; and (3) the NH4+ concentration gradient between the solution and adsorbent. Actually, the adsorption and desorption occurred simultaneously, while their rates varied with the stage.
Initially, due to the greater NH4+ concentration gradient between the exterior surface of particle and the solution, NH4+ was quickly combined with the particle and adsorbed on the TA-Fe3+ through external diffusion, leading to a sharp rise in qt and higher adsorption rate than desorption rate. At the interior diffusion stage, intraparticle diffusion started to slow down along with the decrease in the adsorbate concentration in the solution, as listed in the Table 3 (kp of NH4+ went down from 0.1686 to 0.0386). Moreover, the NH4+ concentration on the TA-Fe3+ gradually exceeded that in the solution, reversing the NH4+ concentration gradient between the solution and TA-Fe3+.
These factors induced the release of NH4+ from the adsorbent to water and thereby the desorption rate surpassed the adsorption rate, resulting in the decline in the qt of NH4+. Upon gradually reaching the same point, the NH4+ concentration in the solution and adsorption capacity were maintained at stable levels, resulting in the flattening of the curve during the adsorption equilibrium (Fig. 1 and Supplementary Fig. S3).
In comparison, ferric ion, standing in the interior of structure, was surrounded by the exterior network, indicating a longer diffusion distance for the NO2− ion from the solution to the adsorption site compared with the NH4+ ion. Additionally, a larger ionic radius of NO2− (0.35 nm) compared with NH4+ (0.148 nm) may lead to a slower diffusion rate of NO2− (Rowsell and Yaghi, 2004). Furthermore, three NH4+ ions can be simultaneously adsorbed by three negative oxygen ions, while three NO2− ions can only be adsorbed by a single ferric ion (Supplementary Fig. S5b). These may be linked to the lower adsorption rate of the NO2− ion. Due to the slow adsorption rate toward NO2−, the NO2− concentration in the solution exceeded that on the adsorbent during the whole adsorption process, and the concentration gradient diffused the NO2− from the solution to the exterior and then to the interior of particle, where it was adsorbed on the TA-Fe3+. Thus, the adsorption rate was higher than the desorption rate, bringing about a gradual increase in the qt of NO2−.
Catalytic redox capability of TA-Fe3+ powder toward NH4+ and NO2−
Catalytic redox reaction and N2 production
The above results demonstrated that TA-Fe3+ was able to simultaneously adsorb NH4+ and NO2−, and that the partial NH4+ and NO2− adsorbed on the TA-Fe3+ were not desorbed when they coexisted (Table 4). The comparative tests were performed to determine the existence of a reaction between NH4+ and NO2− and N2 yield (Table 2). N2 production was only observed for the coexistence of NH4+ and NO2− in Run 3 (Fig. 3).
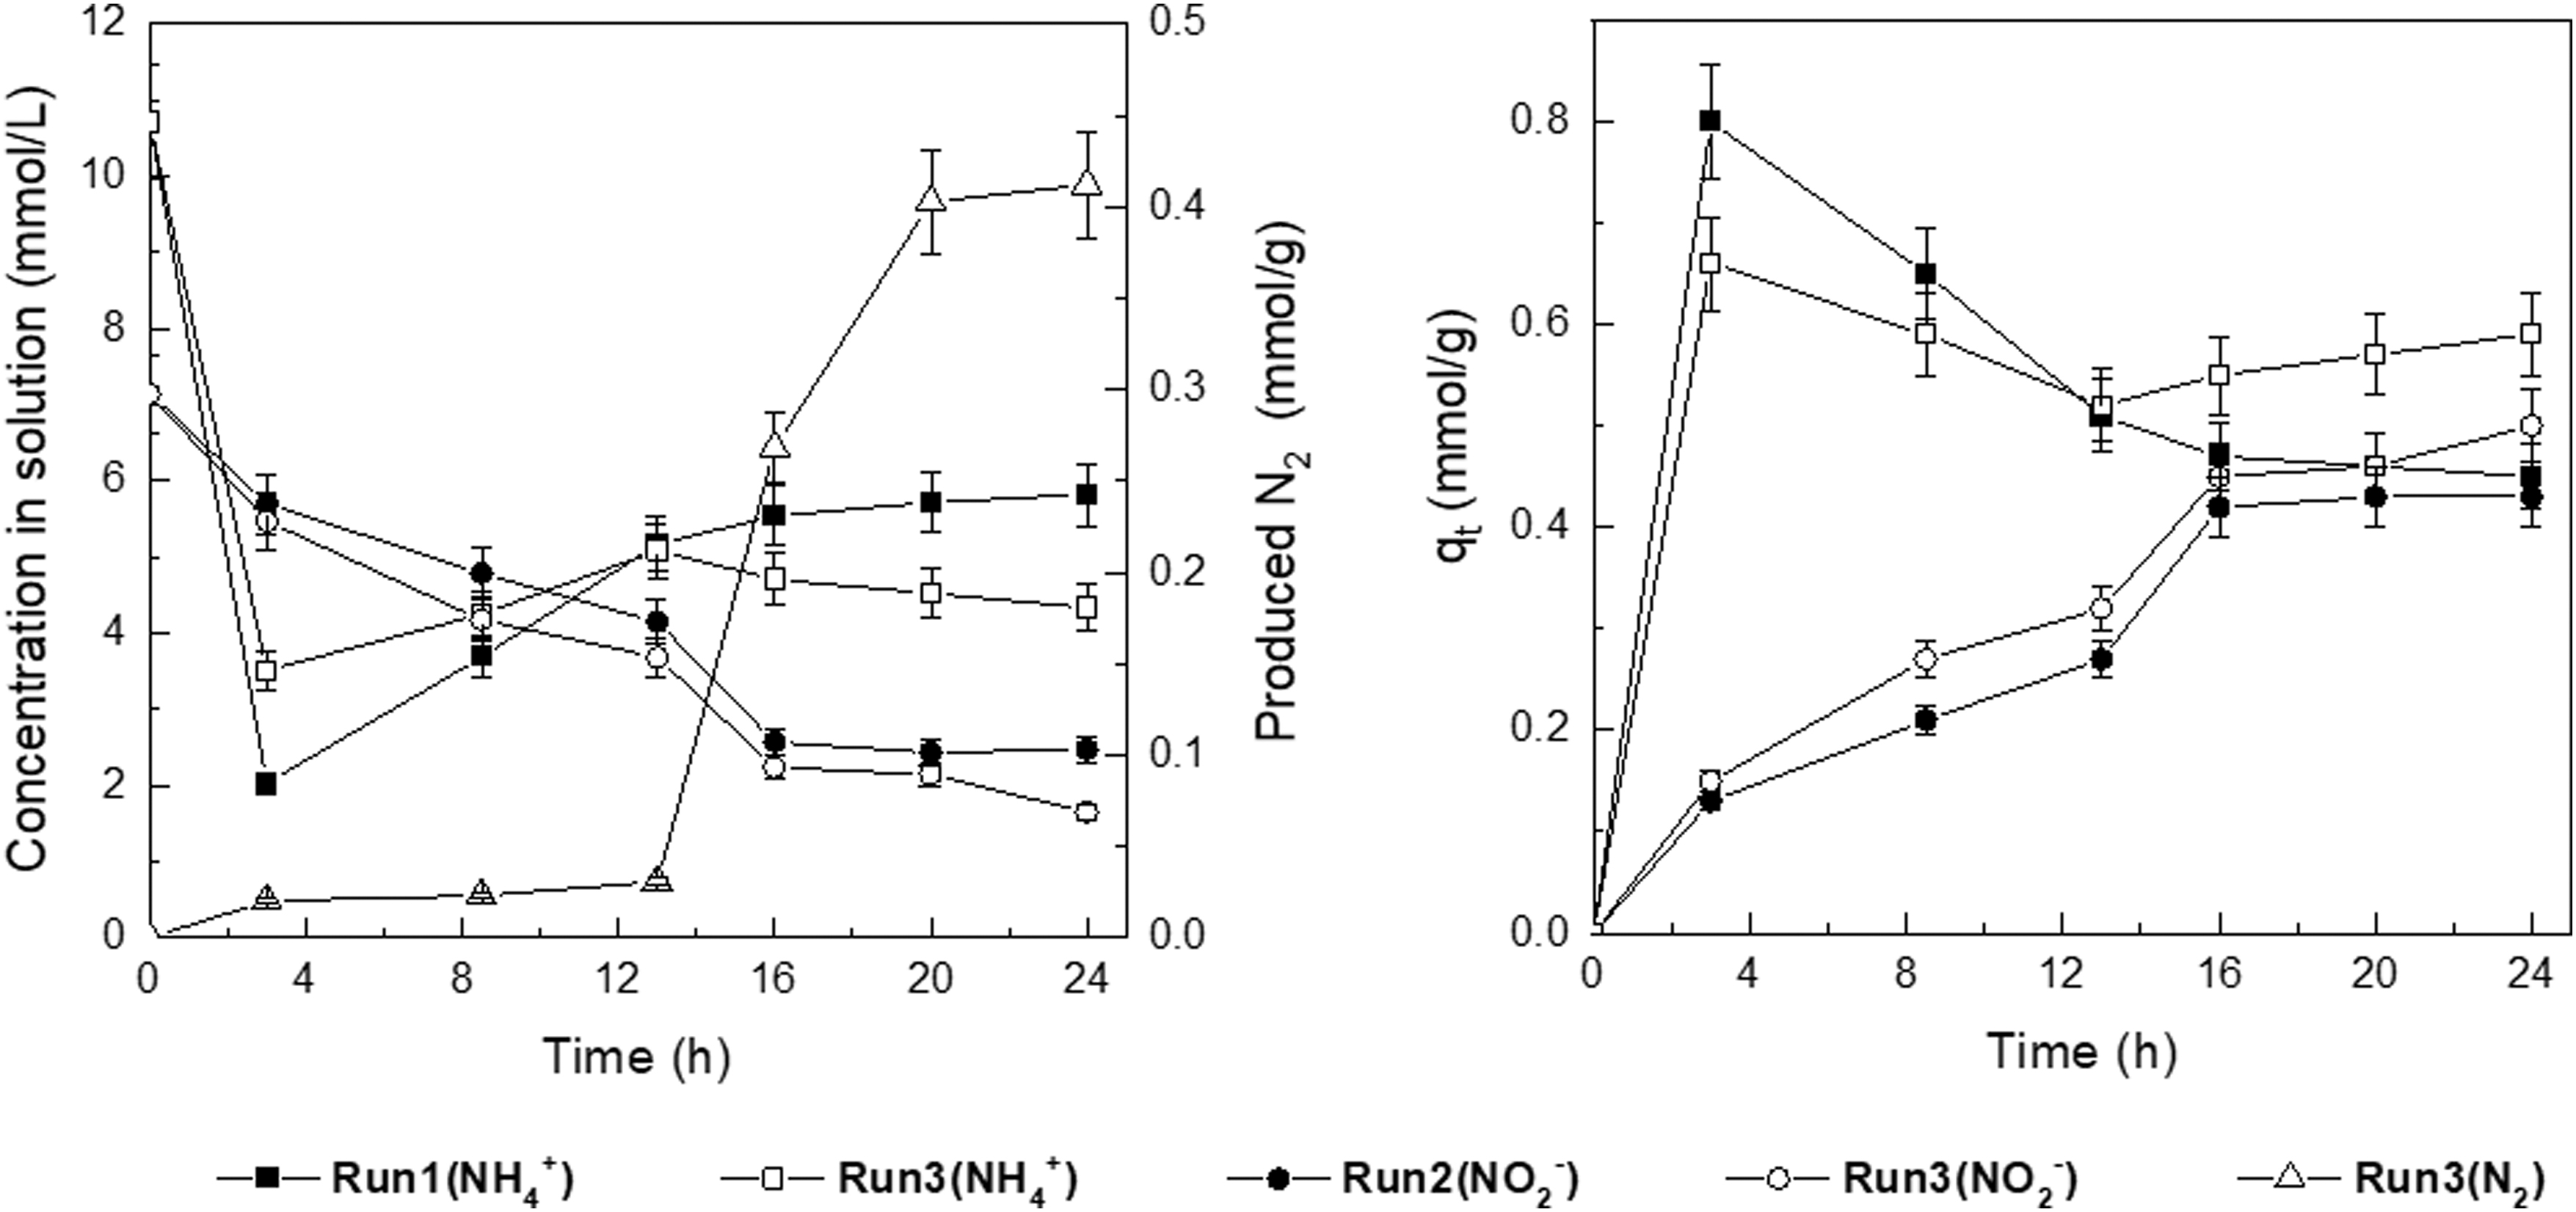
Catalytic redox reaction and N2 production. N2, nitrogen gas.
N2 production drastically increased from 0.03 to 0.27 mmol/g at 16 h, corresponding to an obvious decrease in Ct (NH4+) and Ct (NO2−) from 5.08 and 3.68 to 4.71 and 2.24 mmol/L in Run 3, respectively. Compared with Runs 1 and 2, qt values in Run 3 increased at a greater extent, while the Ct values of either NH4+ or NO2− were reduced, particularly for higher N2 yields. When just NH4+ or NO2− was present, almost all the adsorbed NH4+ or NO2− could be desorbed from TA-Fe3+, and when NH4+ and NO2− coexisted, part of the NH4+ and NO2− disappeared from the solution and catalyst (Table 6). This implied that only adsorption occurred in Runs 1 and 2, while in Run 3, both adsorption and the reaction of the N2 yield were present. Furthermore, the N2 was produced from the adsorbates that had not desorbed. The N2 production increased with the qt of NH4+ and NO2− and exhibited a marked growth at 16 h, indicating that significant production of N2 took place when the qt of NO2− gradually rose to the level close to the qt of NH4+. This demonstrated that redox reaction between NH4+ and NO2− to form N2 occurred when they coexisted with TA-Fe3+.
Results of Total Nitrogen Balance Tests
Volume of mixture of 40 mL; contact time of 24 h; initial concentrations of NH4+ and NO2− are 8.88 and 7.24 mmol N/L, respectively; Run 5-with 0.43 g TA-Fe3+ powder; Run 6-without TA-Fe3+ powder. Analysis concentrations of N2 in the Run 5 and Run 6 are 1.60 and 0.02 mmol/L, respectively, and mol mass of produced N2 is from the product of the analysis concentration and volume in the headspace of bottle (90 mL). R-NH4+ and R-NO2− represent removed NH4+ and removed NO2−, respectively.
TN, total nitrogen.
Table 6 compared the TN balance results between Run 5 with TA-Fe3+ and Run 6 without TA-Fe3+. In Run 5, 0.148 mmol NH4+-N and 0.154 mmol NO2−-N were removed from the initial 0.644 mmol TN, accompanied by a N2 production of 0.144 mmol. Moreover, the ammonium and nitrite nitrogen removal and N2 production yielded a mol ratio of 1:0.96:1.02, almost equal to the stoichiometric ratio given in Equation (1) (1:1:1). N2O and nitrate nitrogen (NO3−-N) were not detected, suggesting that all removed NH4+ and NO2− was transformed to N2. The 0.014 mmol TN from the initial 0.644 TN was attributed to the small amount of adsorbed NH4+ that was not desorbed (Table 6).
In contrast, Run 6 yielded a minimal amount of N2 (∼0.7% of that in Run 5) due to the limited removal of NH4+ and NO2−, that is, the N2 yield in Run 5 was about 144 times that in Run 6. N2O and NO3−-N were also not observed in the products in Run 6. In the absence of the catalyst, high temperature or acidic condition is indispensable to the reaction in Equation (1) (Cox et al., 1994), and thus the N2 formed under the moderate temperature and neutral conditions in Run 5 was certainly ascribed to TA-Fe3+.
Figure 4 presents the characteristic Raman bands in the 1,100–1,600 cm−1 range corresponding to the phenolate ring vibrations of metal–phenolate complexes. The bands at 1,101, 1,351, and 1,436 cm−1 were associated with C–O stretching and C–H bending modes, respectively, and those at 1,481 and 1,598 cm−1 were attributed to the ring C–C stretching vibrations for the coordinated phenolate ligand (Chen et al., 2021; Li et al., 2019; Zou et al., 2013). The strong peaks at 587 cm−1 in the spectra of Samples 2, 3, and 4 were obviously weaker than the spectrum of the raw TA-Fe3+ (Sample 1), while no other changes were observed.
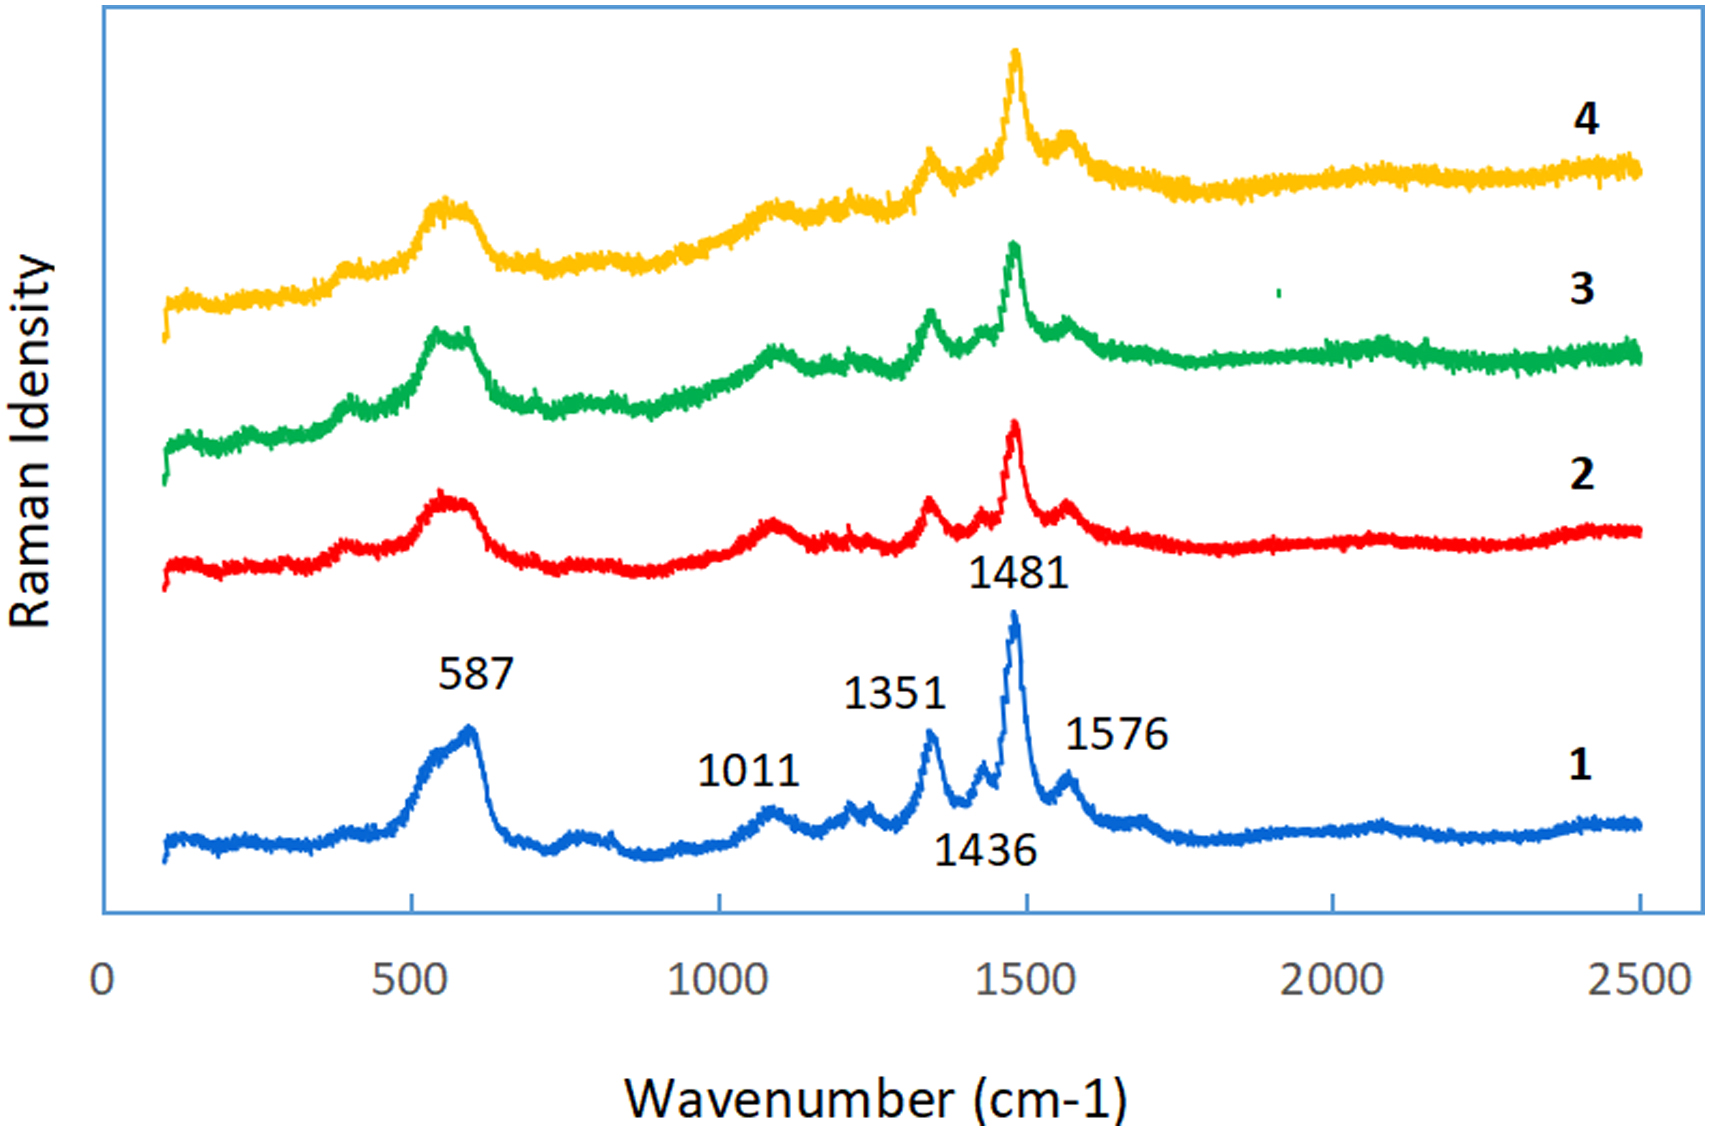
Raman spectra in the 100–2,500 cm−1 region. (1: raw TA-Fe3+; 2: TA-Fe3+ adsorbing NH4+ only; 3: TA-Fe3+ adsorbing NO2− only; 4: TA-Fe3+ adsorbing both NH4+ and NO2− to complete redox reaction.)
Studies of ferric complexes with phenol have identified that such complexes exhibit a characteristic strong absorption band in the 400–600 cm−1 region due to a phenolate oxygen to Fe (III) charge transfer transition, and that the band at 587 cm−1 can be assignable to ν (Fe–O) stretching vibration frequencies (Thakur et al., 2017; Varshney and Kumar, 2013). Despite the weakening of the peak intensity, the peak site of the Fe–O bond was not shifted, indicating that the bond was not destroyed, rather the adsorption toward NH4+ or/and NO2− reduced the Raman absorptivity toward the Fe–O bond.
No differences were detected among the Samples 2, 3, and 4, and the N2 peak at 2,330 cm−1 did not appear in Sample 4 spectrum. These observations revealed the following: (1) either NH4+ or NO2− attacked the same adsorption/reaction site in TA-Fe3+ in all waters, and as a result, the same characteristics and changes in the Fe–O bond site were presented in the three samples; and (2) for Sample 4, the produced N2 quickly broke away from the TA-Fe3+, rather than accumulating on it. This agreed with the results in Table 6, whereby the produced N2 was almost equal to the removed NH4+ or NO2−. Moreover, no other compounds were produced, thus leading to the same spectrum as those in Samples 2 and 3. These results revealed the Fe–O bond site to be the center of adsorption and catalysis, and while TA-Fe3+ acted as an adsorbent and catalyst in the system. The catalytic redox capability of the transition metal complex was realized through the cycle Mn+↔M(n−1)+ (Haber and Weiss, 1934; Rahmania et al., 2021; Tamami and Ghasemi, 2015). As for TA-Fe3+, the cycle of Fe3+↔Fe2+ was estimated to help the electron transfer between NH4+ and NO2−.
Serving as an electron transfer agent, ferric tannate transported the electrons between NH4+ and NO2− to form a stable redox system with NH4+ (electron donor) and NO2− (electron acceptor). Three N2 production pathways were postulated in this cycle: (1) intermediates A1 and B1 from NH4+ and NO2−, respectively, interreacted to form N2, (2) NH4+ was gradually oxidized into nitrogen through the loss of electrons and (3) NO2− was gradually reduced to nitrogen by obtaining electrons. The cyclic transformation of Fe3+↔Fe2+ will be further characterized in the next work to reveal the catalytic mechanism.
Above observations suggested that: (1) in the absence of TA-Fe3+, the N2 yield was negligible, even with the coexistence of NH4+ and NO2−; (2) with only NH4+ or NO2− in the solution, adsorption occurred through just TA-Fe3+; and (3) when TA-Fe3+, NH4+ and NO2− coexisted in the system, adsorption and redox reactions simultaneously occurred, and the reaction occurred on the TA-Fe3+, not in the solution.
Based on this, it could be concluded that: (1) The coexistence of NH4+, NO2−, and TA-Fe3+ was necessary for N2 yield through the redox reaction between NH4+ and NO2−, where the three components functioned as the reducer, oxidizer, and adsorbent/catalyst, respectively; and (2) TA-Fe3+ initially adsorbed NH4+ and NO2− from the solution and subsequently catalyzed the redox reaction between the adsorbed NH4+ and NO2− to form N2. The adsorbed NH4+ and NO2− mutually reacted to produce N2 and were subsequently removed from the solid phase (Supplementary Fig. S5c). Thus, more empty adsorption sites were available to continuously absorb more NH4+ and NO2− ions, and hence the adsorption capacities toward either NH4+ or NO2− exceeded those under the conditions of only NH4+ (Run 1) or NO2− (Run 2).
Effect of two-step adsorption on the N2 production
According to the two-step adsorption test (Fig. 5), TA-Fe3+ adsorbed NO2− in advance for 12 h, and q (NO2−) was 0.33 mmol/g at 12 h, when NH4+ was added in solution. One hour later, q (NH4+) and q (NO2−) were 0.41 and 0.35 mmol/g, respectively, and a small quantity of N2 of 0.02 mmol/g was formed. At t = 18 h, that is, 6 h later after adding NH4+, N2 production largely increased to 0.15 mmol/g, which was advanced for 10 h compared with that in Fig. 3. The test indicated that, only when q (NO2−) increased gradually to the level close to q (NH4+), did the N2 production rise remarkably.
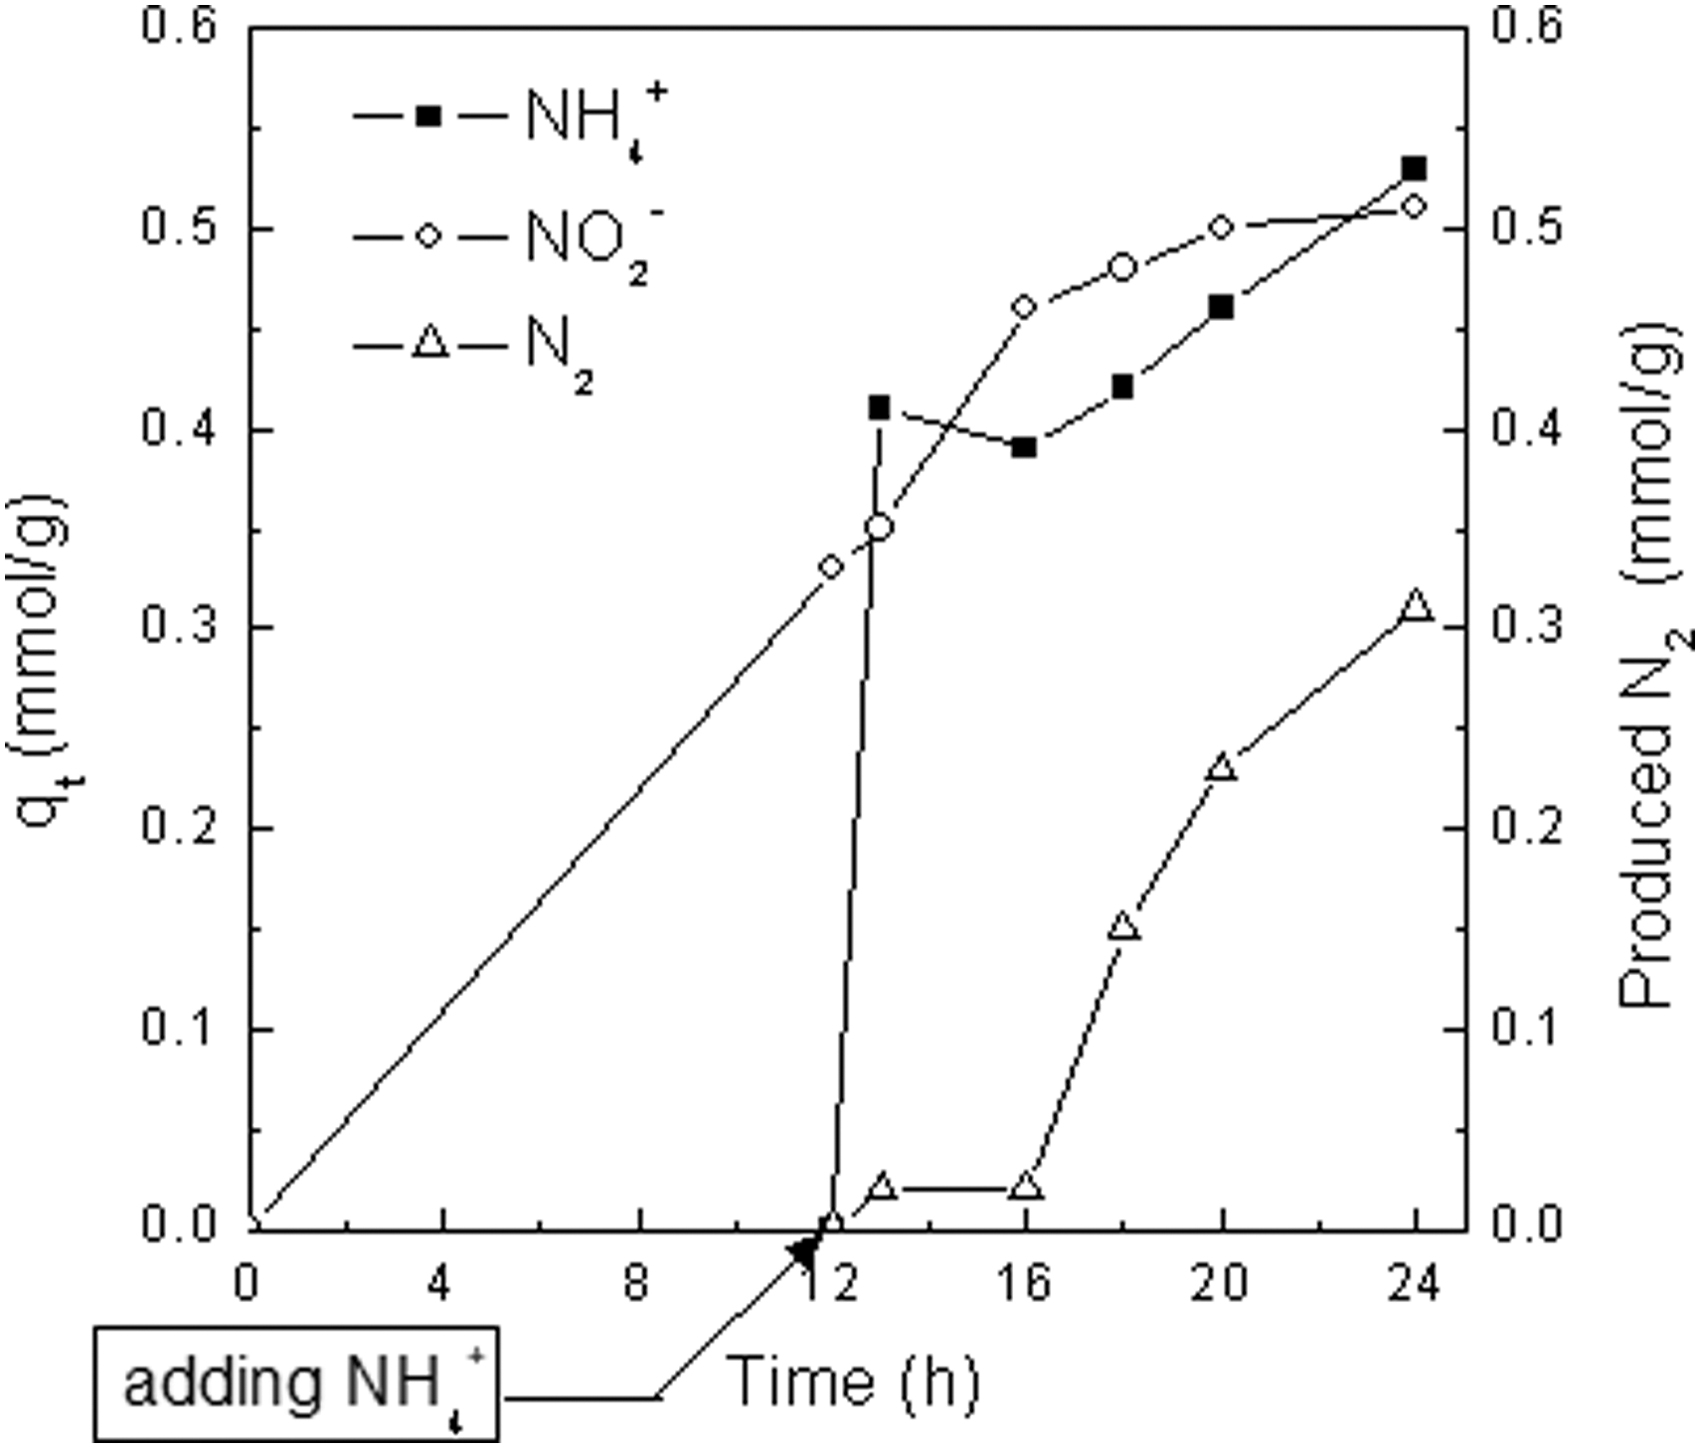
Effect of two-step adsorption on reaction rate. (volume of mixture = 40 mL; initial concentrations of NO2− and NH4+ are 7.14 and 10.71 mmol/L, respectively; 0.43 g TA-Fe3+ powder.)
Based on Fig. 3, the fit curve of N2 production rate was acquired (Fig. 6a, b). The N2 production with time was characteristic of “S”-type growth curve, which appeared to illustrate three N2 yield stages: preparation period before 13 h, stepped-up growing period between 13 and 20 h, and succedent slowed-up growing period, leading to the corresponding rate changes and the maximal rate of 0.073 mmol N2/(g·h) at 16 h in the second period. The change trend of N2 production with q (NO2−) was almost same as that with time (Fig. 6c, d), implying that N2 production depended on q (NO2−). Additionally, the value of produced N2 gradually approached that of q (NO2−) with time, and the differentials (ΔN) between q (NO2−) and produced N2 also presented three different periods in response to those in Fig. 6a: gradual increase from 0 to 0.29, decrease from 0.29 to 0.06, and relative stabilization in the range of 0.06–0.09. q (NO2−) represented the amount of adsorbed NO2− from solution on TA-Fe3+, including two parts: left on TA-Fe3+ (N1) and changed into N2 (N2), and therefore, ΔN was namely N1.
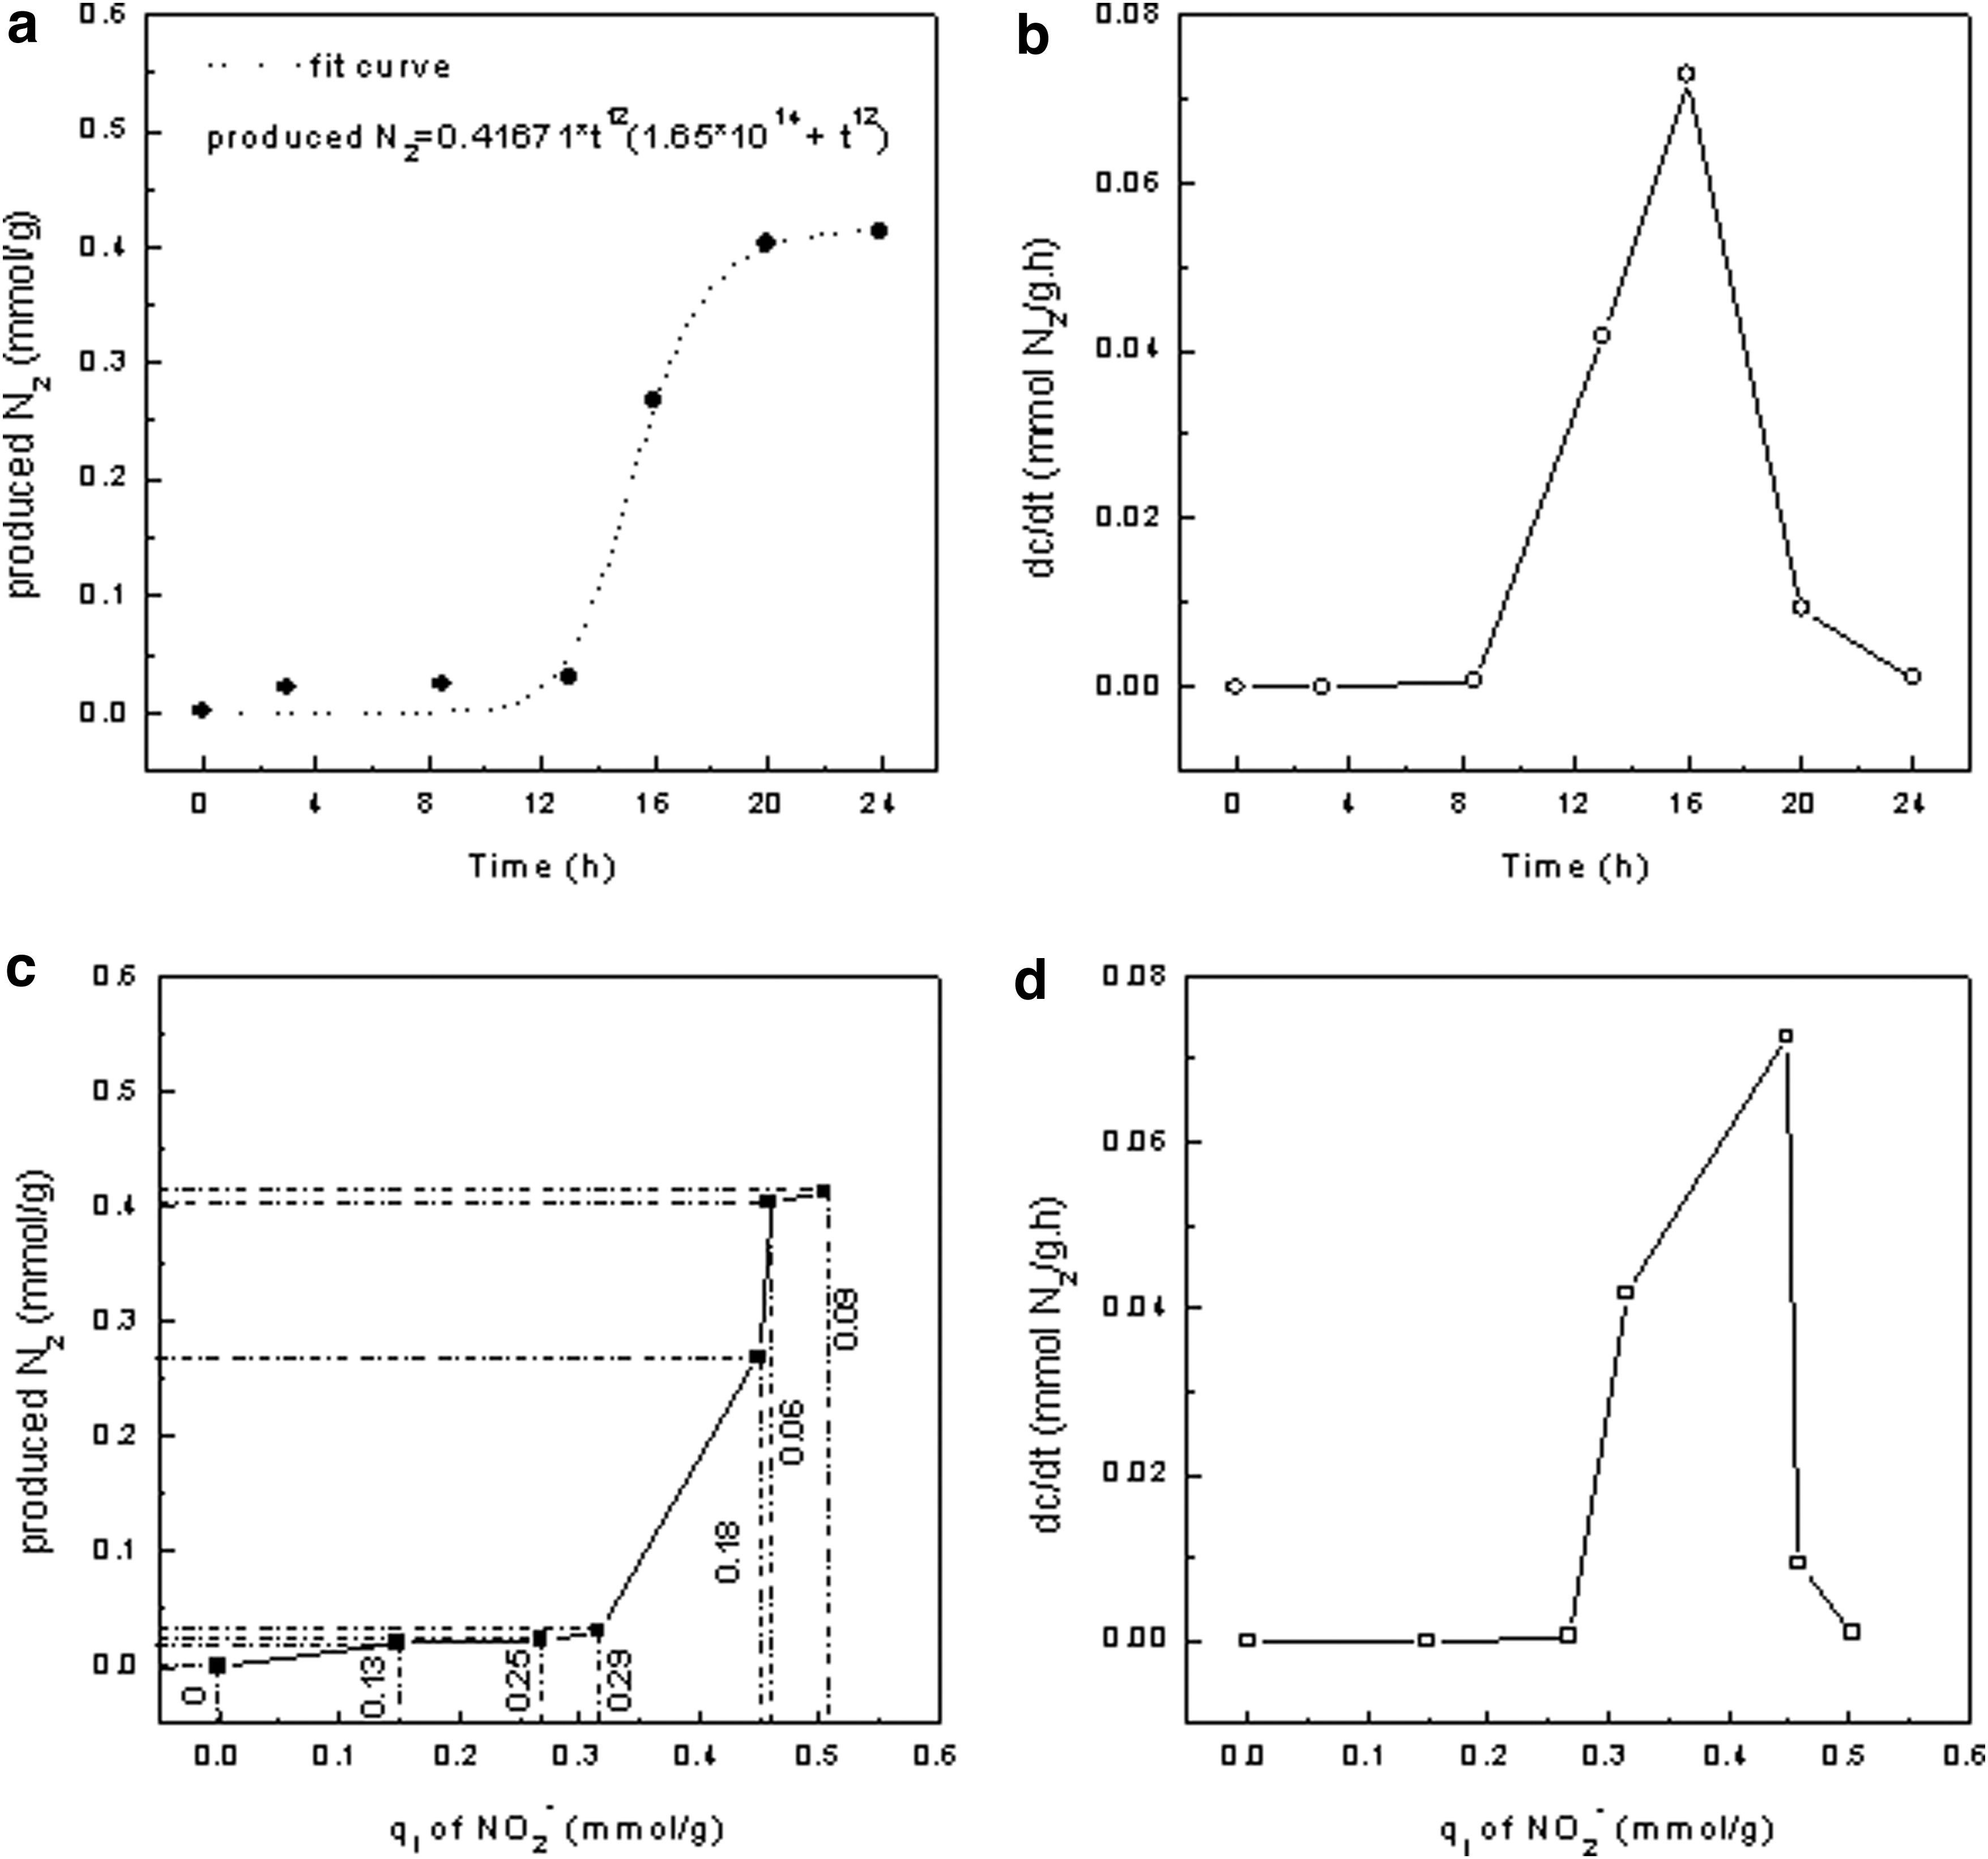
Effects of time and q (NO2−) on N2 production. The production rate (dc/dt) was from the derivative of the fit curve at a time.
In the first period, more adsorbed NO2− was accumulated on adsorbent, in the second period, more adsorbed NO2− was transformed into N2 with time [about 88% of q (NO2−) at 20 h], leading to less N1. More adsorbed NO2− was transformed, more NO2− should be transferred from solution on TA-Fe3+ synchronously, however, the fact was that N1 gradually reduced, implying that adsorption rate was less than N2 yield rate.
Above results demonstrated that the three N2 development stages were directly related to q (NO2−): (1) preparation period was used to accumulate enough adsorbed NO2− for the redox reaction, (2) more adsorbed NO2− on TA-Fe3+ ensured higher reaction rate and more N2 production in the second stage, and (3) finally, reaction slowed down with less and less NO2− left on TA-Fe3+. Although adsorption toward NO2− in advance shortened the preparation period as shown in Fig. 5, how to improve the adsorption toward NO2− at the same time of N2 formation required other measures.
Conclusions
Under moderate temperature and neutral conditions, the redox reaction between NH4+ and NO2− was realized to produce N2 by adsorption and catalysis through TA-Fe3+. Results identified this redox reaction to be a promising chemical denitrification technology. Facile synthesis, easy regeneration, reusability, and inexpensiveness determined TA-Fe3+ to have the potential for practical application in nitrogen removal from water. This work also revealed the relatively lower adsorption capacities of TA-Fe3+ for both NH4+ and NO2−, and adsorption toward NO2− to be the rate-determining step of the catalytic reaction. To develop the engineering application of the material, future work will mainly focus on three aspects: (1) to improve the understanding of the adsorption and catalysis mechanisms; (2) to identify key parameters impacting adsorption and redox reaction; and (3) to find an effective solution to the problem of solid–liquid separation in this system.
Footnotes
Authors' Contributions
Z.L. was responsible for the conception of the research and did the experiments. Z.L. and M.Z. wrote the article. Z.X. and Y.Y. participated in the discussion and article revision.
Author Disclosure Statement
No competing financial interests exist.
Funding Information
This work was supported by Sichuan Science and Technology Program [Grant No. 2023JDR0277], Yibin Science and Technology Program [Grant No. 2022NY029], Research Foundation of Yibin University for Talented Scholars [Grant No. 2021QH024], and the Key Research and Development Program of Sichuan Province, China [Grant No. 2021YFS0289].
References
Supplementary Material
Please find the following supplemental material available below.
For Open Access articles published under a Creative Commons License, all supplemental material carries the same license as the article it is associated with.
For non-Open Access articles published, all supplemental material carries a non-exclusive license, and permission requests for re-use of supplemental material or any part of supplemental material shall be sent directly to the copyright owner as specified in the copyright notice associated with the article.