
Abstract
The biotransformation of atenolol, sotalol, and metoprolol by mixed culture denitrifying communities was examined as a function of carbon availability and pharmaceutical concentration to explore the possible roles of cometabolism and direct substrate utilization. Sotalol and metoprolol were not found to be transformed. A matrix of conditions explored the biotransformation of water resource recovery facility relevant (25 μg/L) and chemical oxygen demand (COD)-equivalent (10–100 mg/L) atenolol concentrations in batch reactors (1 L) containing 25 mg-N/L nitrate. Carbon (MicroC® 2000) conditions included Nonlimiting (COD:N ratio >10), Partially Limiting (COD:N ratio = 2–3), and Limiting (COD:N ratio <1). Reactors without atenolol served as denitrification control experiments. Results suggest that atenolol did not appreciably influence nitrate reduction. The extent of atenolol degradation was independent of carbon availability. In the experiments conducted in the μg/L range, 30–40% biotransformation was observed. Scant degradation at higher concentrations suggested that direct utilization of the pharmaceutical was either unlikely or occurring slowly and independent of the pharmaceutical concentration. Process-based modeling using the Activated Sludge Model framework assessed denitrification across carbon availability conditions and incorporated three individual pharmaceutical biotransformation modeling strategies: (1) direct metabolism model; (2) cometabolic model, and (3) biotransformation kinetic model. Results suggest that there was insufficient evidence to suspect direct metabolism meaningfully contributed to the reduction in atenolol concentration. The cometabolic process-based model, including both growth and nongrowth-linked rate coefficients offered the best model performance, although growth-linked cometabolism was limited and not readily apparent across all experiments (growth-linked transformation coefficient <0.4 g-atenolol·g-COD−1). Thus, the biotransformation kinetic model is favored for monitoring and forecasting biotransformation in larger-scale systems because use of the parsimonious model (rate coefficient of 7 mg-atenolol·g-COD−1·d−1) resulted in only modest performance reductions. The biotransformation model represents an improvement over pseudo first-order models as it is a mixed-order kinetic model that is linked to transient biomass conditions.
Introduction
The presence of pharmaceutically active compounds (PhAC) in wastewater effluent and receiving water creates concern for ecosystem and public health (Daughton and Ternes, 1999; Furlong et al., 2017; Kolpin et al., 2002). Biological nutrient removal at water resource recovery facilities (WRRF) is designed to meet permit limits for carbon, nitrogen, and phosphorus from domestic wastewater, but lacks limit targets for PhAC in nonreuse facilities. While it has been shown that biological treatment processes can fortuitously transform some PhAC, the efficacy and efficiency of PhAC removal is highly variable (Ahmad et al., 2022; Carballa et al., 2004; Joss et al., 2005). In activated sludge mixed-culture microbial communities, the processes responsible for PhAC biotransformation include metabolism and cometabolism (Gonsalez-Gil et al., 2021; Su et al., 2015; Tran et al., 2013).
Metabolism is recognized as biotransformation by active microorganisms that utilize an organic substrate to support cell growth and maintenance (Grady et al., 2011; Nguyen et al., 2021; Tran et al., 2013). In cometabolic processes, the nongrowth substrate does not provide necessary carbon or energy to the active biomass, thus the reaction depends on the presence of a primary substrate for growth and energy (Arp et al., 2001; Criddle, 1993; Dalton and Stirling, 1982). The primary substrate may include an exogenous growth or energy source or endogenous stores during endogenous respiration. As compared with growth-linked cometabolism, endogenous cometabolism provides limited reducing energy for biotransformation of the nongrowth substrate and may manifest as a loss of biotransformation activity (Çeçen et al., 2009; Chang and Alvarez-Cohen, 1995; Park et al., 2017). Cometabolic biotransformation is attributed to the broad substrate range of some microbial enzymes that are induced in the presence of a growth/energy substrate (Arp et al., 2001; Dalton and Stirling, 1982).
Cometabolism of PhAC has been observed by autotrophic and heterotrophic (HET) microorganisms responsible for biological processes such as nitrification and denitrification while metabolism is strictly associated with heterotrophs (Sathyamoorthy et al., 2013; Su et al., 2015; Tran et al., 2013). Some heterotrophs may metabolically utilize PhAC as a primary substrate when concentrations are high enough to promote growth and maintenance of biomass (Tran et al., 2013). Direct metabolism of PhAC is thought to occur due to catabolic diversity and versatility within the microbial community, through the use of different substrates simultaneously (Kovárová-Kovar and Egli, 1998; Nguyen et al., 2021; Stadler et al., 2018) or specialist fractions capable of accessing the more complex carbon (De Gusseme et al., 2011). PhAC cometabolism has been linked to denitrification through correlation of biotransformation rates to higher organic substrate availability, mean specific denitrification rate (SDNR), and maximum specific growth rate (Polesel et al., 2017; Torresi et al., 2017). Yet, the relative contribution of HET metabolism and cometabolism to the biotransformation of PhAC during denitrification remains unclear.
Our research aims to better understand beta blocker attenuation during denitrification. Beta-blockers are prescribed for treatment of human cardiovascular conditions, as well as hypertension and anxiety, and as a result are frequently detected in wastewater at levels ranging from low ng/L to 100s of μg/L (Frishman and Saunders, 2011; Huggett et al., 2003; Kostich et al., 2014; Verlicchi et al., 2012; Yi et al., 2020). The presence of beta blockers in the environment has been shown to influence physiological responses in fish, including their reproduction, growth, heart rate, and the flight-or-fight response (Huggett et al., 2001; Massarsky et al., 2011). The overall objective of this study was to use a combination of experiments and modeling to differentiate metabolic and cometabolic transformation of selected beta blockers by exploring varying carbon availability.
Materials and Methods
Materials
The beta blockers, atenolol, metoprolol, and sotalol, were obtained from Sigma-Aldrich (≥98% purity). Purified (Milli-Q) water (>18.2 MΩ·cm, <15 ppb total organic carbon) was used for all experiments. MicroC® 2000, a proprietary glycerin-based carbon substrate, was provided by Environmental Operating Solutions, Inc. All other chemicals were purchased from Fisher Scientific.
Batch methods
Completely mixed batch reactors (1 L) contained biomass at a concentration of ∼880 mg/L mixed liquor volatile suspended solids in a nutrient solution that included 27 mg-N/L of ammonium chloride, 7 mg-P/L of monopotassium phosphate, 30 mg/L sodium bicarbonate, and trace elements (magnesium sulfate, copper sulfate, zinc sulfate, calcium chloride, ferrous sulfate, cobalt nitrate, and sodium molybdate at concentrations ranging from 2.3 to 3.5 mg/L). Oxygen transfer was limited by filling the reactor headspace with argon gas. Reactors were capped with a rubber stopper equipped with a sampling port and vent, and subsequently monitored to maintain dissolved oxygen concentrations below 0.3 mg/L and pH 7.0–8.0. The activated sludge used in these experiments was collected near the outlet of the anoxic zone at a WRRF that employs a biological nutrient removal process that includes sequential anaerobic, anoxic, and aerobic zones. The facility utilizes MircoC as a carbon substrate and operates with characteristics shown in Supplementary Table S1.
Activated sludge was triple washed with deionized water and then aerated for 2 h before use in the experiments. This process of washing and aerating removed solutes and any remaining degradable chemical oxygen demand (COD).
The experimental design aims to discern cometabolism from metabolism by comparing the biotransformation rates under differing carbon availability conditions: Nonlimiting, Partially Limiting, and Limiting. The Nonlimiting carbon condition describes the unlimited availability of a carbon substrate (mg-COD/L) for biomass growth during complete denitrification as determined by COD:N ratios >10 (Her and Huang, 1995). Alternatively, the Limiting condition describes reactors where exogenous carbon substrate is not available, and the mixed culture community is subjected to endogenous respiration for the duration of the experiment. Partially Limiting conditions denote reactors where available exogenous carbon is depleted within the experimental period (i.e., transition from exogenous to endogenous respiration). Three PhAC conditions were evaluated for each carbon condition: WRRF-Relevant concentrations (25 μg/L), COD-Equivalent concentrations (20–200 mg-COD/L, i.e., 2.0 g-COD/g-atenolol), and the absence of PhAC (used as a control condition for denitrification). The conditions for the experimental matrix are shown in Table 1.
Matrix of Nominal Conditions for Experiments 1 (Upper Value) and 2 (Lower Value)
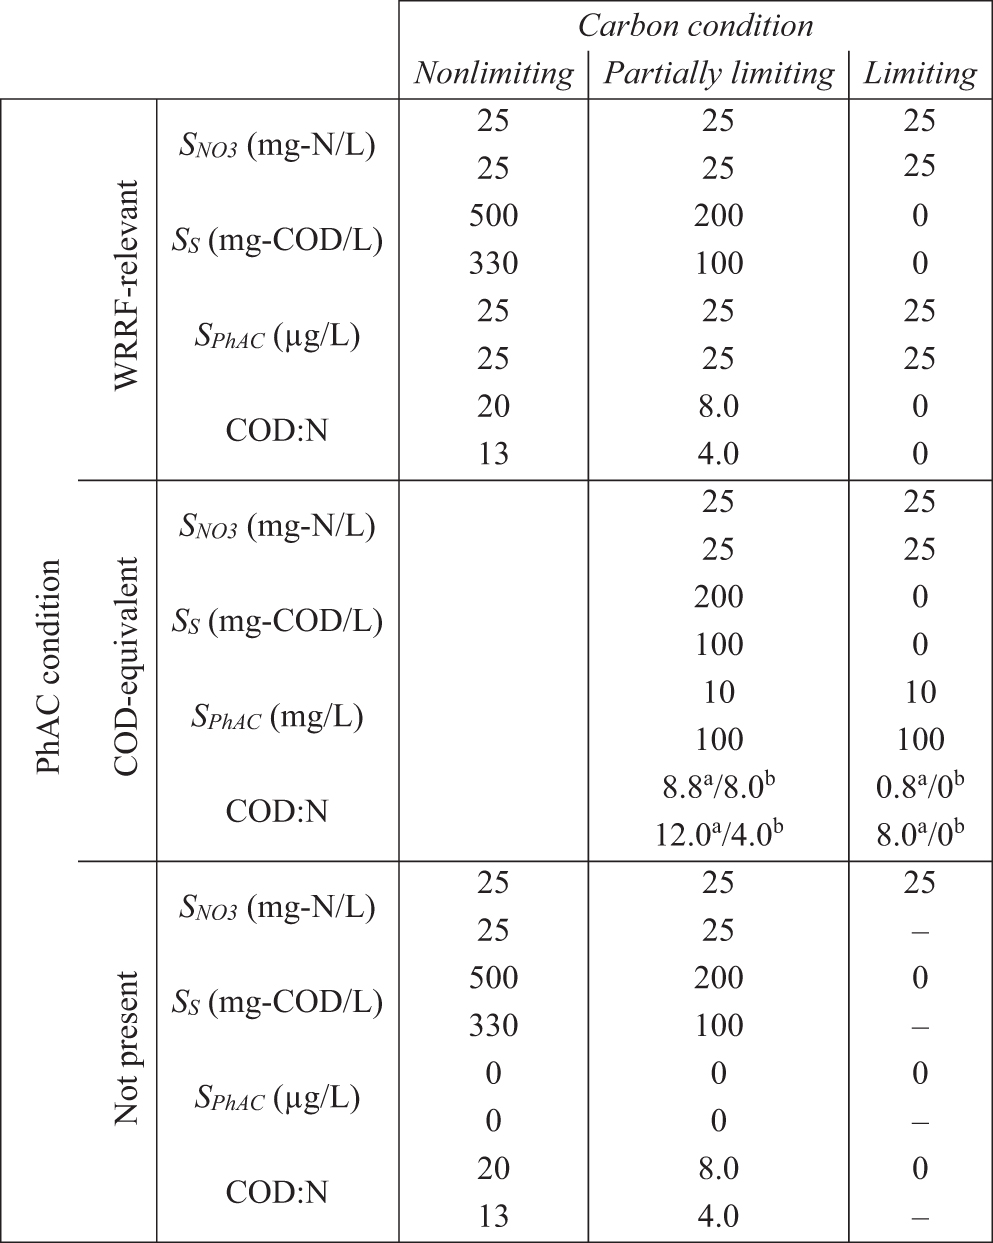
Carbon Limiting, PhAC Not Present condition was not used in Experiment 2.
COD:N ratio including PhAC.
COD:N ratio excludes PhAC.
COD, chemical oxygen demand; PhAC, pharmaceutically active compounds; WRRF, water resource recovery facilities.
The matrix presentation of Table 1 matches the later presentation of results in Figs. 1 and 2. Methanol was used to prepare the PhAC stock solutions, which were then diluted with Milli-Q for use in the experiments. The maximum methanol concentration in any experimental reactor was 130 mg-COD/L. Preliminary experiments (Supplementary Fig. S1) indicate that the biomass collected from the WRRF using MicroC to support denitrification cannot readily utilize methanol. These data are consistent with studies that demonstrate how denitrifying communities that have not been acclimated to methanol cannot utilize methanol as a carbon substrate (Hallin and Pell, 1998; Lu et al., 2014; Onnis-Hayden and Gu, 2008). Thus, the methanol contribution to COD was excluded throughout based on the calculated concentration of methanol in each reactor, a conversion factor of 1.5 g-COD per g-methanol.
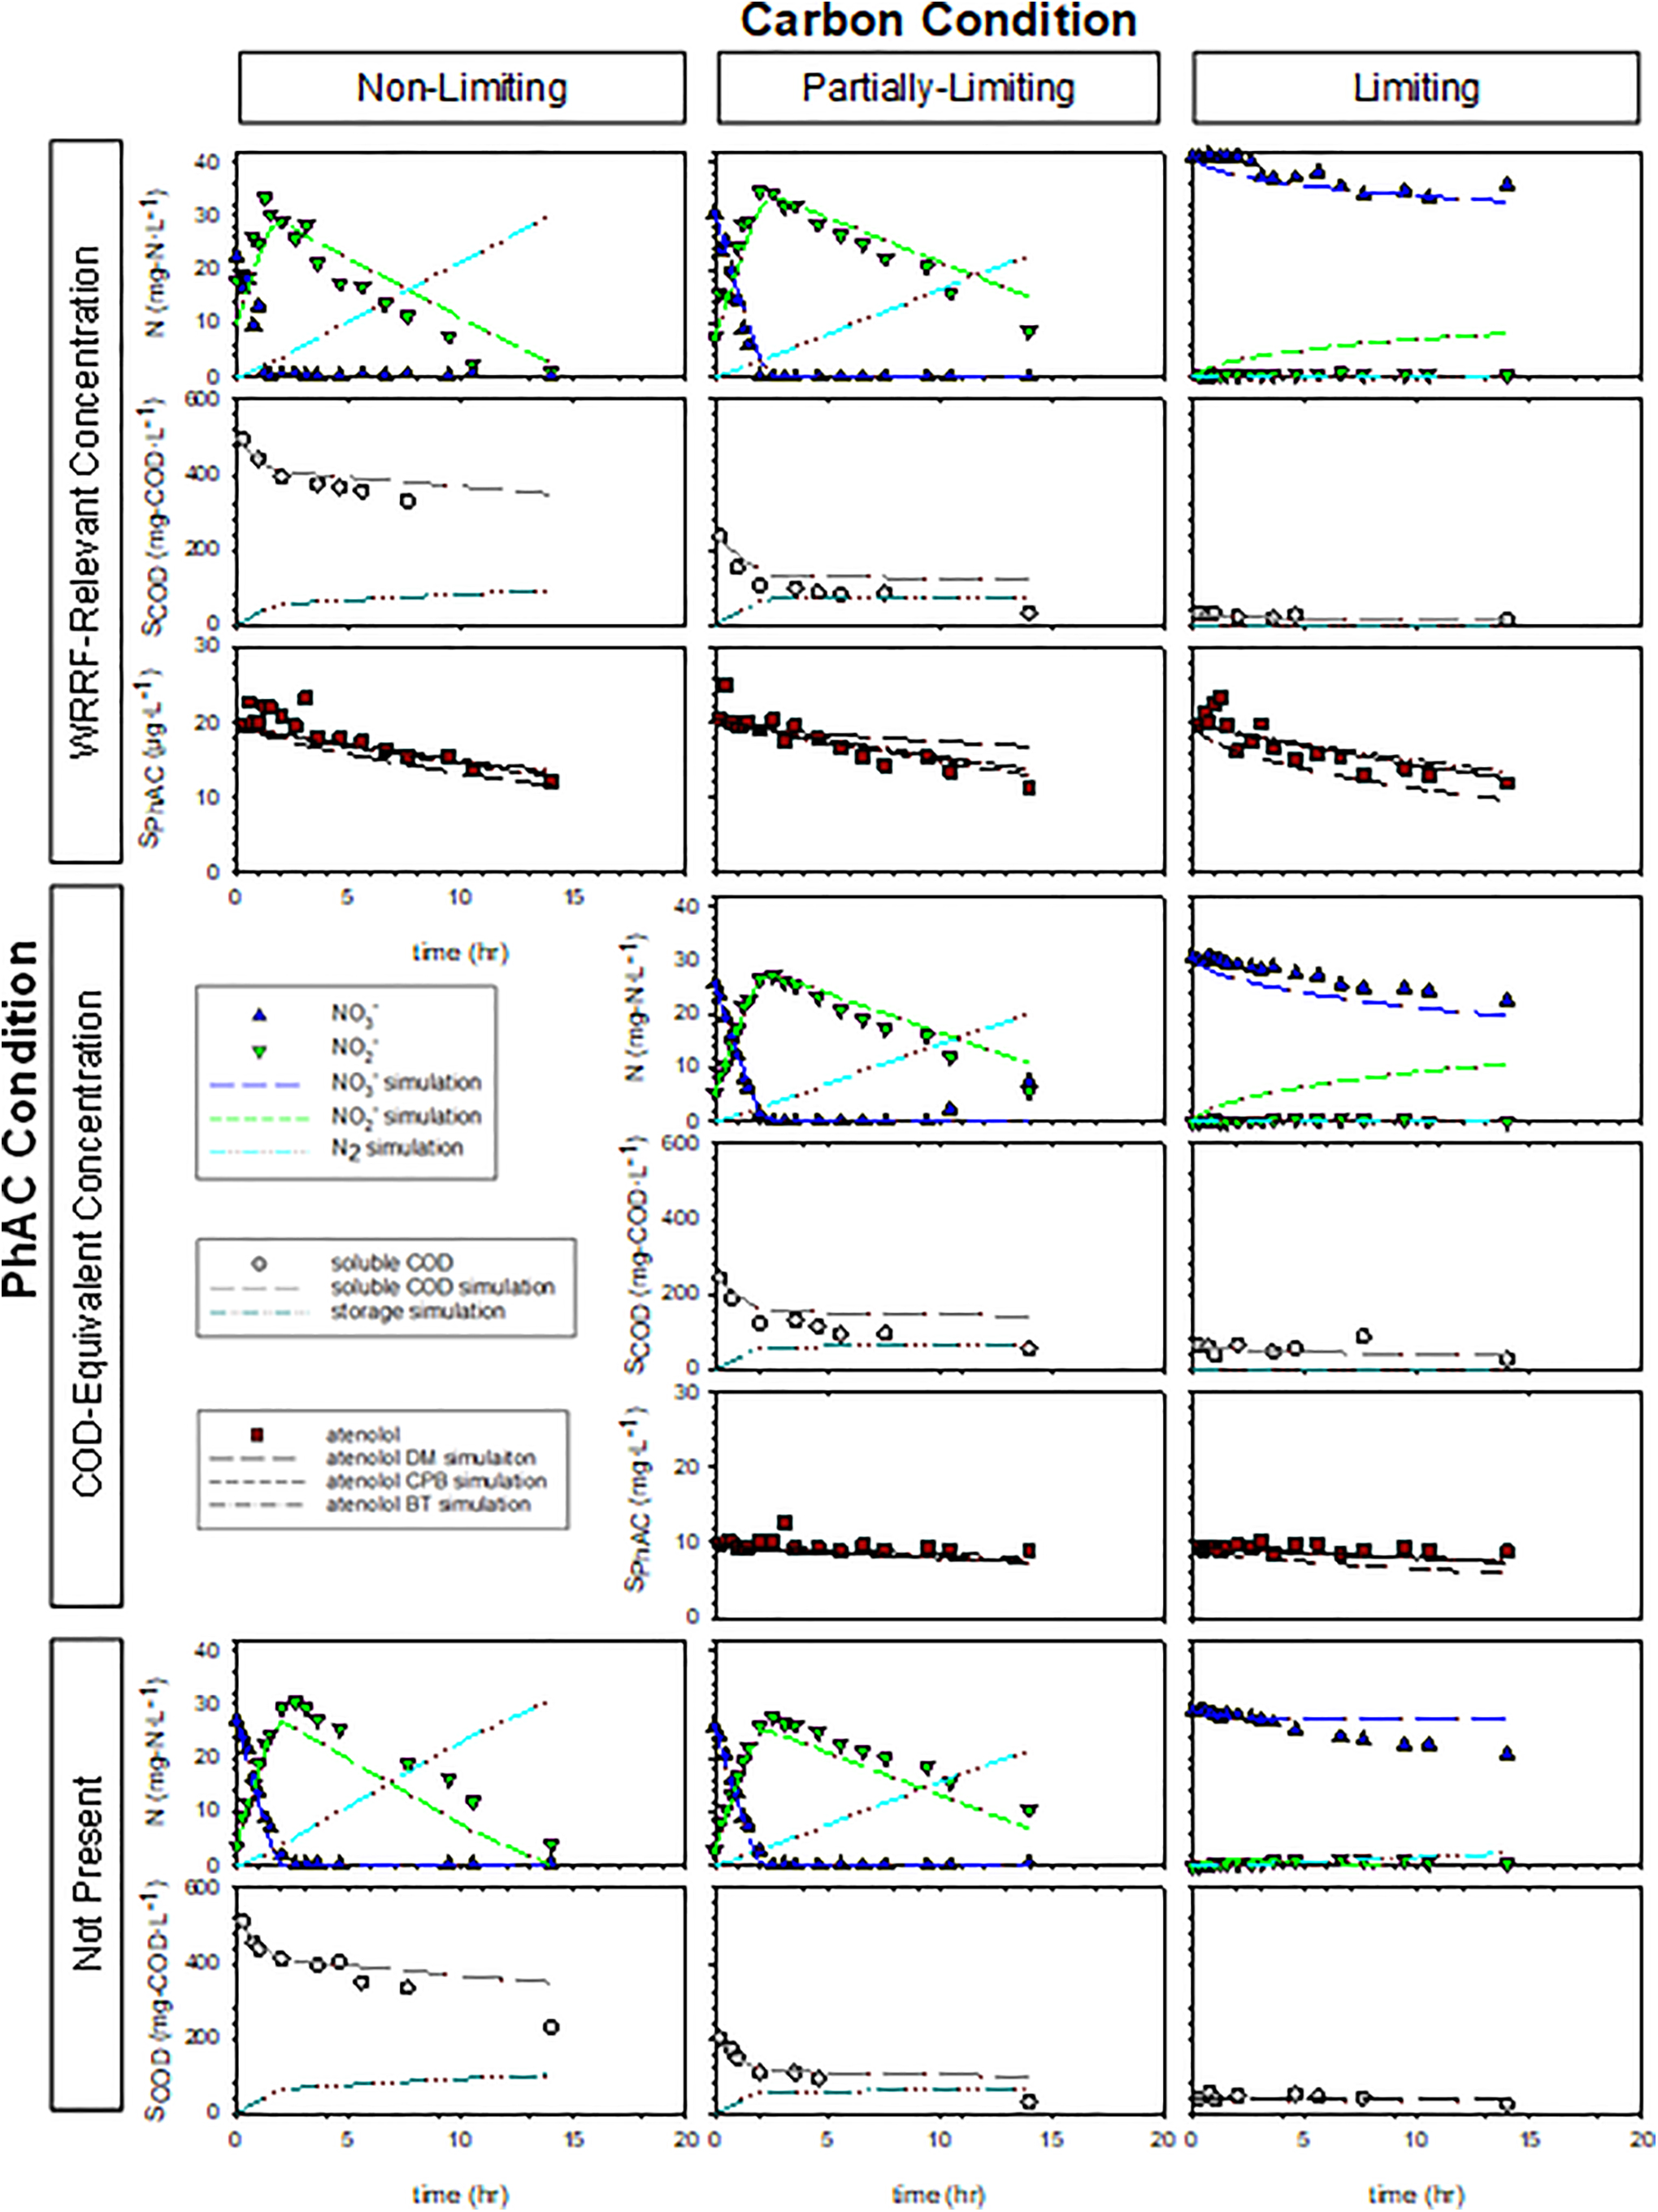
Results from Experiment 1 shown as a matrix of three carbon conditions (Nonlimiting, Partially Limiting, and Limiting) and three pharmaceutical conditions (WRRF-Relevant, COD-Equivalent, and Not Present).
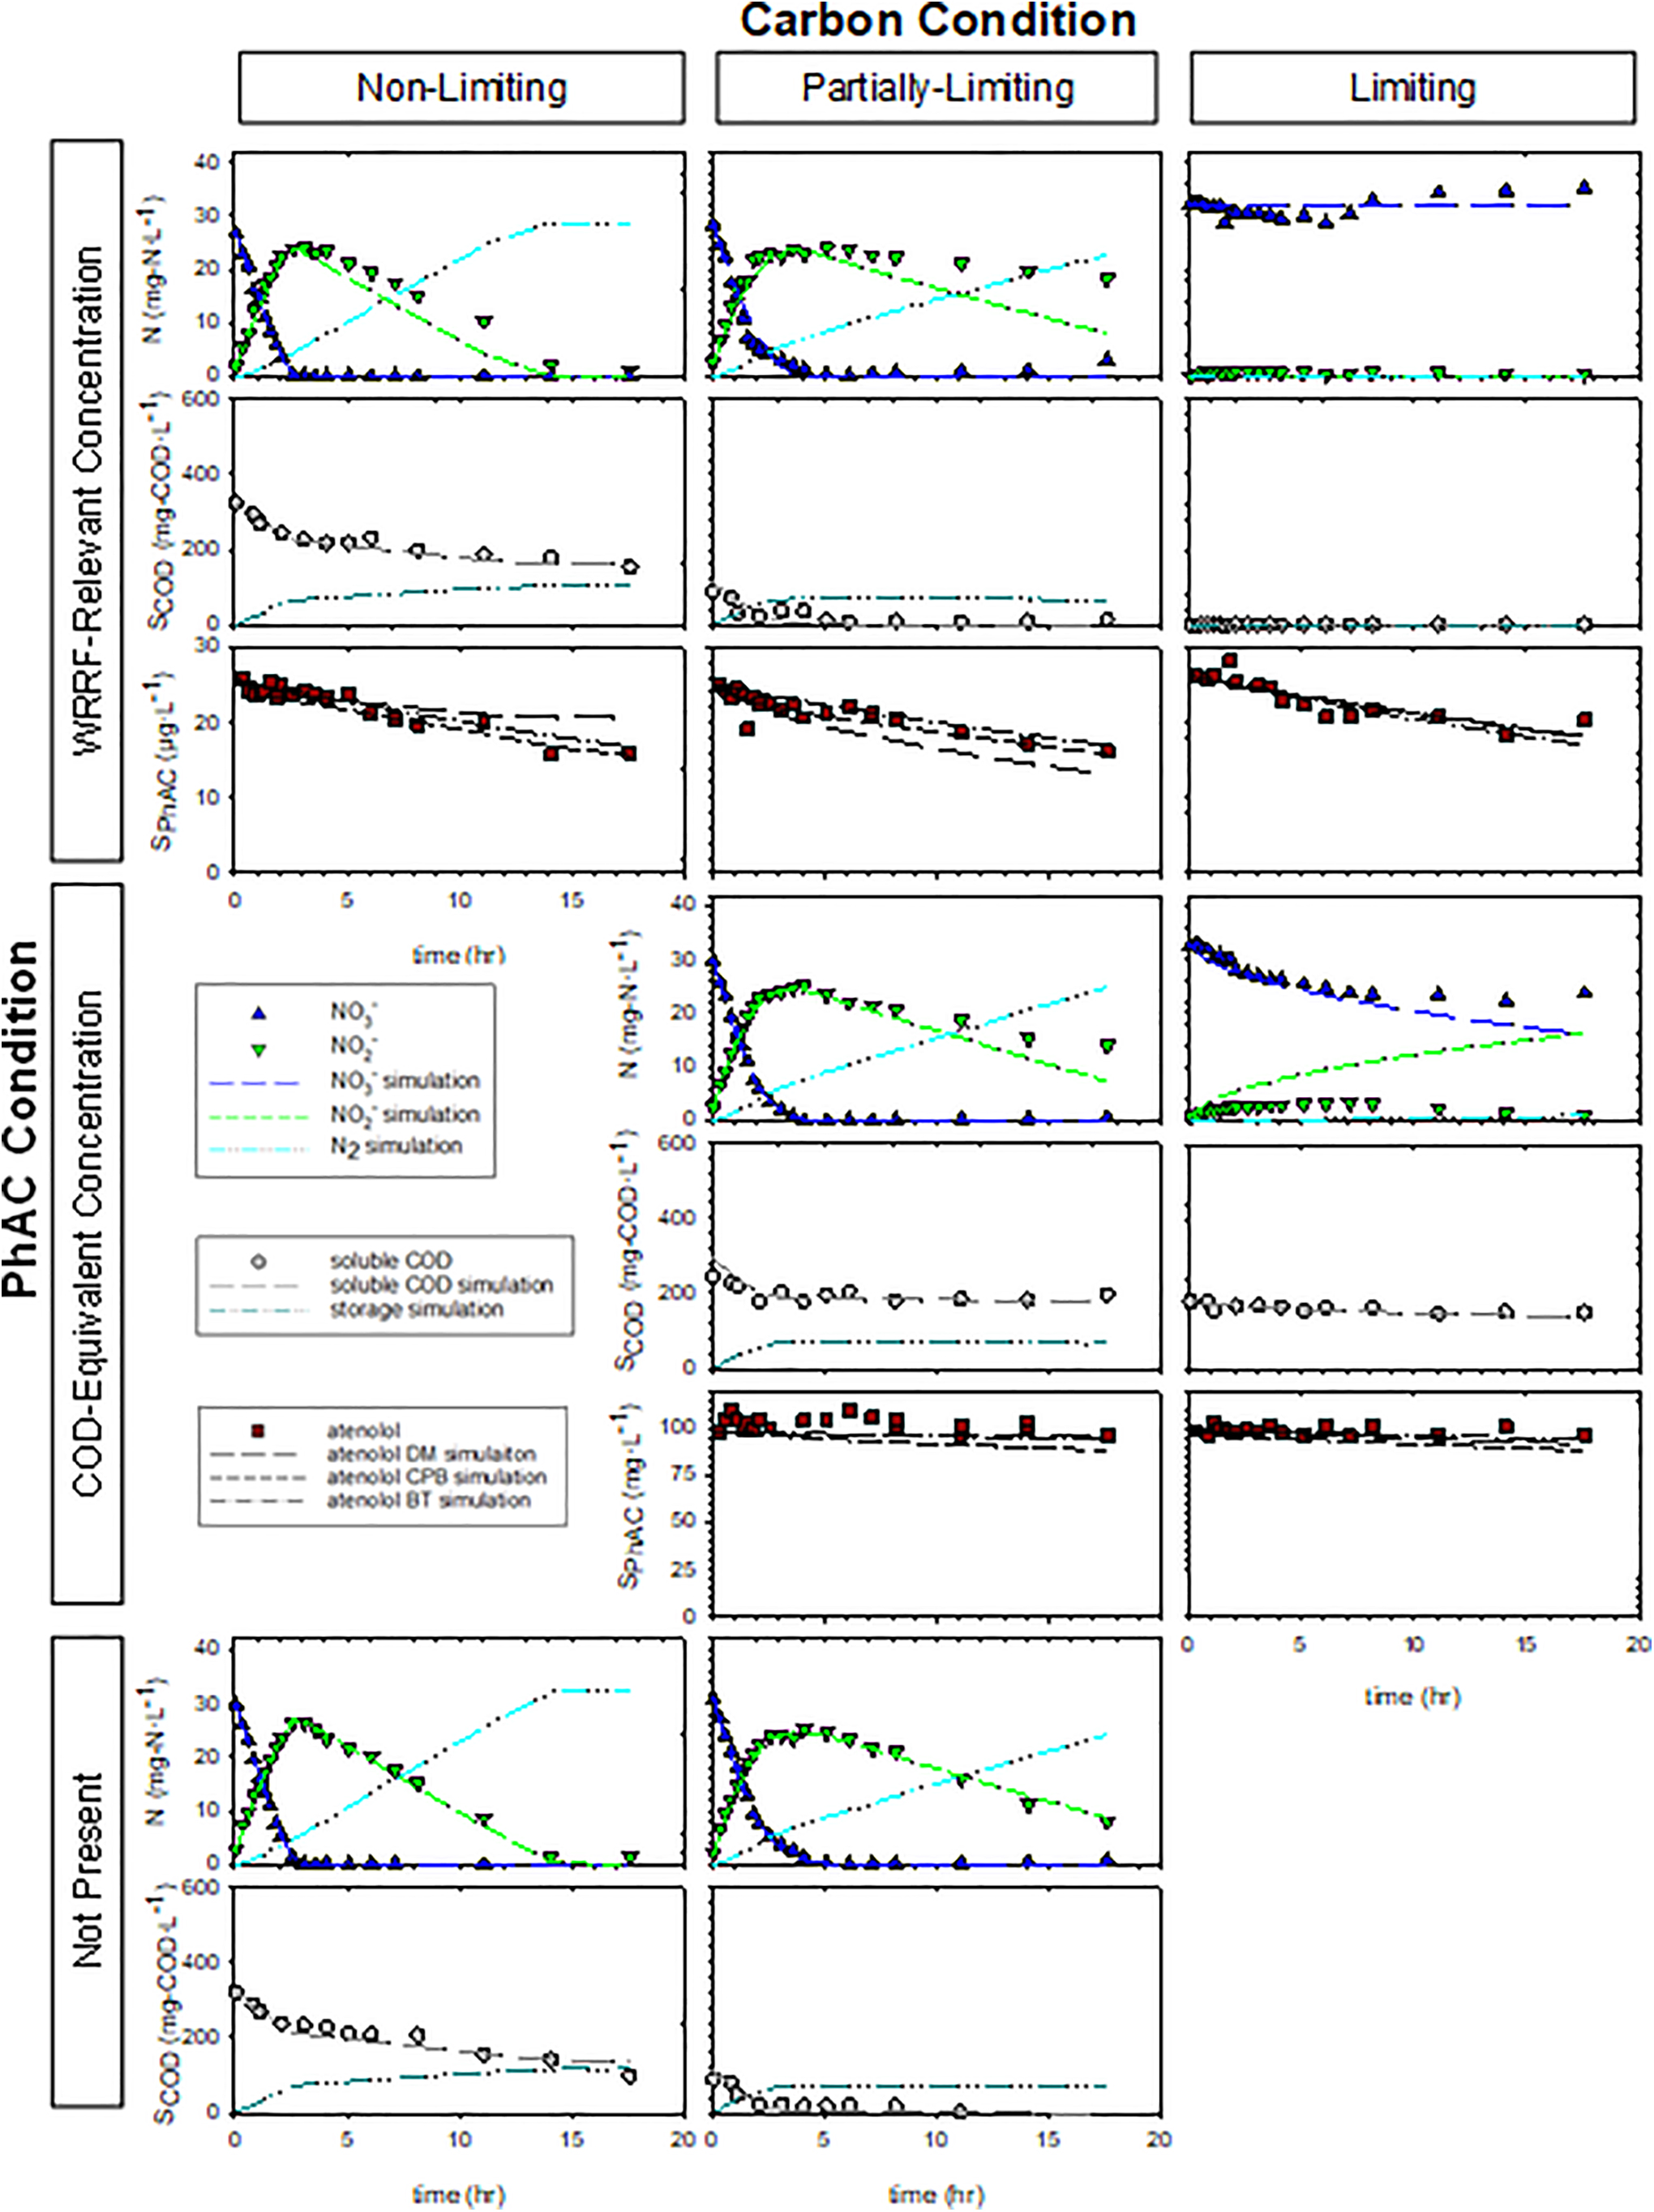
Results from Experiment 2 shown as a matrix of three carbon conditions (Nonlimiting, Partially Limiting, and Limiting) and three pharmaceutical conditions (WRRF-Relevant, COD-Equivalent, and Not Present).
Analytical methods
Dissolved oxygen and pH were monitored using a HACH LDO HQ40d multiparameter meter. Nitrate and nitrite concentrations were quantified using a Dionex ICS 2000 Ion Chromatograph equipped with a conductivity detector. PhAC quantification occurred using an Agilent Series 1100 high-performance liquid chromatograph equipped with a fluorescence detector as described in Sathyamoorthy et al. (2013). Total and soluble COD (sample passing 0.45 μm filters) were quantified using closed reflux, colorimetric Method 8000 by HACH (Loveland, CO, USA). Mixed liquor suspended solids and mixed liquor volatile suspended solids were measured by gravimetric analysis (Standard Methods 2540 C and 2540 D, respectively). Samples were sampled in triplicate and stored at −80°C until the time of analysis when they were centrifuged (4,000 rotations per minute for 20 min) to separate biomass and aqueous phases.
Models
Process-based models such as the Activated Sludge Model (ASM) No. 3 describe and interrelate biological processes (Gujer et al., 1999). The ASM used herein assumes a two-step denitrification process (Kaelin et al., 2009), includes direct substrate utilization (Ni and Yu, 2008; Zhou et al., 2013), and neglects sorption (Sathyamoorthy et al., 2013). Incorporating direct substrate utilization for both nitrate and nitrite reduction produces a model that allows for possible HET growth on the carbon substrate through simultaneous storage and direct utilization while substrate is readily available for growth. HET growth through direct substrate utilization is turned off as the substrate concentration approaches the half saturation coefficient (KS). While the model allows for possible direct metabolism of PhAC, it assumes that PhAC, as synthetic organic compounds, are not transformed into intracellular storage products (Grady et al., 2011). PhAC may be cometabolically transformed during growth on storage products or growth on MicroC. PhAC cometabolism is modeled using the cometabolic process-based (CPB) model described in Sathyamoorthy et al. (2013).
Process rate expressions and stoichiometry are presented in Supplementary Tables S2 and S3. Equations describing PhAC biotransformation through direct metabolism, and cometabolic transformation based on direct substrate utilization and storage products are shown in Supplementary Table S4. Application of the biotransformation model occurs within the ASM framework as an alternative to the direct metabolism and cometabolism terms shown in Supplementary Table S4. In this way, the biotransformation model differs from the pseudo first-order models by accounting for temporal variation of the biomass concentration (Joss et al., 2005; Sathyamoorthy et al., 2013).
The process-based model includes 35 parameters of which 29 were fixed using literature values (Supplementary Table S5). Initial conditions are shown in Supplementary Table S6. The dimensionless anoxic reduction factors for nitrate (ηNO3) and nitrite (ηNO2) growth processes were simultaneously fit to data from the denitrification control reactors (PhAC Not Present row in the matrix of conditions). The use of the control data in this way represents an independent adjustment of the anoxic reduction factors, which were then fixed for all subsequent simulations. In Experiment 2, this process also included fitting the initial COD concentration of the Partially Limiting, PhAC Not Present control, and applying the fitted value to all three Partially Limiting PhAC Not Present conditions since these initial COD measurements appeared less certain. The measured and fitted initial COD in the Partially Limiting, control are 88.8 and 111 mg-COD/L, respectively.
The remaining four adjustable parameters relate to PhAC biodegradation equations (Supplementary Table S4). kPhAC,NO3 and kPhAC,NO2 [MPhAC·Mbio−1·T−1] are the rate coefficients associated with direct metabolism of PhAC. CPB model parameters TPhAC,HET [MPhAC·Mbio−1] and kPhAC,HET [MPhAC·Mbio−1·T−1] represent cometabolic transformation coefficients for PhAC during exogenous and endogenous processes, respectfully. Data from Experiments 1 and 2 were used to support fitting either the kPhAC,NO3 and kPhAC,NO2 set when exploring possible direct metabolism or the TPhAC,HET and kPhAC,HET set when exploring possible cometabolism. The half-saturation coefficient, KPhAC [MPhAC·L−3], is unknown but assumed to be 20 mg-COD/L, which is within the typical range for organic matter from domestic wastewater (Metcalf & Eddy, 2004).
Simulations were conducted in MATLAB (R2019b) using the ode45 solver and lsqnonlin (nonlinear least squares) function. The objective function was the minimization of the weighted sum of squared errors for: nitrate, nitrite, and COD when fitting ηNO3 and ηNO2, and PhAC when fitting biotransformation parameters. Weights used herein were one for nitrate, nitrite, and PhAC and 0.1 for COD given that higher COD concentrations would otherwise disproportionately influence the model estimates.
Metabolic biotransformation was explored by fitting kPhAC,NO3 and kPhAC,NO2 to the WRRF-Relevant conditions. Fitted values for kPhAC,NO3 and kPhAC,NO2 were subsequently applied to the conditions having orders-of-magnitude greater PhAC concentration (i.e., COD-Equivalent conditions). Fits of the CPB model occurred by first adjusting kPhAC,HET to data from the Carbon-Limiting, WRRF-Relevant condition as that condition contained no exogenous substrate and no growth on storage products (i.e., the experimental condition matched the definition of the parameter). The value of kPhAC,HET was then fixed so that a single parameter, TPhAC,HET, was fit to the data obtained under the other two WRRF-Relevant conditions (Carbon Nonlimiting and Partially Limiting).
Nash–Sutcliffe Efficiency (NSE) and the corrected Akaike information criterion (AICc) were used to evaluate model fits as described in Sathyamoorthy et al. (2013).
Results and Discussion
Atenolol, metoprolol, and sotalol were selected for preliminary experiments based on their widespread use and detection in environmental media. Appreciable attenuation was only observed with atenolol (Supplementary Fig. S2), which aligns with other studies that suggest metoprolol and sotalol are more recalcitrant than atenolol under denitrifying conditions (Falås et al., 2013; Polesel et al., 2017; Torresi et al., 2017). Based on these preliminary data, atenolol was selected for further study.
Nitrate reduction
The rates and extents of nitrate reduction were assessed with carbon utilization to verify the conditions employed in the experimental matrix. SDNRs, ΔCOD:ΔN ratio, and COD utilization for the Partially Limiting carbon condition in Experiment 1 suggest these reactors became carbon limited later than intended (Supplementary Table S7). Otherwise, rates of denitrification were similar between the two experiments. Visual analysis of the measured soluble COD data show that MicroC utilization initially appears zero-order when nitrate is present, but slower when nitrite becomes the electron acceptor (data in Figs. 1 and 2). This mixed-order, step-wise carbon utilization rate, as well as the slower nitrite reduction rate, may indicate electron competition between nitrate reductase (Nar) and nitrite reductase (Nir) from a common electron supply chain as described in more detail later (Ge et al., 2012; Oh and Silverstein, 1999).
Where the calculated SDNRs may not capture the detailed effect of carbon limitation on nitrate reduction, overlain plots of relative nitrate concentration demonstrate more of the nuances of carbon availability effects on nitrate reduction (Supplementary Fig. S3). Similarity in nitrate reduction rates in the presence and absence of high concentrations of atenolol suggests that concentrations up to 100 mg/L of atenolol do not appreciably inhibit denitrification. MicroC is designed to be readily degradable, and it is reasonable to assume it is much more accessible than atenolol in these experiments. Diauxic growth would result in the sequential utilization of MicroC followed by atenolol, however, any modest atenolol biotransformation at the higher atenolol concentration (i.e., COD-Equivalent condition) appears to occur simultaneously with MicroC utilization. Moreover, the similarity in the nitrate reduction in these reactors suggests that ∼10 mg/L atenolol does not support denitrification by the MicroC conditioned microbial community over the time frame of these experiments.
The carbon utilization observed at the higher atenolol concentrations employed in Experiment 2 hint at a modestly faster rate of nitrate reduction in the presence of 100 mg/L atenolol as compared with rates in the PhAC Not Present and WRRF-Relevant PhAC conditions (Supplementary Table S5 and data in Figs. 1 and 2). This observation is intriguing as the COD associated with atenolol at this concentration can theoretically support biomass growth (i.e., initial COD:N = 5.59) and the type of carbon substrate available is known to influence rates of metabolism and electron transfer in denitrifying communities (Cherchi et al., 2009; Ge et al., 2012; Lu et al., 2014). However, longer-term exposure studies are needed to understand the potential influence of atenolol on the microbial community.
Nitrite accumulation is evident irrespective of COD:N ratio, which is consistent with the results of others even though nitrite accumulation is thought to occur at low COD:N (Ge et al., 2012; Oh and Silverstein, 1999). We attribute the nitrite accumulation to competition for electrons between the Nar and Nir enzymes (Ge et al., 2012; Lu et al., 2014; Oh and Silverstein, 1999). Carbon type is known to influence nitrite accumulation, and the glycerin-based substrate (MicroC) may preferentially donate electrons to Nar (Akunna et al., 1993; Cherchi et al., 2009; Her and Huang, 1995). While nitrite accumulation was observed in our experiments, the concentration of nitrite (<35 mg/L) and pH (7–8) in these experiments do not support nitration of the PhAC (Gaulke et al., 2008).
Atenolol biotransformation
Experimental conditions were designed to facilitate comparisons that yield insight into atenolol biotransformation. Within the row of WRRF-Relevant PhAC conditions, the Nonlimiting carbon condition is indicative of atenolol biotransformation rate in the presence of excess exogenous substrate. In contrast, the Partially Limiting condition is used to understand how changing carbon availability influences rates of atenolol biotransformation. For example, cometabolism is suggested where atenolol biotransformation rate in the Partially Limiting condition is similar to the Nonlimiting condition at early time but slows as available carbon substrate becomes limiting. However, observation of similar atenolol biotransformation rates, irrespective of the carbon condition, may suggest direct metabolism with COD-Equivalent conditions used as confirmation.
Data from Experiment 1 and 2 are shown in Figs. 1 and 2, respectively, for the matrix of experimental conditions. Visual assessment suggests similar rates of atenolol biotransformation were observed in each row of the figure representing the same PhAC condition suggesting atenolol data appeared independent of COD:N ratios. Torresi et al. (2017) observe that the micropollutant removal efficiency did not correlate with the applied COD:N ratio in continuous-flow experiments with a postdenitrifying moving bed biofilm reactor (MBBR). The ASM was fit to the data in a multistep process that commenced with using data from the denitrification control experiments (No PhAC conditions) to adjust the anoxic reduction factors ηNO3 and ηNO2. Preliminary simulations suggested fitting ηNO3 and ηNO2 separately to the Carbon Nonlimiting and Carbon Partially Limiting conditions offered superior NSE when compared with using one set of anoxic reduction factors for all conditions. Here, we focus on Experiment 2, as the Partially Limiting condition is better captured in this experiment as noted above.
Fitted values (value ±95% confidence interval) of ηNO3 for the Nonlimiting and Partially Limiting conditions in Experiment 2 were 0.12 ± 0.03 and 0.17 ± 0.04, respectively, and 0.02 ± 0.01 and 0.06 ± 0.06, respectively, for ηNO2. As can be seen for the PhAC Not Present conditions in Fig. 2, the fits well describe the nitrate and nitrite data. The fitted denitrification model also captures the observed higher rate of COD utilization during nitrate reduction and slower rate thereafter. Larger values of ηNO3 in comparison to ηNO2 resulted from the observed nitrite accumulation and relatively slower nitrite rates of reduction. Recall that the ASM employs a single biomass concentration and adjusts relative contributions of that biomass through these anoxic reduction factors. Values fit using the PhAC Not Present conditions were then fixed when simulating the other experimental conditions. This approach represents a calibration of ASM using independent data and limits the number of adjustable parameters when evaluating atenolol biotransformation.
Three modeling approaches were sequentially explored when assessing atenolol biotransformation: (1) direct metabolism, (2) cometabolism, and (3) a more general description of biotransformation (Supplementary Table S4). Each approach modeled atenolol biotransformation by fitting model parameters to the WRRF-Relevant PhAC conditions and then applying those parameters to predict the COD-Equivalent PhAC conditions. Simulations of the Partially Limiting and WRRF-Relevant condition were conducted assuming the PhAC COD does not appreciably contribute to denitrification as discussed in the “Nitrate reduction” section above. The direct metabolism biotransformation model assumes that the atenolol biotransformation occurs independently of growth but integrates time-dependent biomass concentrations and use of nitrate and nitrite as electron acceptors (Supplementary Table S4). Model performance is shown in Table 2, Figs. 1 and 2, and Supplementary Fig. S4. Fitted values of kPhAC,NO2 are an order of magnitude greater than kPhAC,NO3, likely resulting from the relatively lower nitrite reduction factors fit to the denitrification control conditions.
Performance of the Atenolol Direct Metabolism Model for Experiments 1 (Upper Value) and 2 (Lower Value)
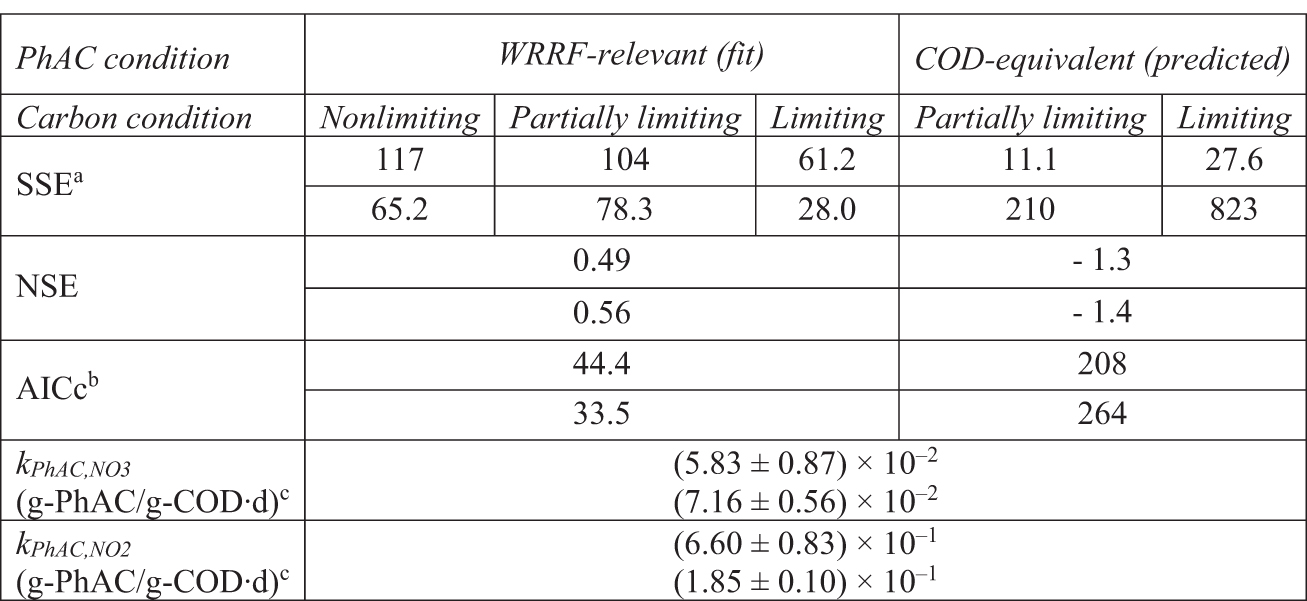
SSE units are (μg/L)2 and (mg/L)2 for WRRF-Relevant and COD-Equivalent conditions, respectively. Note that initial COD-Equivalent conditions had initial atenolol concentrations of 10 and 100 mg/L in Experiments 1 and 2, respectively.
AICc calculated using SSE in units of (μg/L)2.
Value ±95% confidence interval.
AICc, Akaike information criterion; NSE, Nash–Sutcliffe Efficiency; SSE, sum of squared errors.
Where nitrate is preferentially reduced, there is a corresponding faster initial carbon utilization rate in both experiments. A similar observation of the atenolol data suggests there may also be a corresponding faster biotransformation of atenolol during nitrate reduction. Visual analysis of the models indicates that the nitrate step parameter kPhAC,NO3 fits the atenolol data well when nitrate is present, however, the model performance breaks down once nitrite reduction is dominant. Notably, the best direct metabolism model description of atenolol concentrations occurs in the Carbon Liming, WRRF-Relevant PhAC concentration conditions where some nitrate reduction and negligible nitrite reduction occurs over the duration of the experiments. These observations suggest that atenolol biotransformation may depend on the faster electron transfer rate by Nars (Polesel et al., 2017).
The CPB model comprises transformation coefficients associated with the presence and absence of the growth substrate (Sathyamoorthy et al., 2013). While the structure of the selected ASM necessitates applying the CPB model to both direct substrate utilization as well as storage, only one set of transformation coefficients (TPhAC,HET and kPhAC,HET) are fit to both processes. We explored the implications of this approach by fitting to either carbon storage or growth on storage products and found negligible differences suggesting application of the rates to both process is acceptable as it does not require a prior knowledge about which process may be dominant in other systems. Results of the two-parameter fits are shown in Table 3 and Figs. 1 and 2. Note that value of TPhAC,HET becomes highly uncertain when fitting the parameter to the data from Experiment 1. The two rates associated with the CPB model should work to create a knee in the atenolol curve corresponding to the cessation of growth due to the exhaustion of substrate or electron acceptor. Atenolol data in Experiment 1 do not offer the clarity necessary to identify this feature and thus the model has difficulty in fitting TPhAC,HET.
Performance of the Atenolol Cometabolism Model for Experiments 1 (Upper Value) and 2 (Lower Value)
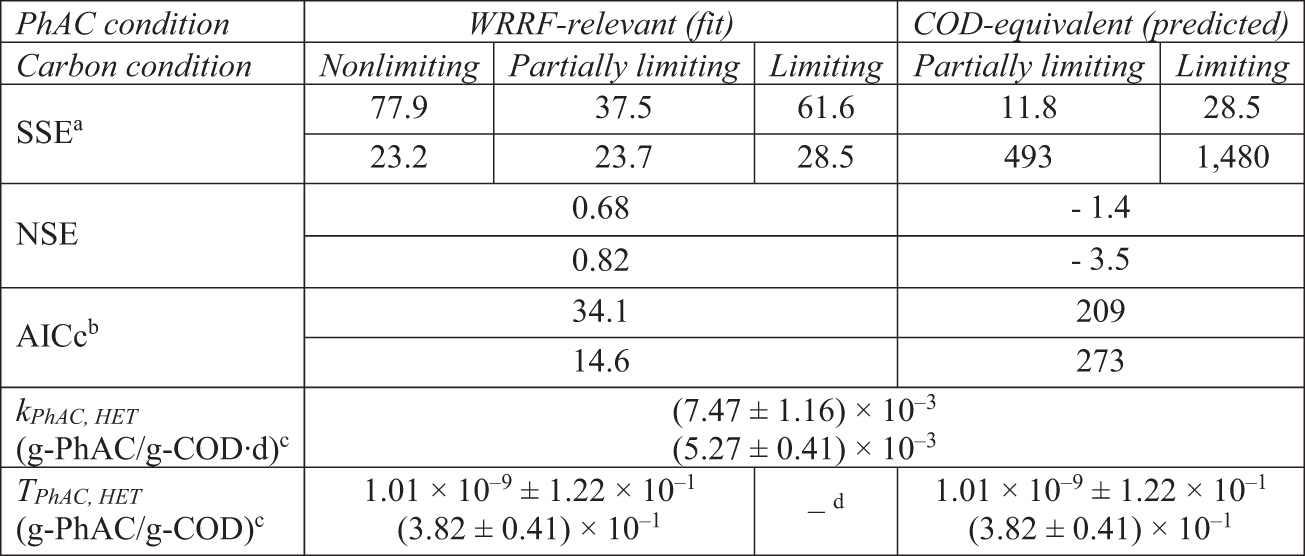
SSE units are (μg/L)2 and (mg/L)2 for WRRF-Relevant and COD-Equivalent conditions, respectively. Note that initial COD-Equivalent conditions had initial atenolol concentrations of 10 and 100 mg/L in Experiments 1 and 2, respectively.
AICc calculated using SSE in units of (μg/L)2.
Value ±95% confidence interval.
kPhAC,HET fit only to the Limiting Carbon Condition with TPhAC,HET = 0. Fitted value for kPhAC,HET fixed when fitting TPhAC,HET to the Nonlimiting and Partially Limiting WRRF-Relevant conditions.
In contrast, values of TPhAC,HET and kPhAC,HET fit to the data from Experiment 2 provide a good description of the data, and the fitted values of kPhAC,HET from Experiment 1 and 2 are similar (p = 0.05). AICc values suggest that the description of the data offered by the CPB model is superior to that of the direct metabolism model (ΔAICc,DM-CPB of 10.3 and 18.9 for the fits to Experiments 1 and 2, respectively).
Similar to the CPB model, the atenolol biotransformation (BT) kinetic model is integrated into the ASM framework, however, this model utilizes a single term, kPhAC, to generally describe PhAC transformation without attribution to a specific process. In this way, the biotransformation kinetic model is somewhat like pseudo first-order models that are frequently employed to describe PhAC degradation (Joss et al., 2005; Sathyamoorthy et al., 2013), but with the distinct advantage of being a mixed-order biotransformation model that it is dependent on transient biomass conditions. Values of the model parameter, kPhAC, fit to Experiments 1 and 2 are similar to one another and similar to the endogenous cometabolic parameter fit to Experiment 1 (p < 0.05) (Table 4). However, the CPB model has a lower AICc suggesting that the additional fitting parameter in the CPB (TPhAC,HET) is supported by the data of Experiment 2 (ΔAICc,BT-CPB of 1.6 and 5.2 for the fits to Experiments 1 and 2, respectively).
Performance of the Atenolol Biotransformation Model for Experiments 1 (Upper Value) and 2 (Lower Value)
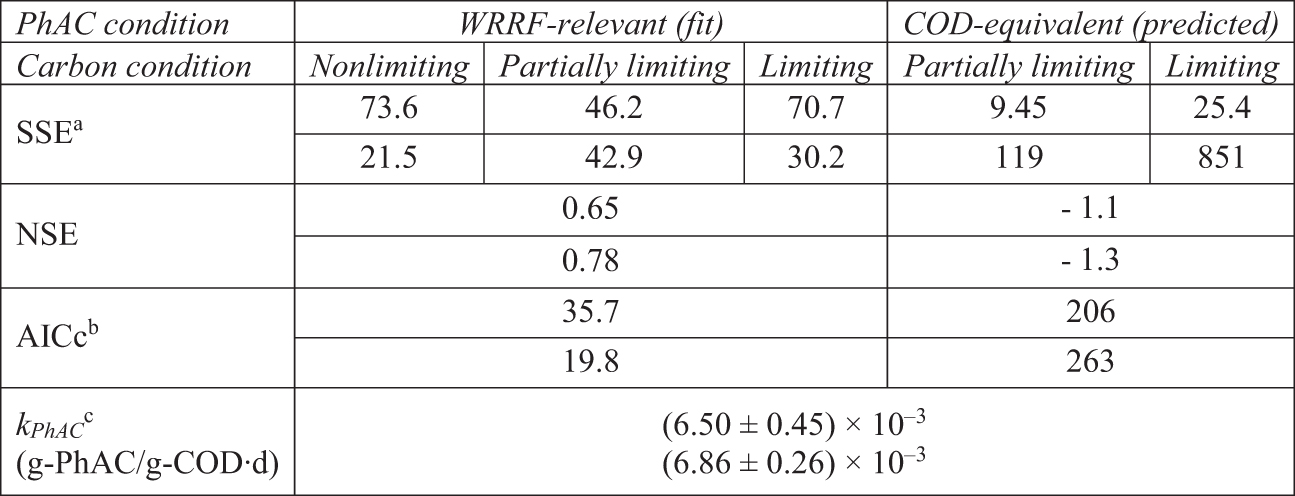
SSE units are (μg/L)2 and (mg/L)2 for WRRF-Relevant and COD-Equivalent conditions, respectively. Note that initial COD-Equivalent conditions had initial atenolol concentrations of 10 and 100 mg/L in Experiments 1 and 2, respectively.
AICc calculated using SSE in units of (μg/L)2.
Value ±95% confidence interval.
Conclusions
Denitrification results suggest electron competition between Nar and Nir based on the slower rates of nitrite reduction that lead to nitrite accumulation. This was also evident in the relatively lower nitrite reduction factors produced from the fits to Experiments 1 and 2. These values are an order of magnitude lower than what would otherwise be assumed when using the model of Kaelin et al. (2009). Atenolol was not found to appreciably influence rates of nitrite or nitrate reduction. Moreover, atenolol was not observed to support complete denitrification over 20 h observation period of these experiments.
Results from modeling Experiment 2 are suggestive of cometabolism, although the value of TPhAC,HET suggest the contribution of growth-linked cometabolism will be limited even when growth rates are high. This, in combination with the lack of evidence that COD:N ratio influenced atenolol biotransformation in our experiments, is suggestive of either endogenous cometabolism or metabolism by a specialist fraction. The results of the direct metabolism model suggest that atenolol biotransformation may be linked to nitrate reduction, although the evidence for conversion during nitrite reduction is not clear. If a specialist fraction is involved, our observation of a limited contribution to atenolol transformation during nitrite reduction may relate to the faster electron transfer rate by Nars. Differentiating these processes may be better accomplished through additional research to observe varying carbon availability effects on microbial community structure and mechanisms through meta-omics analyses. In the meantime, and despite the better AICc of the CPB model, the use of the more simplified atenolol biotransformation model may be adequate for monitoring and forecasting atenolol biotransformation in larger-scale systems.
This finding is consistent with the work of Torresi et al. (2017) who explored microconstituent biotransformation under various carbon dosing conditions in denitrifying MBBRs.
Footnotes
Acknowledgments
The authors gratefully acknowledge early helpful conversation with Drs. Sandeep Sathyamoorthy, Kartik Chandran, and Steven Chapra, as well as with personnel at Environmental Operation Solutions, Inc., who supplied the MicroC used in this work. The authors thank personnel at the anonymous WRRF for their assistance and cooperation. They also thank the anonymous reviewers for their constructive contributions to the article.
Authors' Contributions
A.E.H.: Conceptualization, investigation, methodology, and writing—original draft. C.A.R.: Conceptualization, resources, supervision, and writing—review and editing.
Disclaimer
The opinions, findings, and conclusions or recommendations expressed are those of the authors and do not necessarily reflect the views of the National Science Foundation or Tufts University.
Author Disclosure Statement
The authors declare no conflicts of interest.
Funding Information
Partial funding was provided by the National Science Foundation under Award No. CBET-1438221. Additional support was provided from discretionary resources managed by C.A.R. at Tufts University.
References
Supplementary Material
Please find the following supplemental material available below.
For Open Access articles published under a Creative Commons License, all supplemental material carries the same license as the article it is associated with.
For non-Open Access articles published, all supplemental material carries a non-exclusive license, and permission requests for re-use of supplemental material or any part of supplemental material shall be sent directly to the copyright owner as specified in the copyright notice associated with the article.