
Abstract
The purpose of this study was to assess the effect of a commercial peracetic acid–based disinfectant against spores of Bacillus cereus, to identify the most influential factor for the final number of microorganisms after different disinfection procedures, and to evaluate the nature of the inactivation kinetics. The spores of four different strains of B. cereus (DSM 318, 4312, 4313, and 4384) were treated with five different disinfectant concentrations (0.25%, 0.5%, 1.0%, 1.5%, and 2.0% [w/v]) at three different temperatures (10°C, 15°C, and 20°C) with or without protein load. A higher temperature and PES 15/23 concentration resulted in a higher inactivation. Inactivation of B. cereus strain 4312 was around 2 log10 cycles at 10°C and around 7 log10 at 20°C (conc=1% [w/v] PAA; t=60 min; without protein). The protein load at higher concentrations did not significantly reduce the efficacy of the disinfectant (p>0.05). This article indicates the applicability of the Weibull model to fit the B. cereus disinfectant survival curves. A Monte Carlo simulation was used to carry out a sensitivity analysis, which revealed the most influential factors affecting the final number of microorganisms after the disinfection process.
Introduction
V
Mathematical models describing kinetics of microorganism inactivation by disinfectants can help in improving and optimizing current disinfection methods. A significant systematic deviation of first-order kinetics is observed mainly when mild preservation procedures are used to inactivate microorganisms in food (Cole et al., 1993; Mafart et al., 2002; Pina-Pérez et al., 2009; Xiong et al., 1999). The Weibull distribution is one of the distribution functions used to describe systems with some degree of variability (Fernández et al., 1999; Peleg and Cole, 1998). Furthermore, an important aspect of quantitative microbial risk assessment is reliable estimation of the effect of various process parameters (concentration, temperature, treatment/contact time) on the quantity of microorganisms at the end of the disinfection process.
The present article considers the application of the Weibull distribution to a disinfection process including four Bacillus cereus strains. Kinetic parameters were deduced, and an attempt was made to describe the kinetic parameters as a function of PES 15/23 concentration and treatment temperature. A Monte Carlo simulation followed by a sensitivity analysis was carried out to identify the most influential processing parameter for the final microbial concentration.
Methods
Materials
The commercially available disinfectant PES 15/23 (Bactria GmbH & Co. KG) was composed of PAA (approximately 15%), hydrogen peroxide (approximately 25%), acetic acid, and water. The disinfectant was diluted in water of standardized hardness (17.5 mL [10% CaCl2×6H20] plus 5.0 mL [10.0% MgSO4×7 H2O] plus 3300 mL of distilled water).
Spores of four different strains of B. cereus were tested. The strains DSM 4312 (emetic type), DSM 4313 (diarrheal type), and DSM 4384 (diarrheal type) were toxin-producing strains isolated from foodborne diseases; the strain DSM 318 was isolated from soil.
The neutralization agent contained 3.0% Tween® 80 (8.22187; Merck, Darmstadt, Germany), 0.3% lecithin (27608; Serva, Heidelberg, Germany), 0.1%
Spore suspension
The strains were incubated aerobically on tryptone soy agar (1.05458; Merck) at 37°C±1°C for 10 days. After incubation, the colonies were rinsed off the plates with sodium chloride (0.9% NaCl). The suspension was centrifuged three times for 30 min (at 20°C, 4500 rpm) and washed with sodium chloride. The suspension was heated for 30 min at 70°C, glycerine was added (final concentration of glycerine 7.5%), and the material was frozen and stored at –4°C.
Quantitative suspension test
Tests were carried out following a full factorial design at five levels for disinfectant (0.25%, 0.5%, 1.0%, 1.5%, and 2.0% [w/v]) (DVG, 2011) and three different test temperatures (10°C±1°C, 15°C±1°C, and 20°C±1°C). In order to keep the temperature constant, the trials were carried out in a temperature-controlled water bath (Julabo Labortechnik GmbH, Seelbach, Germany). Each trial was done with and without protein load. The contact times were 0, 5, 30, and 60 min. Each trial was performed in duplicate, and in the plating step the microbial count was determined, obtaining at least four replicates for each trial repetition.
Test with protein load
One milliliter of the spore suspension (approximately 5.0×10⁷ colony forming units [CFU]/mL) and 1.0 mL of the protein agent were mixed, and after 2 min 8.0 mL of the disinfectant test solution was added. After the respective contact time, 1.0 mL of the obtained mix was added to 8.0 mL of neutralizing agent and 1.0 mL of water. The neutralization time was 5 min. After neutralization, 1.0 mL of the neutralized mix was poured on three plates (approximately 0.33 mL per plate) with the addition of liquid tryptone soy agar. If necessary, decimal dilution steps were done before plating. The plates were incubated at 37°C±1°C for 48 h before colonies were counted.
Test without protein load
In contrast to the first test model, 1.0 mL of spore suspension was added to 9.0 mL of disinfectant test solution in the first step. The concentration of the disinfectant (0.25%, 0.5%, 1.0%, 1.5%, and 2.0%) refers to the 10-mL mixture. Therefore, the concentration of the disinfectant test solution was adjusted to the amount (8 or 9 mL) applied. The other test conditions were identical to those described in the previous point.
Controls
Three different controls were included in each experiment in order to negate the sporicidal effect of the experimental conditions or neutralizer, and to validate the neutralizer. For the experimental conditions control, 1.0 mL of protein and 8.0 mL of water of standardized hardness were mixed with 1.0 mL of validation suspension (approximately 1.0×10³ CFU/mL B. cereus test strain), and after 5 min (refers to neutralizing time) CFU were determined. In the neutralizer control (potential sporicidal effect), 8.0 mL of the neutralizing agent and 1.0 mL of distilled water were mixed with the validation suspension, and after 5 min the CFU were determined. To validate the neutralizer, 8.0 mL of the highest concentration of the disinfectant was mixed with 1.0 mL of protein and 1.0 mL of sodium chloride (0.9% NaCl). After the respective contact time, 1.0 mL of the obtained mixture was added to 8.0 mL of the neutralizing agent. After 5 min of neutralizing time, 1.0 mL of the validation suspension was added to the neutralized mixture and incubated for 30 min. After incubation, the CFU were determined. The CFU determination in the controls was done in the same way as described for the main test. The controls were considered valid if the CFU determined after treatment were between 0.5- and 1.5-fold of the original CFU. Controls for the inactivation experiments without protein were done without protein.
Modeling
Primary model
Modeling of survival curves was carried out by using the Weibull distribution function and non-linear regression method (Statgraphics Centurion XV):
where:
a=first decimal reduction time (min),
n=shape parameter,
t=treatment time at the different temperatures (min).
If n<1, tail is described.
If n>1, shoulder is described.
If n=1, first-order kinetics are described.
Secondary model
The relationship between the concentrations of PES 15/23, the treatment temperature and the first decimal reduction time “a” was modeled by means of a multi-parametric regression (Statgraphics Centurion XV) for each strain and protein load condition:
where:
a=first decimal reduction time (min),
α0, α1, and α2 are the model parameters,
T=temperature (°C),
Conc=concentration of PES 15/23 (% weight/volume).
Statistical analysis and model evaluation
An analysis of variance (ANOVA) was used to detect significant differences (p<0.05) between treatment conditions and strain response using Statgraphics® Centurion XV software. A multiple range test was applied to statistically significant factors to determine which level of each factor was significantly different (p<0.05) following a Fisher's least significance difference procedure. The analysis also assessed the goodness of fit of the model by using root mean square error (RMSE).
Monte Carlo simulation and sensitivity analysis
A Monte Carlo simulation involves running the predictive model using randomly sampled values of the model inputs to produce hundreds or even thousands of scenarios (also called iterations or trials) (Poschet et al., 2005). The distribution of the values calculated for the model outcome therefore reflects the probability of the values that could occur (Poschet et al., 2005).
A sensitivity analysis was performed to illustrate the degree to which the uncertainty of the model's output was affected by the uncertainty of the individual variables within the model. The higher the correlation coefficient (r>0.5), the higher the effect that variable has on the model's output. Risk analysis and simulation software version 5.5 (2009) (Palisade Corporation, Ithaca, NY) was used to carry out the model simulation and sensitivity analysis.
Results and Discussion
A neutralization test was carried out to study the nature of the inactivation of different strains of B. cereus at different concentrations of PES 15/23 and treatment temperatures. Figures 1 and 2 show examples of survival curves for the different strains used in the study with and without protein added. The survival curves showed generalized tails (DSM 4312, 318, and 4384) with similar behavior at the different concentrations (0.25%, 0.5%, 1.0%, 1.5%, and 2.0% [w/v]) and temperatures (10°C, 15°C, and 20°C) studied. In some cases there was a shoulder (DSM 4313, 20°C with and without protein; data not shown). As can be seen in Figures 1 and 2, a longer contact period resulted in a higher inactivation. However the effect of PES 15/23 for a given concentration varied with the strain and the temperature at which PES 15/23 was applied.
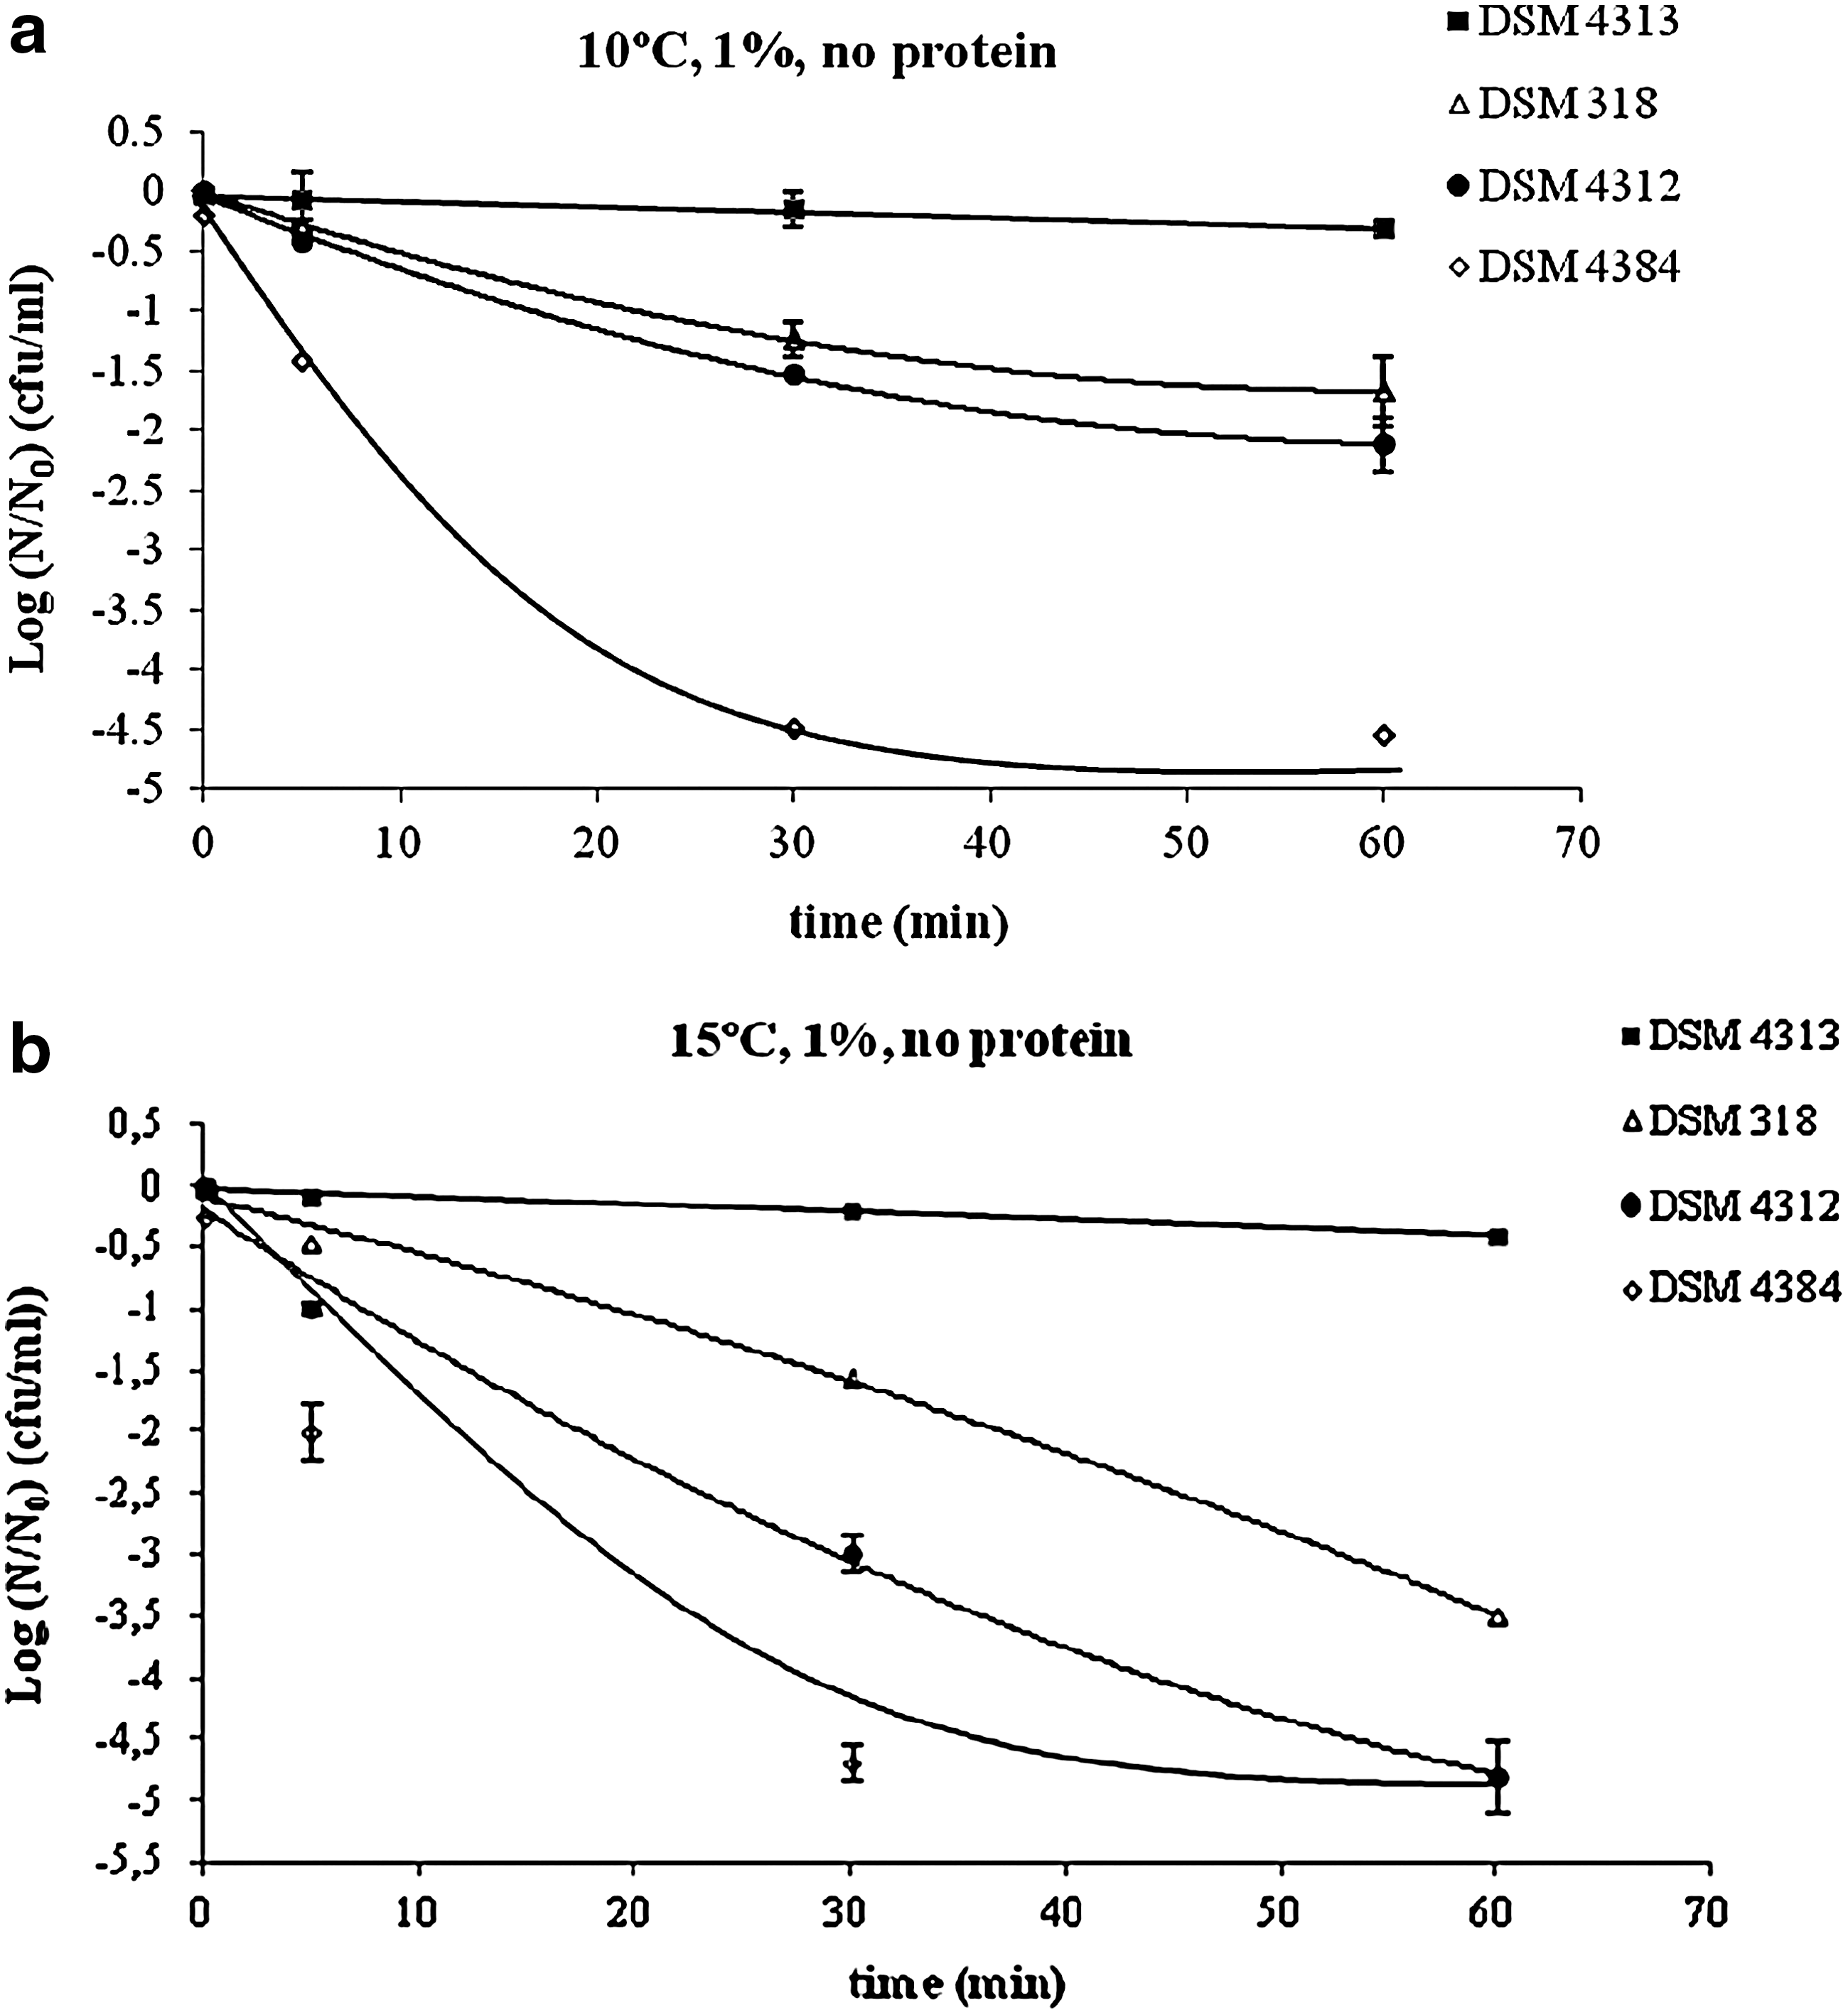
Survival curves fitted by using the Weibull distribution function for experiments without protein load at 10°C
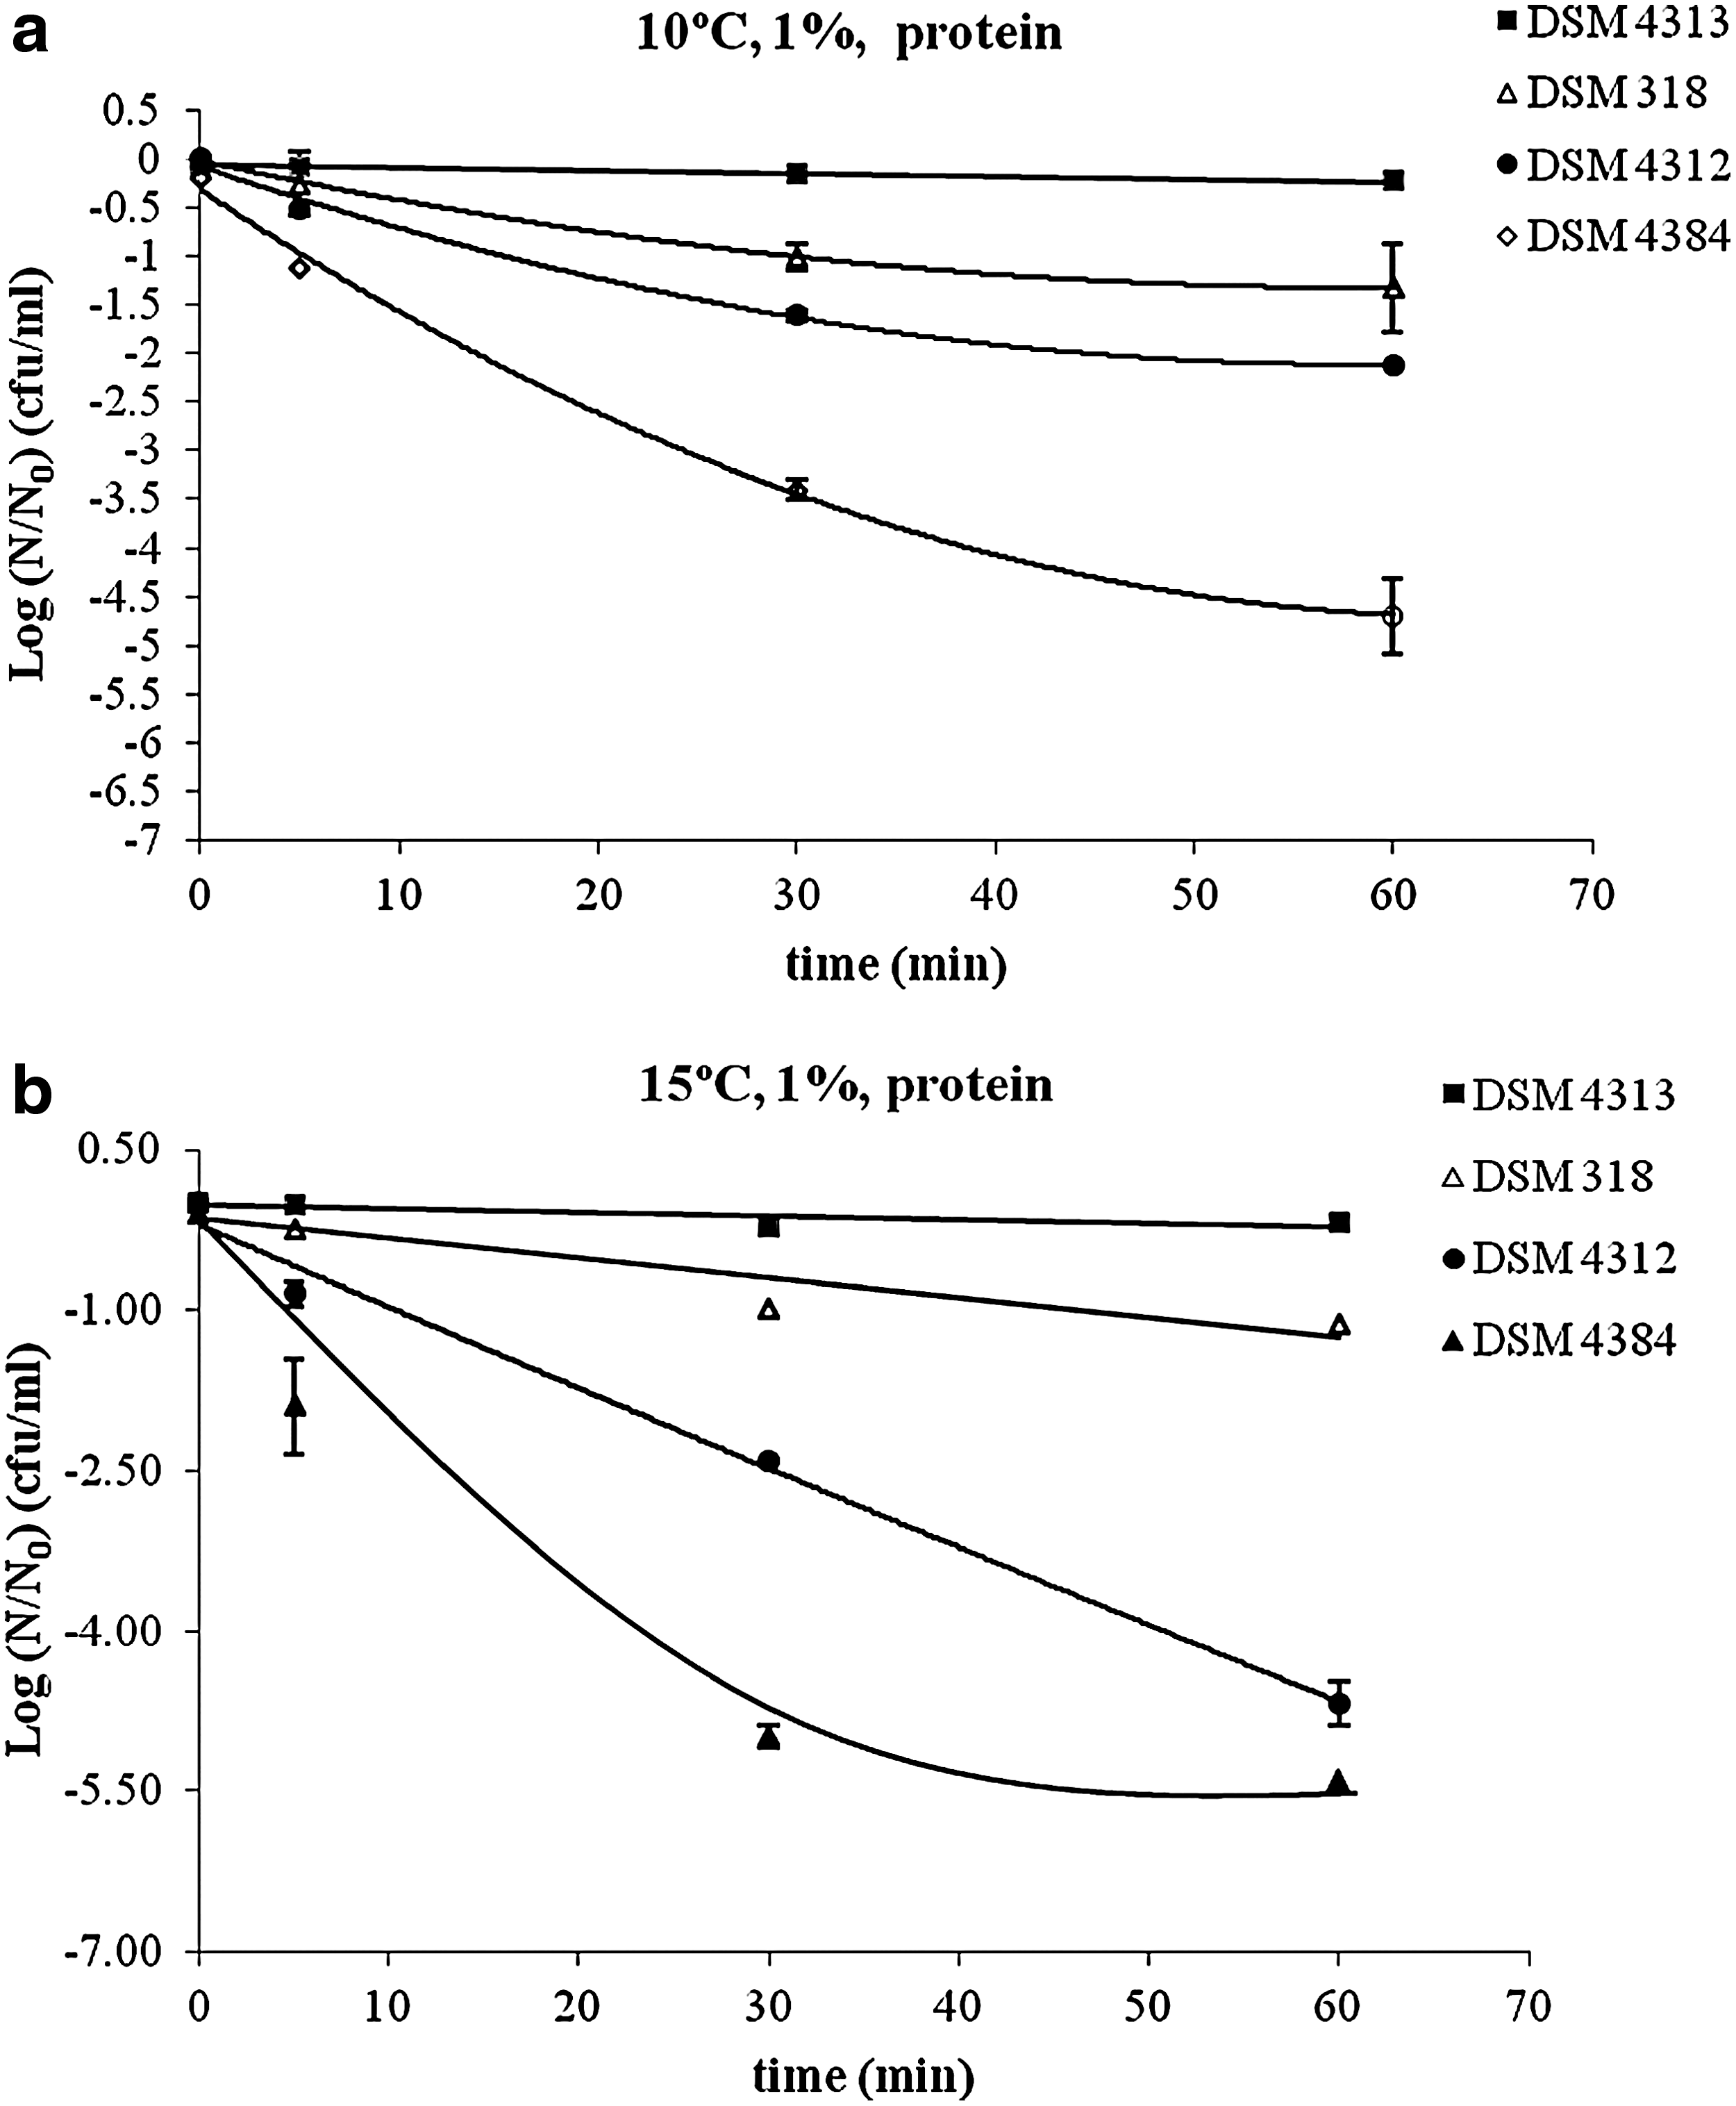
Survival curves fitted by using the Weibull distribution function for experiments with protein load at 10°C
The results indicated that for all the strains the reductions in the number of survivors were highest when PES 15/23 was applied at a temperature of 20°C. The DSM 4313 strain (diarrheal type) was the most resistant, while the DSM 4384 strain (diarrheal type) was the one most susceptible to PES 15/23.
Although the most general approach to describe survival curves after the application of a chemical agent as a microbial decontaminant is to assume first-order kinetics (Chick, 1908; Virto et al., 2006), this is not the most appropriate model when non-linear survival curves are obtained, because it can produce underestimation or overestimation of microbial resistance to the decontaminating agent (Van Boekel, 2002). Several authors (Peleg, 1995; Pina-Pérez et al., 2009; Rodrigo et al., 2003) have used the Weibull distribution function for different non-thermal preservation technologies when the survival curves present either tails or shoulders. Accordingly, to quantify and compare the decontamination activity of PES 15/23 in the presence or absence of protein, the survival curves obtained in this study were fitted to the Weibull distribution function (Eq. (1)) (Figs. 1 and 2) and scale and shape parameters were estimated (Tables 1 and 2). In order to obtain a secondary model based on the scale parameter, one of the main questions to consider in the regression study is, as Couvert et al. point out, the independence of the model parameters. In this regard, there are several relevant reported thermal inactivation studies which describe the influence of environmental factors, such as temperature and pH, on Weibull model shape and scale parameters (Couvert et al., 1999, 2005; Fernández et al., 2002; Van Boekel, 2002). In the present study, the results of a two-factor ANOVA confirmed that the n values for different combinations of temperature and PES 15/23 concentration treatments were not statistically different for the strains studied. In this case, an average value for the shape parameter n (DSM 318 [n=0.644]; DSM 4312 [n=0.596]; DSM 4313 [n=0.997]; and DSM 4384 [n=0.492]) (Fig. 3) can be used in further calculations. In order to build a simplified Weibull model using the n average value, only strains isolated from food poisoning incidents were used (DSM 4312 [serotype 1=emetic] and DSM 4313 [serotype 2=diarrheal]). According to Couvert et al. (2005), a new set of scale parameters were re-estimated for these two strains (Tables 3 and 4), considering the n parameter constant and equal to the average value. As can be seen in the tables, the percentage discrepancy parameter (% Df) ranged between 0% and 30%. This is similar to the Df range obtained by Fernández et al. (2002) related to scale re-parameterization to describe thermal inactivation of Bacillus cereus spores in vegetable substrate using the Weibull model, and to the one reported by Baranyi et al. (1999). Like the original scale parameter values, the newly obtained ones were affected by changes in the environmental treatment conditions, decreasing with both temperature and PES 15/23 concentration increase. The effect of PES 15/23 concentration and application temperature on the decimal logarithm of the new set of scale parameters (log10 (a)), calculated assuming constant n values, for the two B. cereus strains (emetic and diarrheal) was studied using a response surface methodology. Table 5 shows the constant parameters (α0, α1, and α2) according to Equation 2 and the accuracy of the fit at different treatment conditions. Figures 4 and 5 show different examples of the dependency of the decimal logarithm of the new re-parameterized Weibull scale parameter on temperature and concentration, indicating the sensitivity of this parameter to treatment conditions. It can be seen that increases in temperature from 10°C to 20°C reduce the value of the “a” parameter 10 times (DSM 4312 without protein). In Figure 4, it can be seen that protein substrate addition reduces “a” parameter sensitivity. On the other hand, the sensitivity of the “a” parameter to the [0.25– -2%] PES 15/23 concentration is dependent on the B. cereus strain, which is higher for DSM 4312 (Fig. 5a). Figure 5a indicates that an increase in the addition of PES 15/23 from 0.25% (w/v) to 2% (w/v) reduces the “a” parameter value by around 3 log10 cycles.
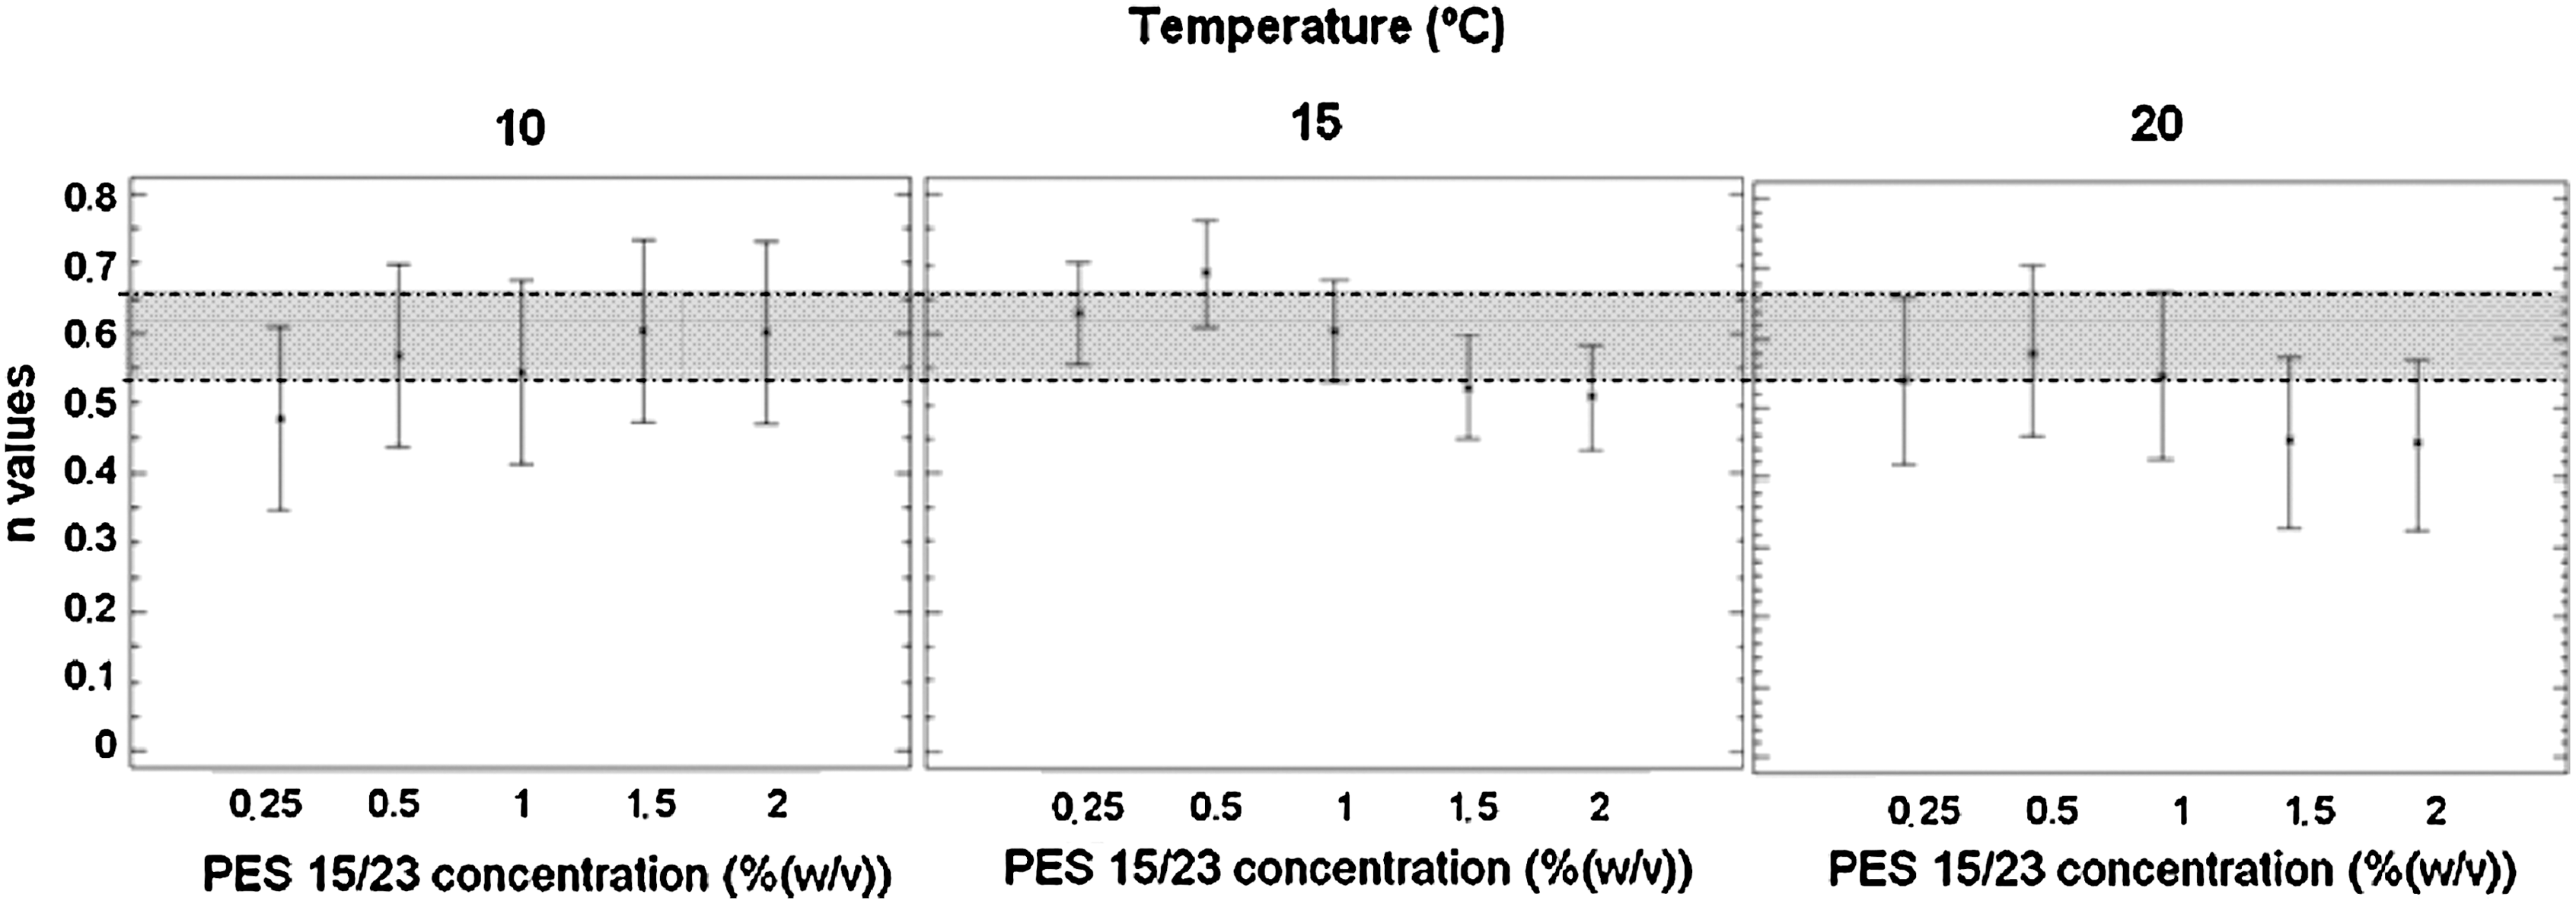
n parameters and their 95% confidence interval obtained for the various combinations of temperature and PES 15/23 concentration tested for DSM 4312 by fitting the Weibull function (Eq. (1)) to the experimental data. The shaded area represents the 95% confidence interval of the mean n value (0.596).
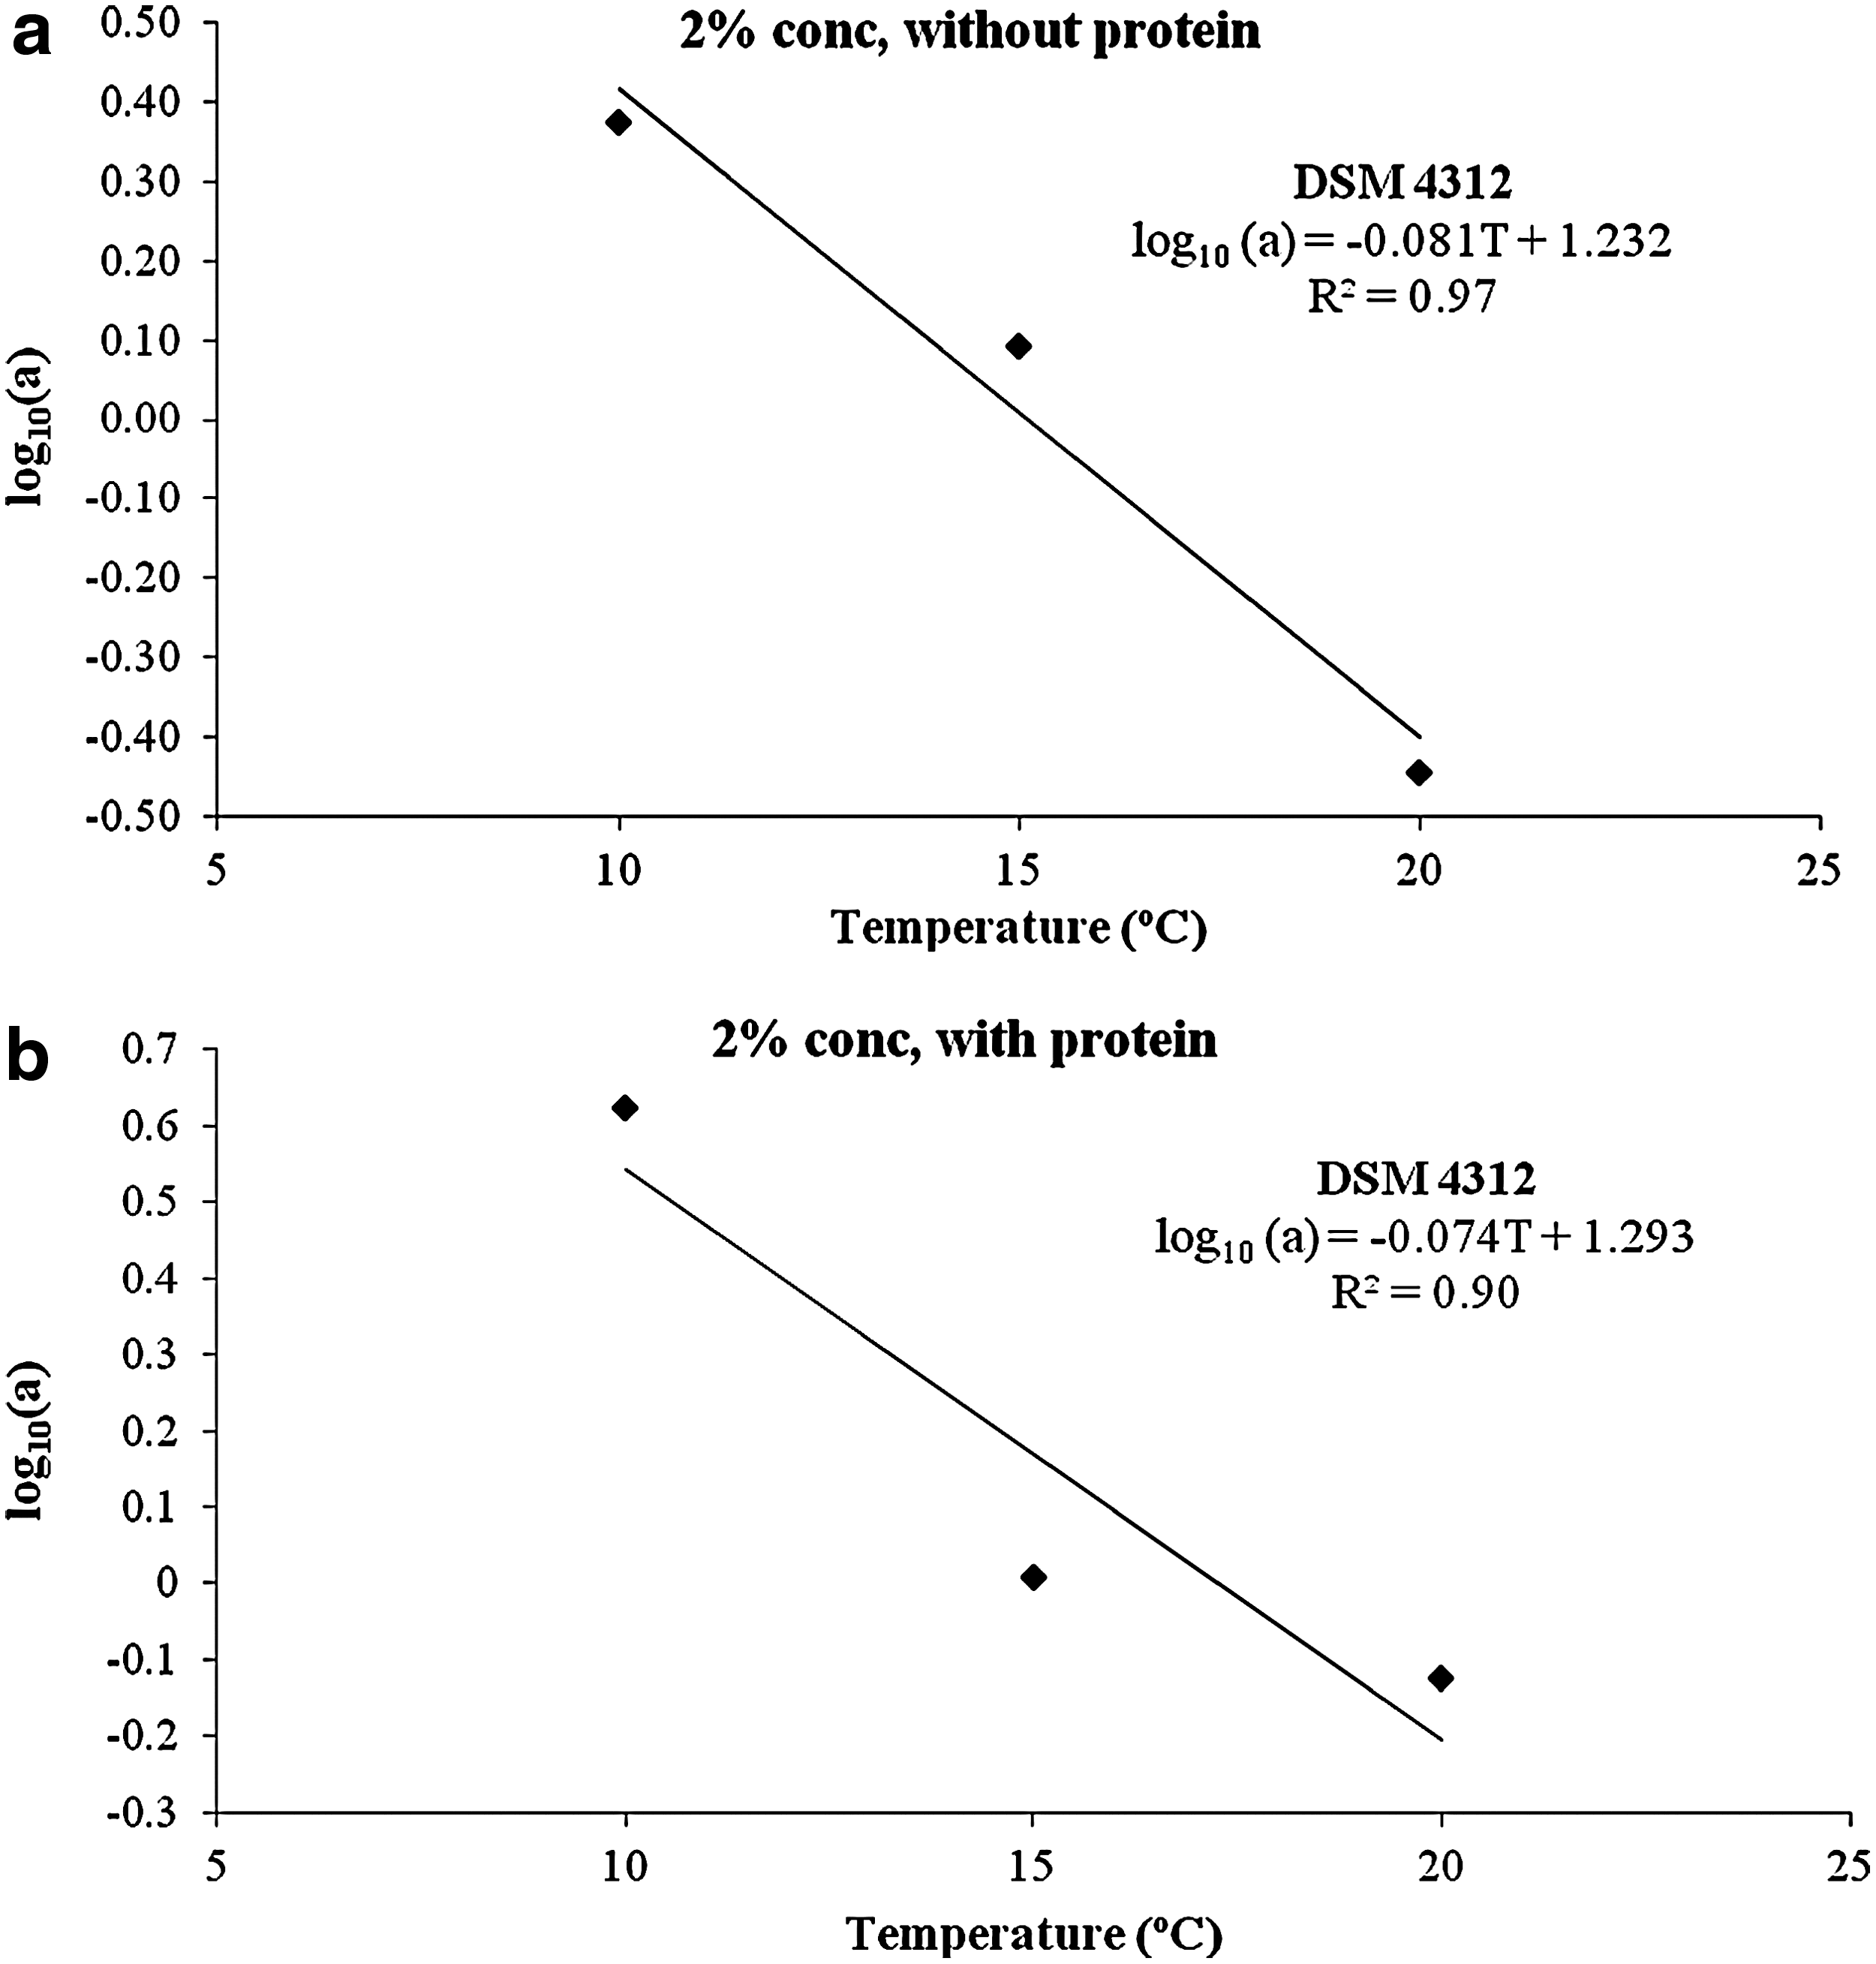
Sensitivity relationship of decimal log of the Weibull scale parameter (log10 (a)) with temperature for DSM 4312 at 2% (w/v) PES 15/23 without protein addition
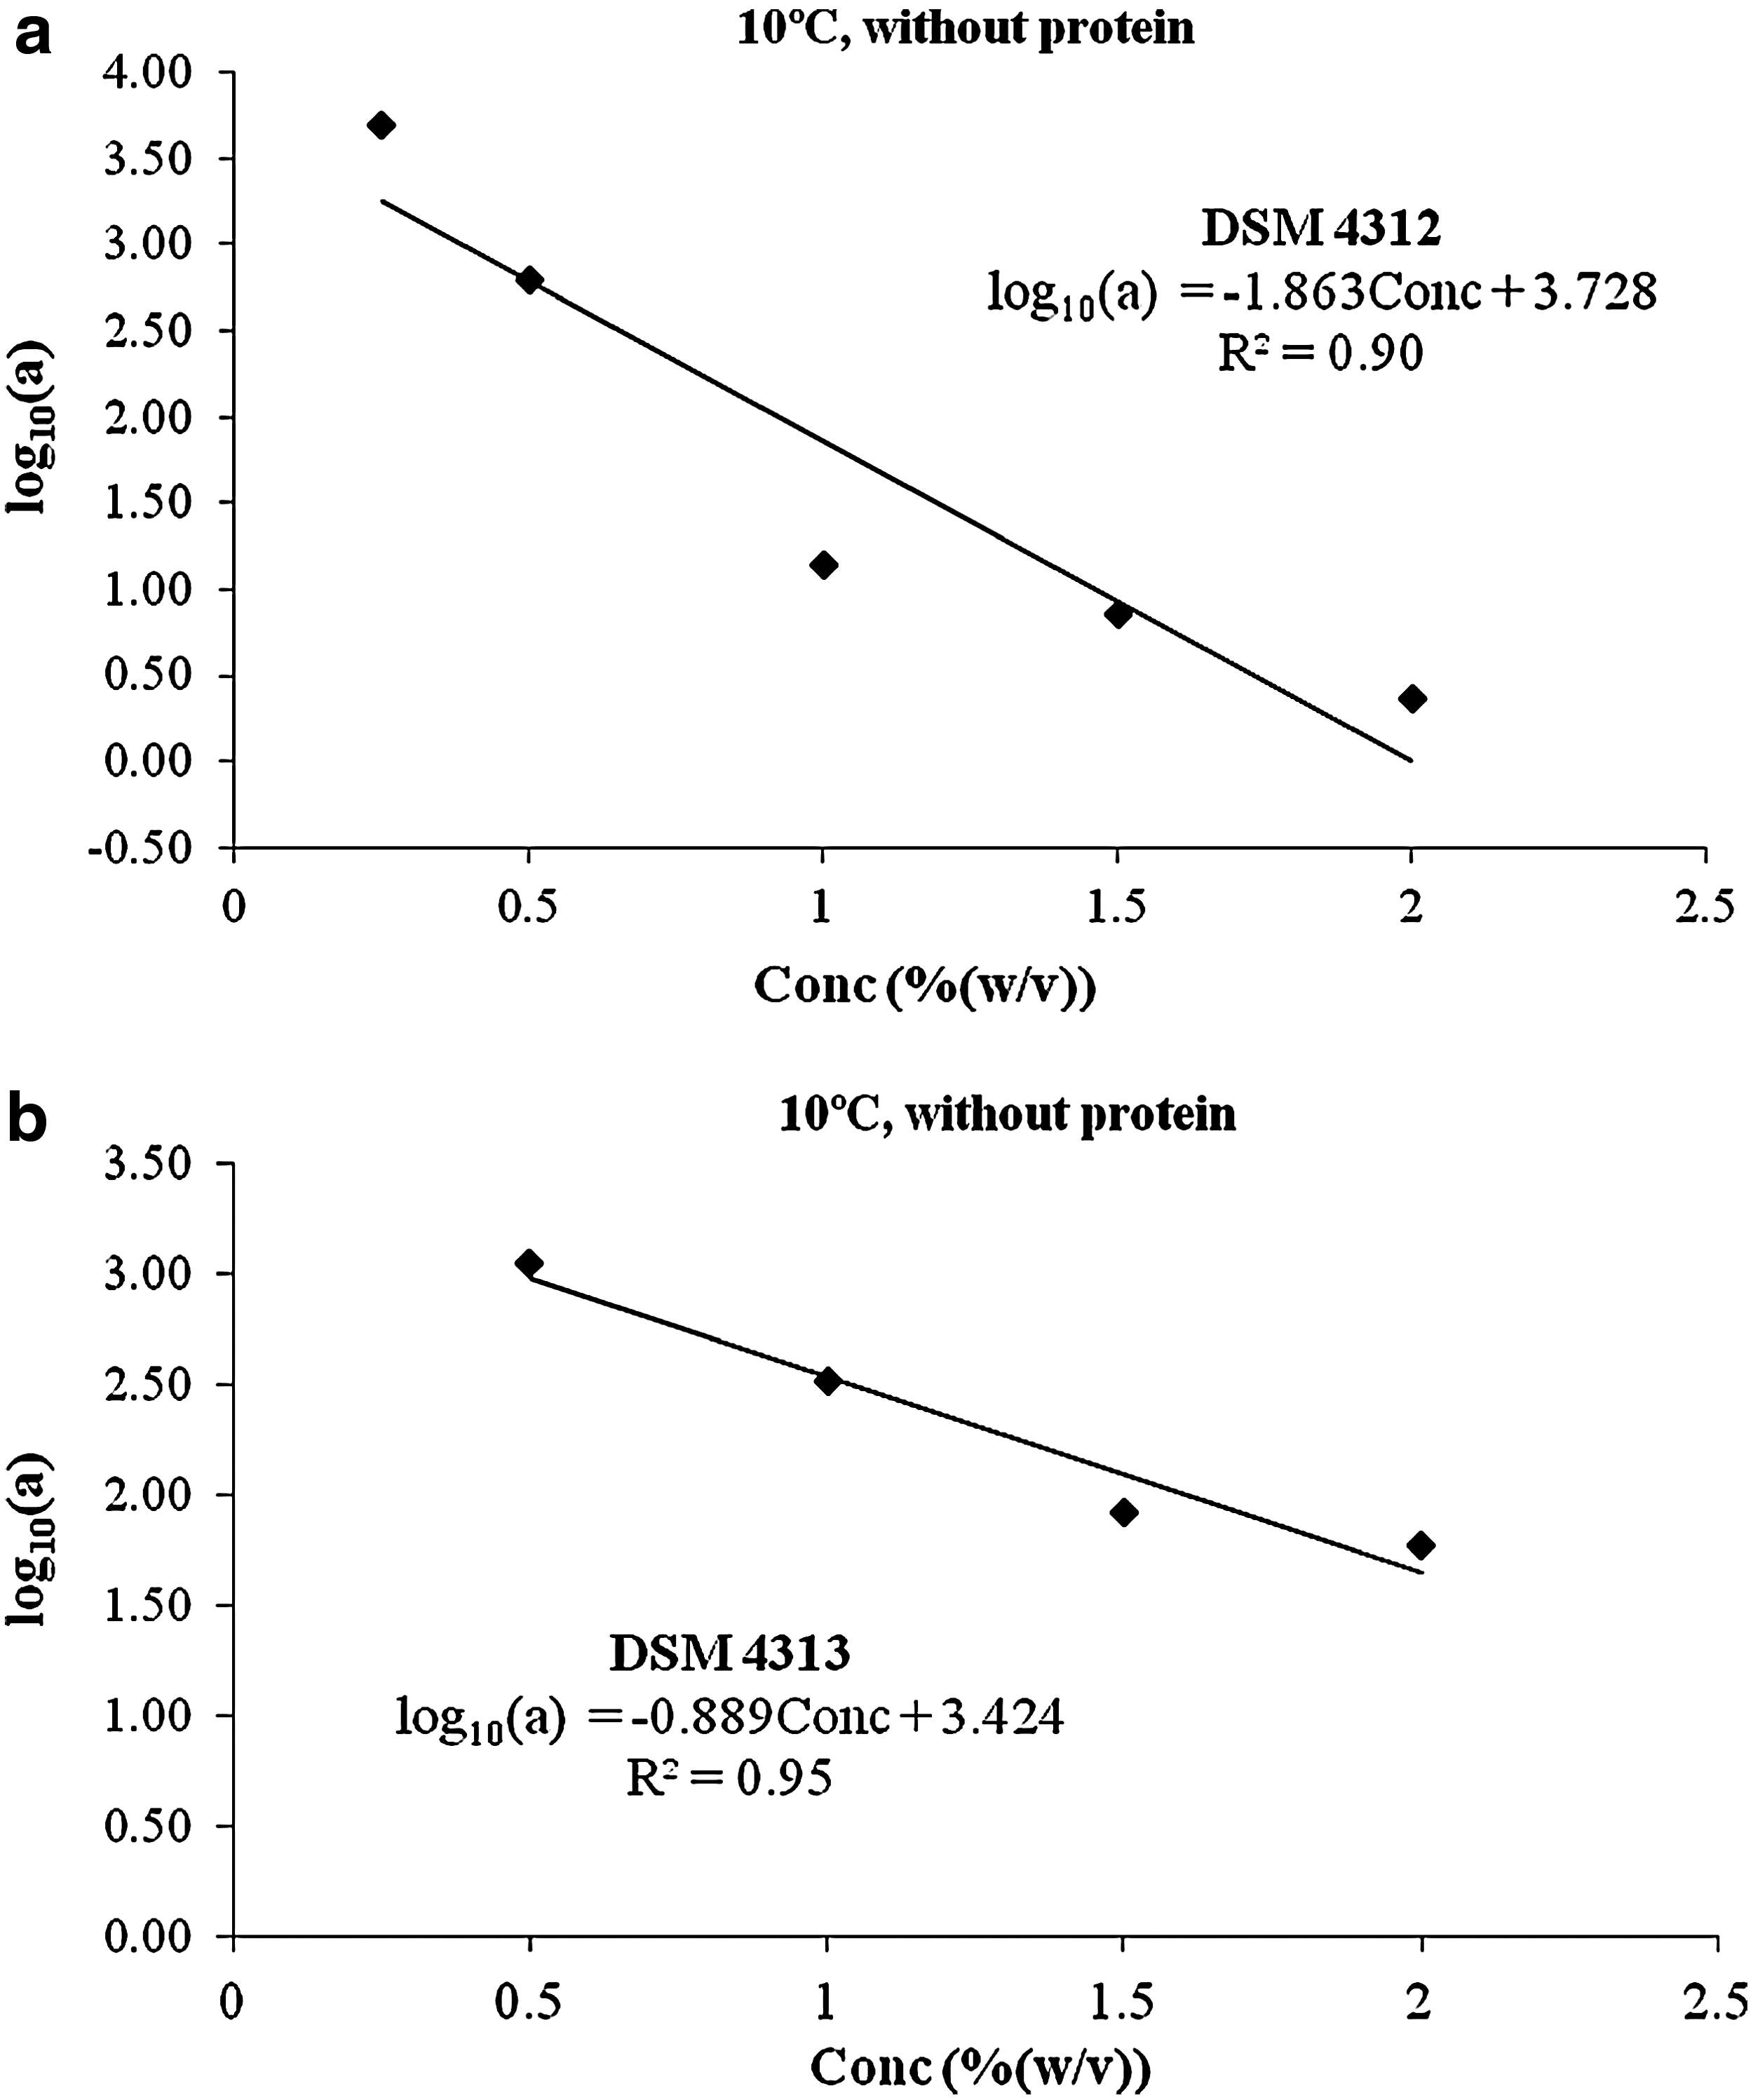
Sensitivity relationship of decimal log of the Weibull scale parameter (log10 (a)) with PES 15/23 concentration for DSM 4312
RMSE, root mean square error; n/c, no convergence; b/d, below detection limit.
RMSE, root mean square error; n/c, no convergence; b/d, below detection limit.
% Df, “percentage discrepancy” between the model and observations (Baranyi et al., 1999).
% Df, “percentage discrepancy” between the model and observations (Baranyi et al., 1999).
RMSE, root mean square error.
A Monte Carlo simulation was used in the present study in order to obtain the most probable final load of B. cereus (strains 4312 and 4313) and perform a sensitivity analysis to consider different treatment combinations of PES 15/23 concentration, contact time, and temperature. The sensitivity analysis reveals the factors that have the greatest influence on the final B. cereus load, by means of the coefficients of correlation between parameters N 0, T, and PES 15/23 conc (% [w/v]) and the final number of microorganisms (output; Log (N), CFU/mL) after applying the disinfection process. The input values Log N0 and log10 (a) were introduced as probability distributions. The results of the simulation and their associated probability of occurrence are presented in Table 6. These values (most probable Log (N), 5% percentile and 95% percentile) describe how probable the final B. cereus load is, providing information about the distribution of outcomes.
m.p. Log (N) simulated: Most probable final load (log (N)) provided by Monte Carlo simulation.
The sensitivity analysis indicates that temperature (correlation coefficient 0.86– -0.92]) and PES 15/23 concentration (correlation coefficient [0.75– -0.45]) were the most influential process parameters. It is worth pointing out that temperature modified the efficacy of PES 15/23 (Abughararah, 1994; Sampedro et al., 2006; Severin et al., 1983). At low temperatures and non-aggressive conditions (short time and low concentration), the most important parameter influencing the final number of microorganisms was the initial contamination level (correlation coefficient=0.95) (Ferrer et al., 2007; Pina-Pérez et al., 2010). The disinfectant testing was done in accordance with the guidelines of the German Veterinarian Association (DVG, 2011) and the European Standard (DIN, 2002). Therefore, cell debris was not removed after producing the spore suspension. It is important to mention that cell debris might trigger germination (Caipo et al., 2002). A possible reason for such behavior is that the disinfectant may have a low activity against microorganisms at low temperatures, reflected in lower death rates in the population, and thus the final number would depend almost exclusively on the hygiene conditions before treatment.
For intermediate treatment temperatures, the most important factor determining the final number of microorganisms was the initial contamination level (correlation coefficient=0.85), but the treatment temperature used also had an important impact on the final load (correlation coefficient=–0.60). Finally, for the most aggressive treatments, temperature (correlation coefficient=–0.92) was the most influential factor affecting the final load, followed by the PES 15/23 concentration (correlation coefficient=–0.75), while the influence of the initial load was almost negligible.
The results of the present study demonstrate that the diarrheal strain (DSM 4313) is more resistant to PES 15/23 than the emetic one (DSM 4312), regardless of the presence of protein. This means that the diarrheal strain should be considered as the target in the design of proper disinfection procedures using PES 15/23.
Conclusion
The predictive results presented here are important from the point of view of process optimization in order to produce safer foods, to recognize which are the most influential factors in the different steps of the disinfection process in order to establish the most appropriate combination, or to take the most suitable hygiene measures and thus produce food that meets the performance objectives necessary in a food hygiene concept. In the present study, the Weibull distribution function showed its ability to deal with non-log-linear curves resulting from disinfectant treatments. The Monte Carlo simulation showed a great potential for producing predictions that could be used by industrial managers in deciding the most appropriate strategy in the process of disinfecting food facilities or equipment.
Footnotes
Disclosure Statement
No competing financial interests exist.