
Abstract
Traditional experimental methods for determining antibiotic resistance phenotypes (ARPs) and minimum inhibitory concentrations (MICs) in bacteria are laborious and time consuming. This study aims to explore the potential of whole-genome sequencing data combined with machine learning models for robustly predicting ARPs and MICs in Salmonella. Using a training set of 6394 Salmonella genomes alongside antimicrobial susceptibility testing results, we built two machine learning (ML) predictive models based on the pan-genome and pan-resistome. Each model was implemented using three algorithms: random forest, extreme gradient boosting (XGB), and convolutional neural network. Among them, XGB achieved the highest overall accuracy, with the pan-genome and pan-resistome models accurately predicting ARPs (98.51% and 97.77%) and MICs (81.42% and 78.99%) for 15 commonly used antibiotics. Feature extraction from pan-genome and pan-resistome data effectively reduced computational complexity and significantly decreased computation time. Notably, fewer than 10 key genomic features, often linked to known resistance or mobile genes, were sufficient for robust predictions for each antibiotic. This study also identified challenges, including imbalanced resistance classes and imprecise MIC measurements, which impacted prediction accuracy. These findings highlight the importance of using multiple evaluation metrics to assess model performance comprehensively. Overall, our findings demonstrated that ML, utilizing pan-genome or pan-resistome features, was highly effective in predicting antibiotic resistance and identifying correlated genetic features in Salmonella. This approach holds great potential to supplement conventional culture-based methods for routine surveillance of antibiotic-resistant bacteria.
Salmonella is the leading cause of foodborne illnesses, hospitalizations, and deaths among major pathogens (Mkangara, 2023). The emergence and prevalence of antibiotic resistance genes (ARGs) in Salmonella and other pathogens has rendered many antibiotics ineffective (Zagaliotis et al., 2022). Conventional culture-based methods for antibiotic susceptibility testing are labor intensive and time consuming, making them unsuitable for large-scale or timely surveillance. The growing availability of genomic data and resistance databases enables antibiotic resistance prediction directly from whole-genome sequencing (WGS) data, complementing traditional methods.
Strategies for predicting antibiotic resistance from WGS have been reported in several pathogens including Mycobacterium tuberculosis (Bradley et al., 2015; Yang et al., 2019), Staphylococcus aureus (Bradley et al., 2015; Gordon et al., 2014), Escherichia coli (Her and Wu, 2018; Moradigaravand et al., 2018; Stoesser et al., 2013), Klebsiella pneumoniae (Nguyen et al., 2018; Stoesser et al., 2013), Neisseria gonorrhoeae (Eyre et al., 2017), and Salmonella (Maguire et al., 2019; Nguyen et al., 2019). The most frequently used approach for prediction has been the rule-based method (Camacho et al., 2009), which relies on the known genetic determinants of antibiotic resistance. However, this approach is incapable of identifying unknown resistance mechanisms. In the past decade, machine learning (ML) algorithms have increasingly been used to predict antibiotic resistance directly from WGS data. Some methods focus on distinguishing antibiotic resistance phenotypes (ARPs) (Bradley et al., 2015; Gordon et al., 2014; Her., 2018; Maguire et al., 2019; Moradigaravand et al., 2018; Stoesser et al., 2013; Yang et al., 2019), while others aim to predict minimum inhibitory concentrations (MICs) (Eyre et al., 2017; Nguyen et al., 2018, 2019).
A major challenge in using ML for antibiotic resistance prediction is creating large-scale training sets from WGS data. Some studies have successfully used short nucleotide k-mers as features and laboratory-derived ARPs or MICs as labels to build ML models (Maguire et al., 2019; Nguyen et al., 2018, 2019). K-mer counting reduces preprocessing and includes both coding and noncoding region data, but it is computationally expensive and memory intensive. To address this, a novel pan-genome approach has been introduced to predict ARPs (Her and Wu, 2018; Moradigaravand et al., 2018), which uses single nucleotide polymorphisms (SNPs) from core genomes and accessory gene presence or absence to represent pan-genomic diversity. This method offers a computationally more efficient alternative to k-mer counting. In addition, we recently proposed the concept of pan-resistome (He et al., 2020), which built upon the ideas of the pan-genome (Tettelin et al., 2005) and resistome (Wright, 2007). The pan-resistome includes all ARGs in a given environment or bacterial group, primarily consisting of latent ARGs (Inda-Díaz et al., 2023). It has been used to study host adaptability and antibiotic resistance (Marques et al., 2022) and to identify transferable ARGs and elements (Andrade-Oliveira et al., 2020; Decano et al., 2021). However, the predictive power of the pan-genome for MICs and the pan-resistome for both ARPs and MICs remains unconfirmed.
The aim of this study is to identify the optimal model and determine the minimum set of key genomic features necessary for accurate and robust predictions of ARPs and MICs. In addition, various factors involved in model development were assessed to test their influence on prediction success. Our approach builds on pan-resistome and ML techniques, offering new potential for improving antibiotic resistance surveillance and management.
Materials and Methods
Metadata collection and data processing
Metadata of 14,376 Salmonella genome sequences and 1,32,058 antimicrobial susceptibility testing results collected from 1952 to 2019 in the PATRIC (https://www.patricbrc.org/) (Wattam et al., 2017) were downloaded for this study. ARPs were defined as susceptible (S), intermediate (I), or resistant (R) and MICs were collected for the top 15 antibiotics (ranked by counts) used for Salmonella in the PATRIC. To standardize MIC values and eliminate biases, we retained only those tested with “broth microdilution” or “MIC” methods and excluded strains without susceptibility data or genome sequences. After removing these unqualified data, a total of 6394 Salmonella genomes were remained and each of them possessed at least one ARP or MIC result. All MIC measurement signs were deleted, and the float values were kept unchanged except for the signs without “=” as previously described (Nguyen et al., 2018); for example, an MIC would be recorded as 2a if the MIC was >a mg/L, a/2 for <a mg/L and a for ≤a, ≥a or =a mg/L. ARPs were re-annotated based on the resized MICs and Clinical and Laboratory Standard Institute’s guidelines.
Feature extraction
To evaluate the performance of various genomic predictors, both genomes and resistomes (annotated via the CARD) [Jia et al., 2017]) were used for feature extraction. SNPs of core genomes and the presence or absence of accessory genes were selected as concise genomic features. Orthologous gene clusters were generated using Roary (Page et al., 2015; Tettelin et al., 2005) based on pan-genome classification. Clusters present in >99% of genomes were categorized as soft-core genomes. Core genome alignments were performed using MAFFT (Katoh and Standley, 2014). SNP extraction and matrix construction were performed using FastSNP (https://github.com/ZHY-soure/SalAmrPred). Each of the A, C, G, T and missing nucleotide in SNPs was one-hot encoded as follows: [1, 0, 0, 0], [0, 1, 0, 0], [0, 0, 1, 0], [0, 0, 0, 1], and [0, 0, 0, 0], respectively. For the accessory genomes, the presence or absence of a gene was encoded as [1, 1, 1, 1] and [0, 0, 0, 0]. Feature matrices in the shape of [ngenomes , (nSNPs + naccessory genes ), 4] were then constructed for both genomic and resistomic data.
A total of 80,667 orthologous clusters were identified from gene coding sequences, with 3,749 classified as soft-core genomes and the rest as accessory. In addition, 132 orthologous ARG clusters, including 17 core clusters, were identified from 1,95,736 ARGs. In total, 1,72,882 SNPs were detected in core genomes and 676 in core resistomes. These SNPs, along with the presence or absence of accessory genes, were one-hot encoded into matrices of [6394, 249800, 4] for genomes and [6394, 808, 4] for resistomes. Metadata tables for genomes and antimicrobial susceptibility results are available on GitHub (https://github.com/ZHY-soure/SalAmrPred).
Model construction
We employed three ML algorithms for model construction: random forest (RF) (Hu and Szymczak, 2023), extreme gradient boosting (XGB) (Chen and Guestrin, 2016), and a convolutional neural network (CNN) (Quang and Xie, 2016)). RF and XGB were implemented using Python’s scikit-learn and XGBoost packages, with decision trees as the base learners and default hyperparameters. For ARP prediction, we performed binary classification to distinguish between susceptible and resistant phenotypes, excluding intermediate ones. The CNN was implemented using Keras with TensorFlow on an RTX2080Ti GPU, with fine-tuned layer parameters to address memory limitations. The model structure included three Conv1d layers, Maxpool1d layers, and Dense layers. MaxPool1d was not applied to models using resistomes due to smaller matrices. All scripts are available at https://github.com/ZHY-soure/SalAmrPred.
Performance evaluation
A fivefold cross validation was used for model evaluation. The dataset was randomly split into training (80%) and test (20%) sets, with the cross-validation process repeated multiple times to ensure robust results. The metrics for evaluation included
Feature importance analysis
For each task, the best-performing model was used to extract key genomic features. Features with weights >0 in the respective models were deemed important. For each antibiotic, the minimum number of genomic features required for accurate prediction was determined. Features were ranked by their importance, and models were constructed using the top n features (from 0 to 200, incrementing by 1). Key features identified through this process were reannotated using the CARD via BLASTn, with results visualized in comparison matrices. The overall workflow is depicted in Supplementary Figure S1.
Results and Discussion
XGB classifier performance
The XGB classifier was selected due to its superior prediction accuracy. As shown in Figure 1, the XGB classifier outperformed others in most antimicrobial ARP predictions, completing 27 of 30 tasks with an accuracy of 98.51% (95% confidence interval [CI]: 97.84–99.18%). The average metric scores with their respective 95% CI for each algorithm and antibiotic were presented in Supplementary Tables S1 and S2. Previous studies show that ensemble methods, especially decision trees, outperform linear models due to their scalability and built-in feature selection (Moradigaravand et al., 2018; Nguyen et al., 2018, 2019). Consistently, the gradient boosting algorithm excelled in our study (Fig. 1). However, the CNN model did not achieve better accuracy, F1-scores, and AUROCs than that of XGB model (Fig. 1). Likewise, neural networks have not shown substantial improvements in other studies (Moradigaravand et al., 2018), suggesting that complex models do not necessarily outperform simpler ones in ARG prediction.
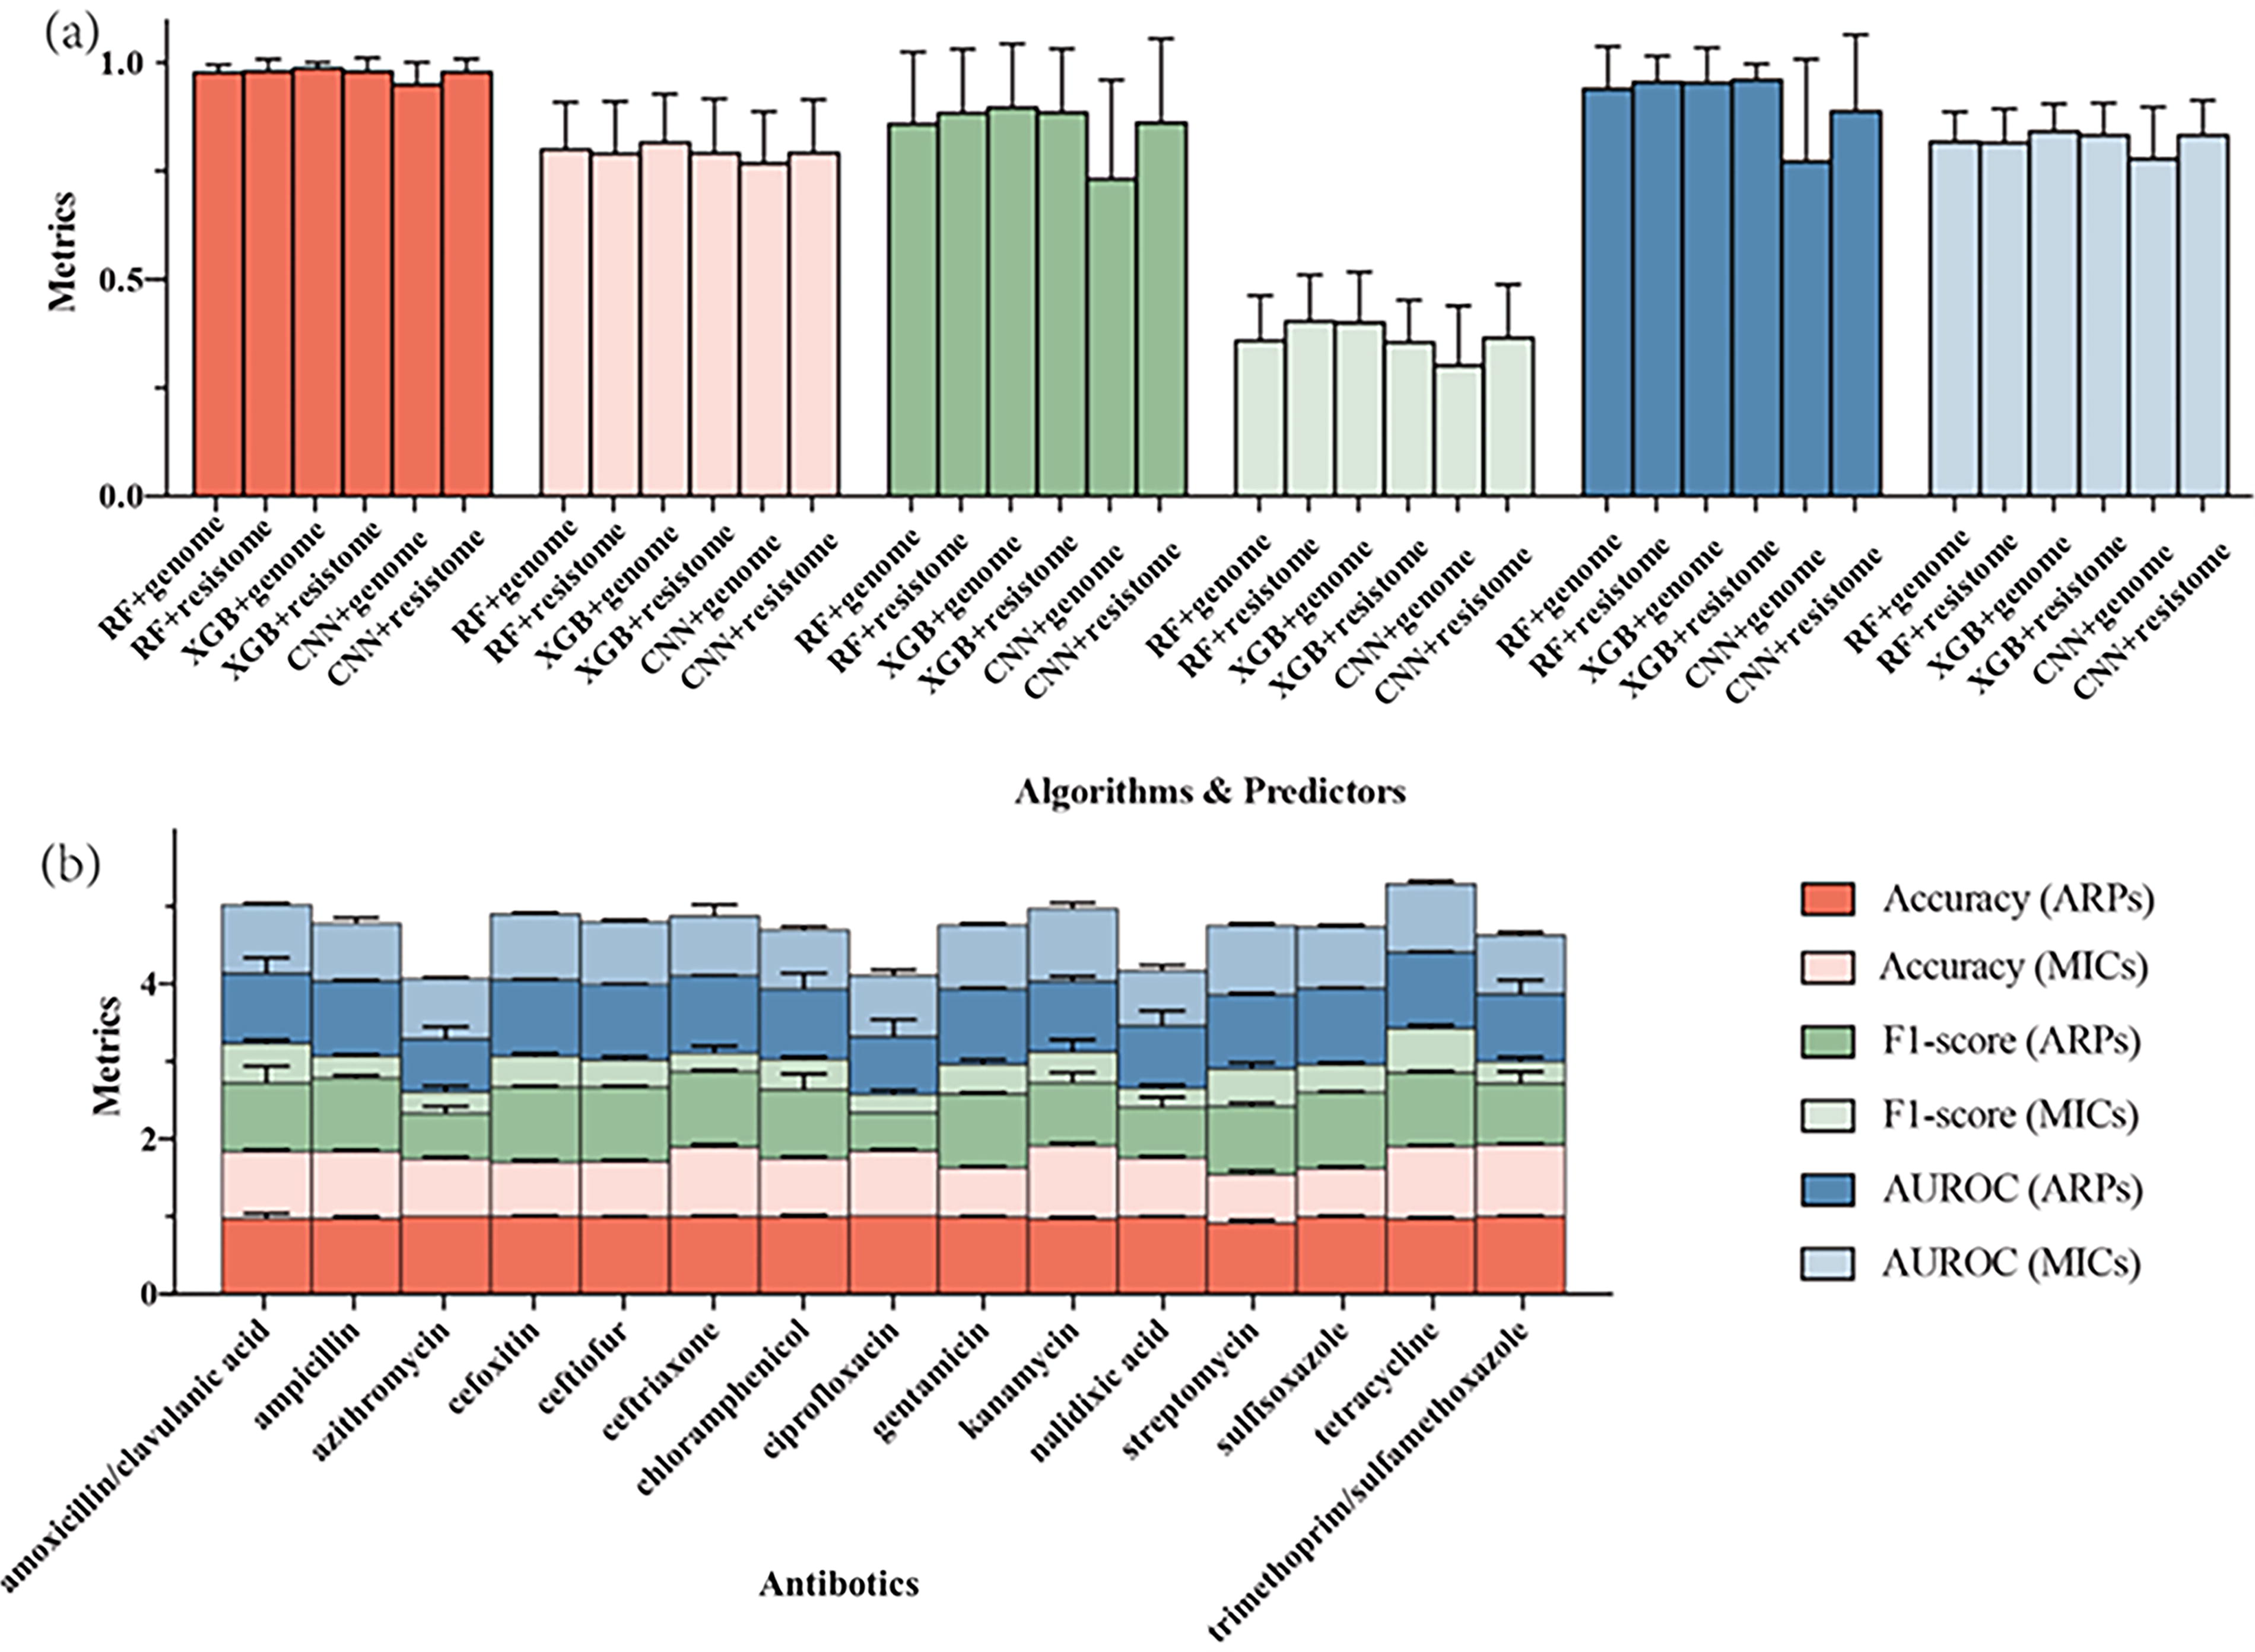
The overall metrics for individual prediction models or antibiotics.
The XGB classifier using genomes as predictors for MICs delivered the best performance in 21 out of 30 tasks, achieving an overall accuracy of 81.42% (95% CI: 75.34–81.50%) (Fig. 1). It was reported in prior studies that lower overall accuracies for predicting MICs, including 69% for K. pneumoniae (Moradigaravand et al., 2018), 53% for N. gonorrhoeae (Eyre et al., 2017), and 60% for Salmonella (Nguyen et al., 2019), were, respectively, achieved. The improved overall accuracy for MIC predictions in our study may stem from the larger Salmonella genome dataset used for training, making it one of the largest MIC prediction models to date. Previous studies struggled with small datasets (Maguire et al., 2019). Another factor could be our use of classifiers for MIC predictions, categorizing MIC levels into discrete classes, rather than treating them as continuous variables as in earlier regression models (Eyre et al., 2017; Moradigaravand et al., 2018; Nguyen et al., 2019). Regression models face challenges with imprecise, imbalanced MIC values, reducing accuracy. The ±1 doubling dilution factor used in past studies improves accuracy but does not fully address MIC measurement issues, such as the increased error for higher values and the use of inequalities for extreme MICs. Thus, classifiers may be better suited for MIC predictions than regressors.
Pan-genomic feature extraction was computationally light weight
The pan-genome approach was utilized as the feature extraction method for E. coli in previous studies (Her and Wu, 2018; Moradigaravand et al., 2018) and for Salmonella in this study. The pan-genome feature extraction method condensed genomic information into a significantly smaller matrix, requiring only 600 GB of raw access memory (RAM) to process 6394 genomes for training the XGB model. This is a considerable improvement over the k-mer method, which necessitated 1.5 TB of RAM for 4500 genomes (Nguyen et al., 2019). Notably, it took <1 h to train an XGB model in this study. Thus, the pan-genome method is particularly advantageous for managing large-scale data with limited computational resources and for producing quicker prediction results.
It was revealed by evaluation metrics for the XGB models that there were no significant differences between using genome or resistome predictors (Fig. 1). The models based on resistomes achieved an overall accuracy of 97.77% (95% CI: 96.16–99.38%) and F1-score of 0.88 (95% CI: 0.80–0.96) for ARPs, while for MICs, the accuracy was 78.99% (95% CI: 72.15%−85.83%) with an F1-score of 0.35 (95% CI: 0.30–0.41). Compared with the genome-based models, which required 600 GB of RAM and close to 1 h for training, models using resistomes took only 10 min and under 100 GB of RAM, yet delivered similar performance levels. Our findings indicate that known ARGs suffice for the rapid and accurate prediction of most antibiotic phenotypes. As bacteria evolve, new ARGs and genomic features may emerge, requiring a dynamic, updated list of predictors based on experimental results and ML-mined genomic features.
Impact of imbalanced resistance classes and imprecise MIC values on the accuracy of predictions
In this study, we employed unweighted F1-score and AUROC as additional evaluation metrics due to the potential for highly imbalanced ARP classes to skew accuracy when weighted by data. For instance, the models predicting ARPs for azithromycin (S: R = 3123:24) achieved a high average accuracy of 99.29% (95% CI: 99.20–99.38%), yet the F1-score and AUROC were only 0.58 (95% CI 0.49–0.68) and 0.68 (95% CI: 0.52–0.84), respectively (Fig. 2). Similar patterns were observed in the ARP predictions for ciprofloxacin, nalidixic acid, and trimethoprim/sulfamethoxazole (Fig. 2). In contrast, the models for the cephalosporin group (cefoxitin, ceftiofur, and ceftriaxone) demonstrated the highest F1-scores (≥0.96) and AUROC (≥0.98), attributed to their relatively balanced S: R ratios (Fig. 2) and distinct resistant mechanisms (see below), which could be easily mined by the models.
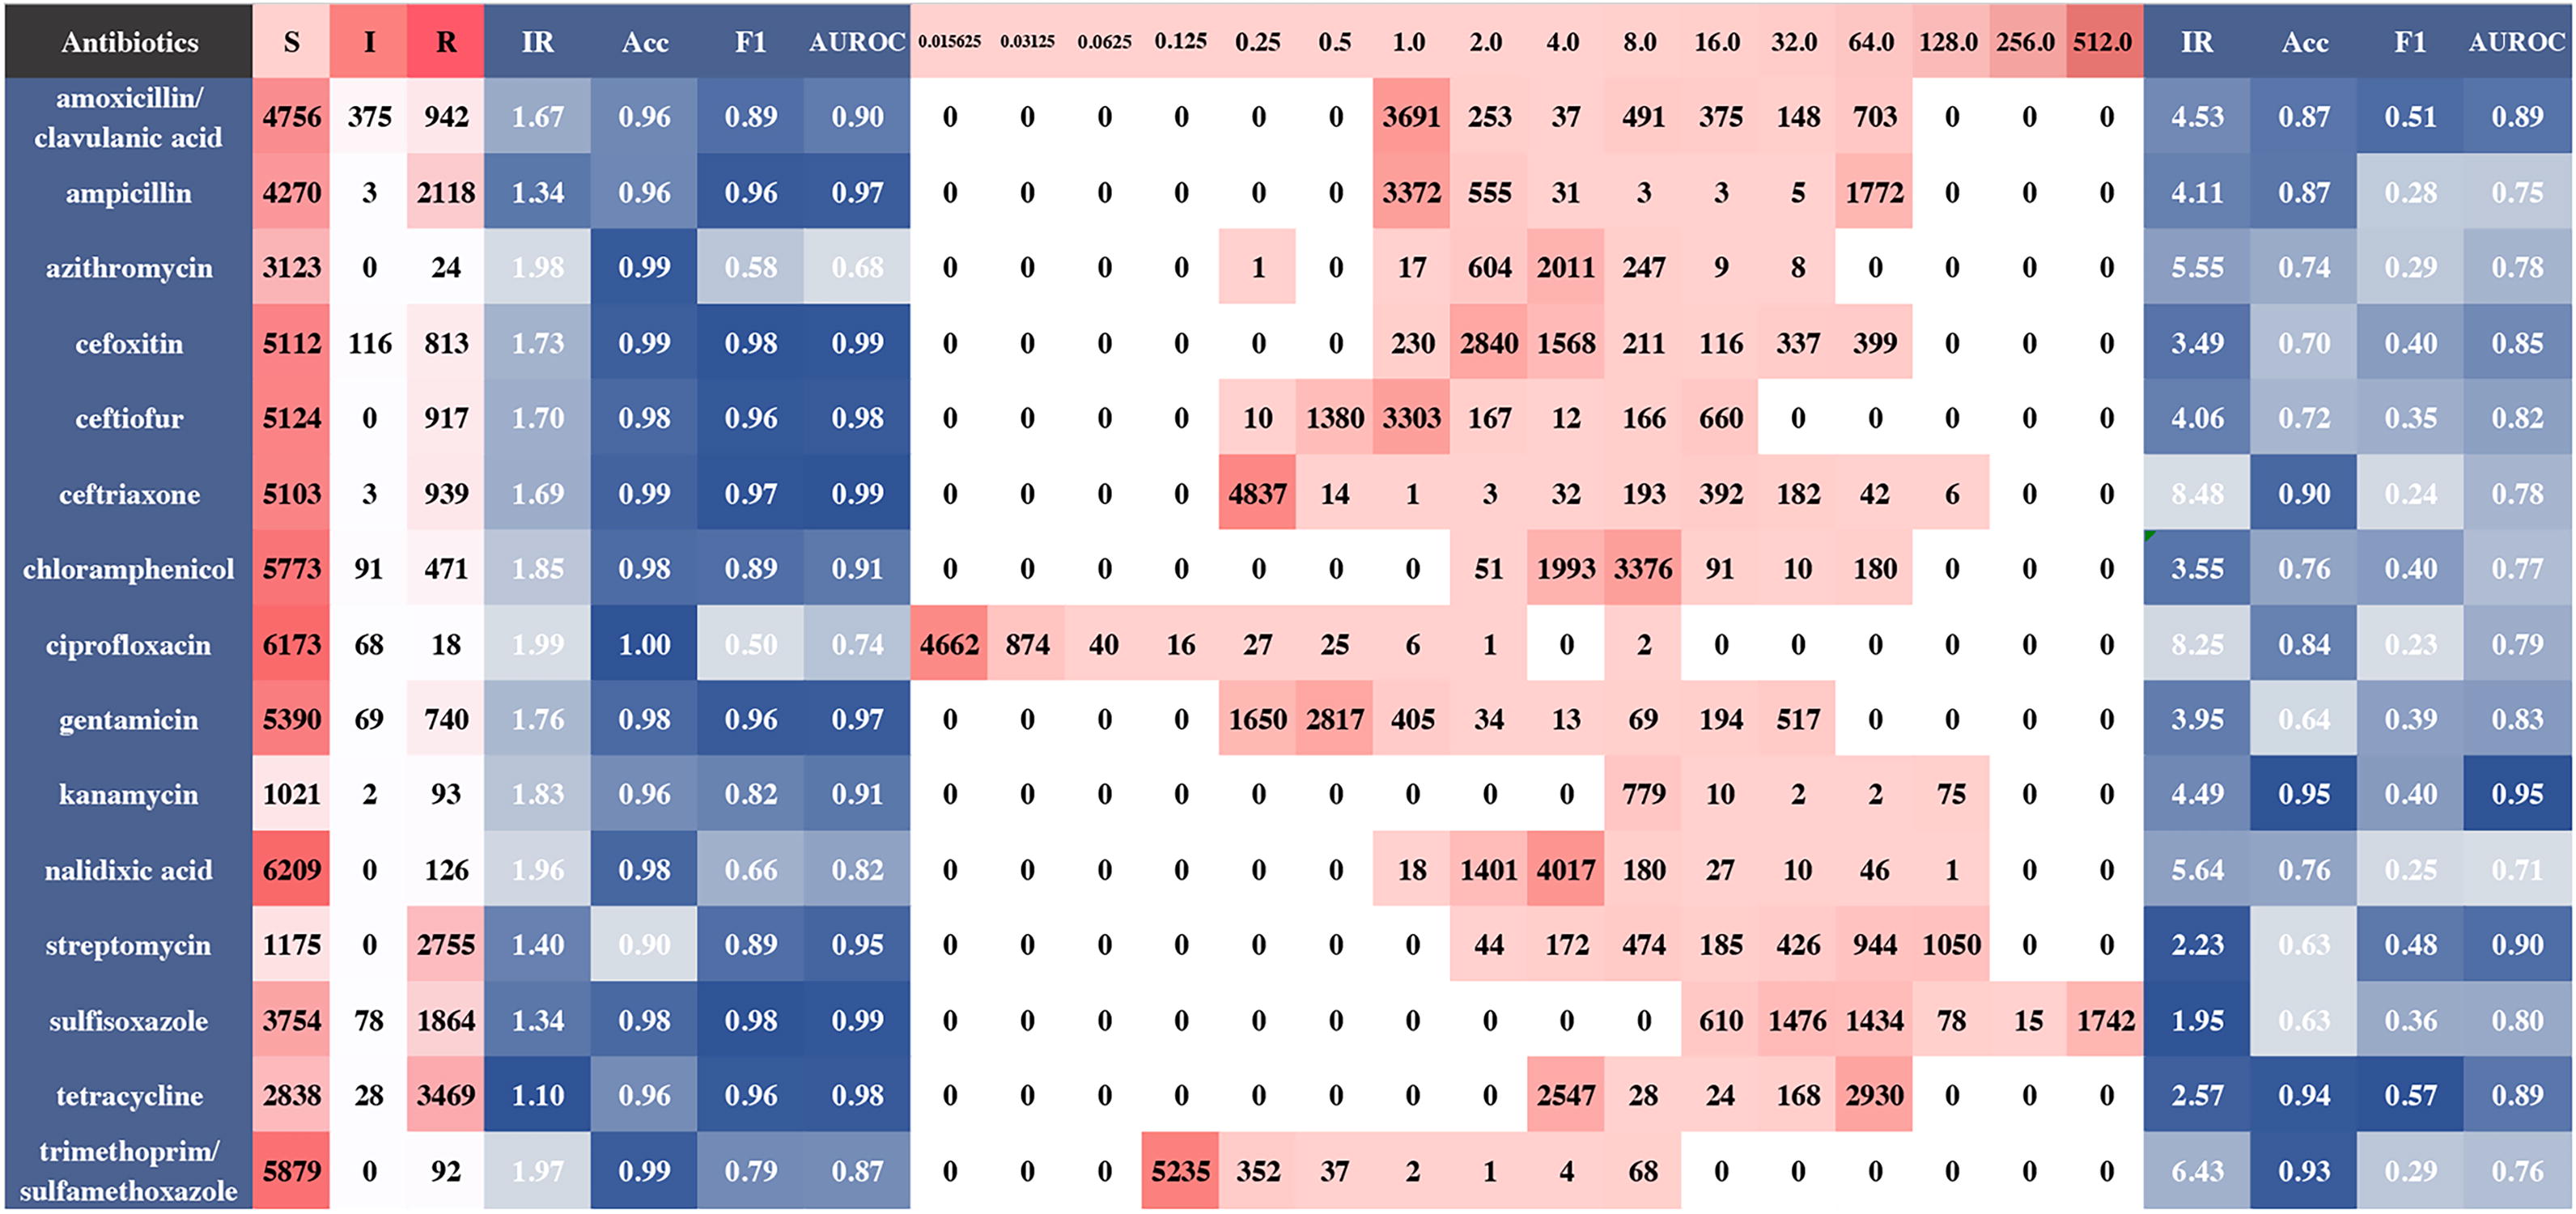
Antibiotic resistance phenotypes (ARPs) and minimum inhibitory concentrations (MICs) distributions and their corresponding metrics. The integers below S, I, R, and MICs refer to counts of genomes. Deeper red indicates higher counts. The float values below others represents metric values. Lighter blue represents the less desirability. Evaluation metrics on the left and right side belong to ARPs and MICs, respectively. Acc, accuracy; F1, F1-score; I, intermediate; IR, imbalance ratio; S, susceptible; R, resistant.
Imbalanced resistance classes and imprecisely labeled MIC values, as seen in this study (Fig. 2 and Fig. 3), likely hindered predictions. The low F1-score resulted from the model’s difficulty distinguishing less frequent MICs. For example, ceftriaxone achieved high accuracy (99.80%) for 0.25 mg/L, found in 85% of strains, but poor performance for other MICs, with some accuracies dropping to 0.00% (Figs. 2 and 3). As a result, the ceftriaxone model had an overall accuracy of 90.27% (95% CI: 89.07%−93.45%) but a low unweighted F1-score of 0.24 (95% CI: 0.16–0.33).
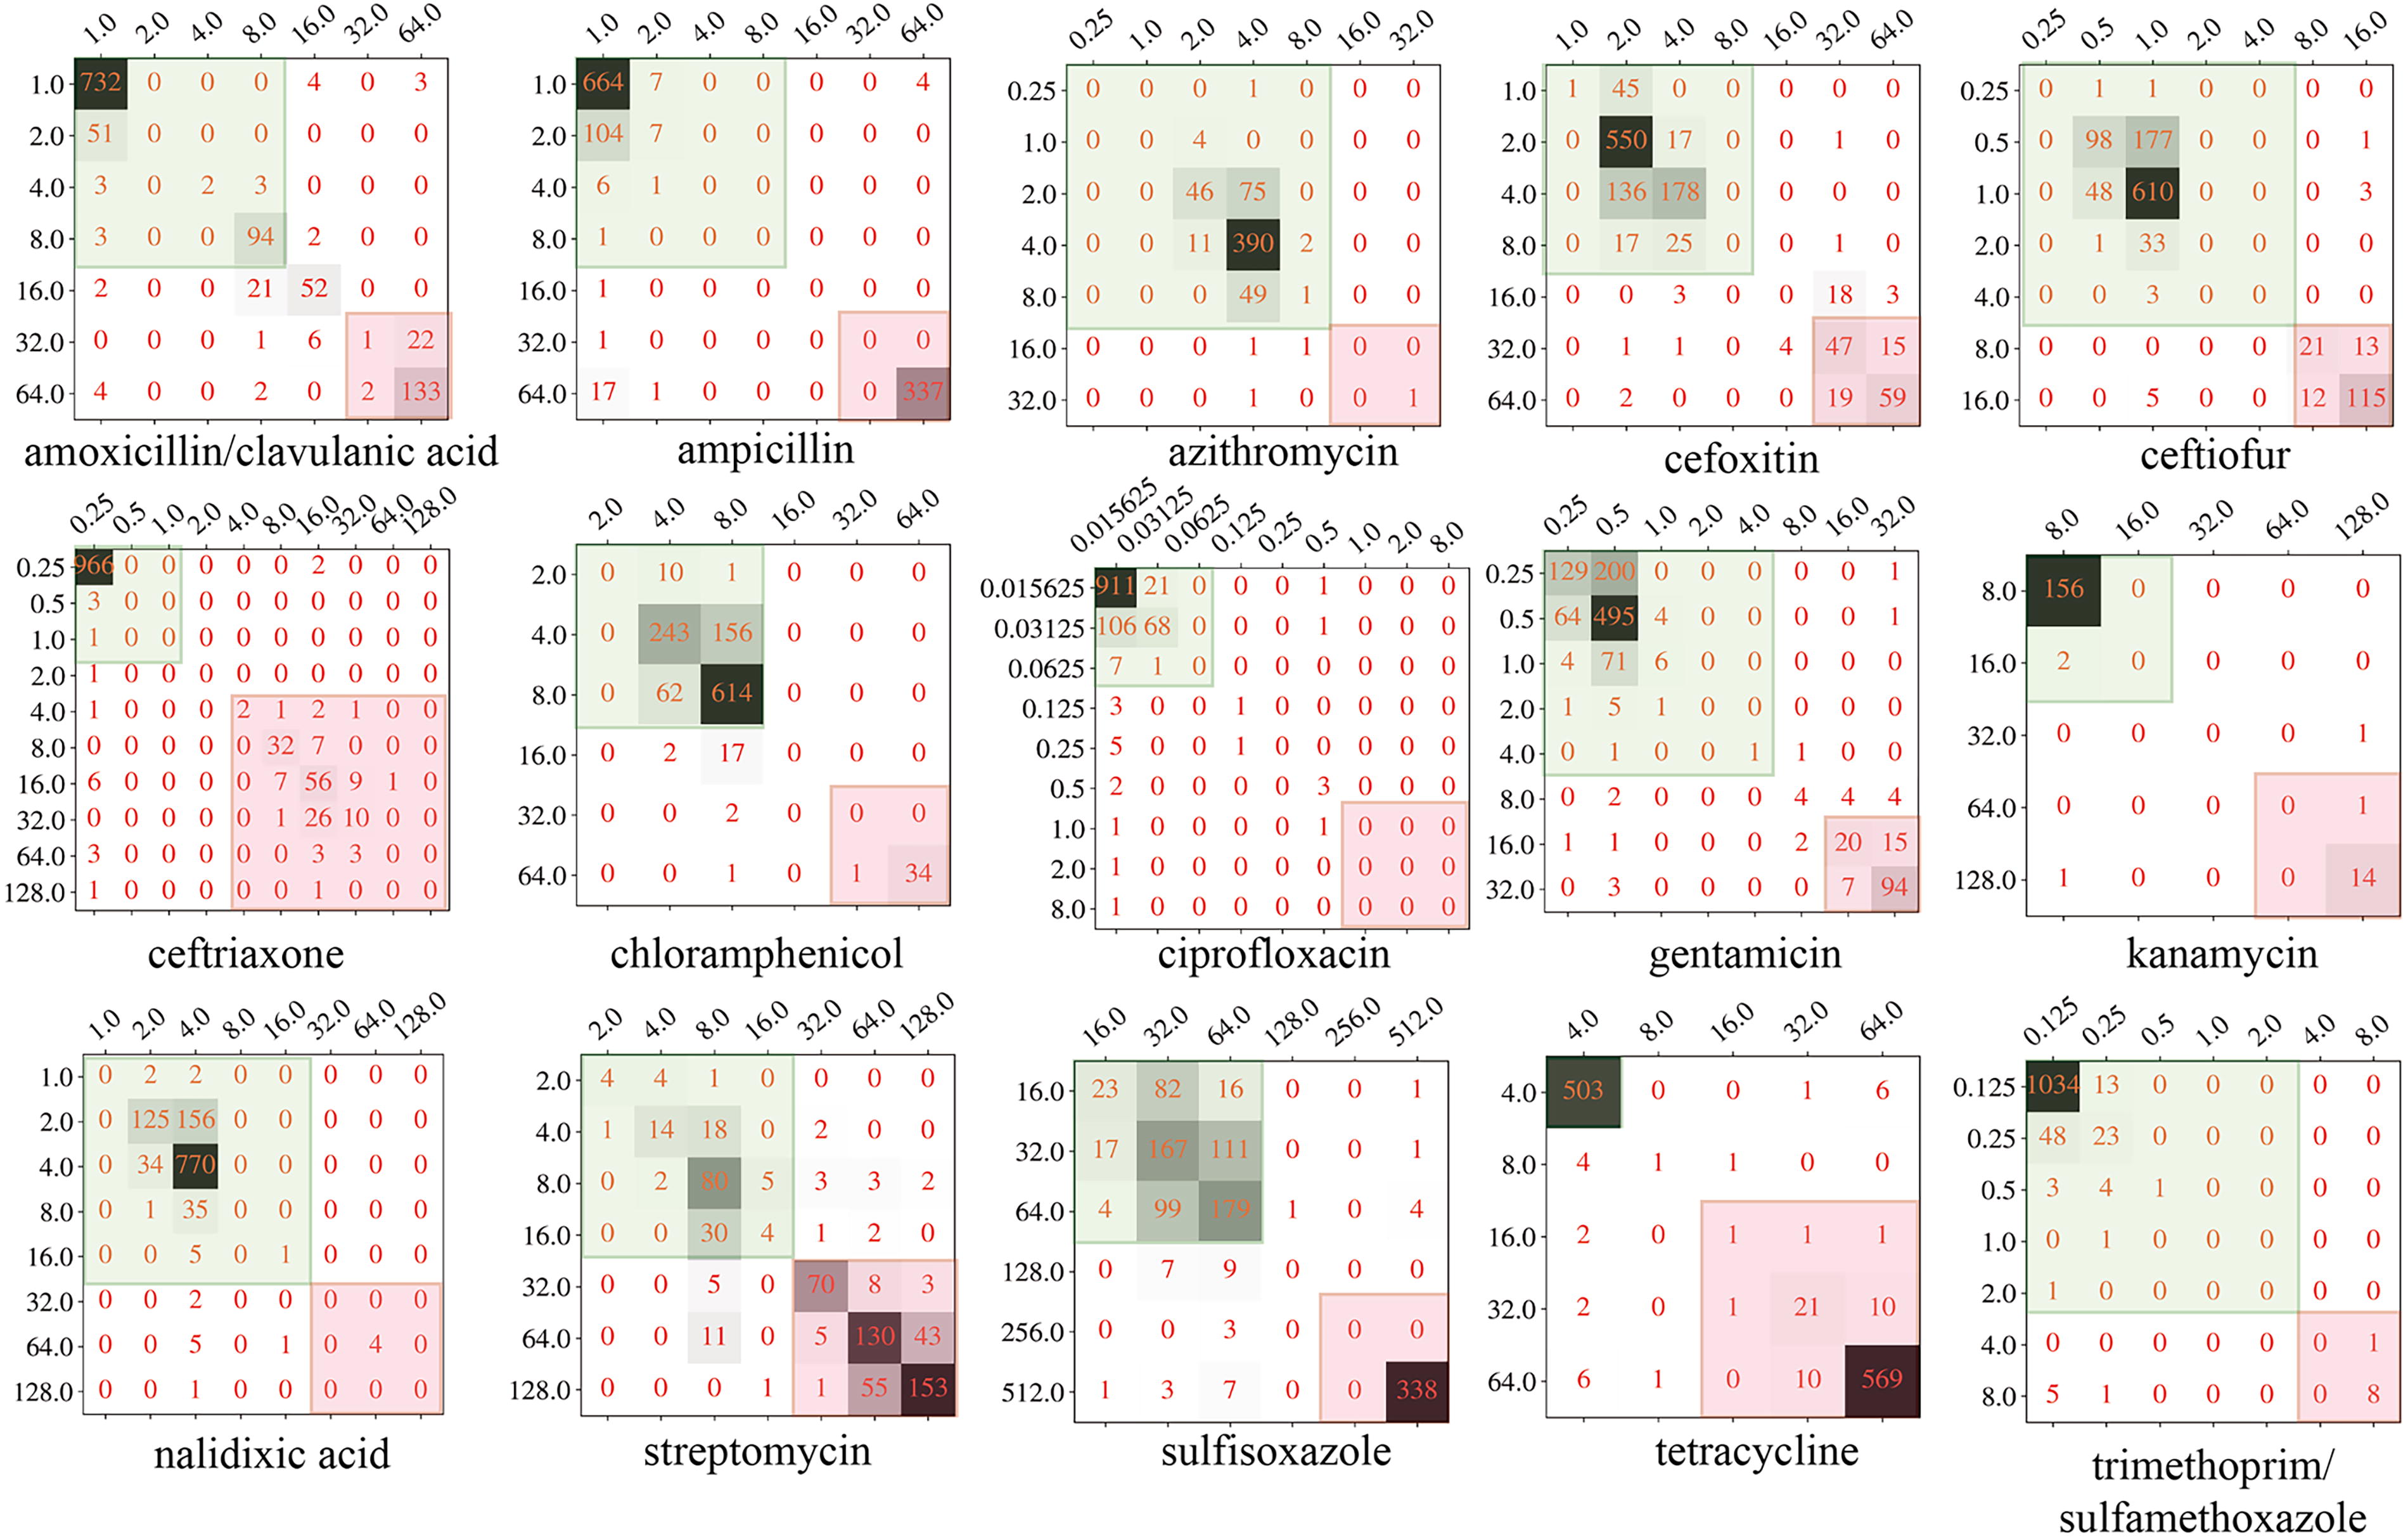
Confusion matrices of predicting minimum inhibitory concentrations (MICs) via extreme gradient boosting (XGB) classifiers for 15 antibiotics. Each matrix represents the ability to distinguish individual MICs based on the test dataset of respective antibiotic labeled below. Numbers aligned on the diagonal for models that exhibited excellent performance. Otherwise, misclassifications were written in the other cells of MICs in the same row. The darker the cell, the higher the genome counts. MICs within the green and pink squares belong to the susceptible and resistant ranges, respectively.
The impact of data imbalance on model performance was assessed using IR values based on ARP and MIC distributions (Fig. 2 and Fig. 3). Models performed better for ARPs (higher F1 scores and AUROCs) when IR <1.85. However, IR >5 reduced MIC predictive accuracy, although IR <5 did not always ensure high scores due to confounding factors. Higher IRs consistently impaired predictions despite high overall accuracy. Balanced datasets are crucial for improving model performance, emphasizing the importance of balanced data in future studies.
Identification of key genomic features on robust prediction for each antibiotic
To identify key genomic features for each antibiotic, we extracted features with weights >0 from the four XGB classifiers and ranked them by weight. For ARPs, all antibiotics performed well with fewer than 10 features (Fig. 4), especially β-lactams, which needed only one or two features. The main features enhancing metrics were ARGs conferring resistance, as annotated in PATRIC and CARD (Table 1). For β-lactams, key features included bla CMY and bla TEM alleles (Cole et al., 2015; Folster et al., 2014); for aminoglycosides, inactivation enzymes such as aadA, AAC(3′), and APH(3′) (Ahmed et al., 2004; Stern et al., 2018; Stoesser et al., 2013); and for other antibiotics, genes such as floR, sul, and tet (Antunes et al., 2005; Cloeckaert et al., 2000; Zhang and LeJeune, 2008) (Table 1). While key features were primarily ARGs, other high-ranking features, such as mobile genetic elements recognized as auxiliary elements in ARG transfer (Li et al., 2018), also contributed to model performance. However, not all the related ARGs could be extracted from genomes, particularly for antibiotics azithromycin, ciprofloxacin, and nalidixic acid correlated with mrx (Poole et al., 2006) and qnrB (Jacoby et al., 2006). It was reported that azithromycin resistance was also determined by mutations in 23S rRNA (Chisholm et al., 2010; Zhang and van der Veen, 2019), which was not included in this study because only coding sequences were used. Most features were from the accessory pan-genome, with a few SNPs in parC and gyrA contributing to quinolone resistance (Bae et al., 2013; Nathania et al., 2022), which were not detected in this study.
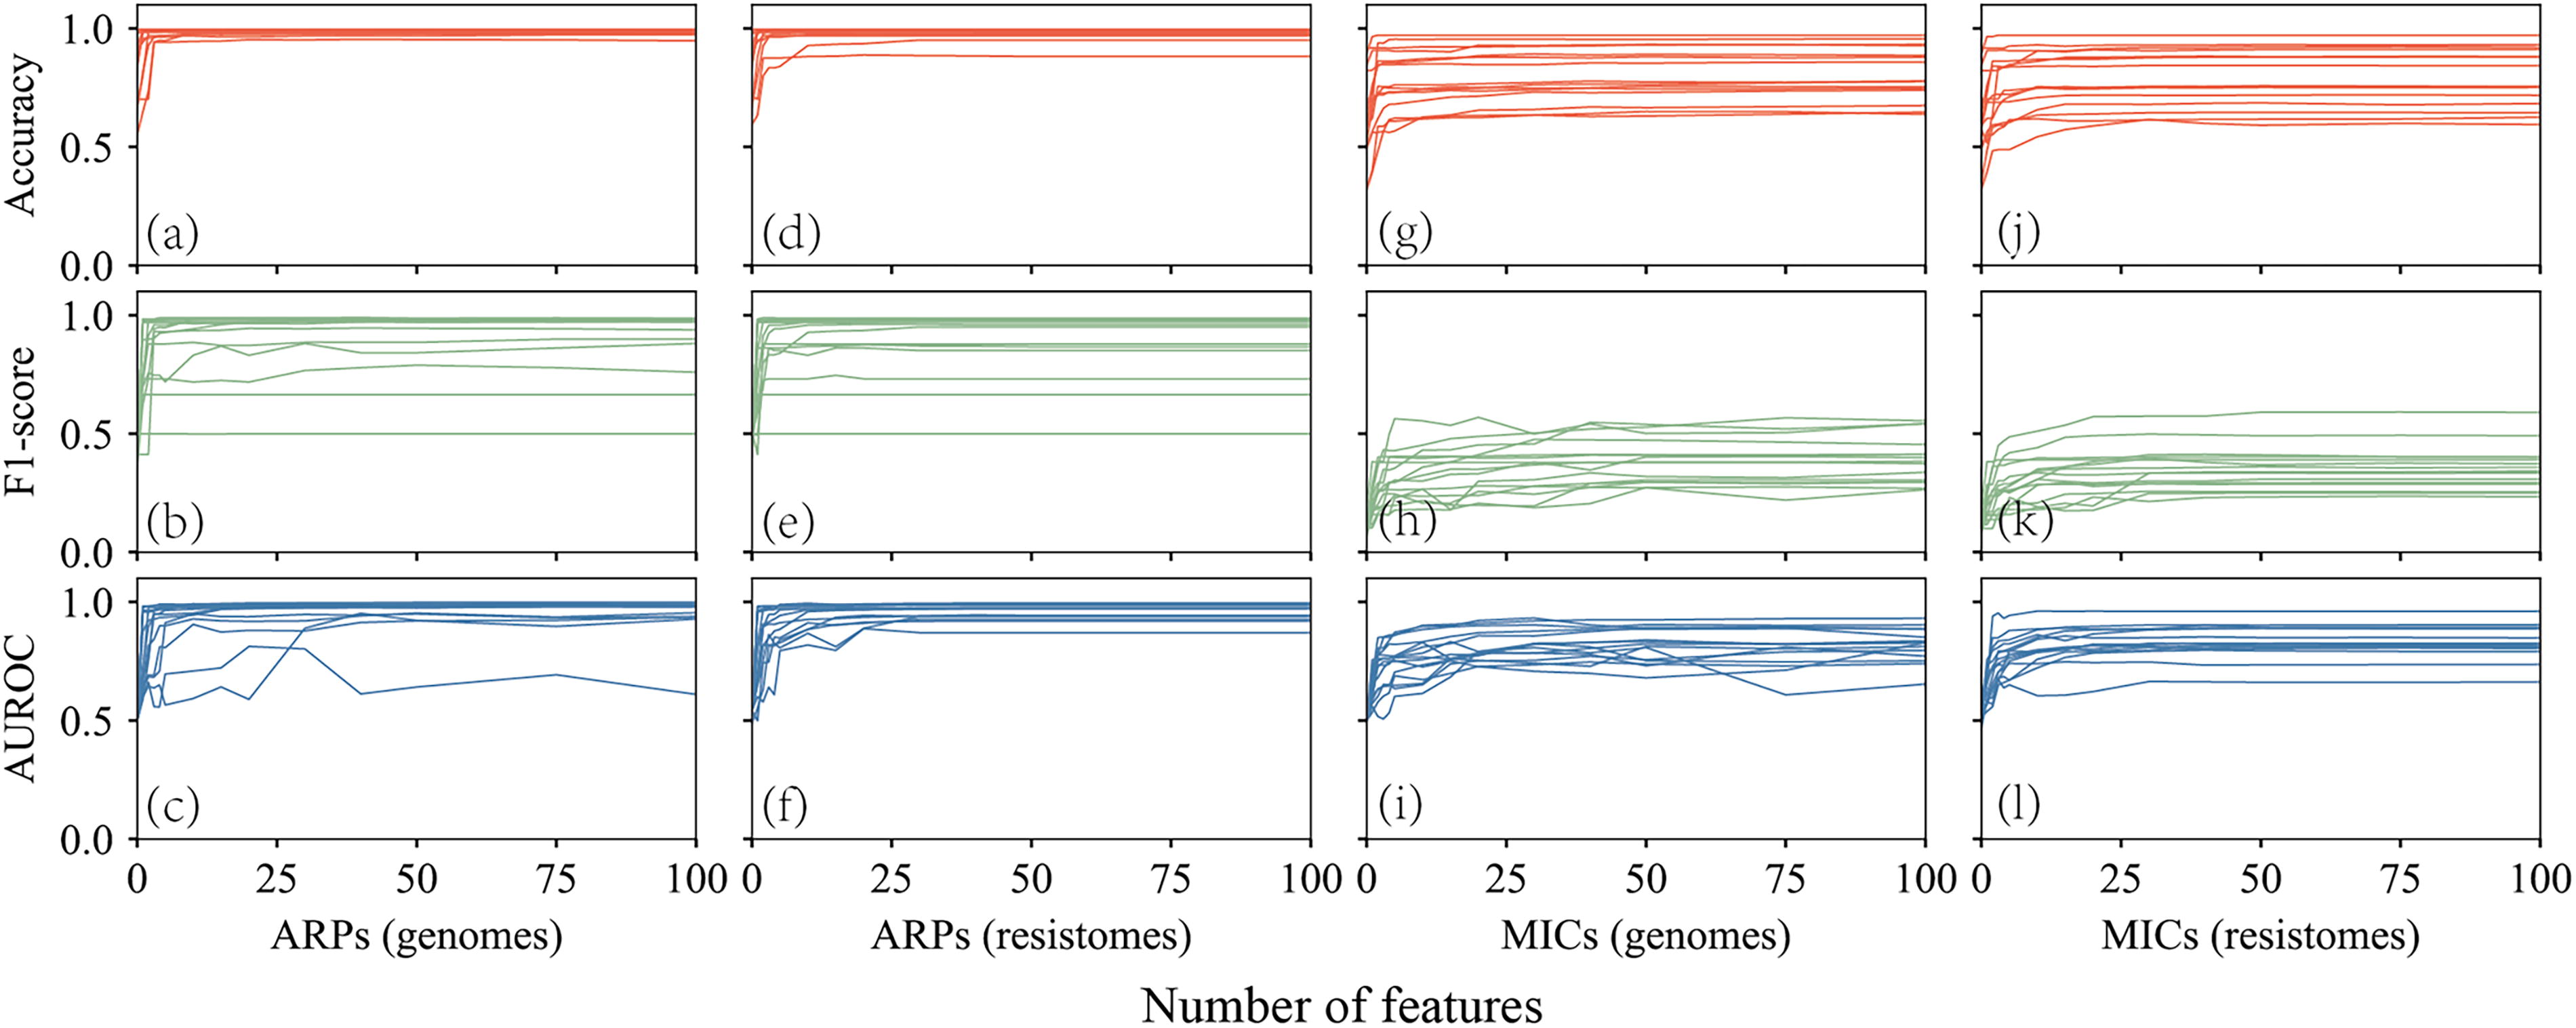
The change of accuracy, F1-score and the area under the receiver operating characteristic curves (AUROC) as the feature number increases. Each line represents one antibiotic.
Important Genomic Features for ARPs Prediction
N and N*refer to the rank of features in models using raw genomes and resistomes, respectively.
ARPs, antibiotic resistance phenotypes.
For MIC models, no new genomic features were identified, as key features overlapped with those in ARP predictions. Comparison matrices of the top 10 weighted features in the four XGB models per antibiotic revealed shared and distinct features (Fig. 5). Only ARG-related features and some correlated mobile genetic elements were consistent across models, with varying weights and ranks, while unique features did not improve overall performance (Fig. 4).
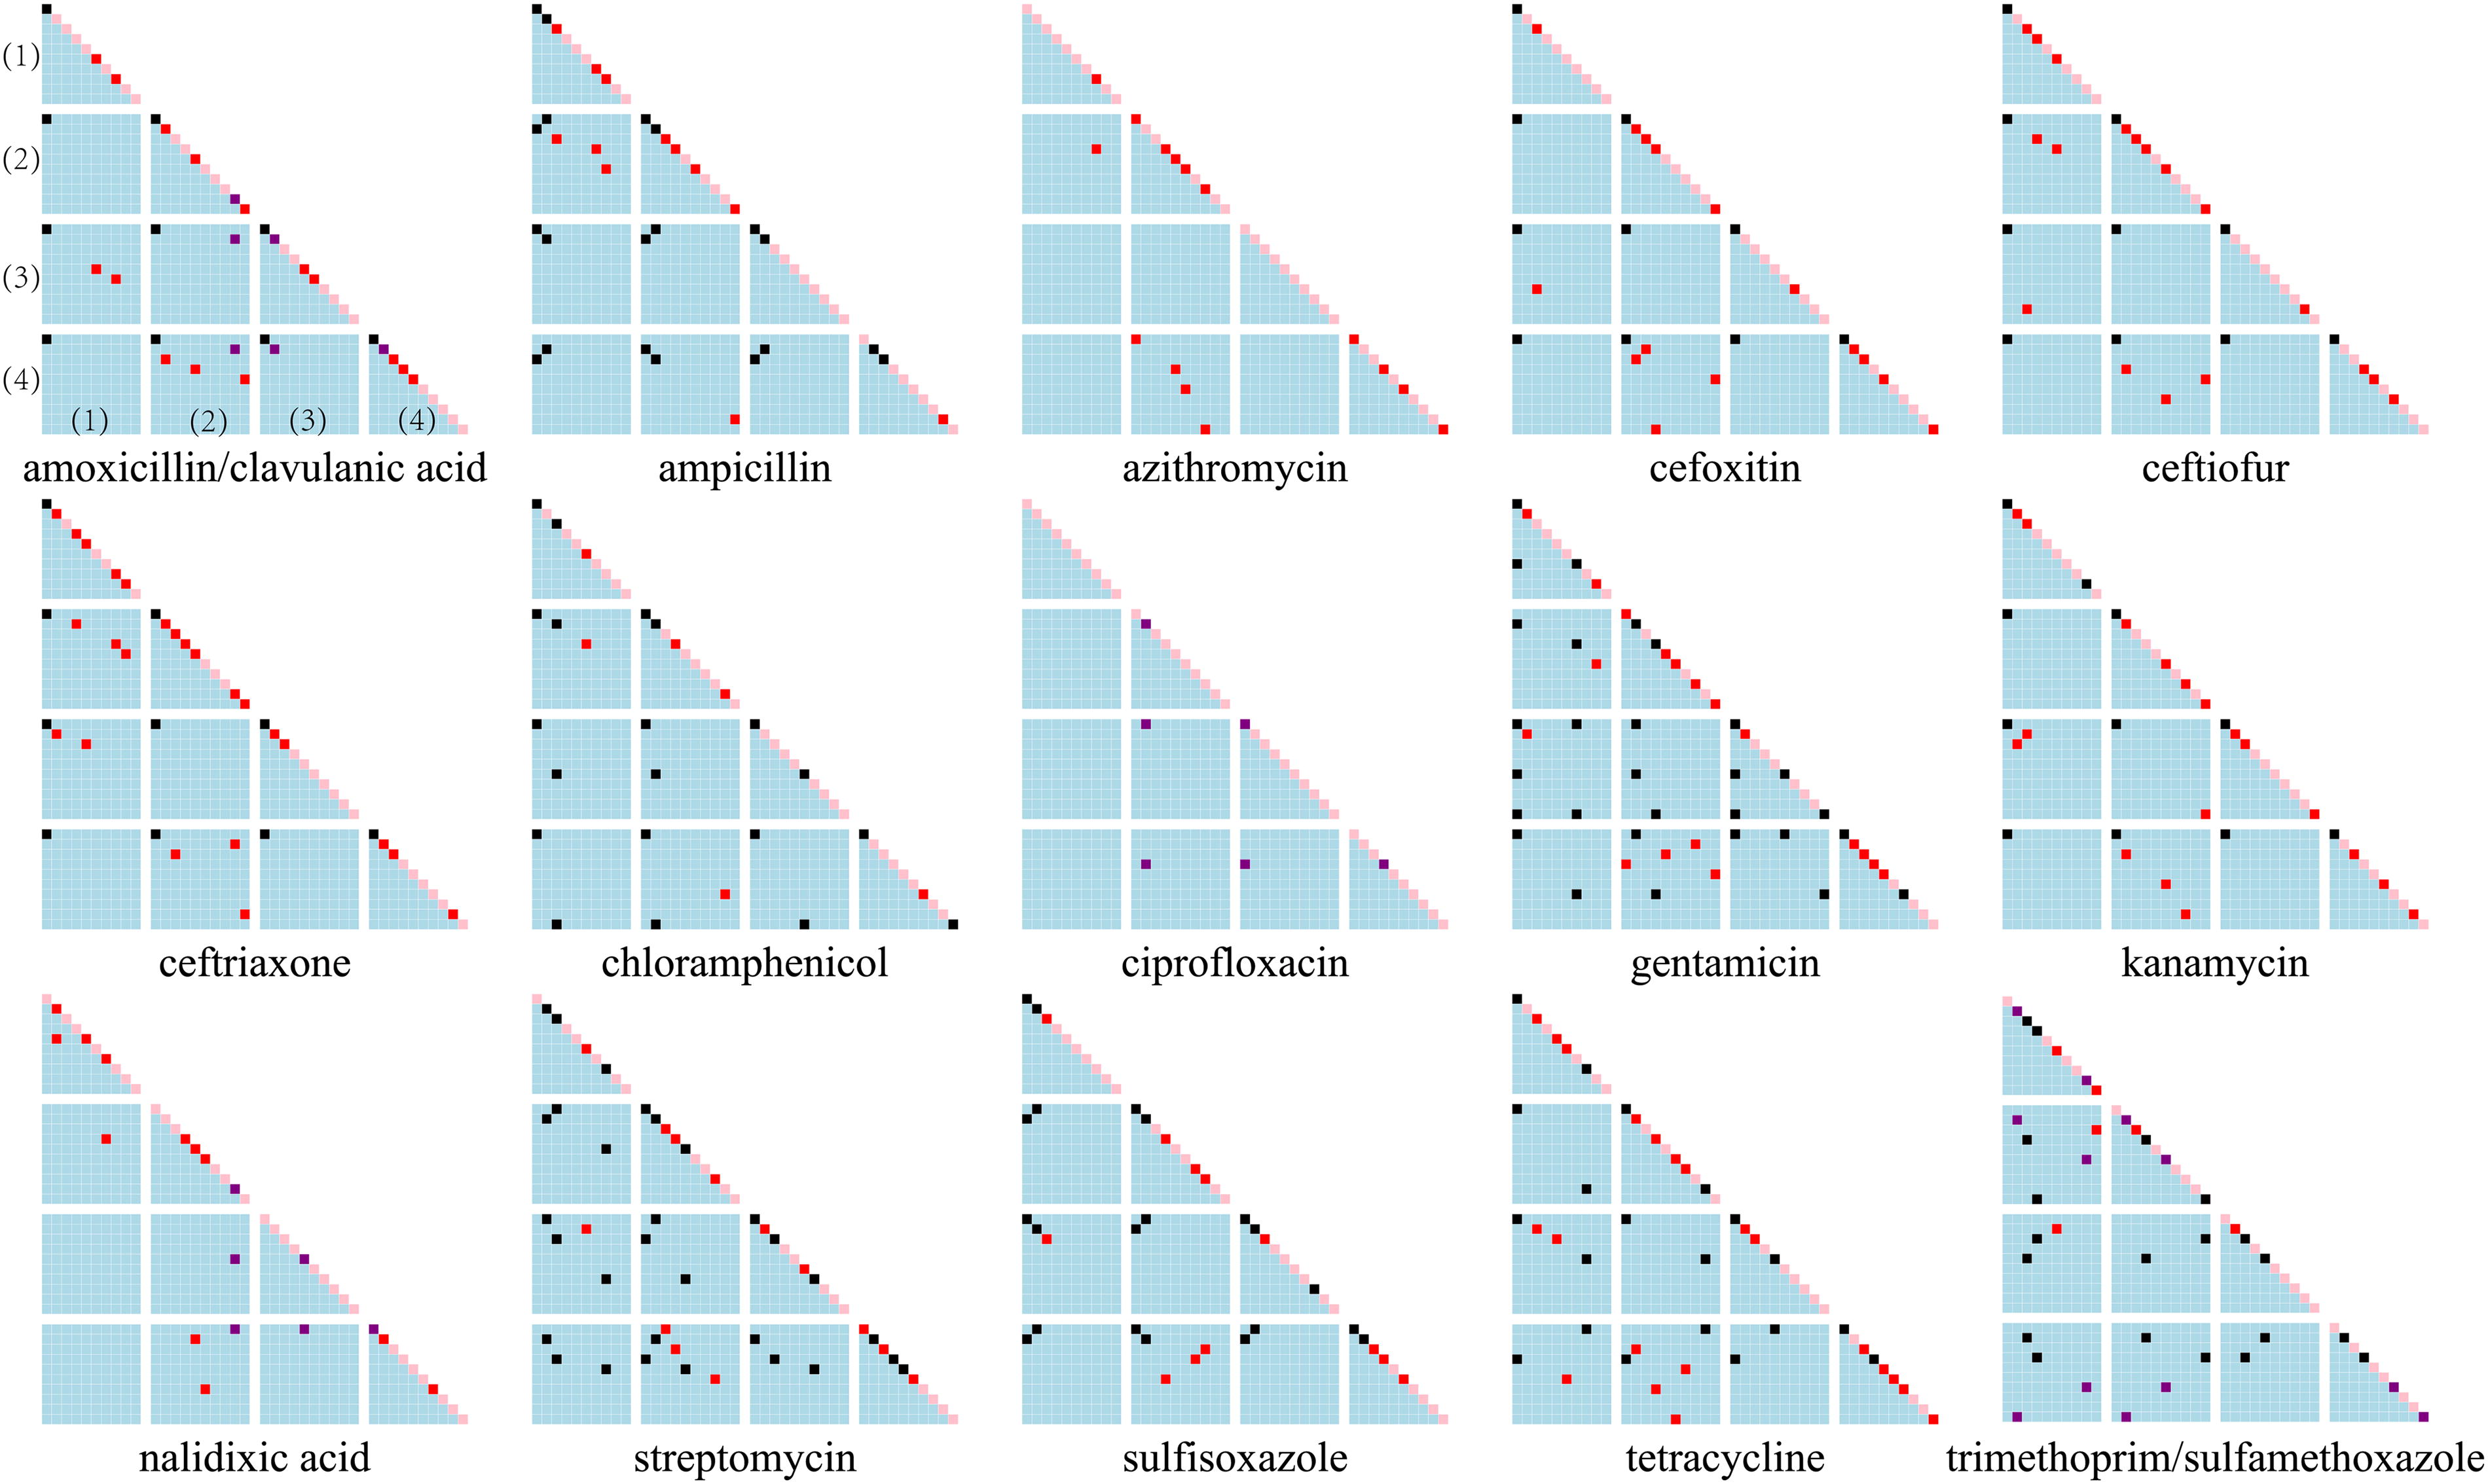
Comparison matrices of the top 10 most important features in 4 models for 15 antibiotics. Each dot represents a feature. Within each unit (individual triangle or square in a subgraph) separated by a gap, the further to the upper right the dot is, the higher the rank of the feature. Each unit represents comparison of features from two models. The dots in different colors represent the occurrences of the features in four models, where pink, red, purple, and black refer to 1, 2, 3, 4, or more times, respectively. Four triangles and six squares form a subgraph. In each subgraph, the order of models from top to bottom and from left to right are (1) antibiotic resistance phenotypes (ARPs) prediction using raw genomes as predictors, (2) ARPs prediction using resistomes as predictors, (3) minimum inhibitory concentrations (MICs) prediction using raw genomes as predictors, (4) MICs prediction using resistomes as predictors. Triangle units along the diagonal represent self-comparison of features, thus dots on the diagonal exactly show the features within each model, and square units represent comparison of two models.
This study has several limitations. The ML models, although robust, rely on the quality and representativeness of the training data, and biases or gaps may limit their generalizability. In addition, the models may overfit without proper validation, especially with complex datasets. The exclusive use of genomic data also overlooks environmental and phenotypic factors influencing antibiotic resistance. Future research should focus on improving dataset diversity and incorporating phenotypic resistance profiles and environmental factors to enhance model robustness and applicability.
Conclusion
This study demonstrated the effectiveness of integrating ML with WGS to predict antibiotic resistance in Salmonella and identify genes associated with resistance mechanisms. Using the pan-genome or pan-resistome in the XGB classifier, we predicted ARPs and MICs for 15 antibiotics, with fewer than 10 key genomic markers providing robust predictions. The models require fewer resources and shorter testing times, making them efficient for routine surveillance. However, imprecise labeling and data imbalance hindered accurate MIC predictions, suggesting the need for multiple evaluation metrics, especially IR data. This approach can also facilitate further investigation into key genomic features relevant to antibiotic resistance prediction models. These models could improve surveillance efficiency by providing rapid, accurate predictions to identify emerging resistance patterns early. They also have the potential to guide targeted interventions, such as selecting effective antibiotics and developing strategies to combat resistance spread. Their application in real-world settings could enhance public health responses to antibiotic resistance, extending their relevance beyond Salmonella.
Footnotes
Authors’ Contributions
Y.H., X.Z., and X.S. conceived the study. Y.H. wrote the Python scripts and with X.Z. prepared the article. X.Z., L.Z., and Y.C. contributed to the software development. X.D., Y.H., and A.G. edited for technical content, and X.S. refined the article. All authors approved the final version.
Disclosure Statement
No competing financial interests exist.
Funding Information
This work was supported by the National Key R&D Program of China (grant number 2019YFE0119700).
Supplementary Material
Supplementary Figure S1
Supplementary Table S1
Supplementary Table S2
References
Supplementary Material
Please find the following supplemental material available below.
For Open Access articles published under a Creative Commons License, all supplemental material carries the same license as the article it is associated with.
For non-Open Access articles published, all supplemental material carries a non-exclusive license, and permission requests for re-use of supplemental material or any part of supplemental material shall be sent directly to the copyright owner as specified in the copyright notice associated with the article.