
Abstract

The following excerpts of the J.P. Morgan 10th Annual Slot Market Survey: The Gaming Manager's Conundrum—Delivering Growth in a Capex and Consumer Constrained Environment were reprinted with permission.
J.P. Morgan has completed their 10th annual Australian slot survey, encompassing slot machine manufacturers who operate within the ∼196,000 slot-machine market. Venues surveyed range from small 10-slot pubs and bars to multi-thousand slot casinos in every major city. A highly regulated country, Australia represents some of the most innovative designs and features found in slot machines today. All major manufacturers have design and development studios in Australia and seek to use the very high slots-to-gambler ratio to test a myriad of new concepts. Due to the highly regulated nature of Australia's slot laws, manufacturers must innovate and design creative ways for slot machines to function and perform; precisely why Australia that provides the rest of the world with very successful games displaying innovative features which work worldwide. J.P. Morgan uses the Australian slot survey to forecast game performance as machines are launched globally throughout the U.S., Macau, and various other jurisdictions. Below, we highlight insights from slot buyers across clubs, pubs and casinos and some of their concerns and the regulatory environment in Australia and New Zealand (ANZ).
A Note on Australian Regulation
Slots-related regulation in Australia varies from state to state and covers aspects such as max bet limits, min return to player amounts, ATM withdrawals, and the speed at which bets can be placed on slots (minimum reel-spins). Using the state of Victoria as an example, venue operators now encounter strict regulations on ATM withdrawals (from A$1,000 to A$500), a ban on moneyless gaming machines, and electronic funds transfer at point of sale (EFTPOS) limits. From our analysis we have observed that such measures along with soft consumer spending levels has resulted in 10 months of consecutive declines in slot spend vs last year. Looking at the Western Australian market, poker machines are only allowed in the casino which limits pubs' and clubs' dependency on gambling. Over the last few years, the landscape for gaming regulation in Australia has changed to focus on the concept of “responsible gambling” due to efforts of various lobbyist groups. The key changes include limits on max bets, ATM withdrawal limits at gambling venues, check cash and withdrawal amount for jackpots, and the speed at which bets can be placed on slots (minimum reel-spins). Further, there are standards for harm minimization across all gambling providers that are set in each Australian state and territory.
Australian gaming managers are facing a tough market environment. Our 10th Annual Slot Market Survey highlights the challenge of managing tight capex budgets against the backdrop of a retreating consumer.
Executive Summary
This report details the results of our 10th Annual J.P. Morgan Slot survey, with a particular focus on the ANZ market (pubs/clubs/hotels/casinos) conducted from July–August 2019. We have split the findings into three categories: 1) market trends; 2) competitive landscape; and 3) company specific analysis. We uncovered the key topics for gaming managers in Australia were: player behavior, product performance, and return to player (RTP) as it impacts revenue in a venue.
Australian slot market trends
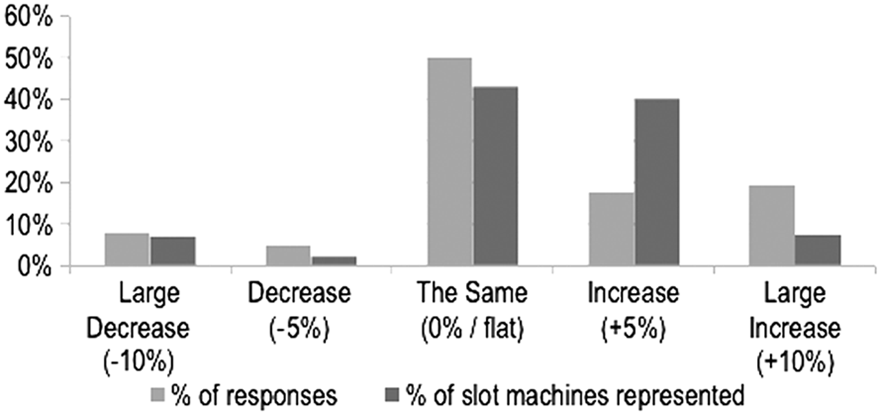
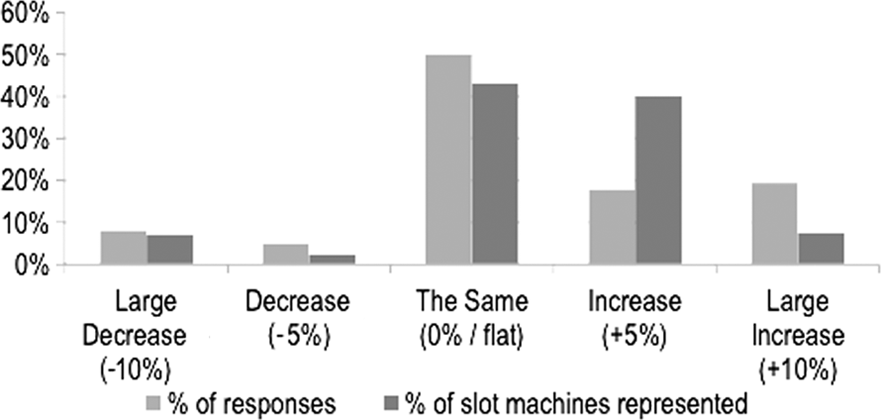
Maintain spend on replacements—50% of casinos and pubs (up from 45% in 2018) report they will maintain spend on replacements, 37% (down from 45% in 2018) intend to increase spend while 13% (up from 9% in 2018) intend to decrease their replacement budget. In total, venues representing 91% of the slot machines surveyed (down from 93% in 2018) expect their replacement budget to not decrease this year (Figures 1 and 2).
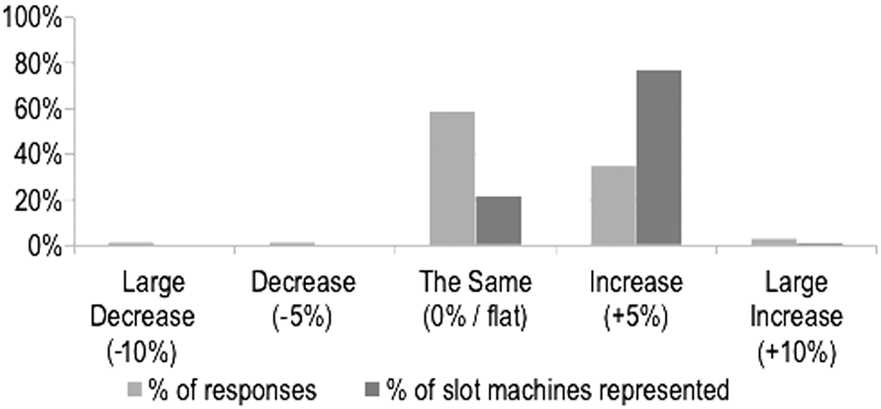
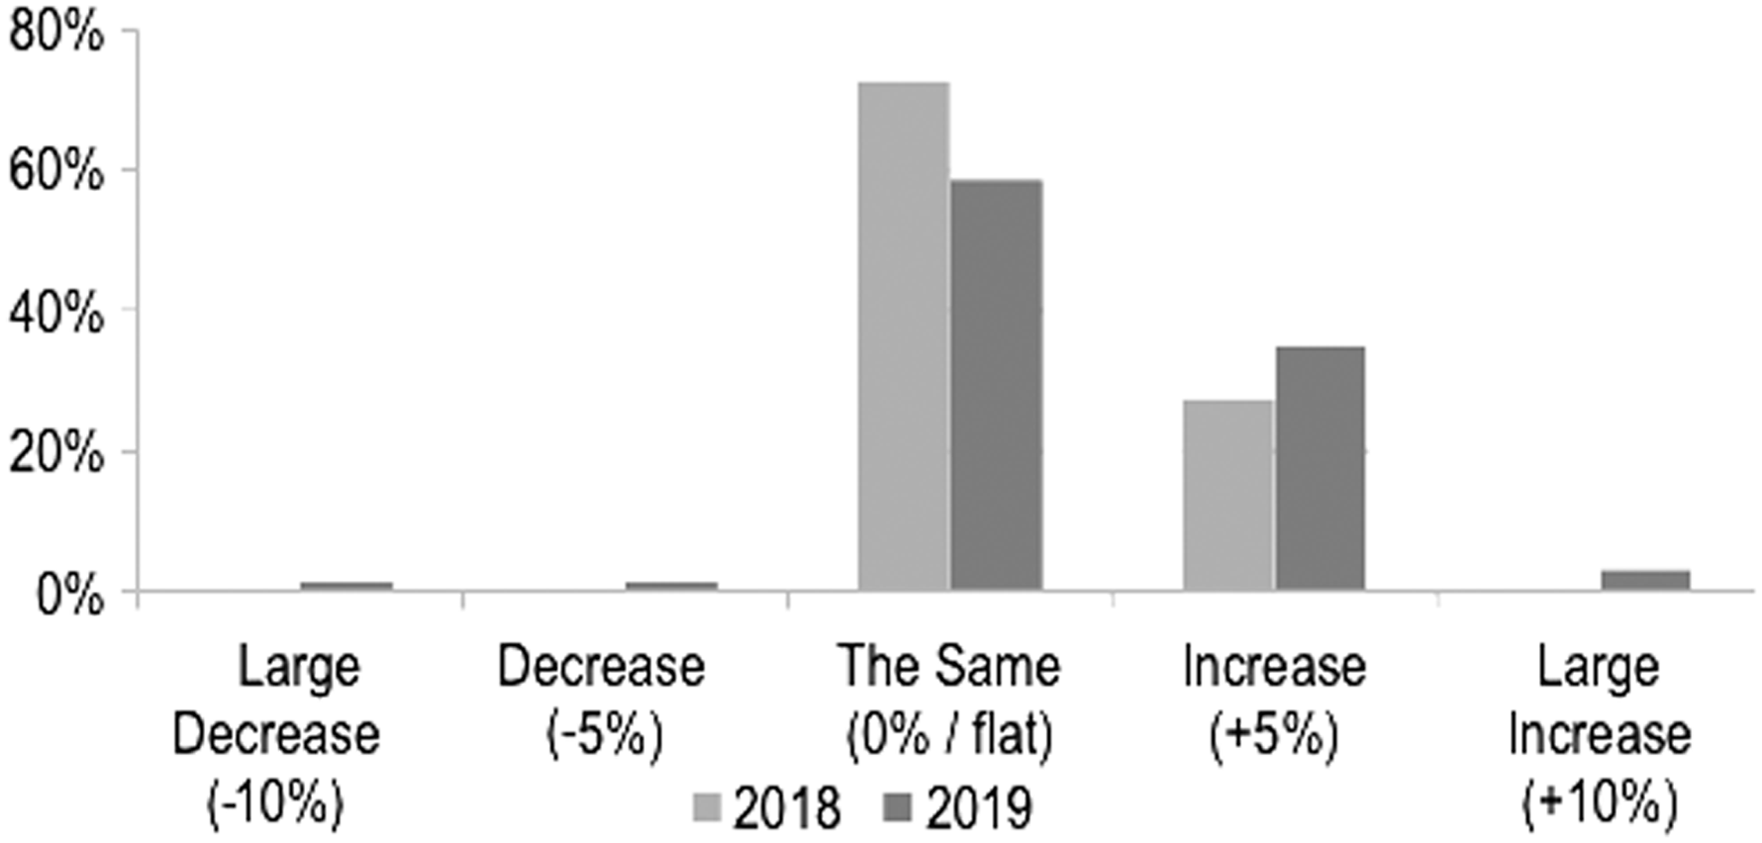
Increase spend on conversions—78% of slot count-weighted responses show a tendency to increase (up from 26% in 2018) and 21% intending to remain the same (down from 74% in 2018). Growth seen in conversions is due to strong cost focus from casinos and pubs as they serve an efficient way for operators to update their floors.
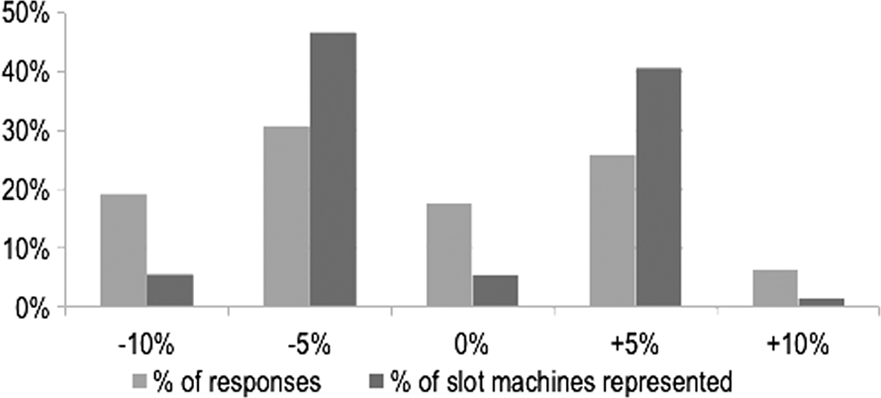
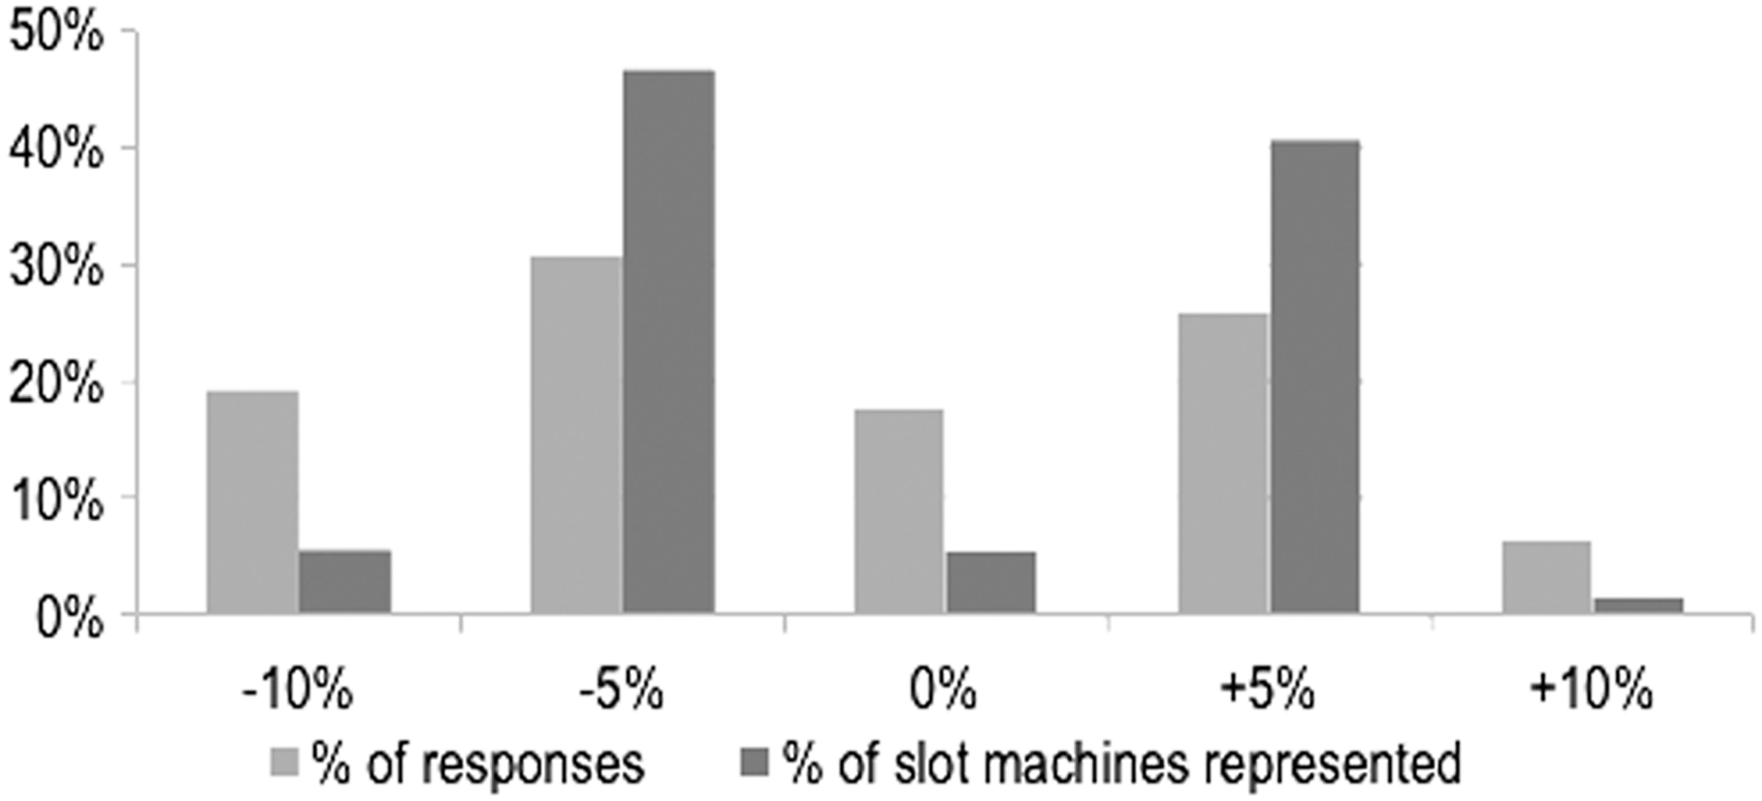
Spend per customer has decreased—50% of casinos and pubs estimate spend per customer has decreased (0% in 2018, 36% in 2017), 18% estimate flat (18% in 2018, 27% in 2017) and 32% estimate an increase (82% in 2018, 36% in 2017). The smaller operators (∼6% of slot machines represented) estimate −10% decline in customer spend while larger operators are split as ∼41% of slot machines represented view +5% increase and ∼47% view −5% decrease (Figure 3).
Some venues will spend more, although these are “catch-up” replacements
Slot players are spending less; an increasingly concerning trend for operators
Casinos and pubs will largely maintain spend on replacements over the next 12 months. Source: J.P. Morgan.
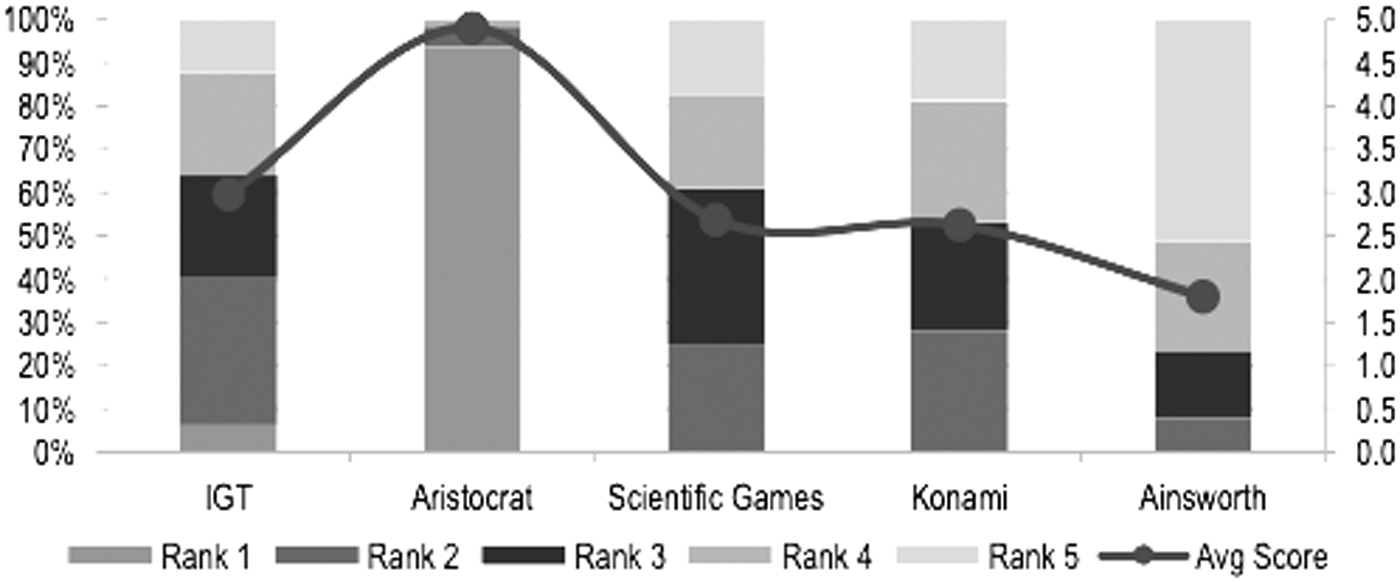
Survey participants ranked Aristocrat as the top performing slot manufacturer. Source: J.P. Morgan. Avg Score (#1=5, #2=4, #3=3, #4=2, #5=1).
Slot players appear to be spending less per person. Source: J.P. Morgan.
Size of the Market
Do you intend to change your spend on replacements over the next year?
Slot manufacturers rely on the replacement market to supplement older machines that are not performing. As the industry faces headwinds, operators will adjust their behavior from outright replacements to conversions. 50% of casinos and pubs (up from 45% in 2018) report they will maintain spend on replacements, indicating this trend is beginning to appear. 37% (down from 45% in 2018) intend to increase spend while 13% (down from 9% in 2018) intend to decrease their replacement budget. In total, venues representing 91% of the slot machines surveyed (down from 93% in 2018) expect their replacement budget to not decrease this year.
ANZ replacements: we estimate replacements to be 13.6k units in 2019, down slightly from our FY18 forecasts of 14.1k (Figures 4, 5, and 6).
Venues intend to increase the proportion of Aristocrat on their floor. Source: J.P. Morgan.
Casinos and pubs will largely maintain spend on replacements over the next 12 months. Source: J.P. Morgan.
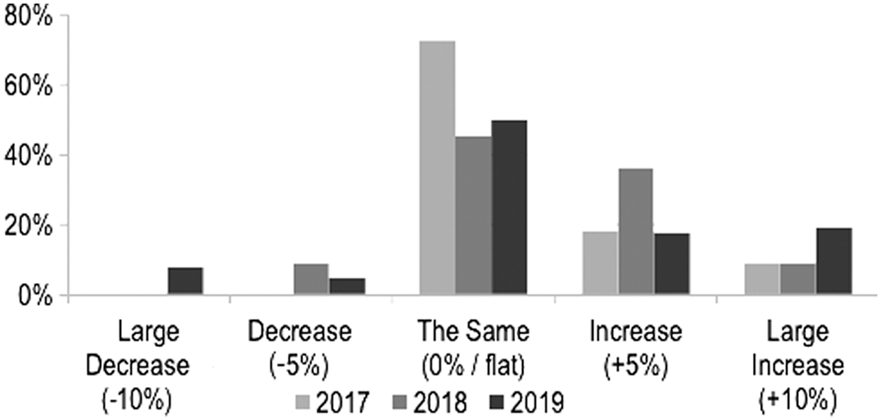
Growth in the replacement market is expected to slow relative to previous years. % of respondents. Source: J.P. Morgan.
Other notable feedback: renovations/works at clubs reduced cash flow for replacements spend with some catch-up work due.
Do you intend to change your spend on game conversions over the next year?
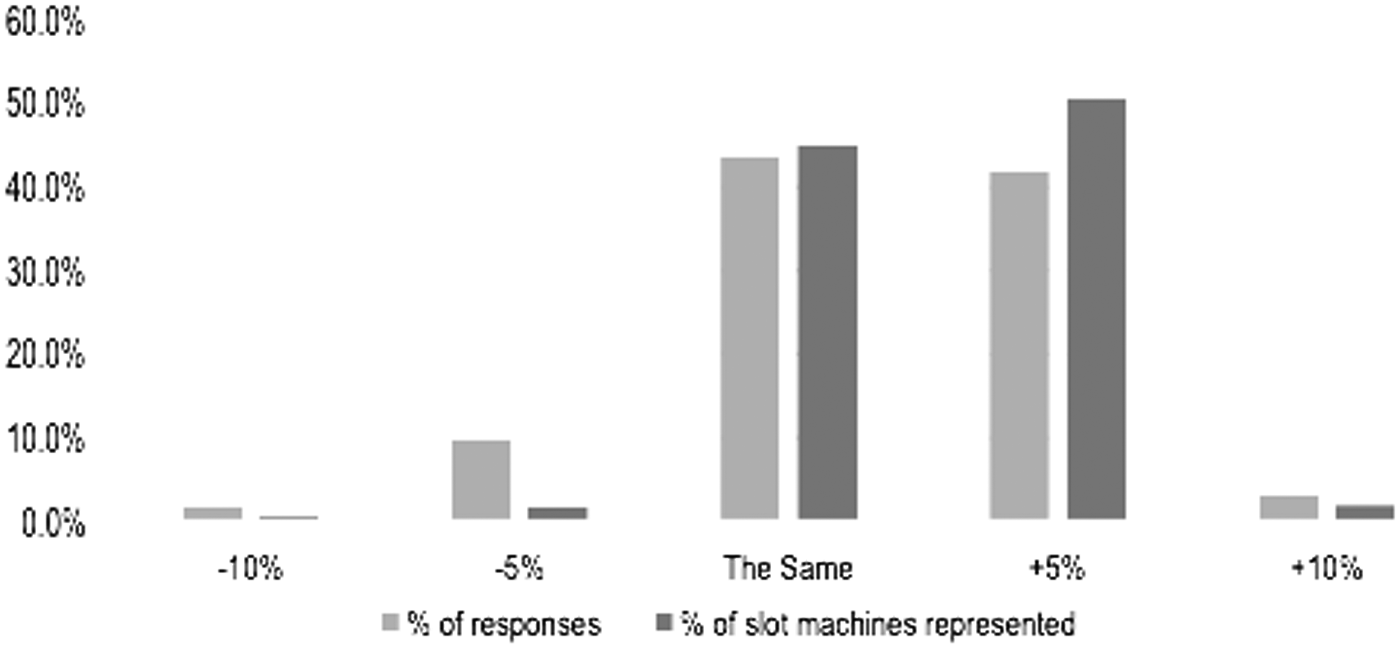
Growth seen in conversions is due to strong cost focus from casinos and pubs as they serve an efficient mechanism for operators to update their floors, while also serving as a high-margin product for manufacturers. Casinos and pubs intend to maintain (at the very least) or increase spend on conversions in 2019. 78% of slot count-weighted responses showed a tendency to increase vs. 27% last year (21% intending to remain the same vs. 74% last year) (Figure 7).
Conversions are still seen as an efficient way to update gaming floors. Source: J.P. Morgan.
ANZ conversions: we estimate replacements to be 6.24k units in 2019, down slightly from our FY18 forecasts of 6.3k.
Other feedback: Hold and spin product growth has slowed. Conversions can also be free depending on the lifecycle, size, and agreement. Some respondents stated most manufacturers are free (particularly when purchasing) with the exception being Aristocrat, where conversion fees can be quite high into the latest-product.
Unit Pricing
How do you expect pricing of machines will change over the next 12 months?
The market is prepared for price increases in 2019 (continuing previous years trend) 50% of respondents (down from 55% in 2018) expect box pricing to increase in 2019. This proportion is lower than the results from our 2018 survey, but the low single-digit price increase trend remains. If machine prices continue, we would not be surprised to see ALL margins increase in the short term.
Higher demand for top performing products as seen in our monthly slot performance updates (such as Dragon Link by Aristocrat) may allow certain manufactures to command a higher average selling price (ASP).
Other feedback: Some manufacturers will be increasing prices, however others facing market share loss (or underperforming/short lived products) will lead to specials for incentivizing sales.
Purchase agreements will be an important factor for clubs/pubs to reduce prices. New cabinet releases have been slow from the key manufacturers with a lot more conversions in current cabinets lately.
The Customer
How much do you estimate spend per customer has changed compared to last year?
Slot players appear to be spending less per person (consistent with our views in our previous article discussing soft ANZ macro trends 1 ) (Figure 8). 50% of casinos and pubs estimate spend per customer has decreased (0% in 2018, 36% in 2017), 18% estimate flat (18% in 2018, 27% in 2017) and 32% estimate an increase (82% in 2018, 36% in 2017). The smaller operators (∼6% of slot machines represented) estimate −10% decline in customer spend while larger operators are split as ∼41% of slot machines represented view +5% increase and ∼47% view −5% decrease (Figures 9 and 10).
Focusing on cost management. Source: J.P. Morgan.
Expectations of customer spend. Source: J.P. Morgan.
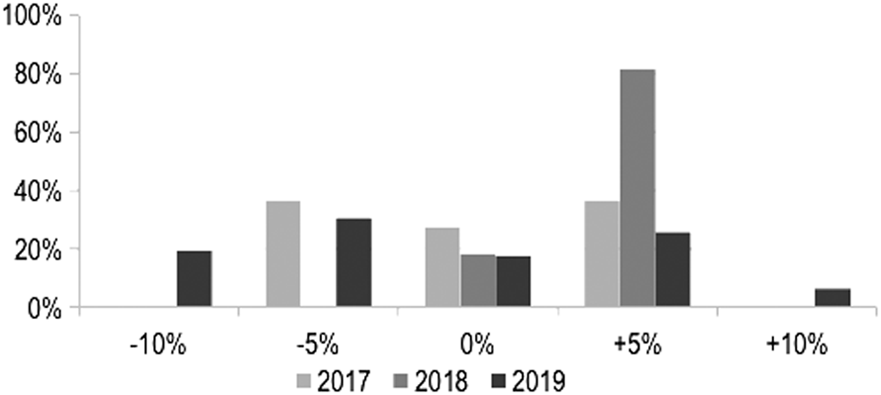
Historical customer spend shifts, % of respondents. Source: J.P. Morgan.
Other feedback: Customer spend is definitely in decline due to changing game structures as lower tier players cannot afford new games—or “don't get features often enough to keep them playing.” J.P. Morgan estimates ALL's features are 1:60 while as other manufacturers can extend as far as 1:120 spins.
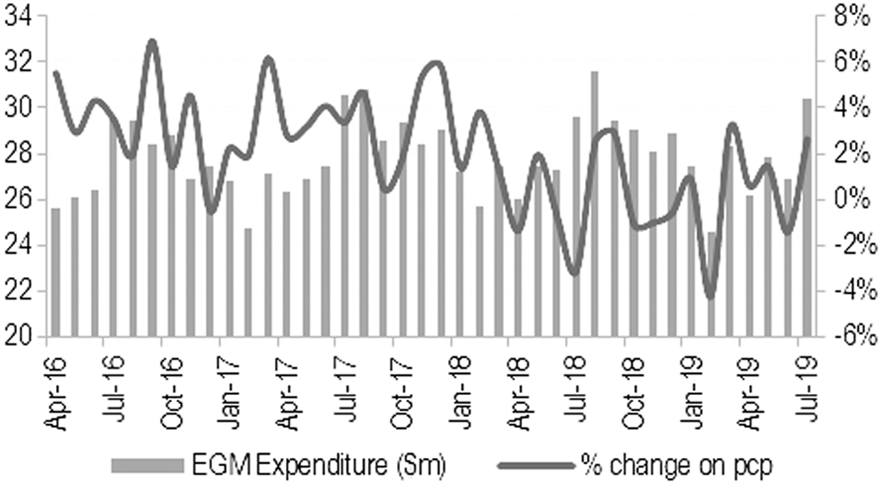
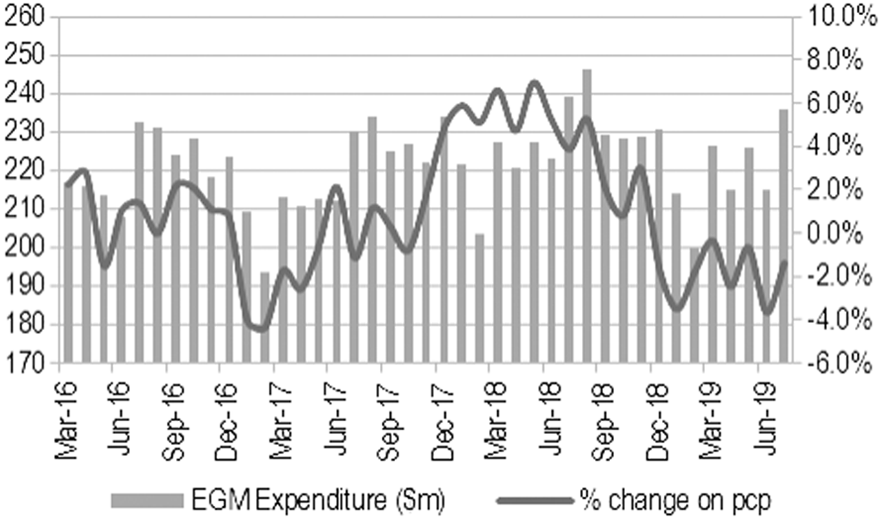
We also review spend at the state and city level below and note that, Queensland electronic gaming machine (EGM) (Figure 11) data has June expenditure down 0.4% on the prior comparable period (pcp) with Brisbane down 3.5% and Gold Coast (Figure 12) down 1.4% (similar trends to Brisbane observed [Figure 13]). July faired better across all states.
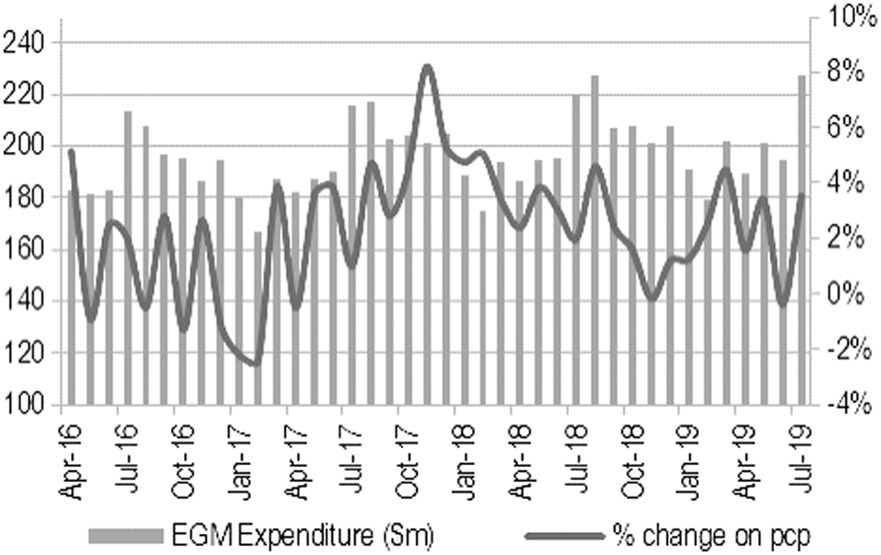
Queensland EGM Expenditure. Source: Company, J.P. Morgan.
Gold Coast EGM Expenditure. Source: Company, J.P. Morgan.
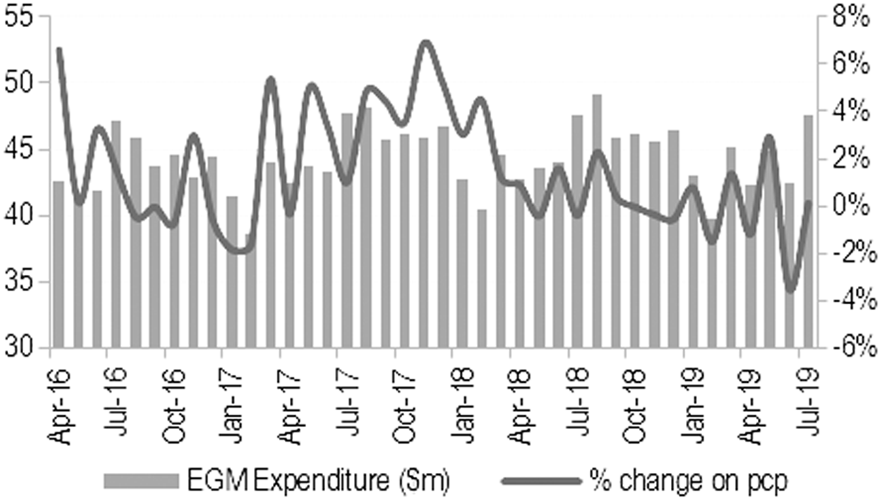
Brisbane EGM Expenditure. Source: Company, J.P. Morgan.
Additional Comments & Outlook
We highlight key feedback and commentary from the ∼80 participants in this year's survey, representing almost 35% of the Australian slot market.
The downturn in gaming spend is due to drought, low customer visitation levels (especially at low spend level), soft economic conditions, interest in EGMs, customer disposable income levels.
Implementation of cashless gaming in VIC has impacted turnover (Figure 14).
Turnover growth is weak but RTP is continuing to move in favor of the player.
Drop in retention and player spend levels is one of the main concerns as-is lack of sufficient/diversified game content e.g. low volatility, time on device, not just more hold and spin etc.
Maintaining existing machine range to attract new customers is difficult with a lack of innovation in games and too many linked products.
Clubs noting loss of market share to hotels. Concentrating on the right product mix to satisfy occupancy and providing customers with a mix of product and service that the hotels are not providing due to their size and scale will be critical.
Lower net returns, the “multi-denom” machines are reducing net returns and are not attractive to the older demographic (70% of membership at various clubs). Increased turnover and clearance rates but decreased net revenue from the new games.
Lack of competitive games from Aristocrat's competitors and the focus to have games at a higher RTP. And the lack of transparency with how the manufacturers show their RTP percentages.
Older aged machines require new product and refurbishment. Electronic Table Systems (ETS) could be the new growth area.
Losing lower tiered players as games are restructured for players who can increase their bets. Smaller players who cannot afford to get into the features are not enjoying the games.
Victoria EGM Expenditure. Source: Company, J.P. Morgan.
Trends in Australian gaming habits
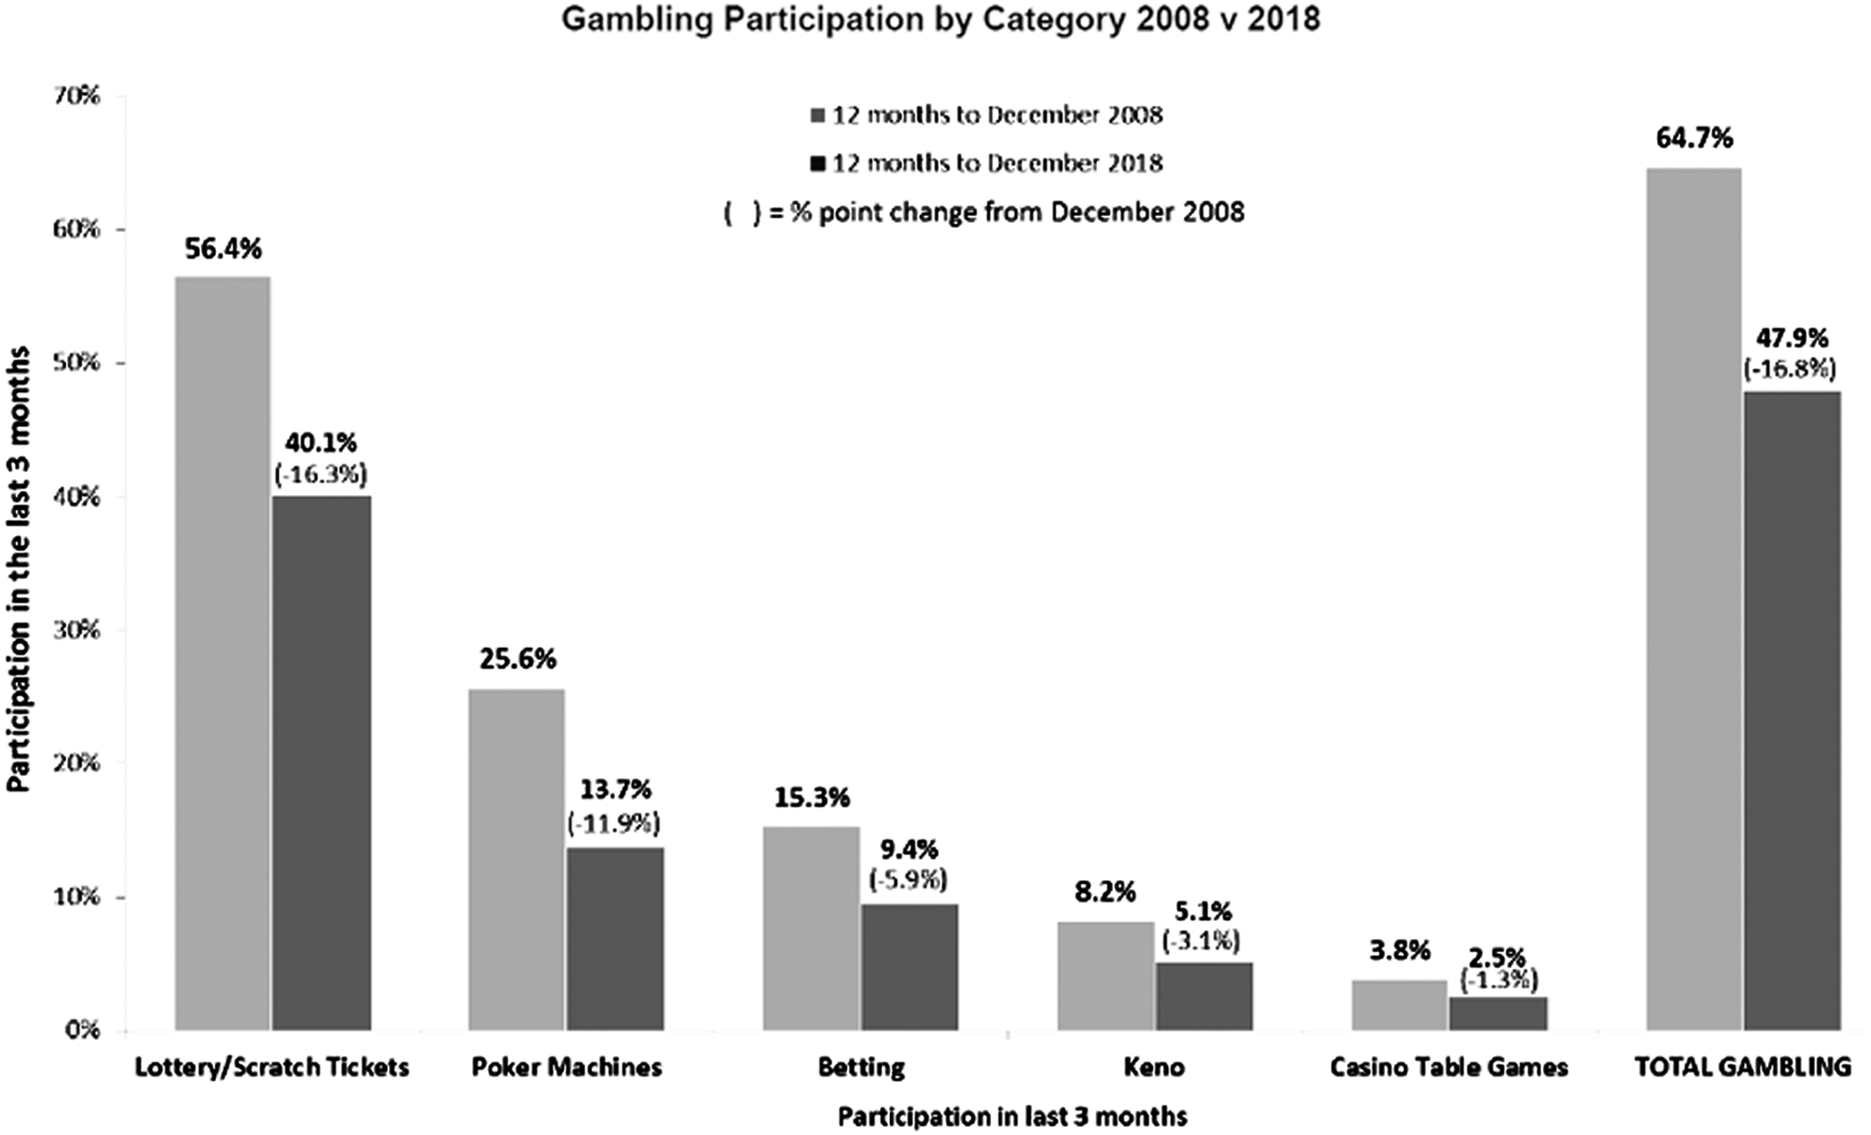
Below we note decreased participation as a general trend across ANZ (Figure 15), however this trend does not necessarily equate to reduced profits. Many gaming venues and casinos are achieving above-market growth supplemented through loyalty programs
Australian gaming habits.
Customers are coming in fewer numbers. Over the last decade, there has been a downward trend in the proportion of Australians who are gambling. In 2018, 47.9% of Australians gambled in the last three months, a 2.2% (0.3 million) drop since 2017 and a 16.8% (1.2 million) drop since 2008. This decline is greatest in poker machines and lottery/scratch tickets and is prevalent across all age groups.
A leading analytics consultancy, Forecast Analytics presented at the Australian Gaming Expo on the value of loyalty to address the top concerns (and shrinking expenditure) for gamblers in clubs/pubs/hotels/casinos. In particular, the opportunity for venues to better utilize data to improve customer attraction, retention, and share of wallet.
Footnotes
1
Donald N. Carducci and Abhinay Jeggannagari, Key Takeaways from Australian Gambling Statistics, 34th Edition, 23(5) Gaming L. Rev. 319–337 (2019).