
Abstract
Aim: To explore the association of the APOA5 gene c.553G>T polymorphism with hypertriglyceridemia (HTG) susceptibility and altered triglyceride levels. Methods: We searched the PubMed, Google Scholar, and CNKI databases for published studies relating to analyses of these associations. Case-control and comparative studies of the association between the APOA5 c.553G>T variant and altered triglyceride levels were included. In total, the meta-analysis involved 10 studies on HTG, which provided 2219 cases and 3401 controls. To measure the correlation between the c.553G>T polymorphism and HTG susceptibility, odds ratios (ORs) and 95% confidence intervals (CIs) were calculated. The overall OR was calculated using a random-effects model. Results: Compared with APOA5 c.553 GG carriers, c.553T carriers displayed an increased risk of HTG in the Asian population, with an overall random effects OR of 3.55 (95% CI: 2.46-5.13) in the dominant model. There was significant heterogeneity among the studies (Pheterogeneity: Chi2 = 45.80, I2 = 75.98%), which may be largely explained by certain patient types. Both the sensitivity analysis and publication bias suggested that the overall result was acceptable. Subgroup analysis showed a large difference in serum triglyceride levels based on the c.553 G > T polymorphism in healthy individuals and HTG patients. APOA5 c.553T carriers exhibit higher triglyceride levels than GG carriers. Conclusion: Our results suggest that APOA5 c. 553T is an independent risk factor for HTG and increased triglyceride levels in the Asian population. APOA5 c. 553T could be employed as a genetic risk marker for HTG and increased triglyceride levels.
Introduction
T
APOA5, which is located on human chromosome 11q23, consists of four exons and three introns and encodes the apolipoprotein A5 protein. The relationship between sequence variations in APOA5 and triglyceride levels in humans has been evaluated in many studies, most of which have focused on the −1131T>C (rs662799) polymorphism in the promoter region of APOA5 (Havasi et al., 2006; Cabré et al., 2010; Hadarits et al., 2011). Meta-analyses have identified a significant relationship between the −1131T>C polymorphism and triglyceride levels (Pi et al., 2012), metabolic syndrome (Xu et al., 2013), and coronary heart disease. The recently identified c.553G>T variant in APOA5 has been reported to exhibit a relationship with triglyceride levels. This variant occurs in the coding region and causes a substitution at amino acid residue 185 (rs2075291,G185C) (Tang et al., 2006). Although the APOA5 c.553T variant has been identified as a risk factor for high triglyceride events, the results have been inconsistent. As the degree of linkage disequilibrium (LD) between the −1131T>C polymorphism and c.553G>T is very low (Liu et al., 2010), the two polymorphisms might independently influence the APOA5 protein, showing a cumulative effect on plasma triglyceride levels. To allow us to draw a more reliable conclusion, in this study, a meta-analysis is performed to measure the correlation of the c.553G>T polymorphism with triglyceride levels and HTG.
Methods
Data sources and study selection
A systematic computerized search of the literature focusing on the APOA5 c.553G>T variant and its relationship with triglyceride levels was performed. The PubMed, Embase, and CNKI databases were searched by two independent reviewers (He and Lei). Following the PRISMA guidelines, related references were screened before July 2016 (Moher et al., 2009). PRISMA guidelines and checklist are shown in Supplementary Figure S1 and Supplementary Table S1 (Supplementary Data are available online at www.liebertpub.com/gtmb). The following searching terms were used: (APOA5 OR apolipoprotein A5 protein, rs2075291 OR G185C OR c.553G>T) AND (altered triglyceride levels OR hypertriglyceridemia OR HTG). For the meta-analysis of the association between the c.553G>T genotype frequency and HTG, the included studies had to meet the following criteria: a case-control or cohort design, and the published data on genotypes or allele frequencies were sufficient to calculate the odds ratio (OR) and its 95% confidence interval (CI). For the meta-analysis of differences in triglyceride levels based on the c.553G>T genotype, the inclusion criterion was the existence of receivable data on means and standard deviations.
Data extraction and quality assessment
To extract the required information, the retrieved articles were independently examined by two reviewers (He and Lei) using a data collection form. From each study, the following data were collected: first author; publication years; population studied; case-control status; triglyceride levels between c.553G>T genotypes; and the number of individuals with APOA5 c.553G>T genotypes among the cases and controls. The results of data extraction were checked for consistency with published articles, and any figures that showed discordance were verified by the two reviewers until a consensus was reached. In all of these studies, the diagnosis of cases was based on triglyceride levels ≥150 mg/dL (1.7 mM) (Nagahama et al., 2004). APOA5 c.553G>T genotypes were determined using standardized methods. In the included studies, the number of individuals with APOA5 c.553G>T genotypes had to be in Hardy-Weinberg equilibrium (HWE) with the overall group.
For the meta-analysis of triglyceride levels between c.553G>T genotypes, the criterion for screening the literature was that the mean triglyceride levels and standard deviations (SD) associated with genotype groups were available. To obtain comprehensive results, the related references cited in each of the studies were also reviewed on the chance that some published studies may not have been included in the PubMed, Embase, and CNKI databases. The following types of reports were excluded: animal studies, case reports, review articles, abstracts, reports with incomplete data, and unpublished studies.
Assessment of the methodological quality of the studies
The Newcastle-Ottawa Scale (NOS) was applied to determine the overall quality of each study. The NOS was developed for assessing the quality of case-control or cohort studies in meta-analyses (Stang, 2010). A 9-star system is used to present the scores. Studies with scores of 0-3 are considered of low quality, whereas moderate- and high-quality studies are those with scores of 4-6 and 7-9, respectively (Yang et al., 2013).
Data analysis
We performed statistical analyses using related data extracted from the included studies. To obtain reliable results, a dominant model [(TT+TG) vs. GG] was used to conduct this meta-analysis because the frequency of the TT genotype was very low. When the number of individuals with APOA5 c.553G>T genotypes among HTG cases and controls was reported in the original article, the OR, together with the 95% CIs, was calculated to estimate the association between the frequency of the APOA5 c.553G>T variant and HTG. When the mean and standard error of the APOA5 c.G553T genotype frequency were reported in the original article, the SMD (standard mean difference) and its 95% CIs were calculated to determine whether carriers of the APOA5 c.553T allele exhibit higher blood triglycerides than noncarriers. Considering that blood triglycerides may also be influenced by health conditions, and not only by polymorphisms in the APOA5 gene, we performed a subgroup analysis in subjects showing normal and abnormal triglyceride levels.
CMA2.0 software (www.meta-analysis.com/index.php) was used to produce an overall estimate of the major effect. To determine the heterogeneity between the included studies, I2 statistics was used. p < 0.01 was considered to indicate significant heterogeneity between studies. An I2 value of 0 indicated no heterogeneity; 25% indicated low heterogeneity; 50% indicated moderate heterogeneity; and 75% indicated high heterogeneity (Higgins and Thompson, 2003). An I2 value of 0 indicates that all of the variability in the effect estimates is due to sampling error within the studies, while 20% of the variability may be attributable to between-study variation (Higgins and Thompson, 2002). The impact of heterogeneity in a meta-analysis may depend on factors such as the sample size and clinical and methodological diversity (Higgins and Thompson, 2002). Because a random-effects model can provide a more conservative evaluation when heterogeneity exists within or between studies (Fleiss, 1993), this type of model was employed for this meta-analysis. Under the random-effects model, the overall effect may not been influenced by any one of the included studies. The relative weights assigned under random effects will be more balanced (Supplementary Fig. S2). The pooled ORs and 95% CIs are presented graphically as forest plots. In a typical forest plot, each square area in the chart represents one study, with the size being proportional to the weight (the inverse of the study variance) (Lewis and Clarke, 2001). The corresponding CI is indicated with a horizontal line running through the square. At the bottom of the chart, a diamond represents the overall estimate, whose width is consistent with the corresponding CI (Lewis and Clarke, 2001).
Meta-regression was conducted in the meta-analysis to examine the impact of moderator variables on heterogeneity using regression-based techniques (Thompson and Higgins, 2002). Sensitivity analysis was performed to determine whether a single study could influence the overall meta-analysis. Sensitivity analysis was performed by recalculating the overall ORs, getting rid of a single study each time.
Funnel plots were generated to measure the publication bias of the topic in the meta-analysis. When the funnel plot is symmetric, there is no publication bias. We also use Begg's test (Begg and Mazumdar, 1994) and Egger's test (Egger et al., 1997) to determinate the publication bias. Potential publication bias is statistically indicated with a significance level of 0.1. p > 0.1 indicates that there is no publication bias.
Results
Literature search
The study selection process is shown in Figure 1. A total of 408 published studies were screened using the indicated search strategy (Wang et al., 2013). Three hundred fifty-four articles were removed because they were duplicates or not relevant. Fifty-four potentially relevant published studies were selected for analysis. Based on the screening of titles or abstracts, the data from 32 reports were not included because they did not exhibit a case-control or cohort design. After reading the full text of the remaining 22 articles, three studies were excluded because the triglyceride levels in case or control groups did not meet the criteria of increased levels of triglycerides. Another three studies were excluded because the standard deviation of triglyceride levels based on the genotype was not available. In addition, four studies were excluded because they focused on the relationship between c.553G>T and other diseases. Ultimately, 12 studies were analyzed in this work (Kao et al., 2003; Matsunaga et al., 2007; Qiu et al., 2007; Chien et al., 2008, 2009; Pullinger et al., 2008; Liu et al., 2010; Abulizi et al., 2011; Li et al., 2011; Lee et al., 2013; Chiou et al., 2015; Khovidhunkit et al., 2016).

Selection process for the studies included in the meta-analysis of the APOA5 gene c.553G>T variant and high plasma triglyceride levels.
Assessment of the methodological quality of the studies
The details of the scores for the 12 original studies included in the meta-analysis of the relationship between the c.553G>T genotype frequency and HTG are shown in Table 1. Based on the quality assessment according to the NOS, all of these studies were of high quality.
A study can be awarded a maximum of one star for each numbered item (yes, *; no or not reported, 0).
1: Adequate definition of cases: with independent validation.
2: Representativeness of the cases: consecutive or obviously representative series of cases.
3: Selection of controls: community controls.
4: Definition of controls: no history of disease (endpoint).
5: Study controls for the most important factor.
6: Study controls for any additional factor.
7: Ascertainment of exposure: secure record (e.g., surgical records).
8: Same method of ascertainment for cases and controls.
9: Non-response rate: same rate for both groups.
Study characteristics
The main characteristics of the study populations are summarized in Table 2. The majority of the studies were performed in Chinese populations, while one was conducted in an Asian American population, and one assessed a Japanese population. All of these studies were retrospective case-control or comparative studies. In the selected studies, the population size ranged from 212 to 847, and a total of 5249 middle-aged participants were involved. Among these studies, triglyceride levels (mg/dL) according to different c.553G>T genotypes in control or case groups were recorded in four studies.
HTG, hypertriglyceridemia.
Main analysis
The association between c.553G>T and HTG risk is shown in Figure 2. There was significant heterogeneity between the included studies (Pheterogeneity: Chi2 = 45.80, I2 = 75.98%). According to the random-effects model, the results of the meta-analysis suggested that there was an increased risk of HTG in individuals who were APOA5 c.553T carriers. Overall, the pooled OR was 3.55 (95% CI: 2.46-5.13) for the dominant model. We also found that serum triglyceride levels were significantly associated with the c.553G>T polymorphism in healthy individuals, as shown in Figure 3. The minor 553T allele of the polymorphism was associated with higher serum triglyceride levels. The subgroup analysis showed that there was a strong relationship between serum triglyceride levels and the c.553G>T polymorphism in healthy individuals and HTG patients.
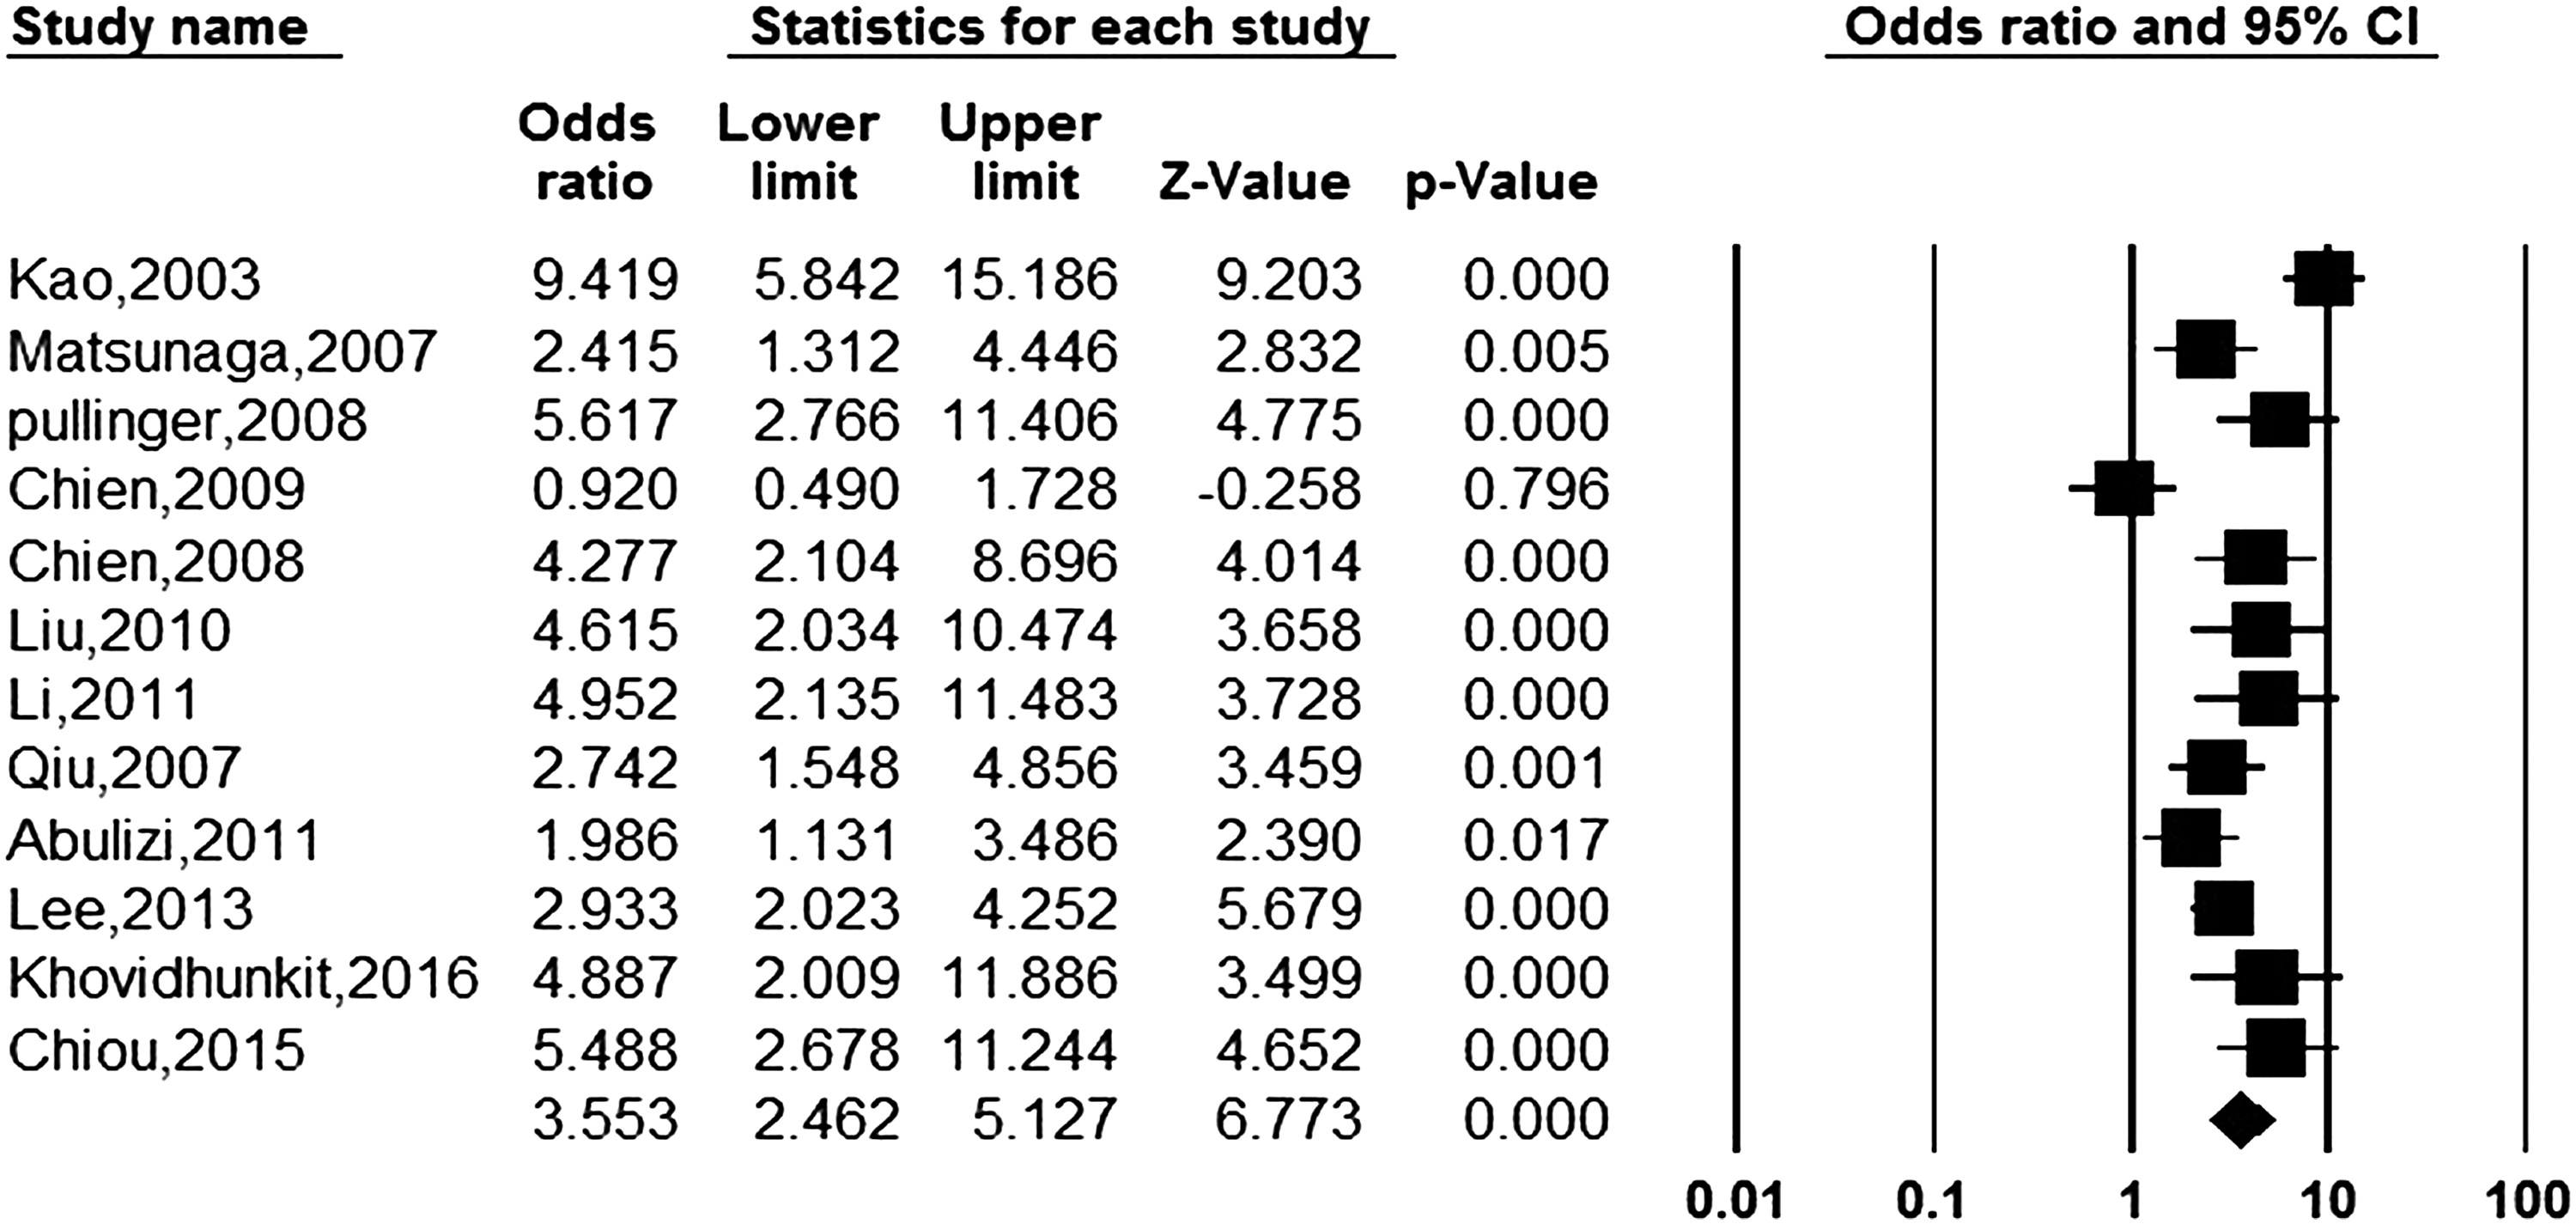
Meta-analysis of the association between APOA5 c.553G>T and HTG risk. The study group column includes the author and publication year. Using a dominant model, ORs were calculated to determine whether APOA5 c.553T carriers exhibit an increased risk of HTG. The solid squares indicate the associations in each of the included studies; the diamonds represent the whole effect. The overall ORs and their 95% CIs were estimated with the random-effects method. HTG, hypertriglyceridemia; OR, odds ratio.
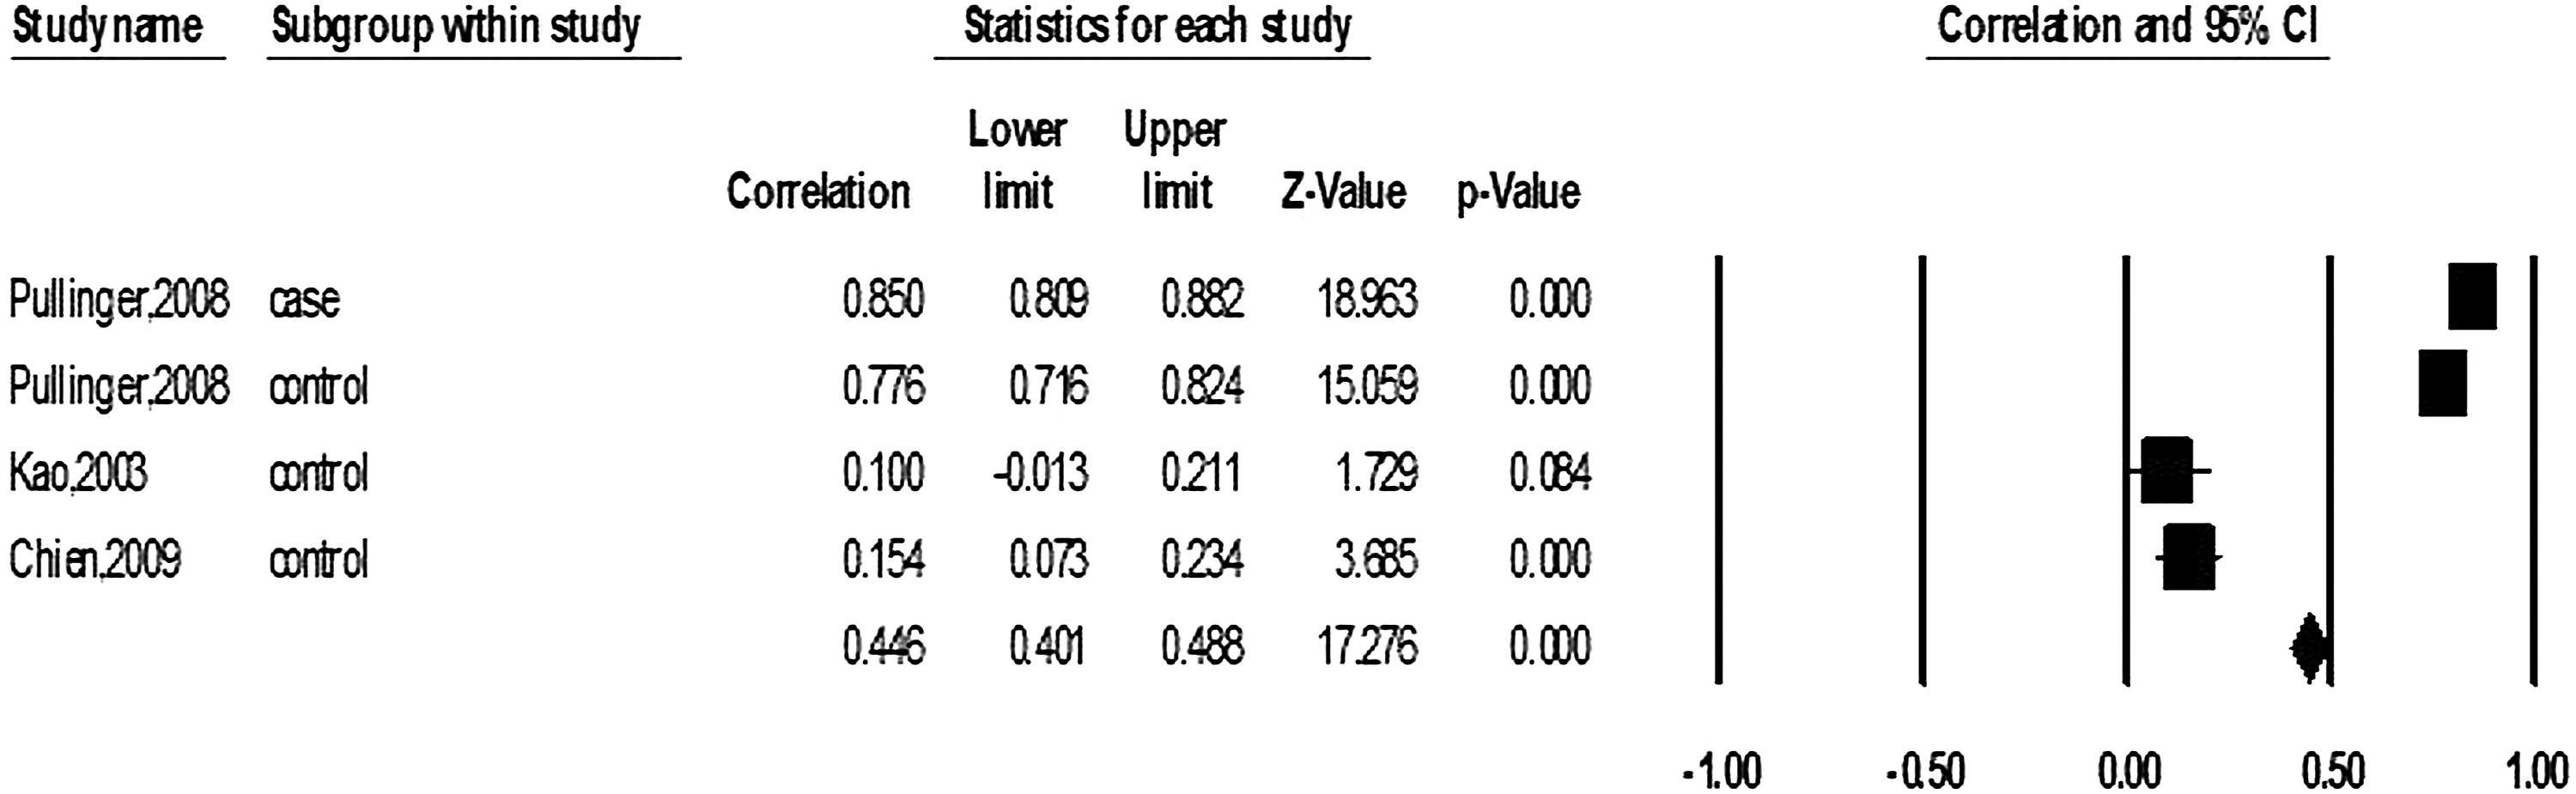
Triglyceride levels according to the c.553G>T genotype in the control and case groups. The study group column includes the author and publication year. The solid squares indicate the mean differences (MDs) in each included study. MDs were calculated to determine whether APOA5 c.553T carriers exhibit high triglyceride levels in different groups. The overall MDs and their 95% CIs were estimated with the random-effects method.
Evaluation of heterogeneity
To explore the sources of heterogeneity, as shown in Figure 2, we performed a subgroup analysis by ethnicity (Asian or Japanese); however, the heterogeneity remained significant. To further examine whether the year of publication, total sample size, and patient definition represented sources of heterogeneity between studies, a meta-regression analysis was conducted. These moderators were analyzed individually. We found that the patient definition (Pmeta-regression = 0.00002) could influence the initial heterogeneity.
Sensitivity analysis
Figure 4 shows the results of the sensitivity analyses for the dominant model in the overall population. The overall results were not greatly altered when any single study was excluded. However, when two studies, Kao 2003 and Chien 2009, were excluded, the heterogeneity was decreased (Pheterogeneity: I2 = 23.80%). The definition of patients involved dyslipidemia with high triglyceride levels in Chien's study and triglyceride levels over 400 mg/dL in Kao's study, which are significantly different from the standard definition of patients (≥150 mg/dL (1.7 mM)); thus, the patient type may be a source of heterogeneity in the analysis. This result is consistent with findings of the meta-regression analysis presented above.
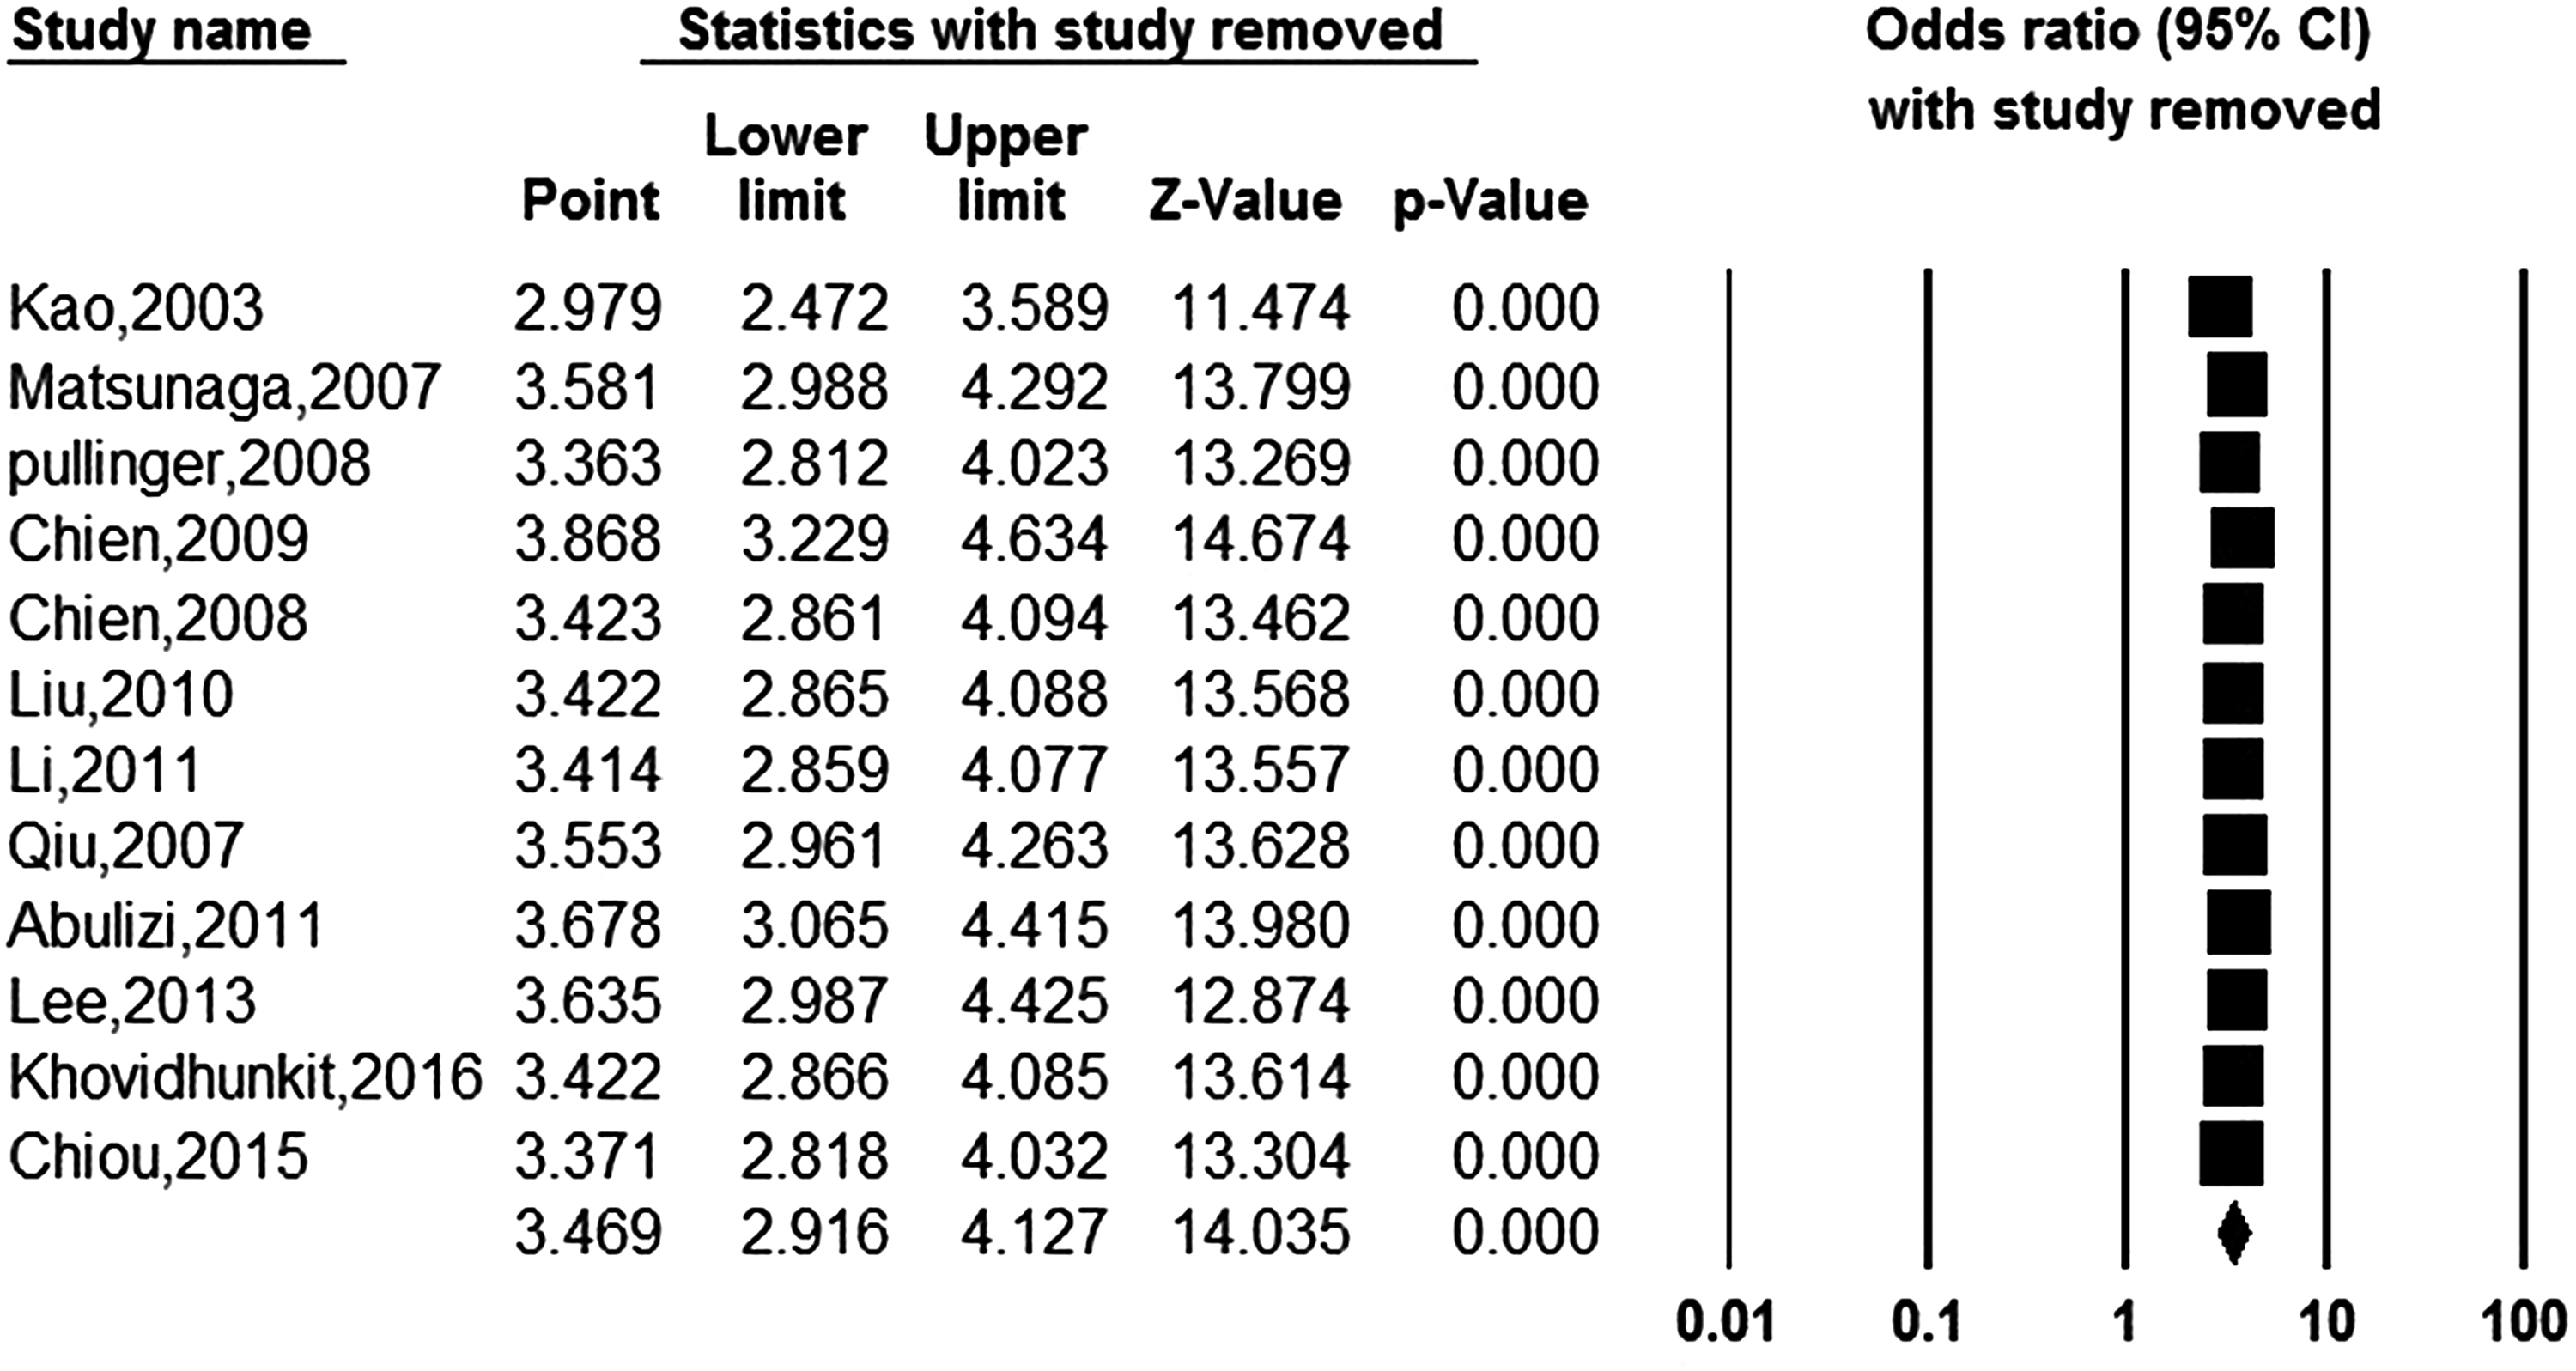
Sensitivity analysis with each study removed. The results of the analysis of the influence of a single study on the overall result are shown. The solid squares crossed by horizontal lines indicate the pooled ORs and their 95% CIs.
Publication bias
A symmetric funnel plot is displayed in Figure 5, according to a dominant model examining the APOA5c.553G>T polymorphism and the overall risk of HTG. No significant publication bias was found using Egger's test (p = 0.38 for the dominant model) or Begg's test (p = 0.17, for the dominant model).
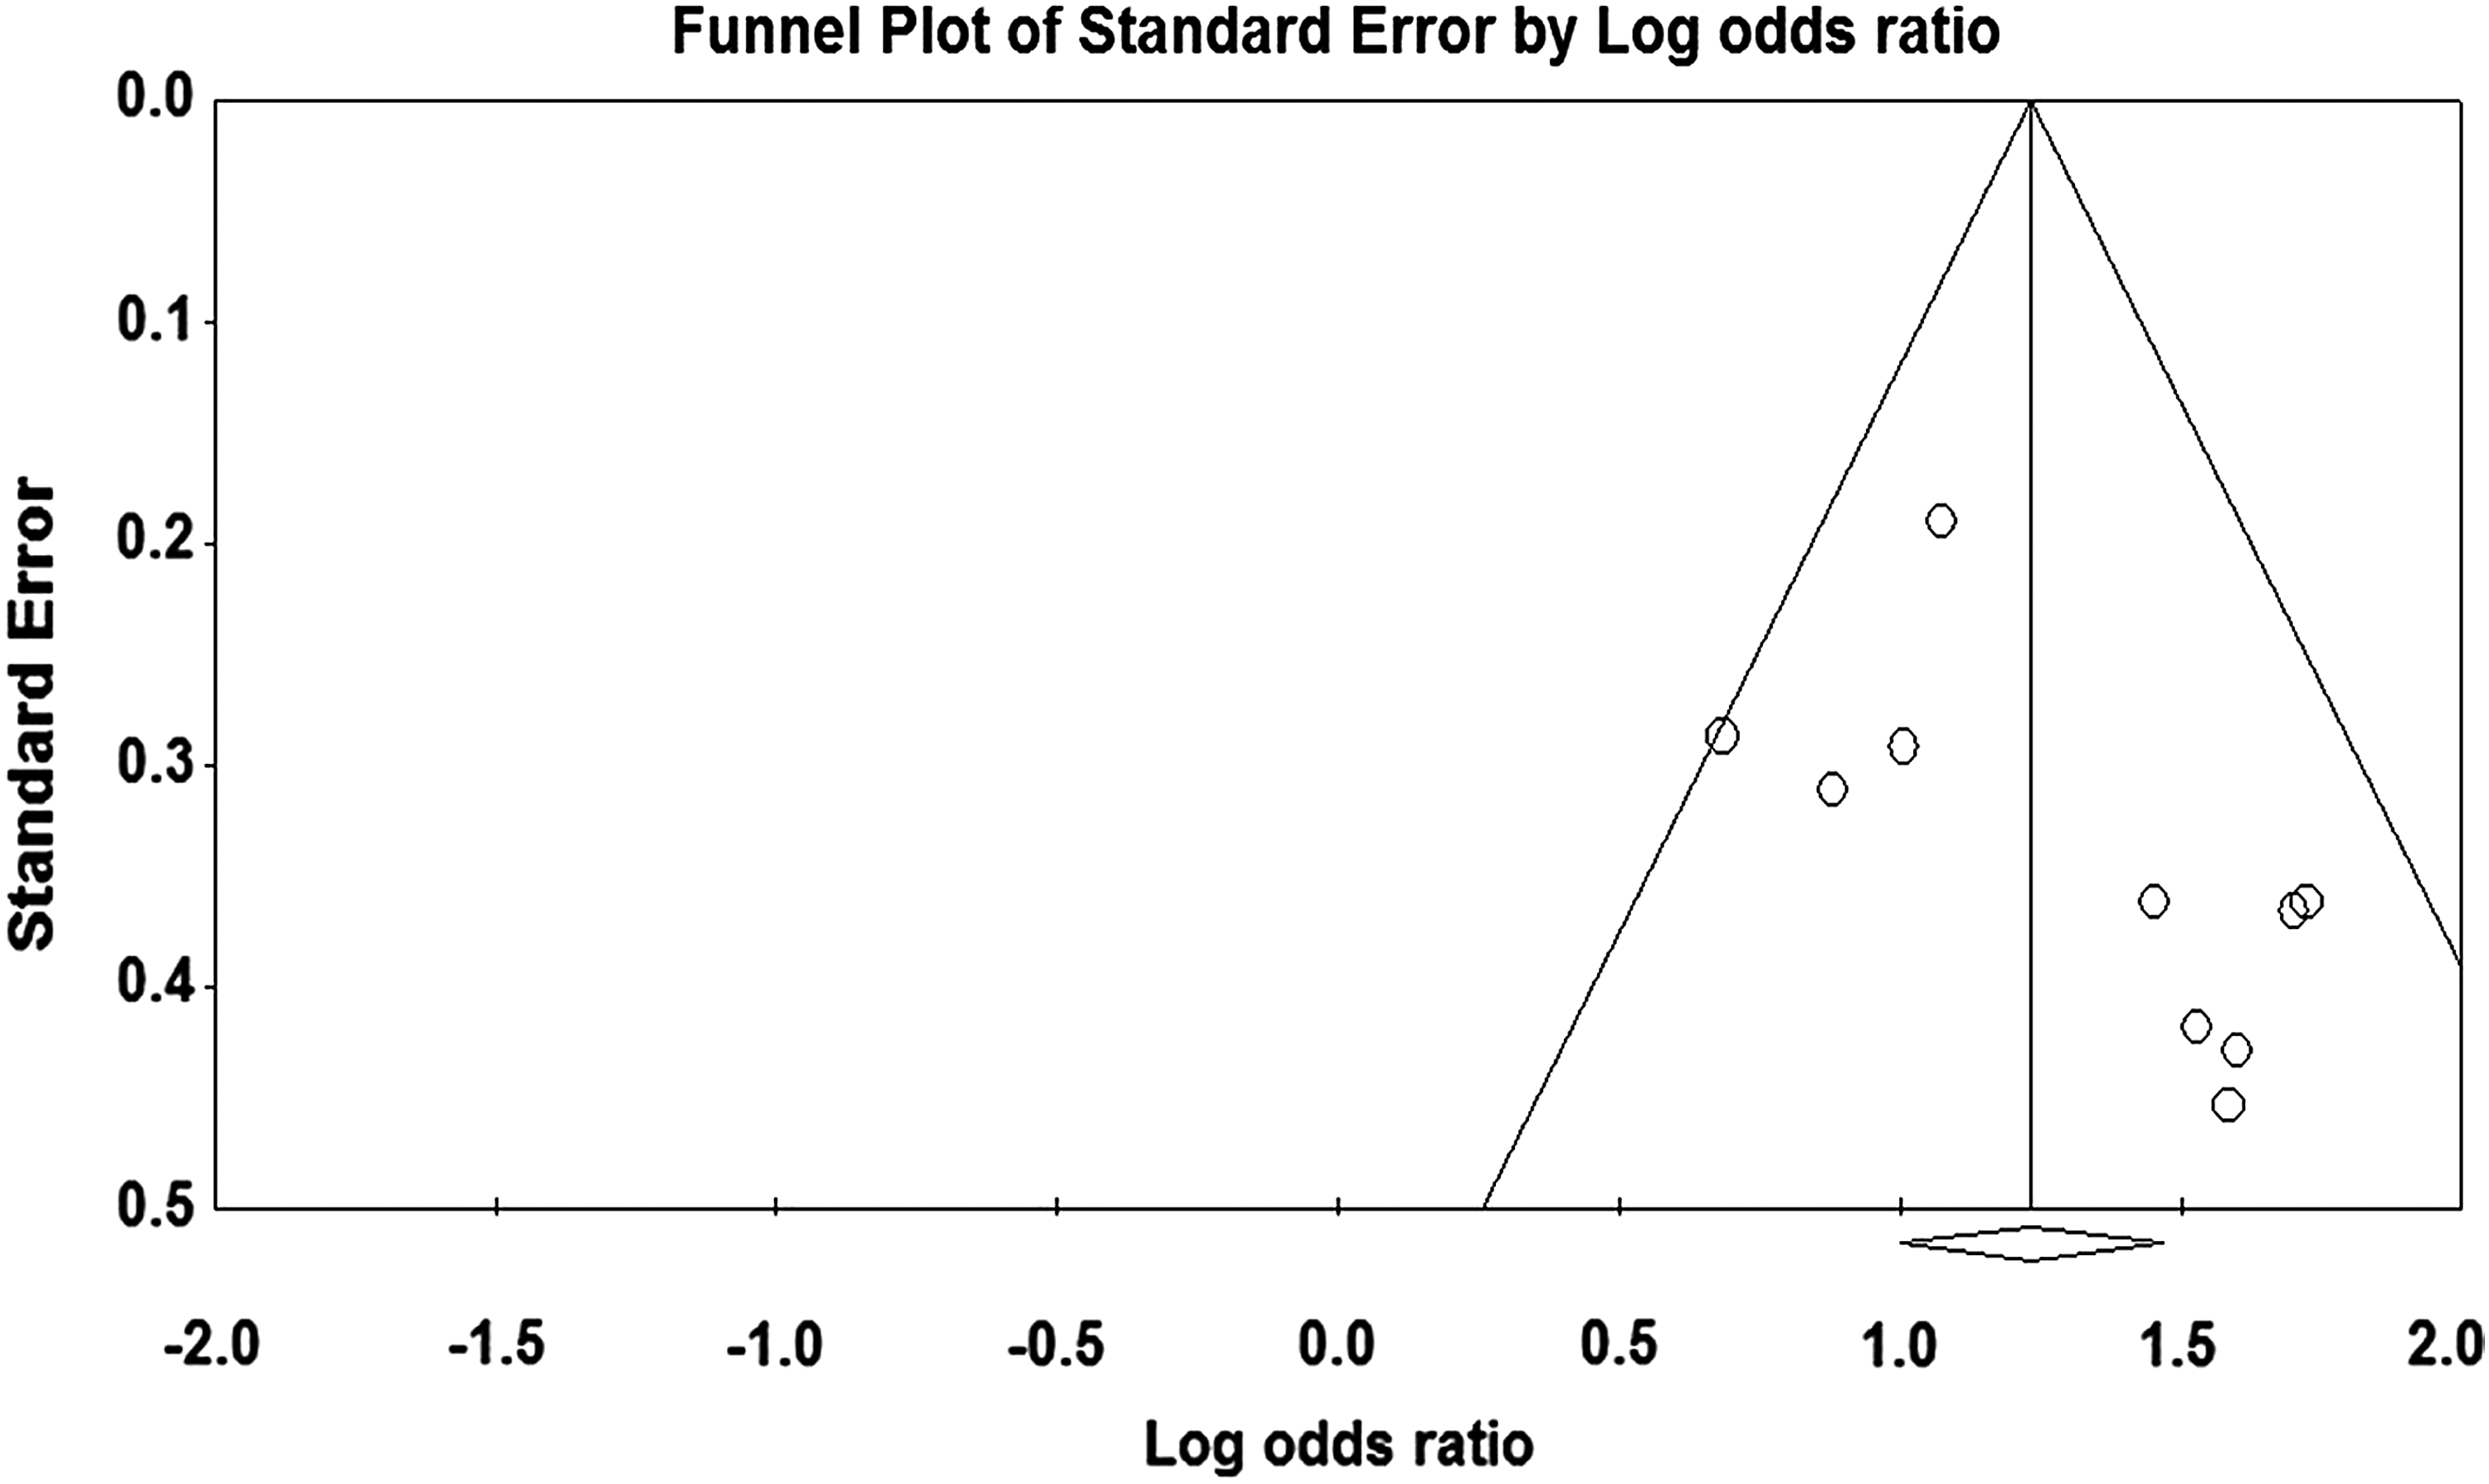
Funnel plot of the association between APOA5 c.553G>T and HTG risk in the overall study population. Each circle represents a separate study for the indicated association. The diamonds represent the overall effect.
Discussion
To our knowledge, this is the first meta-analysis of case-control and comparative studies on the relationship between APOA5 c.G553T and the risk of HTG. In total, the meta-analysis involved 12 studies on HTG, which provided 1892 cases and 3357 controls. The results of the present analysis suggested that the APOA5 c.553T allele is associated with an increased risk of HTG (OR = 3.53). Both the sensitivity and publication bias analyses suggested that the overall results were receivable. In the HTG patient group, the triglyceride levels of 553T allele carriers were significantly higher than those of noncarriers. We also found that serum triglyceride levels were significantly associated with the c.553G>T polymorphism in healthy individuals (based on three studies). These results suggest that the c.553T allele might be an independent risk factor for HTG and increased triglyceride levels.
It has been reported that APOA5 may play an important role in triglyceride metabolism based on animal and human studies (Pennacchio and Rubin, 2003) (Aouizerat et al., 2003; Lai et al., 2003). The lipoprotein lipase (LPL) activity can be stimulated by APOA5 overexpression, which enhances the lipolysis of triglyceride-rich lipoproteins (Merkel et al., 2005). Genome-wide association studies have shown that the APOA5 locus has the most incontrovertible influence on plasma triglyceride levels (Kathiresan et al., 2009). Previous research has mainly focused on the −1131T>C polymorphism or other variants in the same LD block as the APOA5 gene (Kluger et al., 2008). As the degree of LD between the −1131T>C polymorphism and c.553G>T is quite low (Liu et al., 2010), the two polymorphisms might independently influence the APOA5 protein. However, in one study, it was shown that neither polymorphism can directly affect APOA5 expression (Matsunaga et al., 2007). In another study, the strength of the association between the frequency of c.553G>T and HTG was found to be stronger compared with −1131T>C (Kao et al., 2003). In this study, we carried out a meta-analysis to measure the association between the c.553G>T polymorphism and HTG. Our meta-analysis results suggest a strong relationship between the c.553G>T polymorphism and HTG, as well as increased triglyceride levels. Our findings demonstrated that c.553T might be an independent risk factor for HTG and increased triglyceride levels. Because a complicated phenotype may be caused by many genes or genotypes, we speculate that c.553T and −1131C might have a cumulative effect on triglyceride levels. Further studies are needed to clarify this point. The lipid interface binding ability of the APOA5 protein may be determined by discrete domains (Weinberg et al., 2003). There is a conservative domain in APOA5 from residues 171 to 188 that is necessary for its lipid binding ability (Weinberg et al., 2003). Residue 185G of human APOA5 has been shown to be indispensable through site-directed mutagenesis, with all variants of the 185 residue exhibiting reduced LPL activation compared with wild-type APOA5, resulting in a loss of TG modulation (Huang et al., 2012). Our significant results are consistent with this report.
In our meta-analysis, only Asian study populations were considered, and there are currently no published association studies on c.553G>T and triglyceride levels in other populations. The c. 553G>T polymorphism is common in the Chinese population (minor allele frequency: 0.037-0.06 according to HapMap), but rare in the European population (minor allele frequency: 0.014 according to HapMap), and it was undetectable in a Caucasian population in one study (Hubacek et al., 2004).
This study has several deficiencies. First, only published studies were included in our meta-analysis, and it is known that an article with positive results is more likely to be published. Hence, publication bias likely remains in the results, although no remarkable publication bias was observed based on Egger's tests. Second, there were only three studies comparing triglyceride levels between different APOA5 c.G553T genotypes in a healthy control population. To obtain more credible results, additional studies could be included.
Conclusion
Our results suggest that APOA5 c. 553T is an independent risk factor for HTG and increased triglyceride levels in the Asian population. Further research involving a large sample size will be necessary to confirm the results in other populations. APOA5 c. 553T might be used as a genetic risk marker for HTG and increased triglyceride levels.
Footnotes
Acknowledgment
This work was funded by the National Natural Science Foundation of China (81272707).
Authors’ Contributions
Hongjuan He made substantial contributions to the design, data analysis, and article writing. Lei Lei had been involved in acquisition of data. Jing Dong modified the grammar and format of article. Erfei Chen verified the accuracy of data. Kejin Zhang resolved the data analysis of strategy. Jin Yang was the corresponding author and directed the thesis topic and final version to be published.
Author Disclosure Statement
No competing financial interests exist.
References
Supplementary Material
Please find the following supplemental material available below.
For Open Access articles published under a Creative Commons License, all supplemental material carries the same license as the article it is associated with.
For non-Open Access articles published, all supplemental material carries a non-exclusive license, and permission requests for re-use of supplemental material or any part of supplemental material shall be sent directly to the copyright owner as specified in the copyright notice associated with the article.