
Abstract
Abstract
Ramirez-Sandoval, Juan C., Maria F. Castilla-Peón, José Gotés-Palazuelos, Juan C. Vázquez-García, Michael P. Wagner, Carlos A. Merelo-Arias, Olynka Vega-Vega, Rodolfo Rincón-Pedrero, and Ricardo Correa-Rotter. Bicarbonate values for healthy residents living in cities above 1500 m of altitude: a theoretical model and systematic review. High Alt Med Biol. 17:85–92, 2016.—Plasma bicarbonate (HCO3−) concentration is the main value used to assess the metabolic component of the acid–base status. There is limited information regarding plasma HCO3− values adjusted for altitude for people living in cities at high altitude defined as 1500 m (4921 ft) or more above sea level. Our aim was to estimate the plasma HCO3− concentration in residents of cities at these altitudes using a theoretical model and compare these values with HCO3− values found on a systematic review, and with those venous CO2 values obtained in a sample of 633 healthy individuals living at an altitude of 2240 m (7350 ft). We calculated the PCO2 using linear regression models and calculated plasma HCO3− according to the Henderson–Hasselbalch equation. Results show that HCO3− concentration falls as the altitude of the cities increase. For each 1000 m of altitude above sea level, HCO3− decreases to 0.55 and 1.5 mEq/L in subjects living at sea level with acute exposure to altitude and in subjects acclimatized to altitude, respectively. Estimated HCO3− values from the theoretical model were not different to HCO3− values found in publications of a systematic review or with venous total CO2 measurements in our sample. Altitude has to be taken into consideration in the calculation of HCO3− concentrations in cities above 1500 m to avoid an overdiagnosis of acid–base disorders in a given individual.
Introduction
A
High altitude can be defined as >1500 m (4921 ft) over the sea level, given that at this altitude a state of hyperventilation occurs due to the fall in partial pressure of inspired oxygen (PO2) decreasing the partial pressure of carbon dioxide (PCO2) as the minute ventilation increases (Bernardi et al., 2006; Paralikar.and Paralikar, 2010; Hackett and Roach, 2012; Goldfarb-Rumyantzev and Alper, 2014). According to the Henderson–Hasselbalch equation, the extracellular fluid alkalinization induced by the drop of plasma PCO2 is compensated by a fall in the concentration of HCO3−. Moreover, it has been shown that increasing altitude produces a proportional elevation in the renal excretion of HCO3−, which occurs proportionate to elevation even at low and moderate altitude exposure (Ge et al., 2006).
Some studies have shown that the kidney is able to modify the degree of HCO3− tubular reabsorption guided by PCO2 changes, affecting its urinary excretion, to balance the chronic hypocapnic response in residents of high altitude cities (Monge et al., 1964). Nonetheless, information on the normal values of plasma HCO3− in healthy residents at high altitude is minimal.
The vast majority of clinical laboratories calculate HCO3− concentrations using the Henderson–Hasselbalch equation: cHCO3− = pH + log (PCO2 × 0.0307) − 6.095 (Ehrmeyer et al., 1997). The caveat of this procedure is that PCO2 is affected by altitude exposure; therefore, reference values that have been obtained from subjects at sea level or very high altitude (Crapo et al., 1999) may provide inaccurate results in residents of low to moderate altitude cities.
Due to the small amount of studies that address the reference values of plasma HCO3− according to altitude and given the relevance of the molecule in the clinical assessment of acid–base status, it is necessary to generate altitude-expected HCO3− plasma concentrations. The aim of this analysis is to calculate the reference concentrations of plasma HCO3− in patients living at an altitude of 1500 m or more meters using a theoretical model and compare these estimated HCO3− values with HCO3− values from residents of cities at >1500 m (4921 ft) obtained from a literature search and with those venous CO2 values obtained in a sample of healthy residents living at an altitude of 2240 m (7350 ft).
Methods
For the present analysis, we defined high altitude as 1500 m above sea level or more, in agreement with other authors and considering that at that altitude, decreased exercise performance and/or significant declines in PO2 to levels of 55 to 75 mmHg can be observed (Grocott et al., 2009).
HCO3− concentrations were calculated using the Henderson–Hasselbalch equation (cHCO3− = pH + log [PCO2 × 0.0307] − 6.095) as described in the Clinical Laboratory Standards document (Ehrmeyer et al., 1997). Also, PCO2 values were calculated using two linear regression models for acute exposure to altitude (PCO2 = 37.78 − 0.908A; where A is the altitude over the sea level in km), and after acclimatization (PCO2 = 38.3 − 2.5A), PCO2 is shown in mmHg. These equations are calculated from a linear regression model with two points, using normal PCO2 measurements in Mexico City (2240 m) and sea level showed in a previous study (Pérez Padilla and Vázquez García, 2000). “Acute exposure” refers to values from people who ascend from sea level to high altitudes in less than 1 week based on previous observations (Purkayastha et al., 1995), whereas “acclimatized residents” refers to values from people living many years in the referred city. Demographic indices were taken from the United Nations Statistics Division (United Nations Demographic Yearbook, 2013).
We compared the estimated HCO3− values with two sources: (1) the historic HCO3− values reported in healthy subjects living at >1500 m above sea level or more and (2) the venous CO2 values of 633 healthy adult permanent residents of Mexico City (altitude 2240 m [7350 ft] over sea level).
The HCO3− concentration at different high altitude locations were obtained by systematic review of literature. We searched in MEDLINE (January 1, 1950 to December 31, 2015) and LILACS (January 1, 1950 to December 31, 2015). The terms, “Blood Gas Analysis”, “blood gas”, “Acid–Base Equilibrium”, “CO2”, “PCO2”, “HCO3,” or “bicarbonate” combined with, “altitude”, ”Mexico”, “Peru”, “Colombia”, “Bolivia”, “Afghanistan”, “Ethiopia”, “Africa”, or “Guatemala” as free language terms and medical subject headings when applicable, were used in the search strategy. Included studies were those with blood gas values reported in healthy or apparently healthy adults living at >1500 m or more above sea level for years (“Acclimatized residents”) or in nonacclimatized adults (“Acute exposure”) exposed to high altitudes. The excluded studies were: (1) studies not having bicarbonate values, (2) studies based on population of less than 16 years of age, or with (3) comorbidities (obesity, chronic obstructive pulmonary disease, smokers, cardiovascular disease, etc.), and (4) studies with a small sample size, which may compromise the power and external validity of the findings (e.g., sample <10). Only English and Spanish articles were included. Duplicated citations were discarded and two independent researchers (M.F.C.P. and C.A.M.A.) eliminated irrelevant titles and abstracts. Remaining citations were extensively reviewed by both researchers. Disagreements were discussed with a third reviewer (J.C.R.S.) to reach consensus. References from relevant original articles and reviews were screened for additional citations. We independently extracted data of selected studies.
Given the reduced number of studies in the literature, we decided to compare our theoretical values with venous CO2 samples of 633 residents from the Salmex cohort. Generally, the HCO3− comprises about 95% of the total CO2 content; thus we use this measurement as an estimator of serum HCO3− (Centor, 1990). The Salmex cohort consists of adult male and female workers from the National Institute of Medical Sciences and Nutrition Salvador Zubirán, in Mexico City. Exclusion criteria were: history of congestive heart failure, renal or hepatic disease, intestinal resection, diuretic initiation in the previous 5 days, active infection, pregnancy, lactation, currently smoking (33/666), and previous known or de novo diagnosis of hypertension, chronic kidney disease, or diabetes mellitus. All participants received a detailed explanation of the tasks to be undertaken and appropriate containers for a 24-hour urine collection. A later appointment was scheduled for complete medical history, physical examination, nutritional and body composition evaluation, and laboratory work-up, which included delivery of the 24-hour urine collection and a fasting blood sample.
Venous blood samples were drawn without use of a tourniquet. All samples were sent immediately to the laboratory and analyzed using ion-selective electrode technology developed for monitoring CO2 in human blood (Beckman Synchron CX® 5, Fullerton, CA). The variation coefficient of the test was 3%.
All procedures were conducted according to the Declaration of Helsinki guidelines and approved by the Institutional Biomedical Research Review Board (number 09/191). Written informed consent was obtained from all subjects before baseline data and sample collection.
CO2 results are presented as mean standard deviation for normally distributed data or median interquartile range (IQR) for non-normally distributed data. The Mann–Whitney U test was used for comparison of CO2 according to gender. A linear regression model fitted to the change of HCO3− with altitude was used to compare the slopes between HCO3− reported in literature and the theoretical model. Bland–Altman analysis was performed to evaluate the agreement between HCO3− estimated and HCO3− described in literature. All the documented data were analyzed using the SPSS 21 program (Chicago, IL) and GraphPad Prism 6 (San Diego, CA). The results were considered statistically significant when p < 0.05.
Results
As seen in Tables 1–3, there is a decrease in HCO3− concentration as the altitude increases, with the lowest value measured from the highest city in our list. All mean values of PCO2 and HCO3− in acclimatized residents were below 36 mmHg and 21 mEq/L, which are less than reference values reported in arterial samples taken in persons living at sea level (Emmet, 2015). The fall in HCO3− is proportional to the drop in PCO2.
Acute exposure refers to values from people who rapidly ascend from sea level, whereas acclimatized residents refer to values from people living at the city referred.
Reference values (Theodore, 2015).
Maximal altitude with HCO3− values reported (Grocott et al., 2009).
Acute exposure refers to values from people who rapidly ascend from sea level, whereas acclimatized residents refer to values from people living at the city referred.
Reference values (Theodore, 2015).
Lima is located on mostly flat terrain, but the city slopes into mountain slopes located as high as 1550 m (5090 ft) above sea level.
According to the theoretical model, assuming an HCO3− value of 22.9 mEq/L at sea level and a pH of 7.40, for each 1000 m of altitude above sea level, there is a decrease of 0.55 mEq/L in people with an acute exposure to elevation (95% CI 1.45–1.51). In acclimatized people, the decrease is 1.5 mEq/L per each 1000 m (95% CI 5.2–5.8) (Fig. 1).
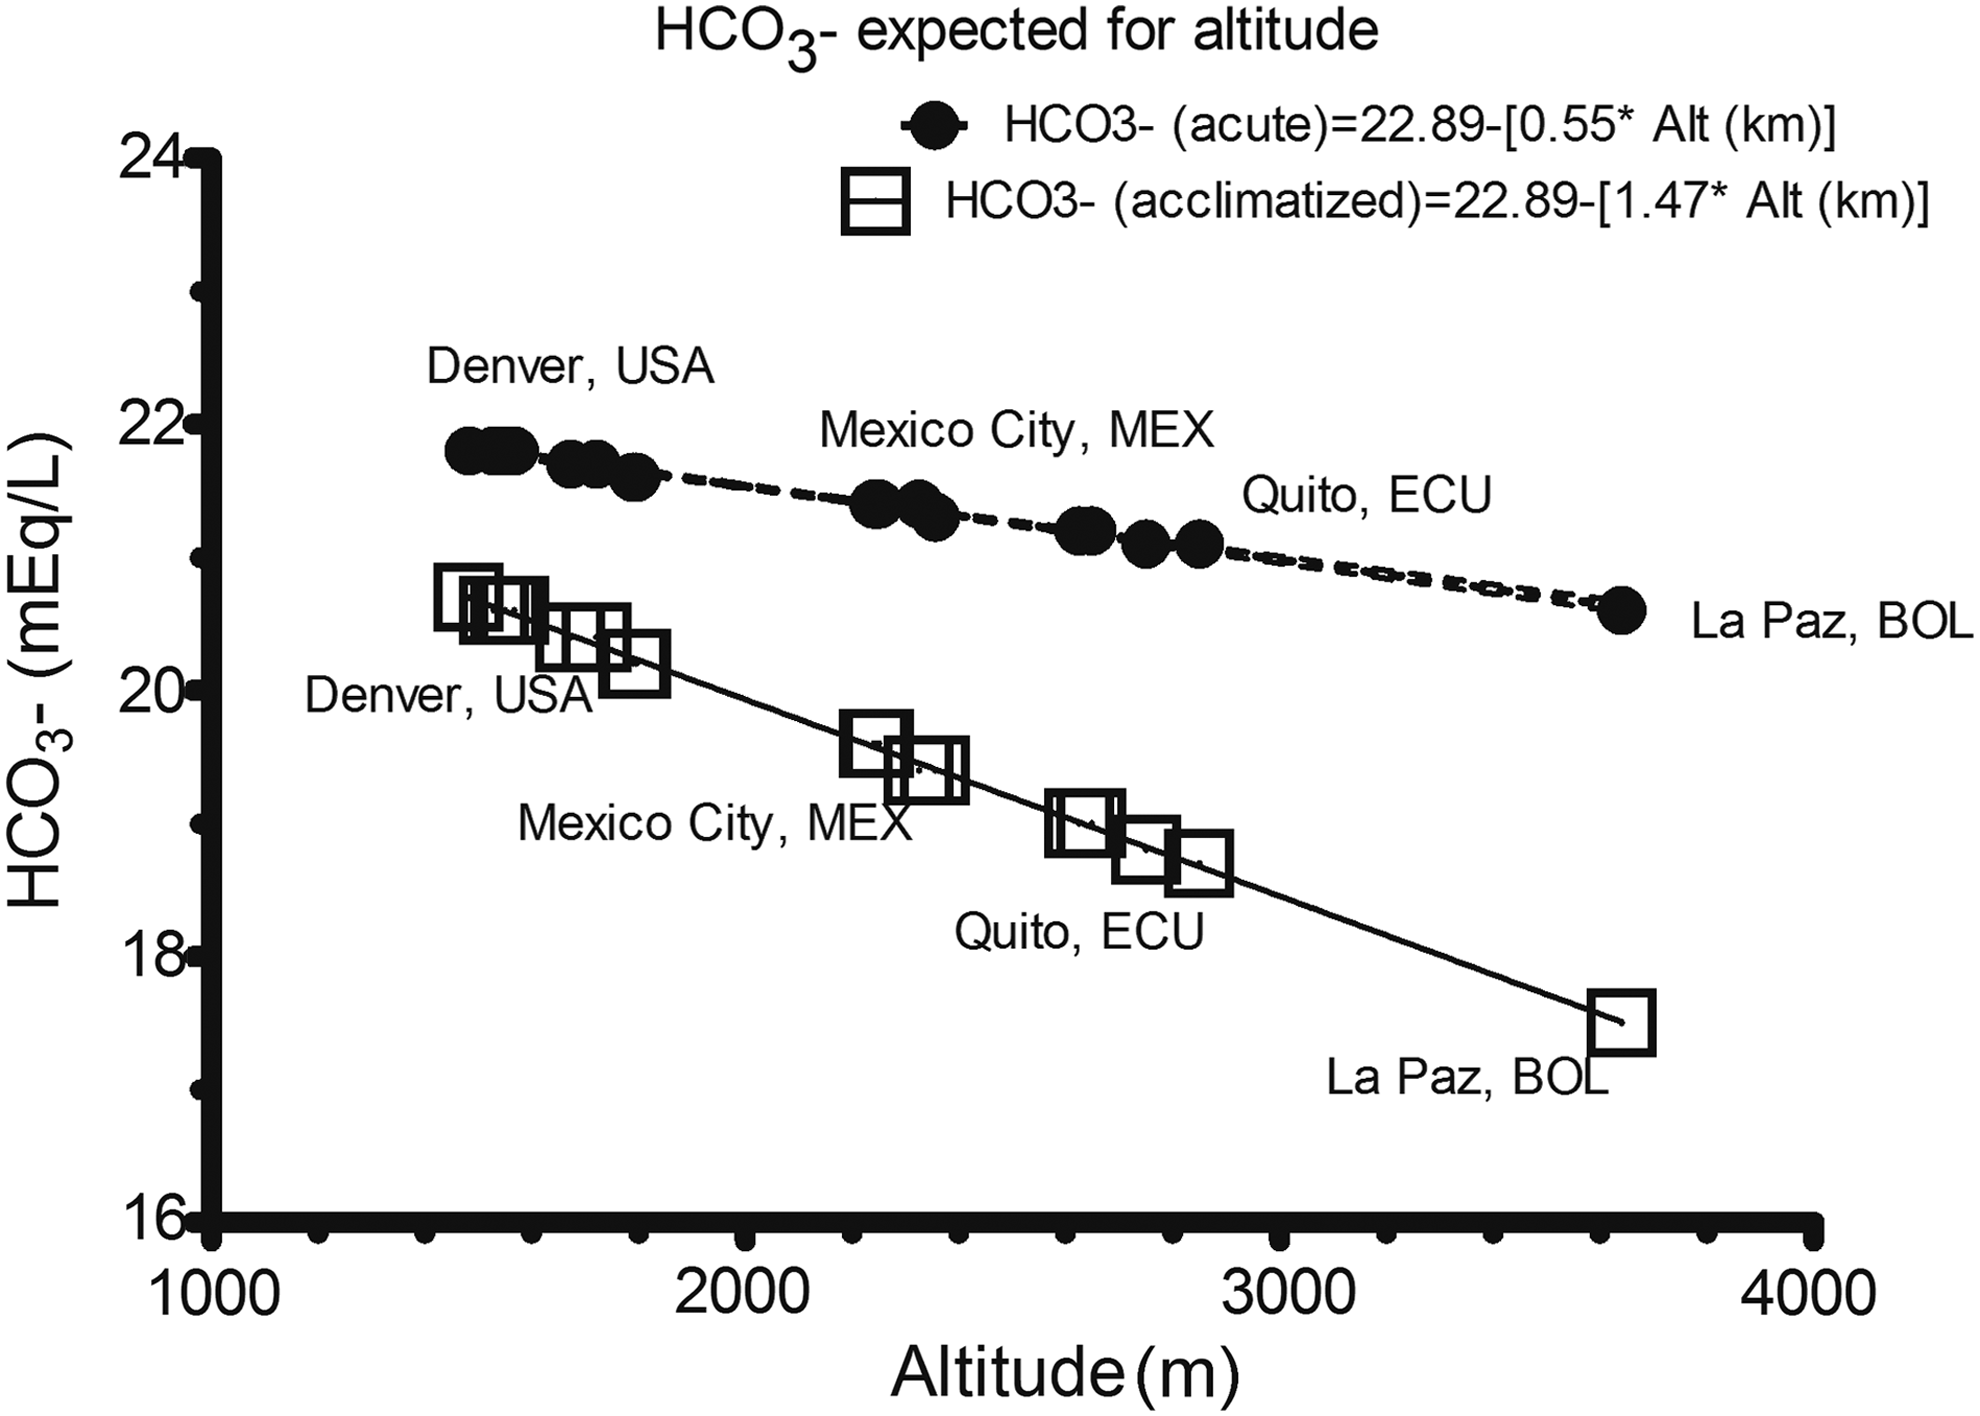
Bicarbonate values expected for altitude.
HCO3− in “Acute exposure” to altitude = 22.89 − (0.55 ± 0.01 × altitude in km).
HCO3− in “Acclimatized” = 22.89 − (1.47 ± 0.01 × altitude in km).
Estimated HCO3− values were compared with those obtained in a systematic review of the literature. Our research identified 965 studies of which 752 did not meet inclusion criteria. The reasons for exclusion were no HCO3− values (169), incomplete information (22), subjects with less than 16 years of age (6), and inclusion of patients with pulmonary or cardiovascular diseases (3). A total of 13 studies were considered for further analysis. Data in “Acclimatized” subjects are reported separately from “Acute exposure” subjects. Studies are summarized in Tables 4 and 5. Gaps were identified in the published literature: small samples, poor definition of populations, great variability in values of HCO3−, and heterogeneity in protocols and methods. One small study, excluded in Table 4, was relevant as it is the only field measurement of ABGs at 8400 m (“the balcony,” Mount Everest), and reported mean concentrations of HCO3− 10.8 mEq/L in four well-acclimatized subjects, similar to our estimated HCO3− of 10.3 mEq/L (Table 1) (Grocott et al., 2009).
Study of Ge et al. (1994).
ND, no data; SD, standard deviation.
We estimated a linear regression model including this last study.
The model calculated from the systematic revision was:
HCO3− in “acclimatized resident” (obtained from literature) = 24.43 − (1.64 ± 0.26 × altitude in km).
HCO3− in “acute exposure” (obtained from literature) = 32.81 − (2.54 ± 0.83 × altitude in km).
The slopes for change in HCO3− according to altitude were not statistically significant when we compare the theoretical model and the reported values of the literature (Figs. 2 and 3). Bland–Altman plot using differences between HCO3− estimated and HCO3− reported in literature revealed a bias of 1.05 mEq/L (standard deviation 1.6 mEq/L) and the limits of agreement were −2.097 and 4.203 mEq/L, with a span of 6.3 mEq/L. Out of 20 values, 19 (95%) were within the limits of agreement (Fig. 4).
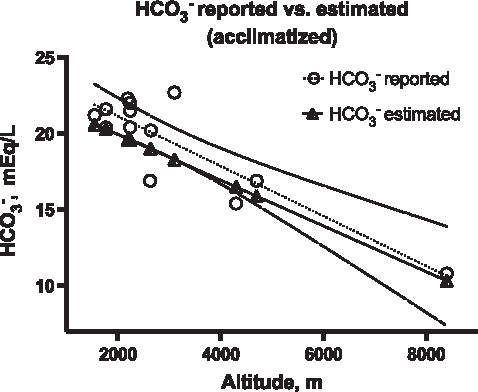
Linear regression model calculated from HCO3− values reported in literature and HCO3− estimated according to our theoretical model in acclimatized residents. The comparison between the two slopes was not significant (p = 0.09).
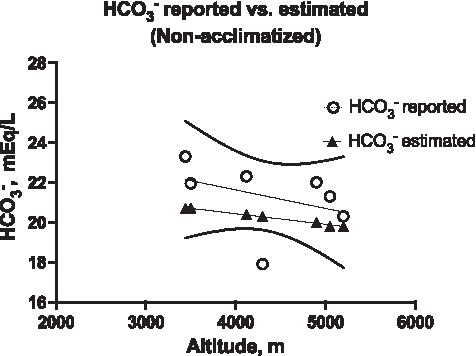
Linear regression model calculated from HCO3− values reported in literature and HCO3− estimated according to our theoretical model in nonacclimatized or acute exposure subjects. The comparison between the two slopes was not significant (p = 0.19).
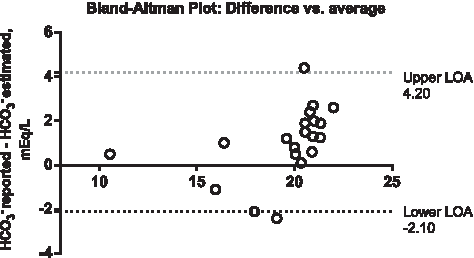
Bland–Altman plot of average of HCO3− estimated and HCO3− reported versus the difference between the two methods in mEq/L. LOA, limit of agreement.
To compare HCO3− estimated values with a large sample of subjects, we measured CO2 values from venous samples of 633 healthy residents at 2240 m (7350 ft), 433 (68%) of them were female and the mean age was 38 years ± 10 years. The total CO2 content had a non-normal distribution, the median CO2 value was 22.3 mEq/L (IQR 20.7–24.9). These values were slightly superior to the HCO3− predicted value of 19.1 mEq/L in acclimatized residents of Mexico City. Median total CO2 levels were 23.4 and 22.0 in males and females, respectively (p < 0.0001) (Fig. 5). Of all CO2 values, 95% were between 19.6–26.9 mEq/L. Using a reference value between 22–30 mEq/L for total venous CO2, 277 healthy patients (44%) had a venous CO2 less than 22 mEq/L and could have been subjected to unnecessary tests.
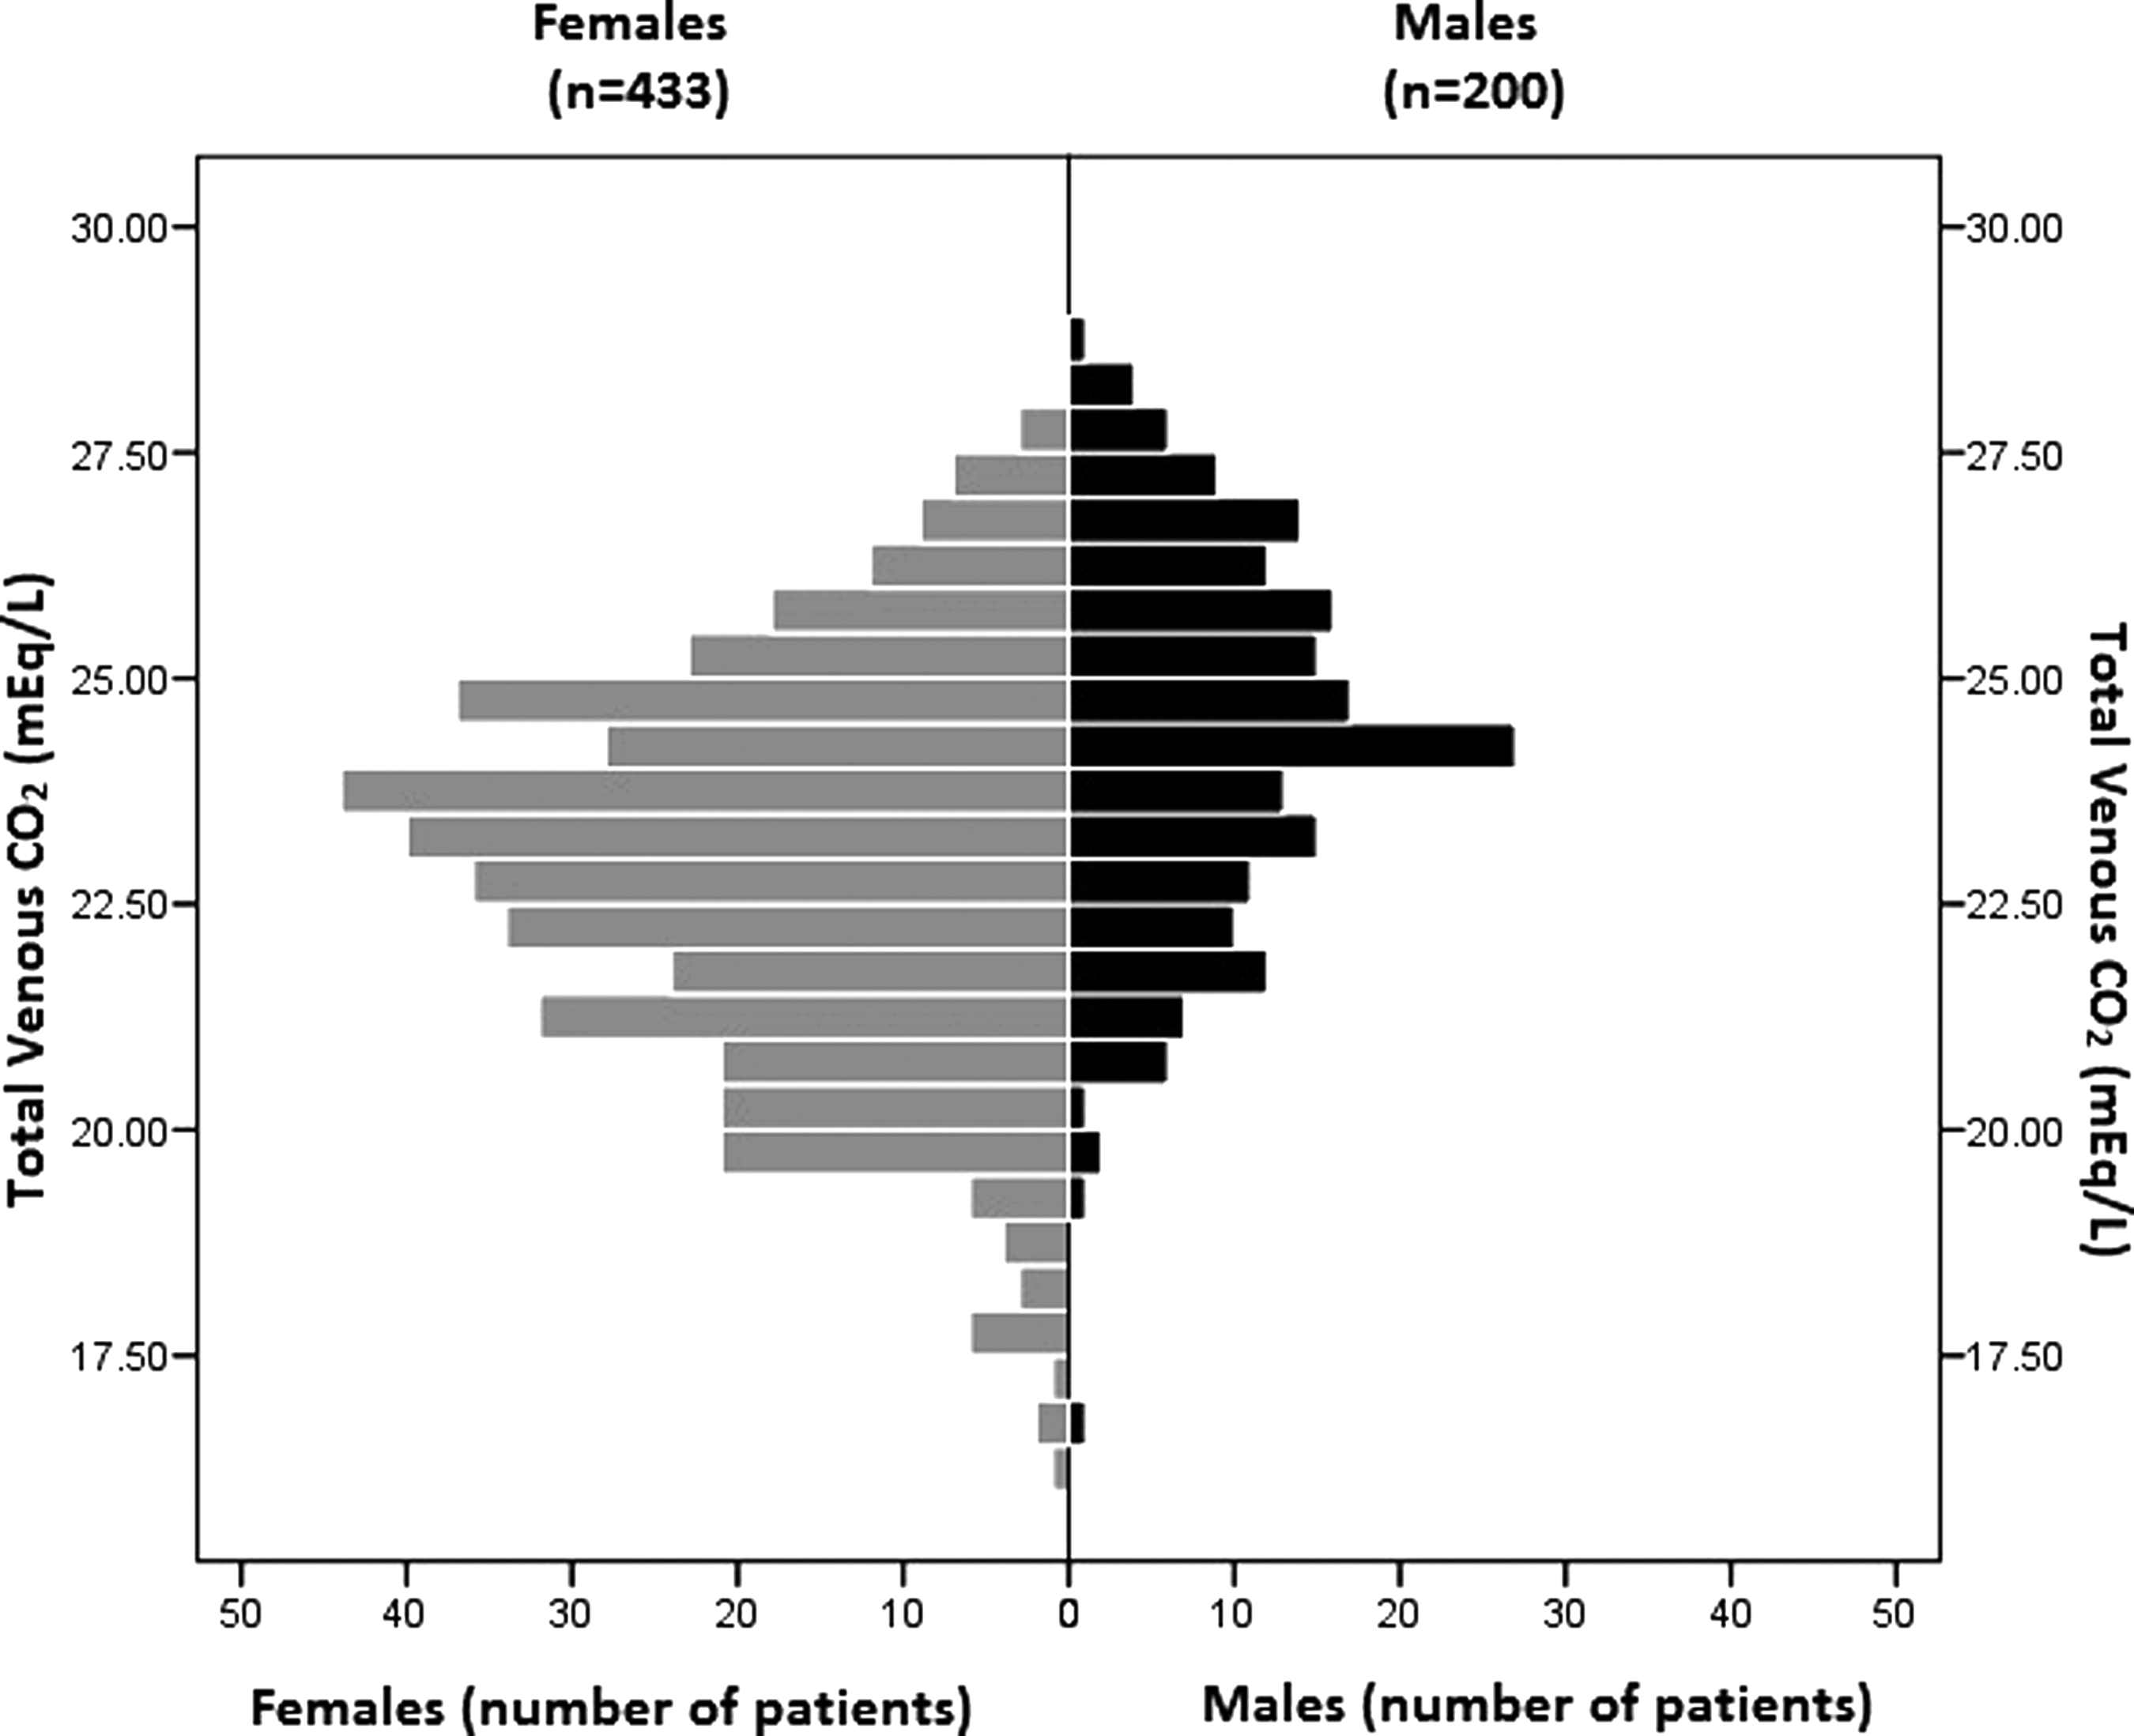
Horizontal mirrored histogram with total venous CO2 in 633 residents living at 2240 m (7350 ft) according to gender. Median total CO2 levels were 23.4 and 22.0 in males and females, respectively, and 277 values (44%) were less than 22 mEq/L.
Discussion
We hereby present the calculated mean HCO3− values in healthy residents living at different altitudes according to the Henderson–Hasselbalch equation. These values are consistent with data obtained in a sample of healthy residents and with other data summarized in 13 publications. Our equation, utilized to obtain bicarbonate values in acclimatized patients, is similar to another proposed by Zubieta-Calleja in which HCO3− = 24.32 − (1.8 × altitude in km) (Zubieta-Calleja et al., 2011). Using Bland–Altman analysis, the difference in means (bias) between HCO3− values estimated and reported in literature was almost 1 mEq/L, a difference clinically unimportant. In general, all healthy acclimatized residents living at 1500 m or more above sea level will show lower PCO2 and HCO3− compared with residents at sea level under physiological circumstances and with a normal pH (7.40 ± 0.05).
The plasma bicarbonate concentration [HCO3-] is widely used to assess the acid–base status of patients. Using the traditional method based in the use of bicarbonate to interpret metabolic disturbances (Rose and Post, 2001), a healthy person living at a specific altitude over sea level may be subject to unnecessary diagnostic procedures to find a medical cause of a mixed acid–base disorder (respiratory alkalosis and metabolic acidosis with normal anion gap), or, according to other authors, compensated respiratory alkalosis, other than considering a healthy physiological adaptation to altitude. Although it is possible that by using Stewart's approach (Kurtz et al., 2008) this error can be avoided, one physician using the traditional bicarbonate-based method can overdiagnose acid–base disorders in people living at or visiting high altitudes with healthy physiological adaptation.
In medicine, some clinical guidelines take into account a specific HCO3− value either for diagnosis or as a goal of treatment, without emphasizing the effects of geographic altitude in their recommendations. For example, there is a consensus to recommend that patients with chronic kidney disease and with HCO3− <22 mEq/L use alkali therapy, including NaHCO3− (Loniewski and Wesson, 2014); in ketoacidosis, specific HCO3− values have been proposed for classification of severity and for goals of treatment (Nyenwe and Kitabchi, 2011) and low HCO3− values could be related to overdiagnosis of entities such as renal tubular acidosis in cities with high altitude (Muñoz-Arizpe et al., 2012). None of these recommendations takes into account altitude over sea level of the tested individual in their analysis.
The information available about the bicarbonate values in persons at altitude is scarce. The majority of cities that we have listed belong to low and lower middle income countries, with lower medical publication rates than countries with higher incomes (Akre et al., 2011). Surprisingly, in some reviews and articles in those countries, their recommendations to diagnose acid–base disorders ignore the effects of altitude (Secretaría de salud, 2010; Márquez-González et al., 2012).
The agreement between measured total venous CO2 and HCO3− and whether both can be used interchangeably has long been discussed (Chittamma and Vanavanan, 2008; Kumar and Karon, 2008). Our results of venous CO2 levels in healthy residents of altitude may be different compared with the real values of HCO3− obtained from venous and ABGs (Lolekha et al., 2003) especially when HCO3− value is equal to or less than 20 mmol/L (Nasir et al., 2010). Nevertheless, low CO2 values were observed in this sample, in some cases, lower than 18 mEq/L.
Our study has limitations. The values described in all tables must be taken with caution as they represent theoretical estimates and may vary from true values. The small sample of the studies in the literature can be a source of error. Sex is not considered for reference values of HCO3− and women may have lower levels of HCO3− according the CO2 value results. Calculations started from the estimated barometric pressure derived from the altitude. However, actual barometric pressures may differ due to geographical and atmospheric conditions. Our HCO3− values are still open for discussion and have to be tested in every city with high altitude. We expect that our observation may favor other groups to perform specific investigations to better understand acid–base physiology and document normal values for individuals living at different altitudes.
In conclusion, HCO3− values need to be interpreted according to altitude above sea level as well as to an individual's time of exposure to an altitude. Physicians that attend to patients living at elevated cities have to be aware of this and remain careful in assessing acid–base disorders when using algorithms recommended for people that live at sea level unless specific, corrected, formula-generated values are validated for this purpose.
Footnotes
Acknowledgment
The study was supported by a nonrestricted research grant from Instituto Danone, Mexico.
Author Disclosure Statement
No competing financial interests exist.