
Abstract
Abstract
Kosaku, Kazuhiro, Tomonori Harada, Toyoharu Jike, Isao Tsuboi, and Shin Aizawa. Long-term hypoxic tolerance in murine cornea. High Alt Med Biol 19:35–41, 2018.
Aims:
The cornea is believed to be an exceedingly sensitive organ to decreases in atmospheric oxygen concentrations. Previous corneal studies have shown the hypoxic tolerance of the cornea during short-term and local hypoxic exposure. This study investigated the tolerance of the cornea during long-term and systemic hypoxia.
Methods and Results:
Mice were bred under normobaric normoxia or hypoxia (10% oxygen concentration) conditions for 140 days. The layer structure, surface microvilli, and glycogen granules in the corneal epithelium were examined on day 2 and on day 140. The layer and surface structures of the corneal epithelium were normally maintained during the long-term hypoxia. Hypoxic stress caused a decrease in the glycogen granules in the corneal epithelial cells.
Conclusions:
Maintenance of normal structures during long-term hypoxia suggests that the cornea has a high tolerance for hypoxic stress. The quantity of glycogen in corneal epithelial cells is considered an index of corneal hypoxia resistance.
Introduction
I
Unlike other organs in the body, the cornea, which is located in the outermost part of the eyeball and does not contain any blood vessel tissue, primarily takes in oxygen from the atmosphere. Therefore, a decline in the oxygen concentration directly and immediately affects the health of the cornea. When wearing contact lenses, this can diminish the oxygen supply from pre-corneal air to the cornea, thereby resulting in corneal hypoxia. Thus, consideration of corneal hypoxia tolerance plays an important part in the development of new contact lens designs.
Previous studies have investigated the minimum pre-cornea oxygen concentration levels that are necessary to avoid corneal impairment, including the critical ranges of 1.5%–2.5% (Polse and Mandell, 1970) or 3.3%–5.5% (Mandell and Farrell, 1980). Thus, when the oxygen concentration falls to levels that are too low for human survival, the cornea can still survive during these strict conditions. Uniacke et al. (1972) investigated the reason for this high hypoxia tolerance and demonstrated that corneal epithelial cells are able to rapidly produce energy via the use of glycogen storage in the cytoplasm as an emergency energy source during low oxygen conditions (2% or lower over a 120-minute period).
However, the previous studies that examined hypoxic conditions are quite different from the conditions found in the highland areas of the earth, as they only examined intense low oxygen concentrations, local pre-cornea hypoxia, and the short-term exposure. In addition, previous investigations have yet to definitively study corneas that are exposed to systemic and long-term hypoxia. Therefore, this study histologically and histochemically investigated murine cornea during long-term systemic hypoxia.
Materials and Methods
Mice
Female C57BL/6 mice at 8–10 weeks of age were used. All animal experiments were approved by the Nihon University Animal Care and Use Committee (approval No. AP09 M001-2, AP13 M042) and were humanely performed in accordance with the Nihon University Rules regarding Animal Care and Use.
Hypoxic environment breeding
The mice were bred in a chamber designed for small animals (Physio-Tech, Tokyo, Japan). The mice of the hypoxic group were kept in a chamber where the oxygen density was maintained at 10% through the use of the PRO:OX oxygen regulator (BioSpherix Ltd., Lacona, NY). Mice in the normoxic group were kept under atmosphere conditions. On day 2 and day 140 after the exposure to hypoxia, three mice from each group were euthanized by the cervical dislocation method followed by enucleation of the eyeballs. These animals were also used to investigate hematological factors that we have reported on in a previous study (Harada et al., 2015).
Histological analysis
Light microscope
Eyeballs were fixed in 4% paraformaldehyde and 2.5% glutaraldehyde in 0.1 M cacodylic buffer solution (pH 7.4) for 30 minutes immediately after enucleation. The cornea scleral rims were then excised from the eyeballs and then fixed in the same fixation solution overnight, followed by a further 1-hour fixation in 1% osmium tetroxide in 0.1 M cacodylic buffer solution (pH 7.4). Subsequently, after dehydration through a graded ethanol series followed by propylene oxide, the samples were embedded in Quetol-812 (Nisshin EM, Tokyo, Japan) and then sectioned with a diamond knife on a microtome. All samples were then dyed with 1% toluidine blue.
Scanning electron microscope
The cornea scleral rims were fixed and dehydrated via the same procedures used for the light microscope (LM) analysis. Subsequently, the samples were further immersed in isoamyl acetate, dried, and coated with platinum palladium. The central corneal epithelial surface and the endothelial side were observed by using a scanning electron microscope (SEM) (HITACHI S4000; Hitachi High Technology, Tokyo, Japan). Three visual central fields of the endothelium were observed by SEM (magnification × 500) and assigned a valuation of the endothelial cell density (ECD). After the number of endothelial cells were counted and the areas of the cells were measured by using image analysis software (Image-ProPlus 4.5.1; Nippon Roper, Tokyo, Japan), the ECD (cells/mm2) values were calculated. In addition, we also calculated the hexagonal cell rate for the same areas. Significant differences among the experimental groups were assessed by using the Mann–Whitney U test. The cut-off value to determine statistical significance was p < 0.01.
Glycogen analysis
Ultrathin sections were cut from the same embedded samples used for the LM analysis. All sections were stained with bismuth subnitrate solution, which consisted of 250 mg of sodium hydroxide, 100 mg of potassium sodium tartrate, 50 mg of bismuth nitrate basic, and 2.5 mL of distilled water. The solution was applied for 30 minutes at 40°C on the observation grids of the transmission electron microscope (TEM) (JEM 1200EX; JEOL, Tokyo, Japan). After being stained by bismuth nitrate basic, glycogen could be viewed as high electron density granules (Park et al., 1977). Three visual central fields of the epithelium (magnification × 10000) were used for the valuation of the glycogen assay. The percentage of the area stained in the cytoplasm was calculated by using image analysis software (Image-ProPlus 4.5.1). Significant differences among experimental groups were assessed by using a two-way ANOVA (post hoc test: Bonferroni; p < 0.01).
Results
Light microscope
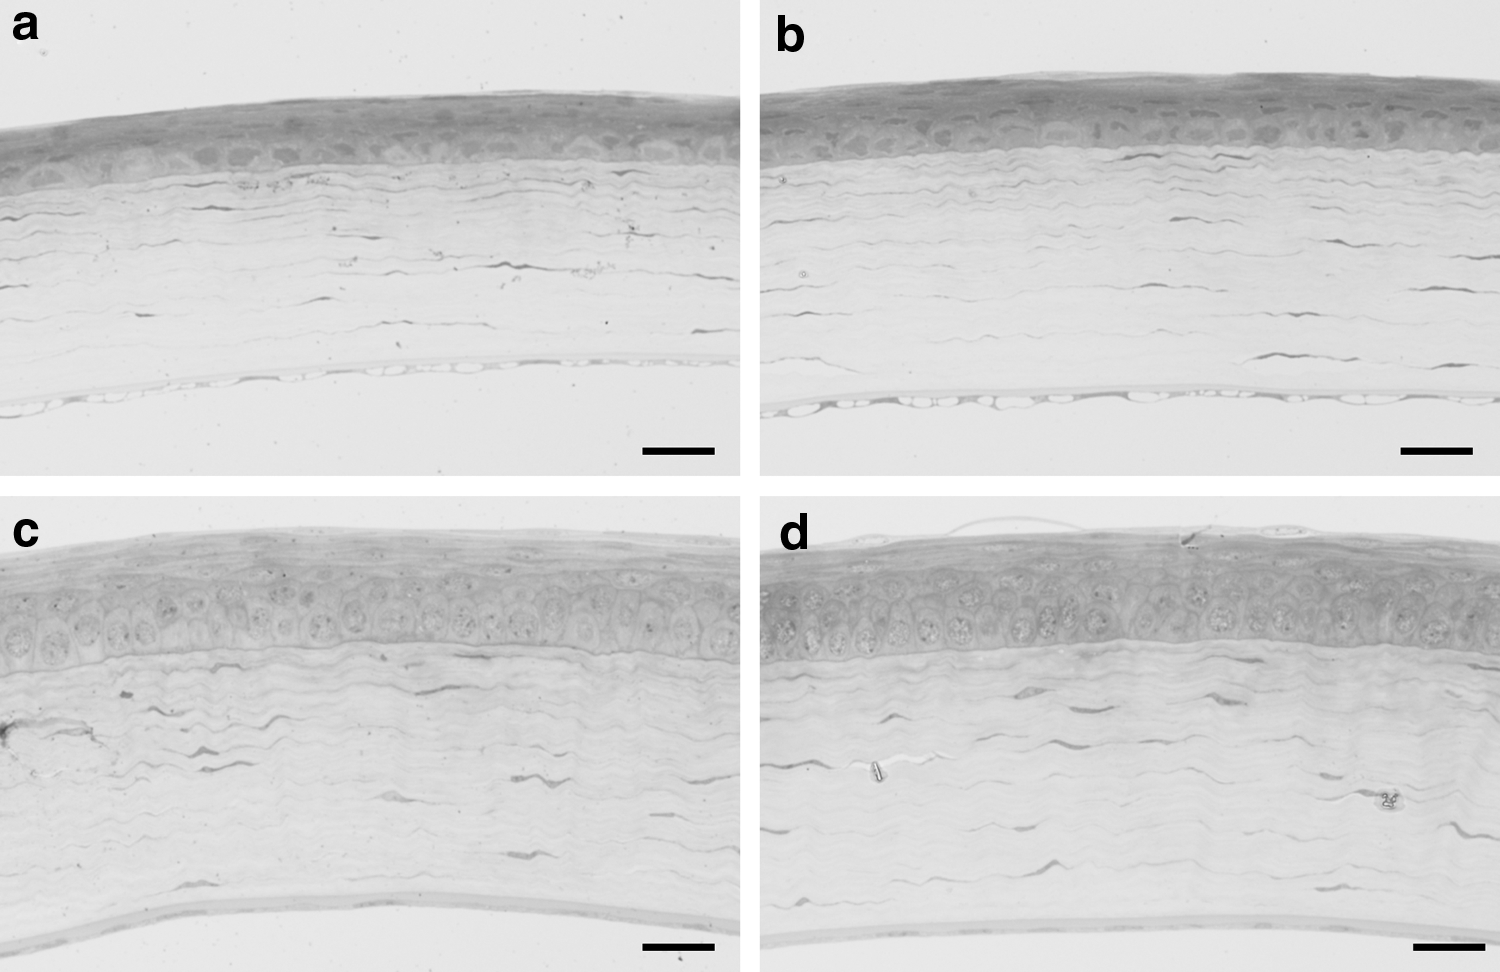
On day 2, the corneal epithelium for both the normoxic and the hypoxic groups presented with normal stratified squamous epithelium consisting of flat shape cell layers near the surface, wing shape cell layers at the middle, and a columnar cell layer in the basal area (Fig. 1a, b). The corneal stroma exhibited a well-regulated lamellar structure and some stromal cells without edema. In both groups, the Descemet's membrane and an endothelial cell layer were observed without any pathological changes at the posterior of the cornea. On day 140, the corneas of both groups maintained normal structures in each of the layers, with the thickness of the corneal epithelium, stroma, and Descemet's membrane thicker than those observed on day 2 (Fig. 1c, d). In addition, there were no corneal edema and no invasion of blood vessels into the cornea observed in either of the groups.
Microscopic findings for the cornea:
Scanning electron microscope
The corneal epithelial surfaces in both the normoxic and the hypoxic groups exhibited rich and reticulated microvilli, without any evidence of falling off of cells or extension of the intercellular space. There was no difference found for the density or the form of the microvilli, with both groups exhibiting good conditions on day 2 and day 140 (Fig. 2). On day 140, the endothelial cells of both groups formed polygonal cells with microvilli on the surface (Fig. 3). The rate of hexagonal cells was 58.0% ± 1.0% (±SD) for the normoxic group and 59.3% ± 4.0% for the hypoxic group on day 140. The ECD of the normoxic group was 4944 ± 101/mm2 whereas it was 5047 ± 101/mm2 for the hypoxic group. On day 140, there was no significant difference found for the hexagonal cell rate or the cell density between the normoxic and the hypoxic groups (Mann–Whitney U test).
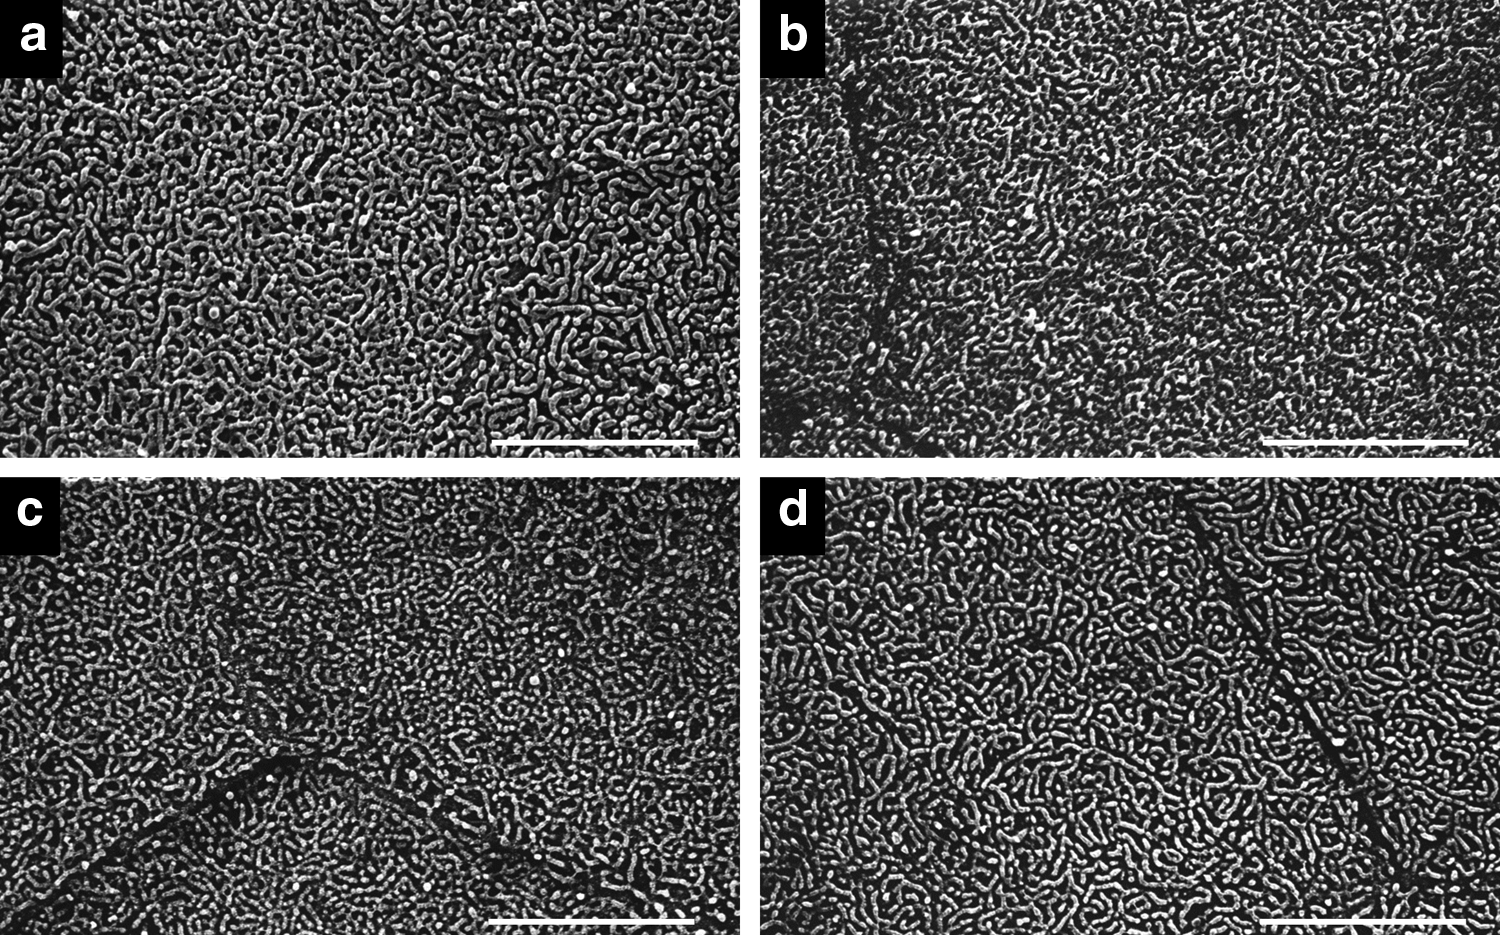
SEM of the corneal epithelium on day 2 of normoxia
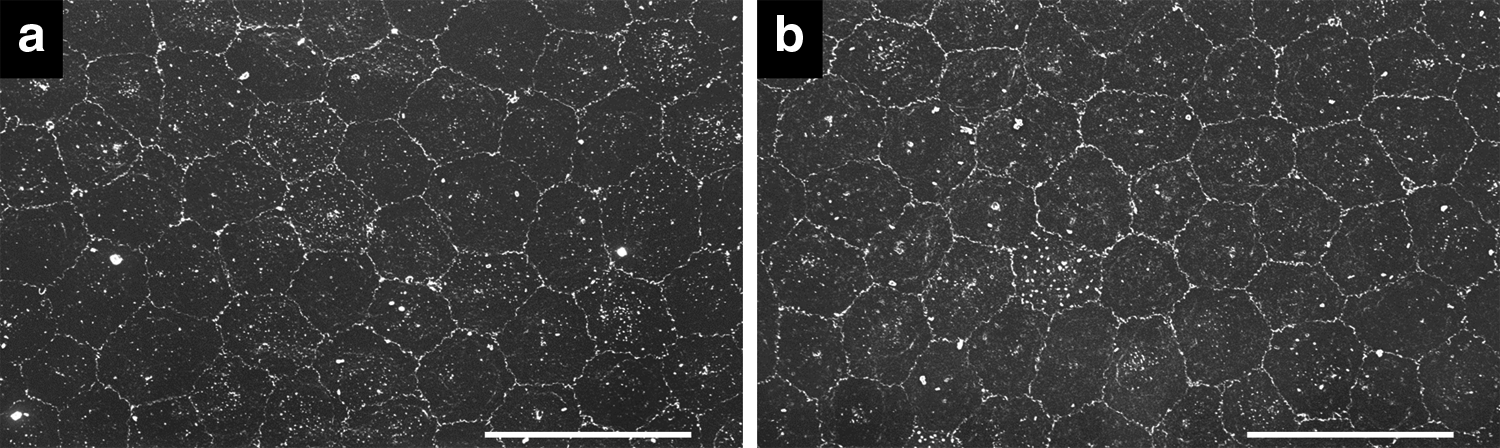
SEM of the corneal endothelium on day 140 of the normoxia
Glycogen analysis
After basic bismuth dyeing of the glycogen in the corneal epithelial cells, the glycogen was observed as high electron density granules in the TEM sections. On day 2, the percentages of the areas stained in the cytoplasm in the control group were 0.72% ± 0.45% (±SD) of the outer layer, 5.39% ± 1.09% of the middle layer, and 6.03% ± 0.53% of the basal layer. The percentages in the hypoxic group were 0.59% ± 0.21% of the outer layer, 3.10% ± 0.62% of the middle layer, and 3.08% ± 1.06% of the basal layer (Figs. 4 and 6a). On day 140, the percentages of the areas stained in the cytoplasm of the control group were 1.36% ± 0.22% of the outer layer, 5.30% ± 1.00% of the middle layer, and 4.05% ± 0.84% of the basal layer. The percentages for the hypoxic group were 0.71% ± 0.38% of the outer layer, 2.01% ± 0.63% of the middle layer, and 1.68% ± 0.30% of the basal layer (Figs. 5 and 6b). On day 2 (repeated-measures two-way ANOVA; interaction p = 0.0151, F = 6.064, layers p = 0.0002, F = 26.78, O2 p < 0.0001, F = 52.46: post hoc test, Bonferroni; normoxic group vs. hypoxic group for the middle layer p < 0.01; and normoxic group vs. hypoxic group for the basal layer p < 0.01) and on day 140 (repeated-measures two-way ANOVA; interaction p = 0.0107, F = 6.79, layers p < 0.0001, F = 50.43, O2 p < 0.0001, F = 27.36: post hoc test, Bonferroni; normoxic group vs. hypoxic group for the middle layer p < 0.01; and normoxic group vs. hypoxic group for the basal layer p < 0.01), the glycogen in the cytoplasm of the middle and the basal layer cells in the hypoxic group was significantly lower than that observed in the normoxic group.
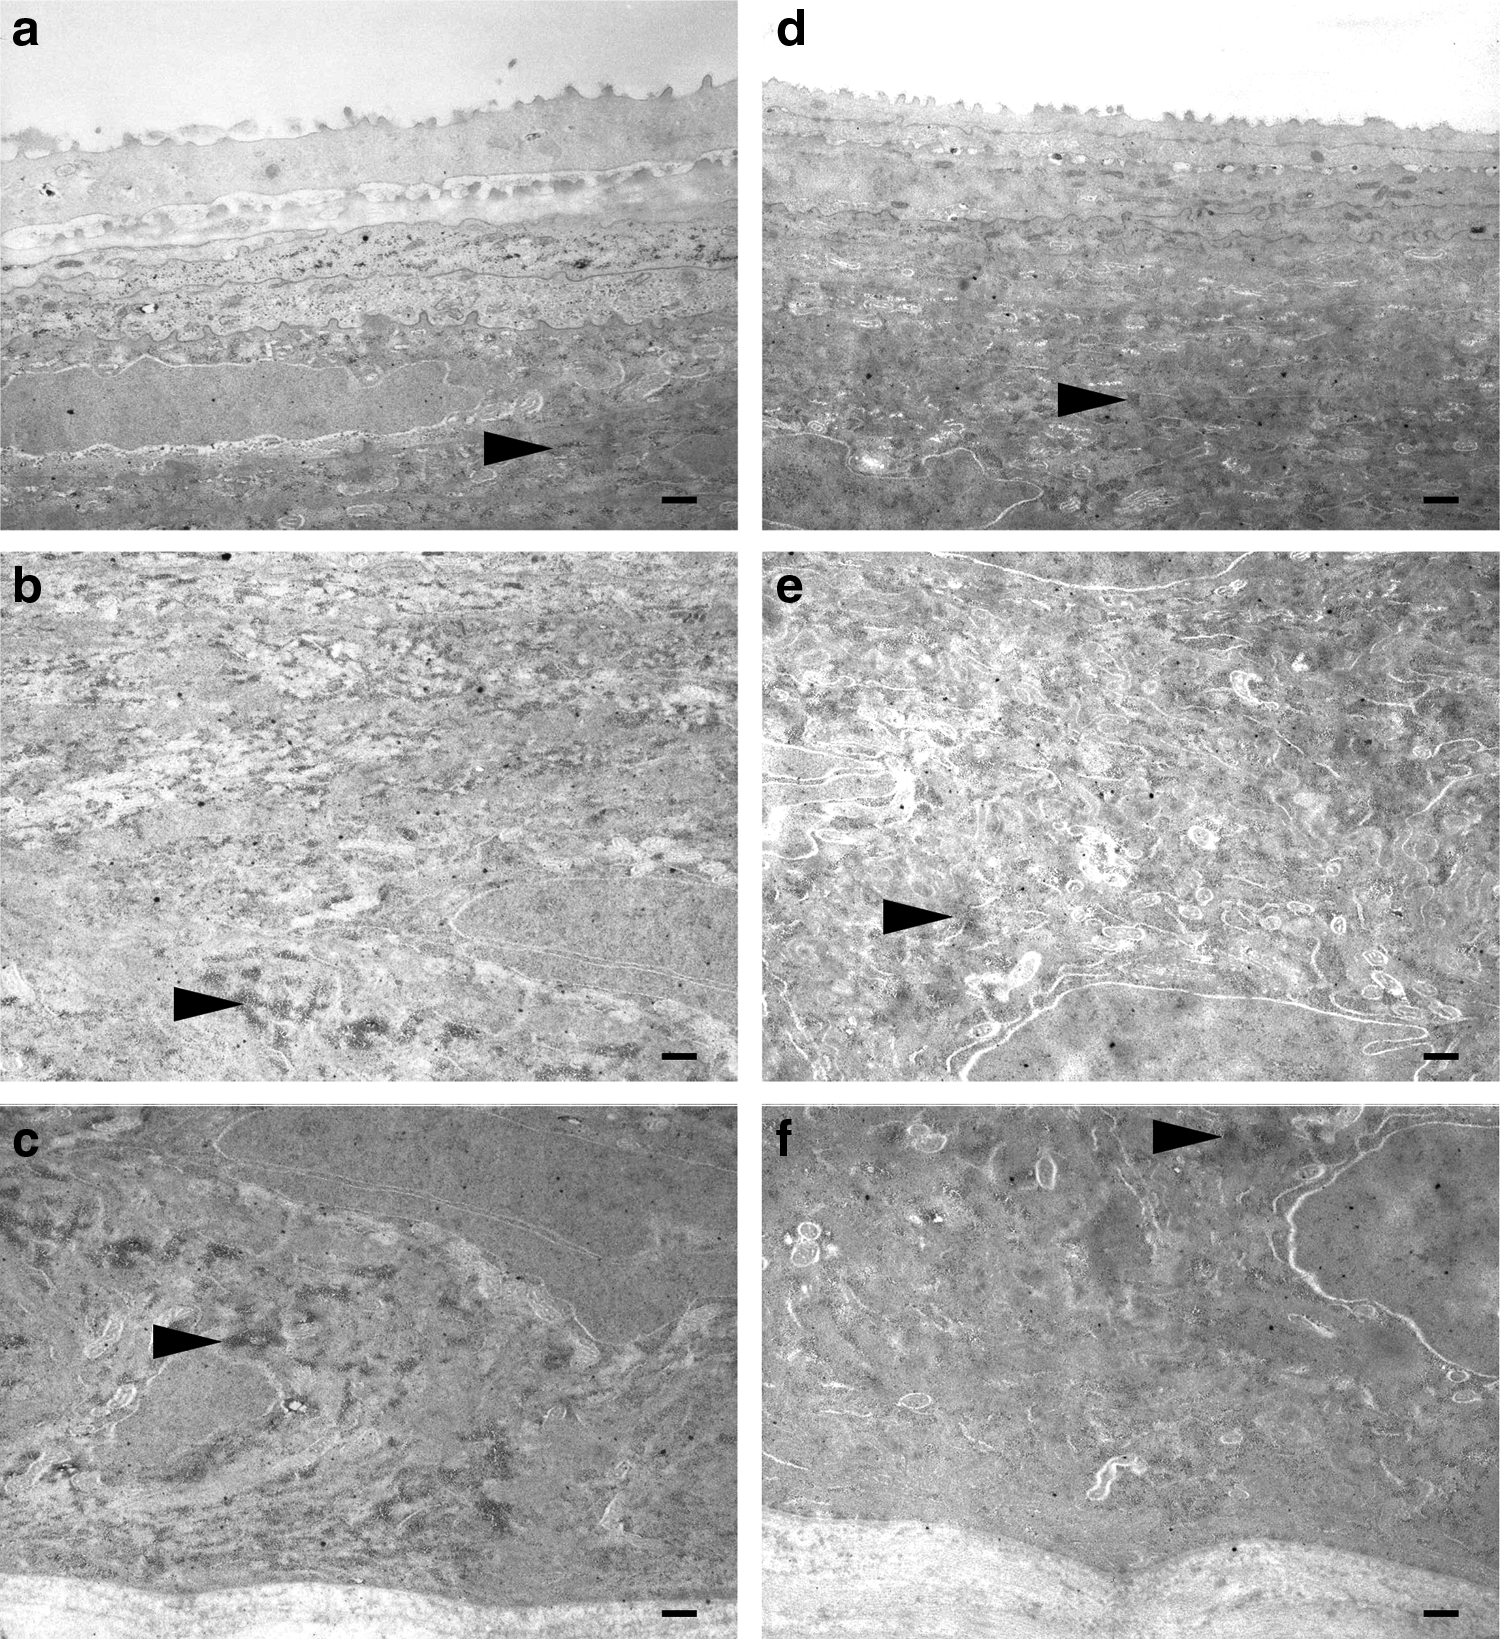
TEM of the glycogen images for the corneal epithelium on day 2,
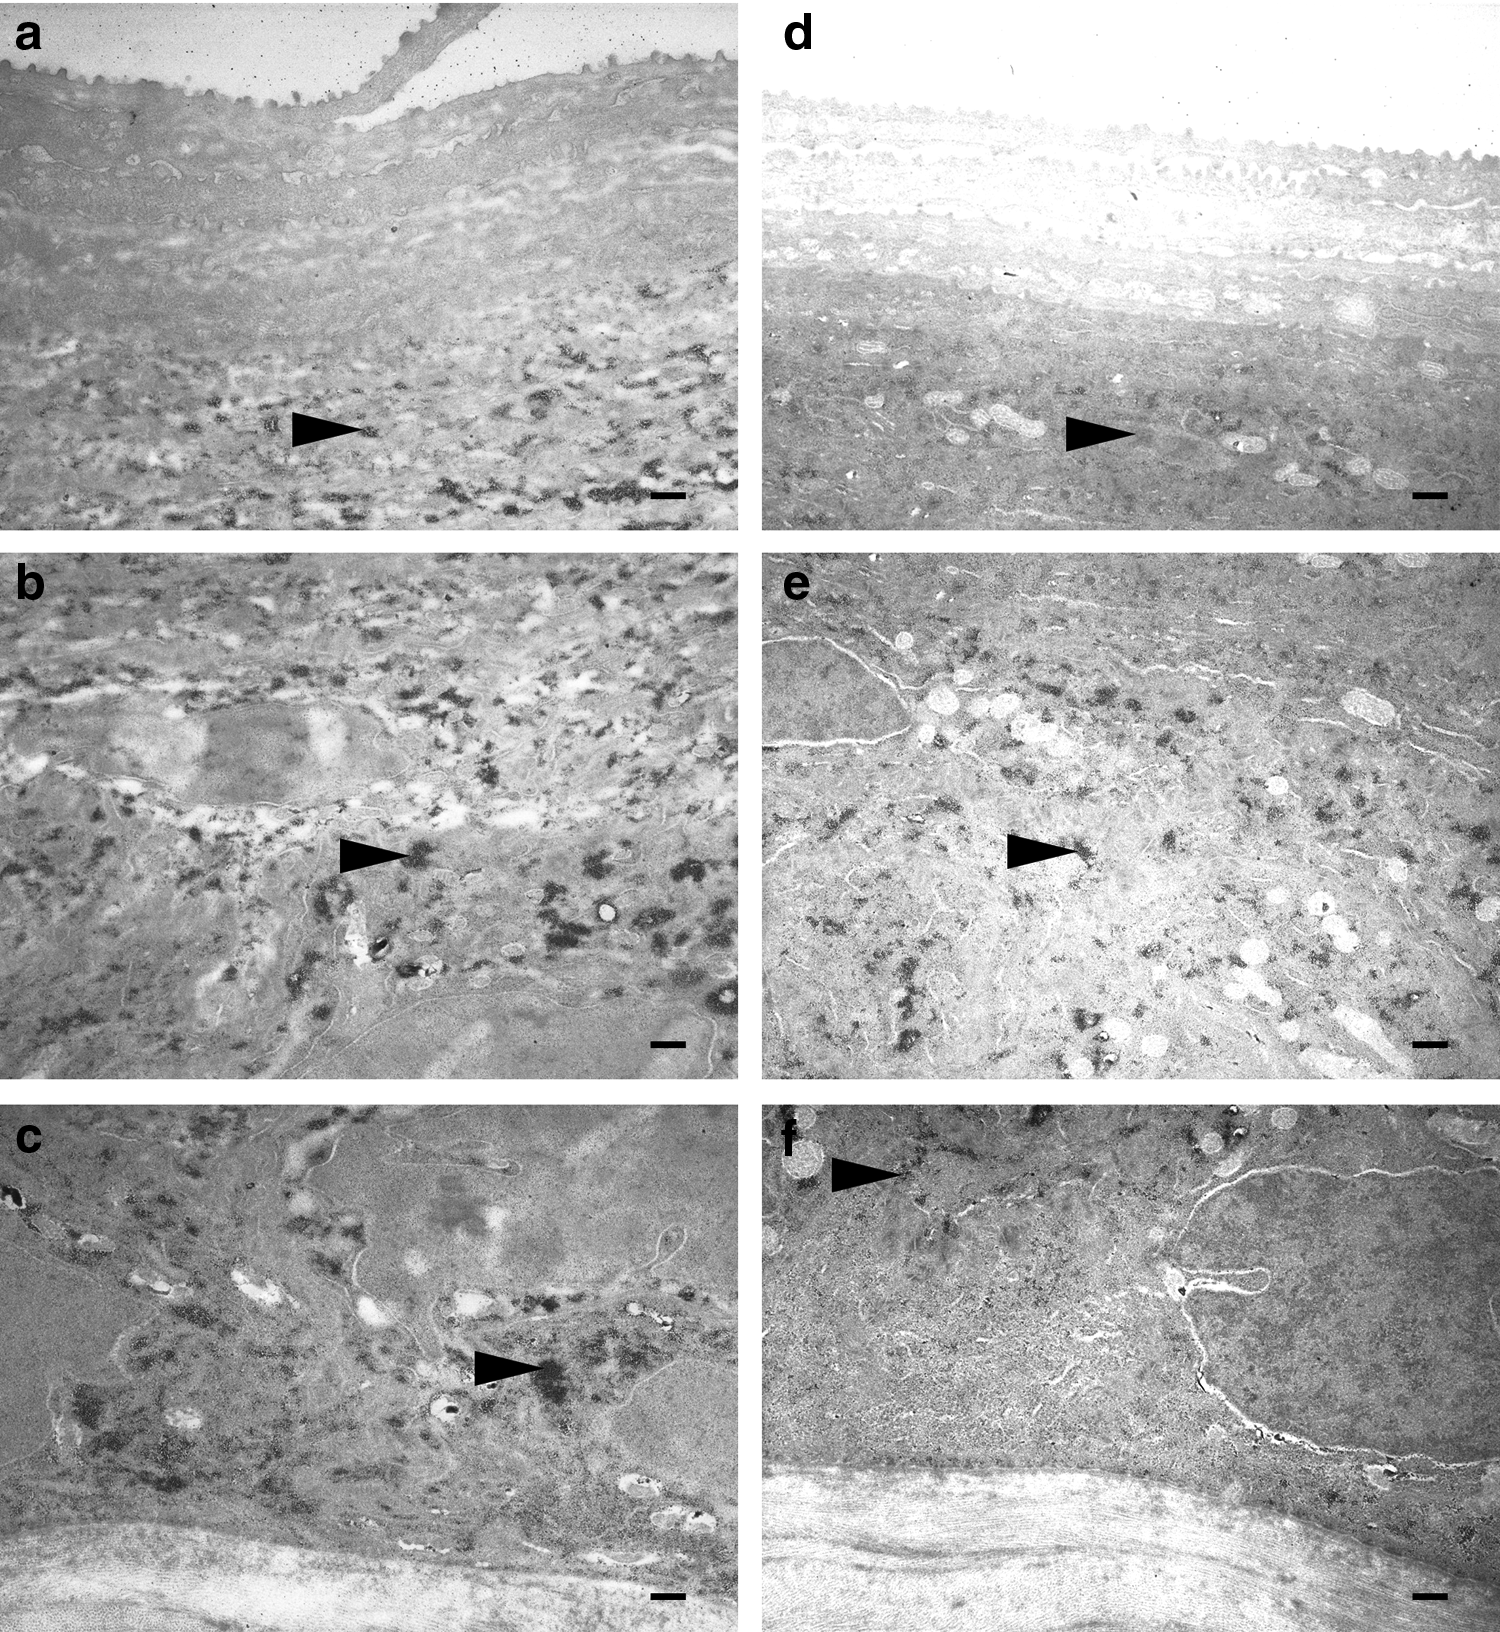
TEM of the glycogen images for the corneal epithelium on day 140,
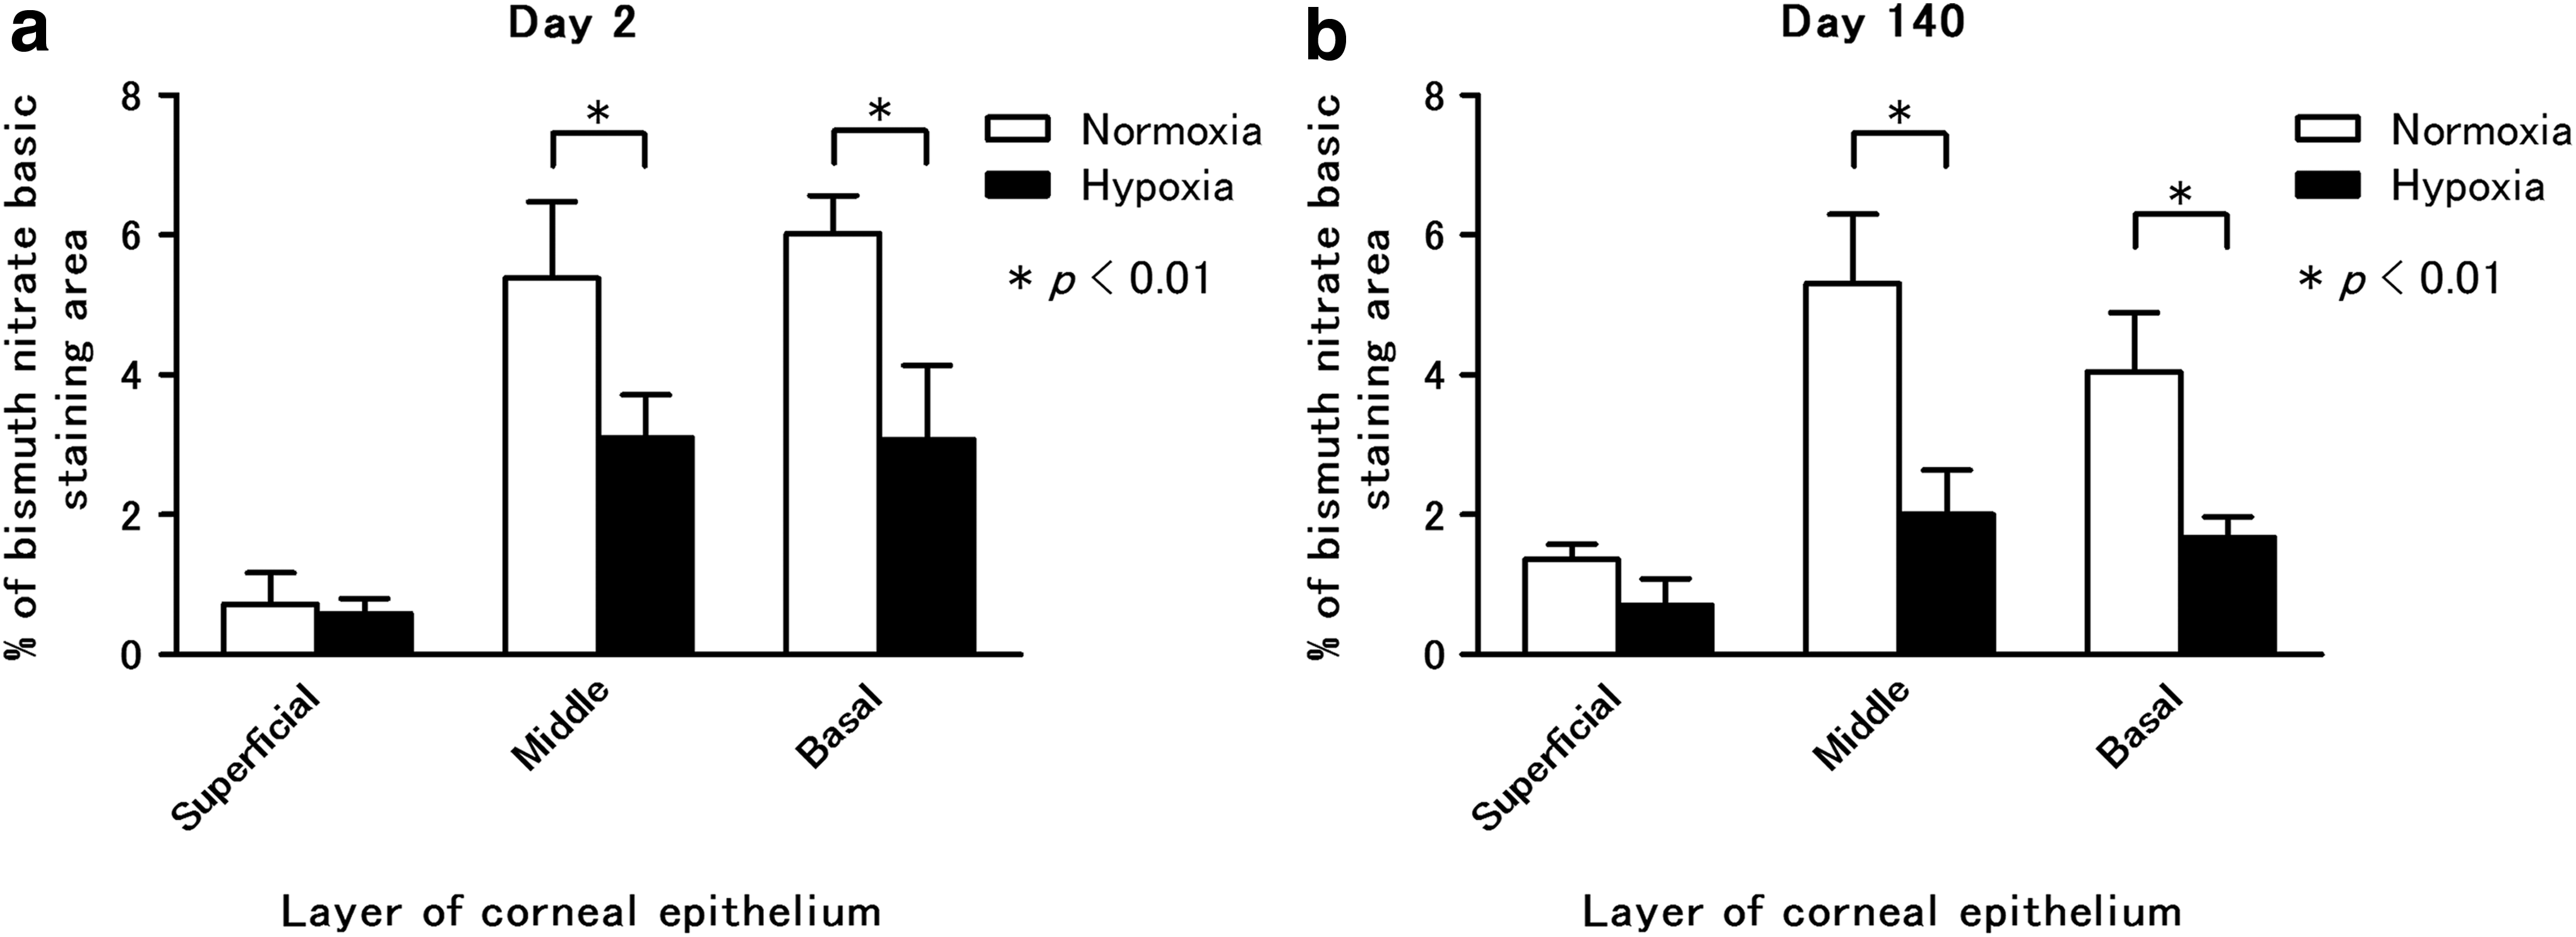
Glycogen analyses of corneal epithelium on day 2
Discussion
Mice corneas in the hypoxic group were able to maintain homeostasis in a 10% oxygen environment for 140 days without any pathological changes. The corneal epithelium of the hypoxic group consisted of normal stratified squamous epithelial cells in conjunction with well-differentiated microvilli. The corneal stroma presented a well-regulated lamellar structure. There was no significant difference observed in the cell density and shape of the endothelium between the normoxic and the hypoxic groups. In addition, we observed no invasion of blood vessels into the cornea. However, it has been reported that rat corneas exposed to a simulated altitude of 5500 m for 30 days exhibited neovascularization in the corneal stroma, endothelium damage, and a thickened Descemet's membrane (Mastropasqua et al., 1998). Thus, the corneal tolerance for hypoxia may be influenced by not only the oxygen concentration but also low pressure among other factors.
To examine the tolerance of the cornea for hypoxia, we focused on the glycogen content in the corneal epithelial cells, as glycogen is believed to be an energy source during times of emergencies. In normal environments, the corneal epithelium utilizes glucose as an energy source and produces adenosine triphosphate (ATP) by the aerobic glycolysis pathway. Simultaneously, some of the glucose is added to chains of glycogen for storage. The glycogen produced is then stored in the epithelial cells for subsequent use as an energy source. When the cornea is exposed to a hypoxic environment, ATP synthesis shifts to the anaerobic glycolysis pathway (Riley and Winkler BS, 1990). In the cells, the stored glycogen is immediately phosphorylated for use as an additional energy source (Uniacke and Hill, 1972; Uniacke et al., 1972). Additional energy sources are necessary for ATP synthesis via the anaerobic glycolysis pathway, as it requires more energy sources than the aerobic glycolysis pathway. A previous study examined the maintenance of rabbit corneal epithelium while exposed to an oxygen-free atmosphere over a 5-hour period and reported that there was an approximate 20% decrease in the glycogen storage level (Uniacke and Hill, 1972). A further study that utilized 0.3% oxygen environmental conditions reported that the glycogen storage in the rabbit corneal epithelium disappeared after 8 hours (Miyagawa, 1985). In our current experiment that used a 10% oxygen hypoxia environment, we also found that there was a decrease in glycogen stock in the corneal epithelium as compared with a normoxic environment. However, our results did show that some of the glycogen still remained in all of the epithelial layers during the long-term exposure. These findings indicate that the cornea has the capability to produce the energy that is necessary for its homeostatic maintenance during long-term 10% oxygen hypoxia stress. Further, our current results also suggested that the quantity of the stocked glycogen contents in the cells could be an index for hypoxia resistance. To better understand energy production in the cornea during hypoxia and definitively clarify corneal tolerance for hypoxia, it will be necessary to further investigate glycogen kinetics in corneal cells via other molecular biological techniques.
In summary, this experiment examined the influence of hypoxia, which is the primary factor associated with high-altitude environments. However, in addition to the hypoxia associated with high-altitude locations, there are other various elements that do have an influence on the living body, including low pressure, low temperature, low humidity, and strong ultraviolet rays. Further examinations of influences on the cornea when exposed to these complex elements will need to be undertaken in the future.
Footnotes
Author Disclosure Statement
No competing financial interests exist.