
Abstract
Extreme heat event excess mortality has been estimated statistically to assess impacts, evaluate heat emergency response, and project climate change risks. We estimated annual excess non–external-cause deaths associated with extreme heat events in New York City (NYC). Extreme heat events were defined as days meeting current National Weather Service forecast criteria for issuing heat advisories in NYC based on observed maximum daily heat index values from LaGuardia Airport. Outcomes were daily non–external-cause death counts for NYC residents from May through September from 1997 to 2013 (n = 337,162). The cumulative relative risk (CRR) of death associated with extreme heat events was estimated in a Poisson time-series model for each year using an unconstrained distributed lag for days 0-3 accommodating over dispersion, and adjusting for within-season trends and day of week. Attributable death counts were computed by year based on individual year CRRs. The pooled CRR per extreme heat event day was 1.11 (95%CI 1.08-1.14). The estimated annual excess non–external-cause deaths attributable to heat waves ranged from –14 to 358, with a median of 121. Point estimates of heat wave–attributable deaths were greater than 0 in all years but one and were correlated with the number of heat wave days (r = 0.81). Average excess non–external-cause deaths associated with extreme heat events were nearly 11-fold greater than hyperthermia deaths. Estimated extreme heat event–associated excess deaths may be a useful indicator of the impact of extreme heat events, but single-year estimates are currently too imprecise to identify short-term changes in risk.
The authors estimated annual excess non–external-cause deaths associated with extreme heat events in New York City. Estimated excess deaths associated with extreme heat events may be a useful indicator of the impact of extreme heat events pooled over multiple years, but single-year estimates are currently too imprecise to identify short-term changes in risk.
H
Hot summer weather is also associated with an increase in non–external-cause deaths (eg, deaths from exacerbation of respiratory or cardiovascular conditions) that are not recognized or coded as heat-related. These deaths can be estimated statistically, but methods vary. While mortality risk increases across a range of warm season temperatures, 4 health impacts of extreme heat events are of interest as an indicator of the effectiveness of heat emergency responses and other resilience measures and for tracking changes over time in the context of a warming climate. 5
Several studies have compared extreme heat event–associated mortality during severe extreme heat events after institution of additional heat emergency warning systems and response measures with that predicted from earlier extreme heat events.5-8 We are aware of no other study computing annual estimates of extreme heat event–attributable deaths within a US jurisdiction.
Our objectives were to estimate annual excess non–external-cause deaths associated with extreme heat events in New York City (NYC), assess their relation to annual extreme heat events and hyperthermia death counts, and assess the potential utility of routinely estimating annual extreme heat event–associated deaths in addition to hyperthermia deaths for heat-health surveillance.
Methods
Mortality Data
We obtained data on deaths occurring in New York City among city residents from May through September for the period 1997 through 2013 from the NYC Department of Health and Mental Hygiene (NYC DOHMH) Office of Vital Statistics. Non–external-cause deaths were defined as those with ICD-9 codes <800 and ICD-10 codes in the range of A00-R99. Hyperthermia deaths were also examined for comparison and were defined as those with an ICD-9 code of E900.0 or E900.9 in the underlying cause field (excluding E900.1, “Accidents due to excessive heat of man-made origin”), or 992.0 to 992.9 in any contributing cause field, or an ICD-10 code of X30 or T67 in any underlying or contributing cause field (excluding W92, “Exposure to excessive heat of man-made origin”).
Weather Data
Meteorological data were obtained from the National Climatic Data Center for LaGuardia Airport station in NYC. The definition of an extreme heat event was based on a previous study of hot weather and mortality in NYC, 9 which found that risk of excess mortality greatly increases when there are ≥2 consecutive days with maximum heat index (HI) (calculated using ambient temperature and relative humidity 10 ) of ≥95oF (35°C) or ≥1 day with max HI ≥100oF. Since 2007, this has been the National Weather Service threshold for heat advisories in NYC based on the forecast maximum heat index; prior to 2007, heat advisories were not issued unless the maximum heat index was forecast to reach ≥100oF (37.8°C). Heat advisories trigger activation of a multi-agency NYC heat emergency plan, which includes public and healthcare provider warnings, opening of cooling centers, extended pool hours, and measures to protect the electricity and water distribution systems.
Statistical Model
Our main interest was in assessing the potential utility of routinely estimating the extreme heat event–related mortality risk in individual summers to track year-to-year changes in risk. Thus, we used a Poisson unconstrained distributed lag model accommodating over-dispersion in each warm season (May through September), with the extreme heat event day variable (0/1 indicator) considering up to 3-day lags, adjusting for within-season temporal trends with 3 degrees of freedom in each season using natural cubic splines of warm season days and indicators for day-of-week. The estimated cumulative relative risk (CRR) of non–external-cause death associated with extreme heat events up to 3 lag days compared to non–extreme heat event days was computed. The CRR estimates the increase in mortality risk associated with an extreme heat event day, including deaths occurring on the date of exposure and over the following 3 days. The distributed lag model was fitted using the R package, ‘dlnm’. 11
The number of attributable deaths in each summer (i) was estimated as follows:
The resulting individual years' CRRs were also combined in a random effects meta-analysis (ie, accounting for year-to-year variability) using the DeSimonian/Laird method. 12 We also ran a distributed lag model including all years' data (this is what would be commonly done in a multi-year time-series analysis) with a year indicator in addition to the covariates described above and compared the CRR with the meta estimate obtained from the individual years' analyses. To compare with the extreme heat events CRR for each year, the CRR was also estimated for daily maximum heat index as a continuous variable using a distributed lag non-linear model 11 with unconstrained lags up to 3 days and natural cubic splines with 4 degrees of freedom to allow for a non-linear relationship between daily maximum heat index and mortality. For days when maximum heat index was not defined (since heat index is calculated only when the temperature is 80oF [26.7°C] or higher), we used maximum temperature. For a comparison, we also estimated attributable deaths for each year with this model using the median maximam heat index of 81oF (27.2°C) as reference using the method suggested by Gasparrini and Leone. 13
Human Subjects
This analysis was part of a research study approved by the Institutional Review Board of the NYC Department of Health and Mental Hygiene.
Results
Figure 1 shows the daily counts of the non–external-cause and hyperthermia deaths as well as extreme heat event days occurring in May through September during the study years. The mean annual count of extreme heat event days was 7.8 (range 0-19), or 5% of all warm season days; the annual average maximum heat index during extreme heat events varied from 96 to 103oF (35.6 to 39.4°C) (Table 1). The mean daily warm season non–external death count on non–extreme heat event days declined from 138 in 1997-1999 to 118 in 2011-2013. A random-effects combined estimate of the CRR per extreme heat event day across all years was 1.11 (95% CI 1.08-1.14) (Figure 2). In the model with all years' data analyzed together, the corresponding estimate was 1.12 (95% CI 1.09-1.15), which is comparable to the random-effects estimate. The estimated combined CRR of individual years' CRRs for the later period 2007-2013 (1.10 [95% CI 1.05-1.15]), during which time period the revised threshold for the NWS heat advisory/alert was in effect, was lower but not significantly different from the earlier period 1997-2006, excluding 2004 when there were no extreme heat event days (1.12 [95% CI 1.09-1.16]). The estimated annual number of non–external-cause deaths attributable to extreme heat events across all years ranged from –14 to 358, with a median of 121 and an average of 115, compared to an average of 10 hyperthermia deaths associated with extreme heat events (82% of all hyperthermia deaths during the study period). Yearly point estimates of extreme heat event–attributable deaths were imprecise. Confidence interval half-widths for estimates (range 60-216) were greater than 80% of the point estimate in 14 of 16 years. Nonetheless, the annual estimates were highly correlated with the annual number of extreme heat event days (r = 0.81) and weakly correlated with the annual average maximum heat index (r = 0.24).
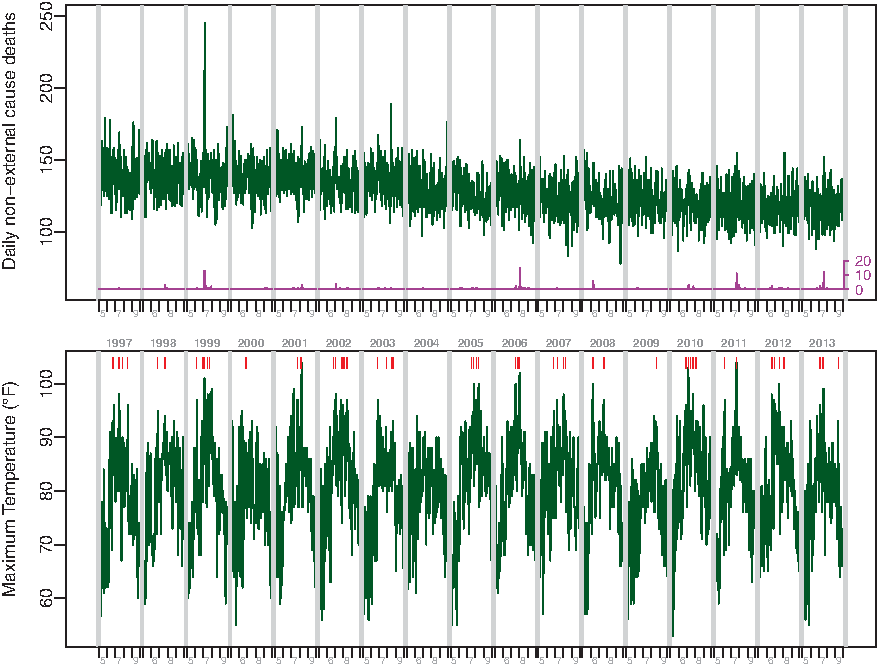
Top panel: Time-series plot of non–external cause of deaths (green), hyperthermia deaths (purple). Bottom panel: daily maximum temperature (green) in May through September, 1997-2013. Vertical lines (red) indicate extreme heat event (EHE) days. (Color graphics available at www.liebertonline.com/hs)
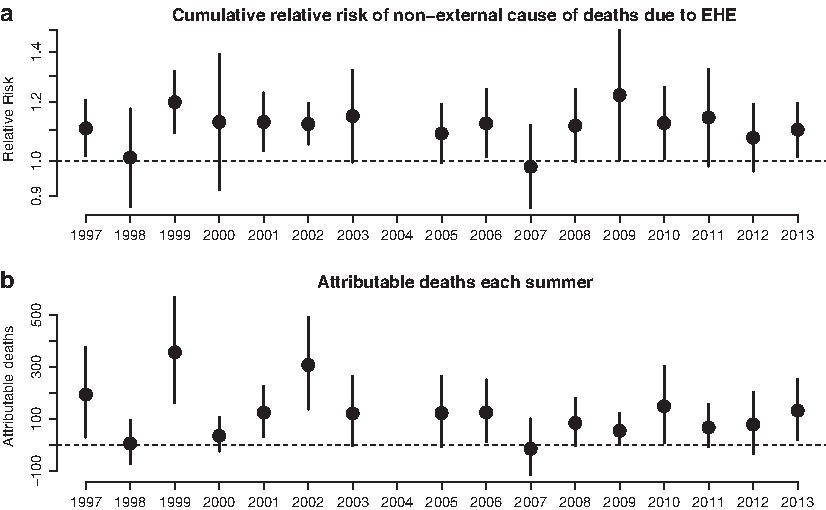
Estimated cumulative relative risk and attributable non–external cause deaths for May-September 1997-2013. Vertical lines are 95% confidence intervals.
Characteristics of Extreme Heat Event Days, estimated attributable deaths, and observed hyperthermia deaths, May-September, 1997-2013
EHE = extreme heat event
HI = heat index
Non-EHE days also excludes days within 3 days of an EHE day.
CI = confidence interval
The estimated annual average extreme heat event–attributable deaths in 2007-2013 (79.4) was less than in 1997-2006 (139.8) in part because of the declining baseline mortality (Figure 1) over time. The average number of extreme heat event days per year (7.0) and average maximum heat index on extreme heat event days (98.7oF [37.1°C]) were also lower in the 2007-2013 compared to the earlier time period (8.3 and 99.8oF [37.7°C], respectively).
The relation of CRR to daily maximum heat index was nonlinear. Annual estimates of the CRR associated with extreme heat event days were generally consistent with the continuous relationship of the CRR to maximum heat index (Figure 3). For comparison to extreme heat event–attributable deaths, we used the nonlinear CRR function to estimate all deaths attributable to days with maximum heat index greater than 81oF (27.2°C). The median of annual extreme heat event–attributable non–external cause deaths (121) was about 60% of the median of all annual heat-attributable non–external cause deaths (198), suggesting that milder temperatures substantially contribute to increased mortality.
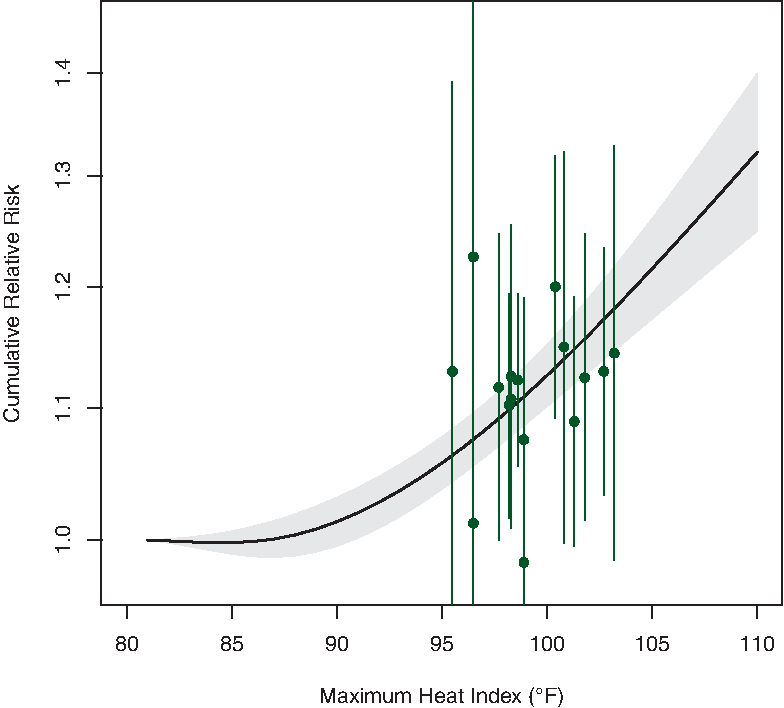
Cumulative relative risk of non–external cause deaths estimated for daily maximum heat index using the distributed lag nonlinear model for all years. Gray-shade area is 95% confidence interval. Cumulative relative risks (in green with their 95% confidence intervals) for extreme heat events in each year against the average maximum heat index are overlaid. (Color graphics available at www.liebertonline.com/hs)
Discussion
Consistent with other studies, we found that the number of non–external cause excess deaths each year associated with extreme heat events was substantially greater—about 11-fold—than the number of hyperthermia deaths associated with extreme heat events. 14 The annual average burden of extreme heat event–related deaths—well over 100 from hyperthermia and excess natural cause deaths combined—is greater than from any other type of extreme weather event to affect New York City during the study period. The imprecision of single year estimates and year-to-year variability in extreme heat events makes it difficult to draw inferences about incremental, short-term changes in heat-health risks in NYC. Extreme heat event risks are similar to those predicted by the continuous, nonlinear relation of heat index to mortality in NYC.
Many other studies have shown an association between extreme heat days and excess mortality.15,16 A study of excess mortality using time series generalized additive models in 43 metropolitan areas from 1987 to 2005 found an average increase of 6.76% in natural cause mortality on heat wave days compared with non–heat wave days in Northeast cities (including NYC). 17 This estimate is not directly comparable to ours as the definition of extreme heat event differed, the model controlled for the continuous effect of temperature, and lagged extreme heat event effects were not considered. Nonetheless, the study showed heterogeneity among regions and cities and among heat waves within cities, due in part to the severity, duration, and timing of the extreme heat events.
Our analyses show that excess mortality associated with extreme heat events in New York City is largely consistent with that expected from the nonlinear and lagged effects of high temperature. A study of hot weather and mortality in 108 US communities 15 and another in 3 European cities 18 also suggest that the apparent “heat wave effect” observed in simple models that include some control for temperature is largely accounted for in models that more flexibly model the nonlinear continuous effect of high temperatures and multi-day lagged effects. While not the focus of this study, other studies have found, as we did in NYC, that in many cities a large proportion of deaths attributable to hot weather occur during the much greater number of hot but more seasonal days outside of extreme heat events. 19 This observation suggests that in addition to heat emergency responses to extreme heat events, other approaches, such as improved access to air conditioning, are needed to reduce heat-related health risks throughout the warm season.
Mortality effects can also vary within a community. 20 Aside from local climate, variations in the heat-mortality relationship likely depend on factors such as the age structure and general health status of the population, housing stock, and air conditioning prevalence. A recent study found that in NYC excess mortality associated with heat has declined from the 1970s through the most recent time period (2000-2006) analyzed, likely due in large part to the increases in air conditioning prevalence in the city. 21 Our estimate of the excess mortality risk is similar to that for the most recent time period (2000-2006) covered by that study. However, NYC heat-related deaths could increase if further adaptation to our warming climate does not occur. Furthermore, mortality risk could rise dramatically if an extreme heat event were complicated by a widespread or persistent power outage, as demonstrated by the increased mortality during the 2003 northeast blackout, 22 which occurred during hot, but not extreme, weather.
Surveillance of extreme heat event–associated excess natural cause mortality risk can complement more traditional surveillance and case investigation of hyperthermia deaths, 20 which can provide unique information about the circumstances of death and social connections of decedents to inform outreach. For example, in recent years hyperthermia decedents in NYC were most frequently exposed at home, and, where data were available, no working air conditioning was present. 3 While excess natural cause mortality surveillance does not provide individual circumstance information, a recent study found that deaths at home from natural causes were associated with extreme heat events in New York City. 23
Our analysis demonstrated that in a large city like New York, systematically calculating excess mortality associated with extreme heat events based on several years of data could be useful in assessing the full burden of heat effects in the context of climate change and to assess resilience to heat emergencies. However, limitations of this approach should be considered. Our data suggest that, even in large cities, assessment of trends in extreme heat health risk should be made over decades rather than from one year to another, because individual estimates may have wide confidence intervals and could be influenced by unique circumstances (eg, associated power outage). Also, the use of excess mortality estimates to evaluate the effectiveness of heat-health warning systems or other programs will need to account for a warming climate and secular trends in population as well as in vulnerability factors, such as age distribution, health status, and air conditioning prevalence. Finally, we did not control for the effect of ozone, which increases with higher temperatures, since our intent was to assess total burden of excess mortality during extreme heat events, not tease out the fraction attributable to air pollution.
Conclusions
Calculating excess non–external-cause mortality associated with heat is important to understanding the full burden of heat mortality. Although single-year estimates vary with weather conditions and are imprecise, estimates based on several years of data may be useful for tracking trends over time in health impacts and resilience to extreme heat events as the climate warms.
Footnotes
Acknowledgments
This analysis has been funded by EPA STAR grant RD-83489802. The article was also supported by Grant Number 5 UE1 EH 001120-03, funded by the Centers for Disease Control and Prevention. Its contents are solely the responsibility of the authors and do not necessarily represent the official views of the Centers for Disease Control and Prevention or the Department of Health and Human Services.