
Abstract
In recent decades, organophosphorus (OP) pesticides are widely used in agricultural and domestic fields. There is increasing demand for more rapid and economical methods of detecting pesticide residues. We have developed a gold immunochromatography assay (GICA) strip test for detecting a group of OP pesticides based on monoclonal antibodies (MAb) against a generic hapten, O,O-diethyl O-(4-carboxy-3-methylphenyl) phosphorothioate. The MAb showed desirable properties for use in indirect competitive ELISA, and the minimum IC50 value (93 ng/mL) was observed in chlorpyrifos-ethyl curve. The partially purified monoclonal antibodies were conjugated with colloidal gold particles. The conjugation of the colloidal gold and antibodies was monitored by ultraviolet-visible (UV-vis) spectroscopy and fluorescence spectroscopy, while the transmission electron microscopy (TEM) images were used to characterize the particle size and shape of the conjugates. Dynamic light scattering (DLC) was applied as a less expensive and faster method to substitute TEM. The colloidal gold and antibody conjugates were used for the production of a GICA strip test to detect OP pesticides. Preliminary assessment suggests that the OP pesticide, chlorpyrifos-ethyl (CE), in environmental samples could be detected by the GICA strip. This assay could potentially be used for screening large volume of samples and on-spot monitoring before the precise analysis. But the homogeneity of the detection needs to be improved further.
Introduction
As shown in Figure 1, we established the gold immunochromatography assay based on the distribution of molecules in a biphasic system. A competitive immunoassay principle is also applied to the detection of pesticides: monoclonal antibody labeled by colloidal gold remains stationary on solid phase. In the test, an aqueous sample and the labeled antibody are migrated to the test zone through capillarity. The binding of labeled antibody to immobilized antigen on solid phase leads to the accumulation of colloidal gold; then a red color can be observed rapidly by the naked eye. OP pesticides in samples can compete for the antibody binding sites, and if the quantity of the competitors is above a limit, the red color in the test is obscure or absent. Unlike fluorescence or enzyme-detection systems, gold probes are more stable and easy to use. There is no need for fussy operations such as incubation, washing, and enzymatic reactions, which distinctly shorten the detection time. Especially the results, which can be read directly by the naked eye, make the assay more suitable on-site.(4)
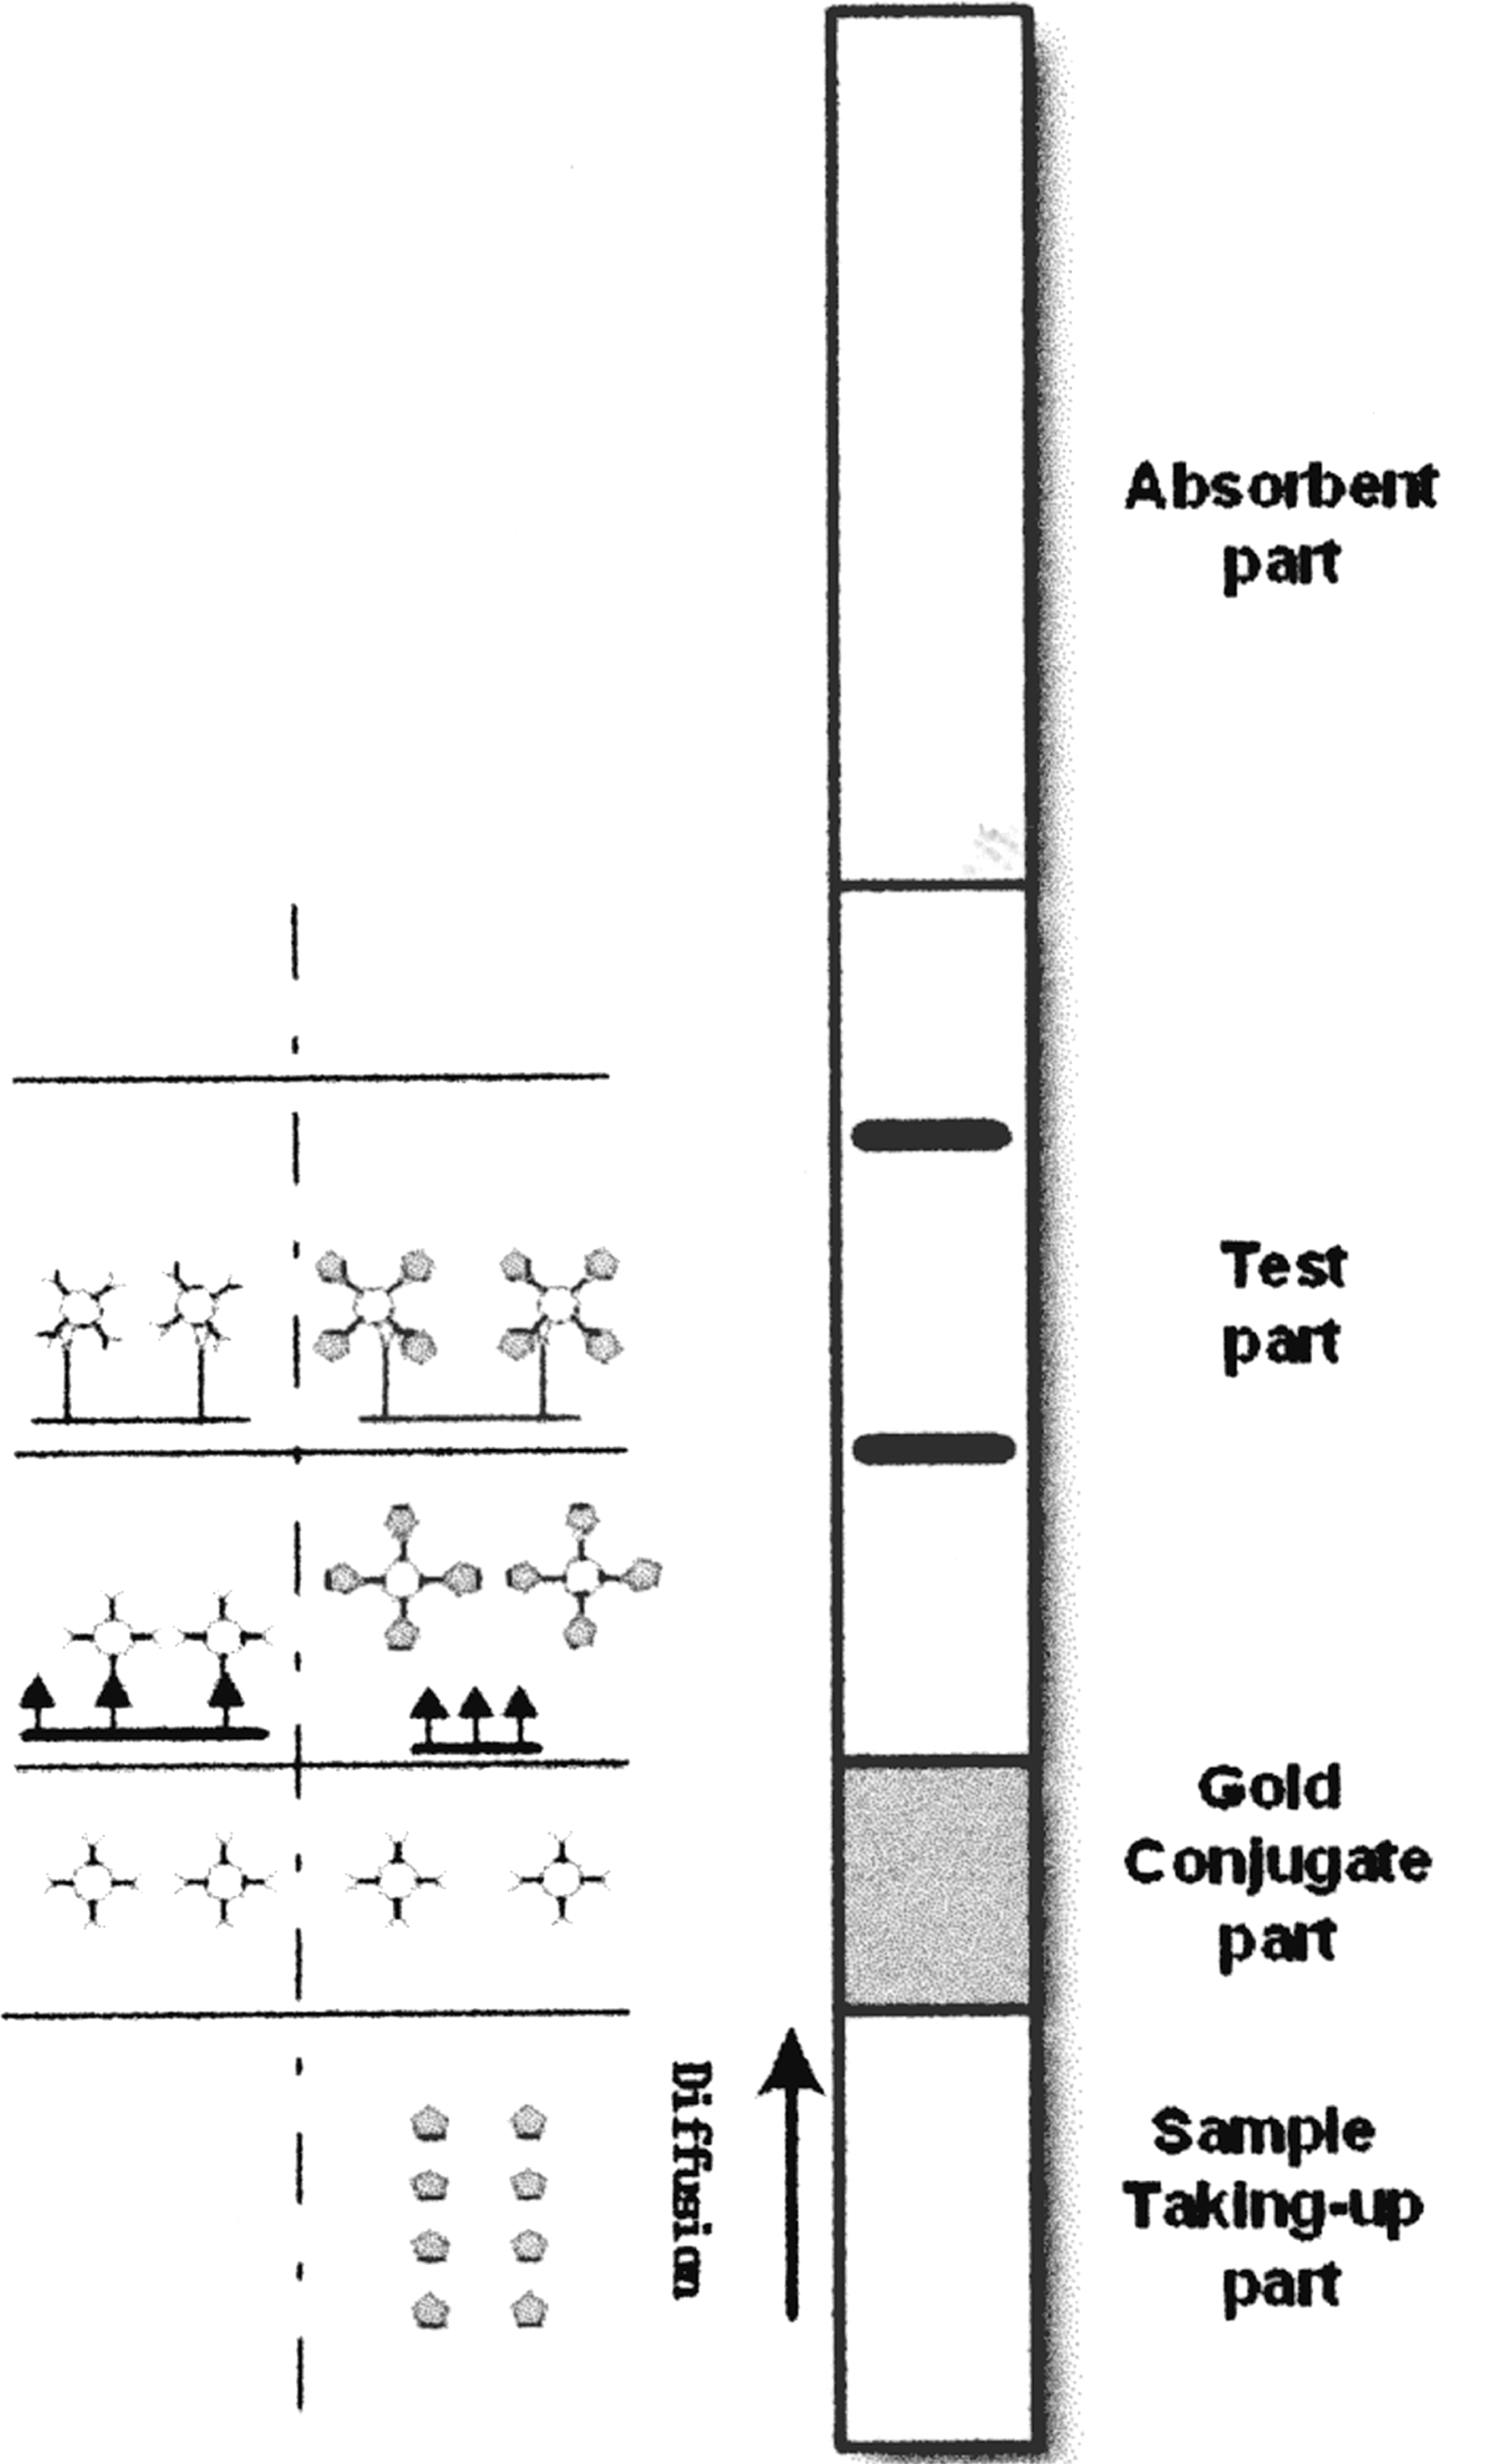
Configuration of the GICA strip test. Schematic shows areas where gold-labeled antibody, coating antigen, and goat anti-mouse IgG are immobilized. The reactions, which occur on the strip in the presence of analytes (right panel) and in the absence of analytes (left panel), are shown. A red-purple color appears at the control and/or test lines, depending on the presence of OPs to be seized.
A monoclonal antibody (MAb) that identified unique antigenic determinant is regarded as mono-specific, whereas an MAb that recognized several antigenic epitopes can be used for the monitoring of a class of pesticides with similar chemical structures.(5–7) It is attractive to establish a method used to detect a class of pesticides with similar chemical structures based on a class-specific MAb.
In this study, we prepared and characterized class-specific monoclonal antibodies against OP pesticides. The one-step GICA strip test was developed and used for the rapid detection of OP pesticides based on the antibody-colloidal gold probes.
Materials and Methods
Reagents
All chemicals were purchased from commercial suppliers. Auric chloride (AuCl4), bovine serum albumin (BSA), ovalbumin (OVA), Freund's complete adjuvant, horseradish peroxidase (HRP)-conjugated goat anti-mouse IgG, HAT, and HT were purchased from Sigma Aldrich (St. Louis, MO). RPMI 1640 and fetal bovine serum were the products of Invitrogen Gibco (Grand Island, New York). PEG 1500 was provided by Roche (Mannheim, Germany) and TMB was obtained from Amresco (Solon, OH). CE (up to 95% purity) and PM (up to 95% purity) were obtained as gifts from the environmental and occupational laboratory of Xi'an Jiaotong University (Xi'an, China). Other chemicals were analytically pure and purchased in China.
Apparatus
UV-vis spectra and optical density (OD) were measured using a spectrophotometer (U-3100, Hitachi, Tokyo, Japan); fluorescence spectra were reported in a fluorescence spectrophotometer (F-4500, Hitachi). Transmission electron microscopy (TEM) images were recorded on a transmission electron microscope (JEM-EX2000, JEOL, Tokyo, Japan). Dynamic light scattering and zeta potentials were performed by a zetasizer nano instrument (Nano ZS, Malvern Instruments, Worcestershire, United Kingdom). All cell culture flasks and plates were purchased from Nunc (Roskilde, Denmark).
Synthesis of hapten (O,O-diethyl-O-(4-carboxy-3-methylphenyl) phosphoro-thioate)
The synthetic route is shown in Figure 2. A solution of 1.35 g (8.9 mmol) of 4-hydroxy-2-methylbenzoic acid in 3.5 mL of H2SO4/methanol (1:10, v/v) was refluxed for 24 h. After evaporation of the solvent, the residue of 0.26 g in butanone (3 mL) was added by diethylchlorothiophosphate and finely ground K2CO3 (5 g). After stirring for 24 h at 80°C, the reaction mixture was filtered. Then the filtrate was concentrated. To a magnetically stirred solution, the residue of 318 mg in 60 mL of ethanol was added by 25 mL of 1 M KOH and was continuously stirred at room temperature. After stirring for 30 min, 30 mL of 1 N HCl was added and the reaction mixture was extracted with ethyl acetate (50 mL). The separated organic layer was washed with 1 N HCl (20 mL), and then dried over anhydrous magnesium sulfate. After evaporation of the solvent, the residue was subjected to column chromatography (silica gel, hexane/ethyl acetate/acetic acid, 200:100:8, TLC R f 0.57) to provide 70 mg (23%) of the product.
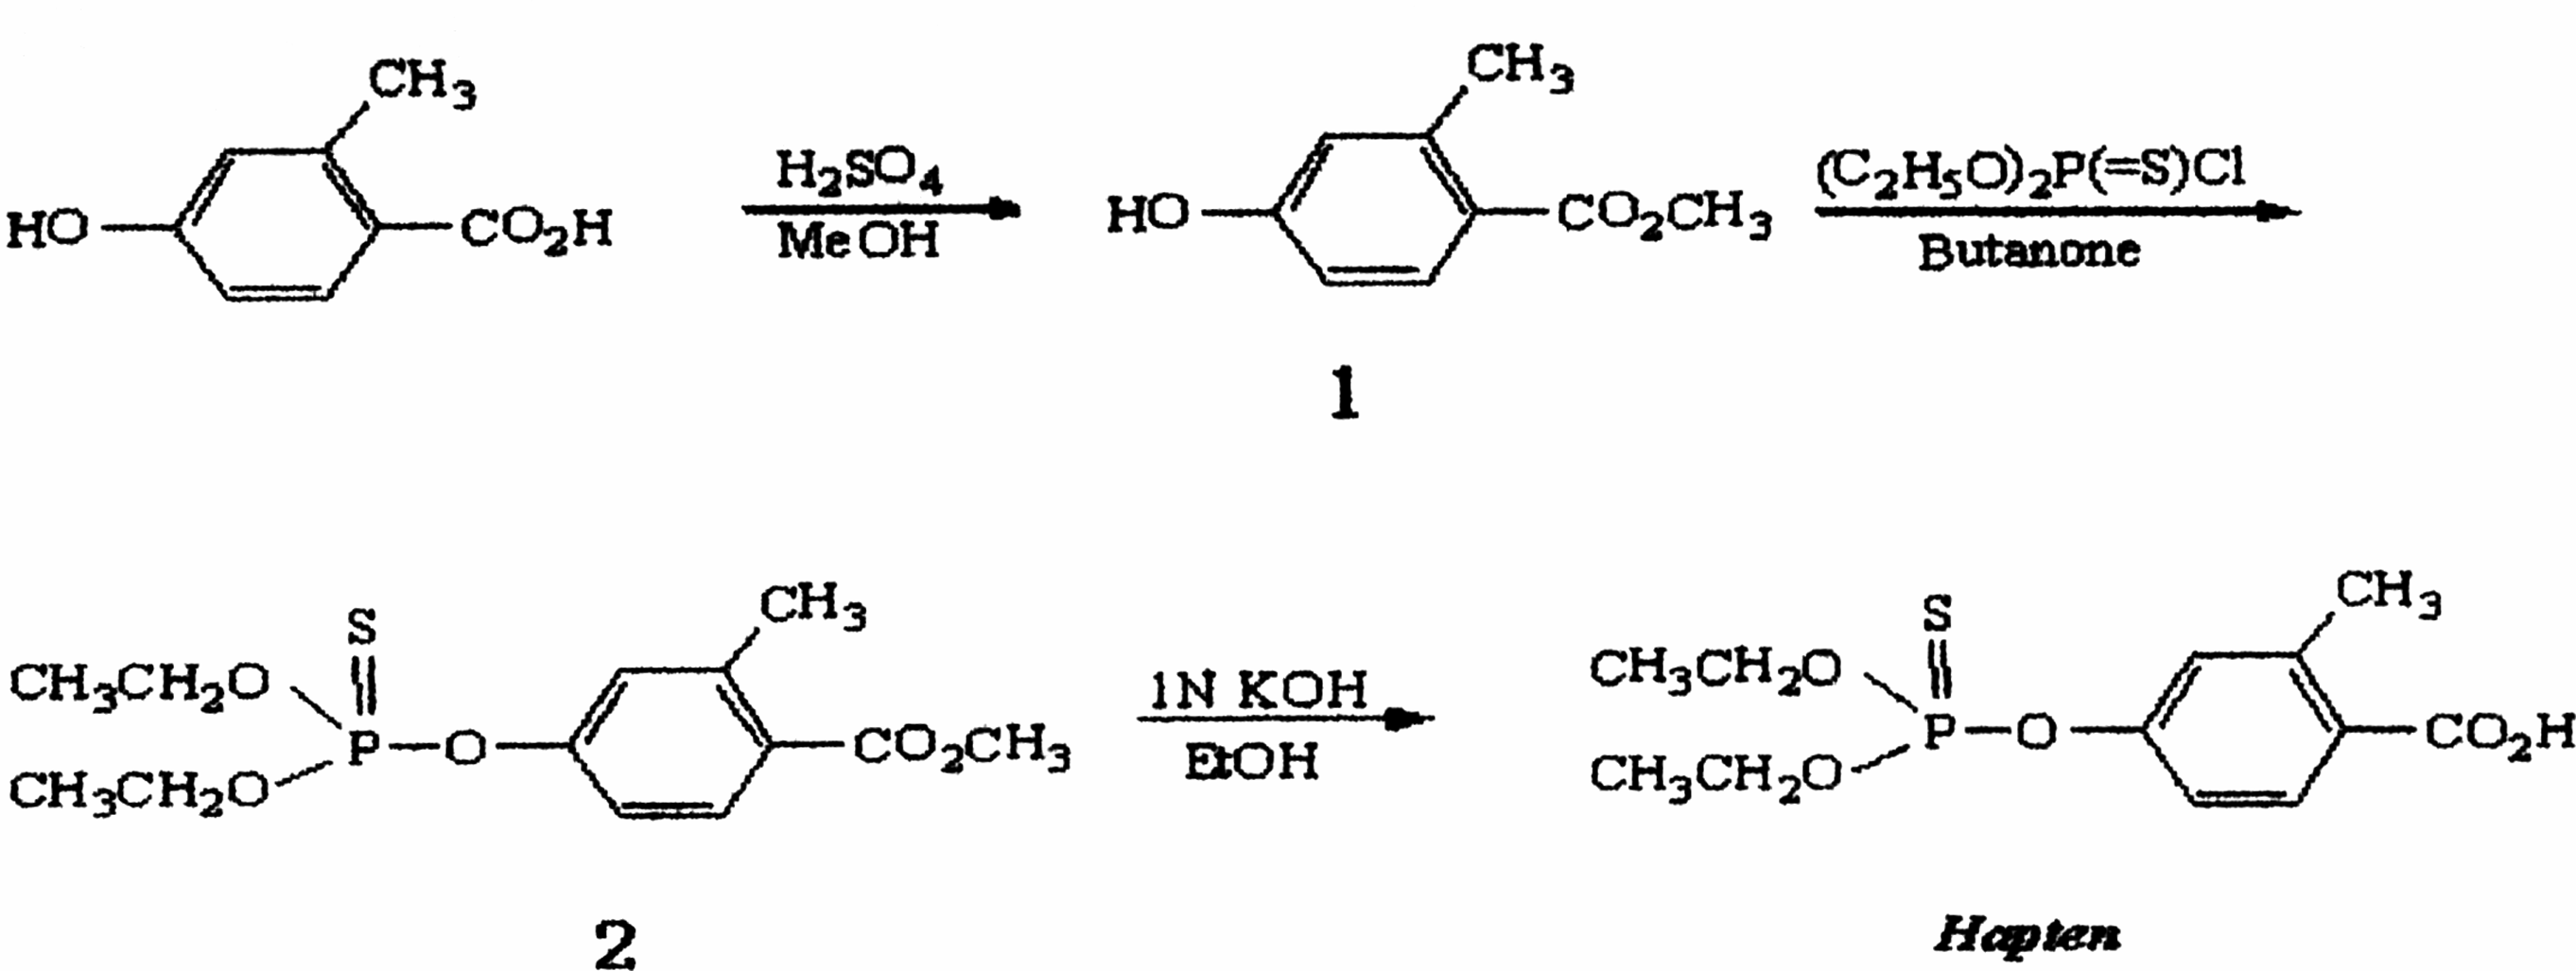
Synthetic route for hapten.
Preparation of hapten-carrier conjugation
Hapten was conjugated to BSA and OVA respectively, to produce an immunogen and a coating antigen. The conjugation method was the active ester method.(8) The conjugates were dialyzed against ultrapure water for at least 2 days, and then were freeze-dried before storage at −80°C.
Preparation of monoclonal antibody
BALB/c female mice (8 weeks old) were immunized with 1:1 mixture of hapten-BSA conjugate (40 μg) in PBS and Freund's complete adjuvant. Two additional booster injections of the same amount of the immunogen were given intraperitoneally at 2-week intervals. After the final injection, the mice were sacrificed for cell fusion.
SP 2/0 murine myeloma cells were cultured in RPMI 1640 media supplemented with 15% fetal bovine serum. The fusion of spleen cells from the immunized mice and SP 2/0 cells were performed using PEG1500, as described by Galfre and Milstein.(9) The HAT medium was applied following cell fusion to select the hybridoma cells. The medium was changed by HT medium when most of the non-fused cells were eliminated. Culture supernatants were screened by indirect non-competitive ELISA. Cells in the positive wells were progressively diluted in new plates and stable antibody-secreting clones were expanded.
Competitive indirect ELISA
For the competitive ELISA, hapten-OVA (100 μL) at a concentration of 10 μg/mL in carbonate buffer (pH 9.6) was added to polystyrene wells and allowed to passively adsorb at 4°C for 16 h. Subsequently, 100 μL of 1% gelatin solution was added to each well and incubated at 37°C for 1 h, and then removed. Properly diluted antibodies (50 μL) in PBST mixed with serially diluted OP pesticides (50 μL) were applied into coated wells and incubated at 37°C for 1 h. After washing the wells by PBST three times, HRP-goat anti-mouse IgG (100 μL, 1:5000) in the mixture of PBST and goat serum (10:1, v/v) was added, incubated at 37°C for 45 min, and then washed. TMB/H2O2 substrate solution (100 μL) was added and incubated at 37°C for 30 min. The enzymatic reaction was stopped by adding 100 μL of 1 M H2SO4. The OD value was read at 450 nm, and was used to compare the binding strength of each analyte to the class-specific monoclonal antibodies. Competitive curves were obtained by plotting absorbance against the logarithm of analyte concentration.
Synthesis of colloidal gold
A solution of auric chloride (80 mL of 0.125% AuCl4) was heated to boiling. An aqueous reducing agent (20 mL of 0.2% [w/v] sodium citrate, 0.0005% [w/v] tannic acid, and 0.125 mmol/L potassium carbonate) was added immediately while stirring rapidly; continuous heat and stirring yield a wine red color.
Preparation of labeled antibody with colloidal gold
A solution of colloidal gold was adjusted to pH 8.2 by 0.1 mol/L potassium carbonate and was added drop-wise by purified monoclonal antibody solved in phosphate buffer (pH 7.4, 0.01 M) while stirring. The optimum quantity for stability of the colloidal solution is 45 μg of antibody (1 mg/mL) to10 mL of gold solution while 1% [w/v] BSA (5% [w/v] in phosphate buffer) was used to block the uncoated gold nanoparticle.(10) After centrifugation (10,000 rpm, 20 min at 4°C), the pellet was dispersed in Tris buffer saline (pH 8.2, containing 1% [w/v] BSA, 0.05%[w/v] sodium azide). The medium was centrifugated twice to remove the unconjugated antibody.
Characterization of antibody-colloidal gold conjugate
The formation of antibody-colloidal gold conjugates (0.01% [w/v]) and the colloidal gold particles were monitored by UV-vis spectroscopy at 200−700 nm immediately after preparation using a double-beam spectrophotometer operated at 1 nm.
Fluorescence spectroscopy is a powerful tool for studying the tertiary structure of proteins. The tryptophan residues in antibody and antibody-colloidal gold conjugates were excited at 295 nm and the emission bands were monitored in the range of 300 to 500 nm.
The size and shape of antibody-colloidal gold conjugates and the colloidal gold particles were characterized using TEM techniques. The samples were prepared by properly diluting with acetone/H2O mixture, and then were dropped onto a TEM copper film. The resulting film was allowed to dry at room temperature for 30 min followed by TEM imaging, which was operated at an acceleration voltage of 80.2 kv and at a magnification of 100 k. Fifty counts of particles were measured to obtain the size distribution.
The particle size of the conjugates and the colloidal gold particles was measured at 25°C by zetasizer nano. The zetasizer system determines the size by measuring the Brownian motion of the particles in a sample using dynamic light scattering.(11) The colloidal stability of antibody-colloidal gold conjugates and the colloidal gold particles can be compared by measuring zeta potentials. All solutions were adjusted to pH 8.3.
Preparation of GICA test strips
The lateral flow test strip was constructed according to the method of Sun and colleagues(12): gold-labeled antibody solution (OD of 40 at 519 nm) was jetted onto the glass fiber and then dried at room temperature. The coating antigen (1 mg/mL) was jet-positioned onto a nitrocellulose membrane as the test zone, and the control zone was 1 cm away from it, immobilized by goat anti-mouse IgG (0.5 mg/mL). 1% BSA was applied to block the remaining active sites on the membrane, and incubated at room temperature for 2 h. The membrane was washed once by PBST and twice with distilled water, and then dried. The jetted nitrocellulose, absorption pad, and conjugated pad components were assembled and then cut into individual strips.
Detection of chlorpyrifos-ethyl using GICA test strips
The standard solution of chlorpyrifos-ethyl (CE) in the mixture of PBS and methanol (10:1 [v/v]) was dropped on the sample pad. The result was interpreted as long as a red-purple color appeared at the control zone. The presence of a red-purple color at the test zone suggested no CE contained in the sample and vice versa.
To evaluate the potential influences of the environmental matrix on the strip, pesticide-free samples of apple, Chinese gooseberry, soil, and tap water spiked with standard CE were tested along with blank real sample matrix. The samples were prepared according to the method of Kolosovas and colleagues.(13) The fruits and vegetables were washed with distilled water and chopped. Five grams of the sample was extracted with 25 mL PBS (mixed with methanol, 10:1 [v/v]) on shaking table at room temperature for 1 h. Soil samples with standard preparations were extracted with absolute methanol and then filtered through absorbent cotton. Tap water was spiked with standard CE and was detected directly.
Results and Discussion
Synthesis of antigen
All
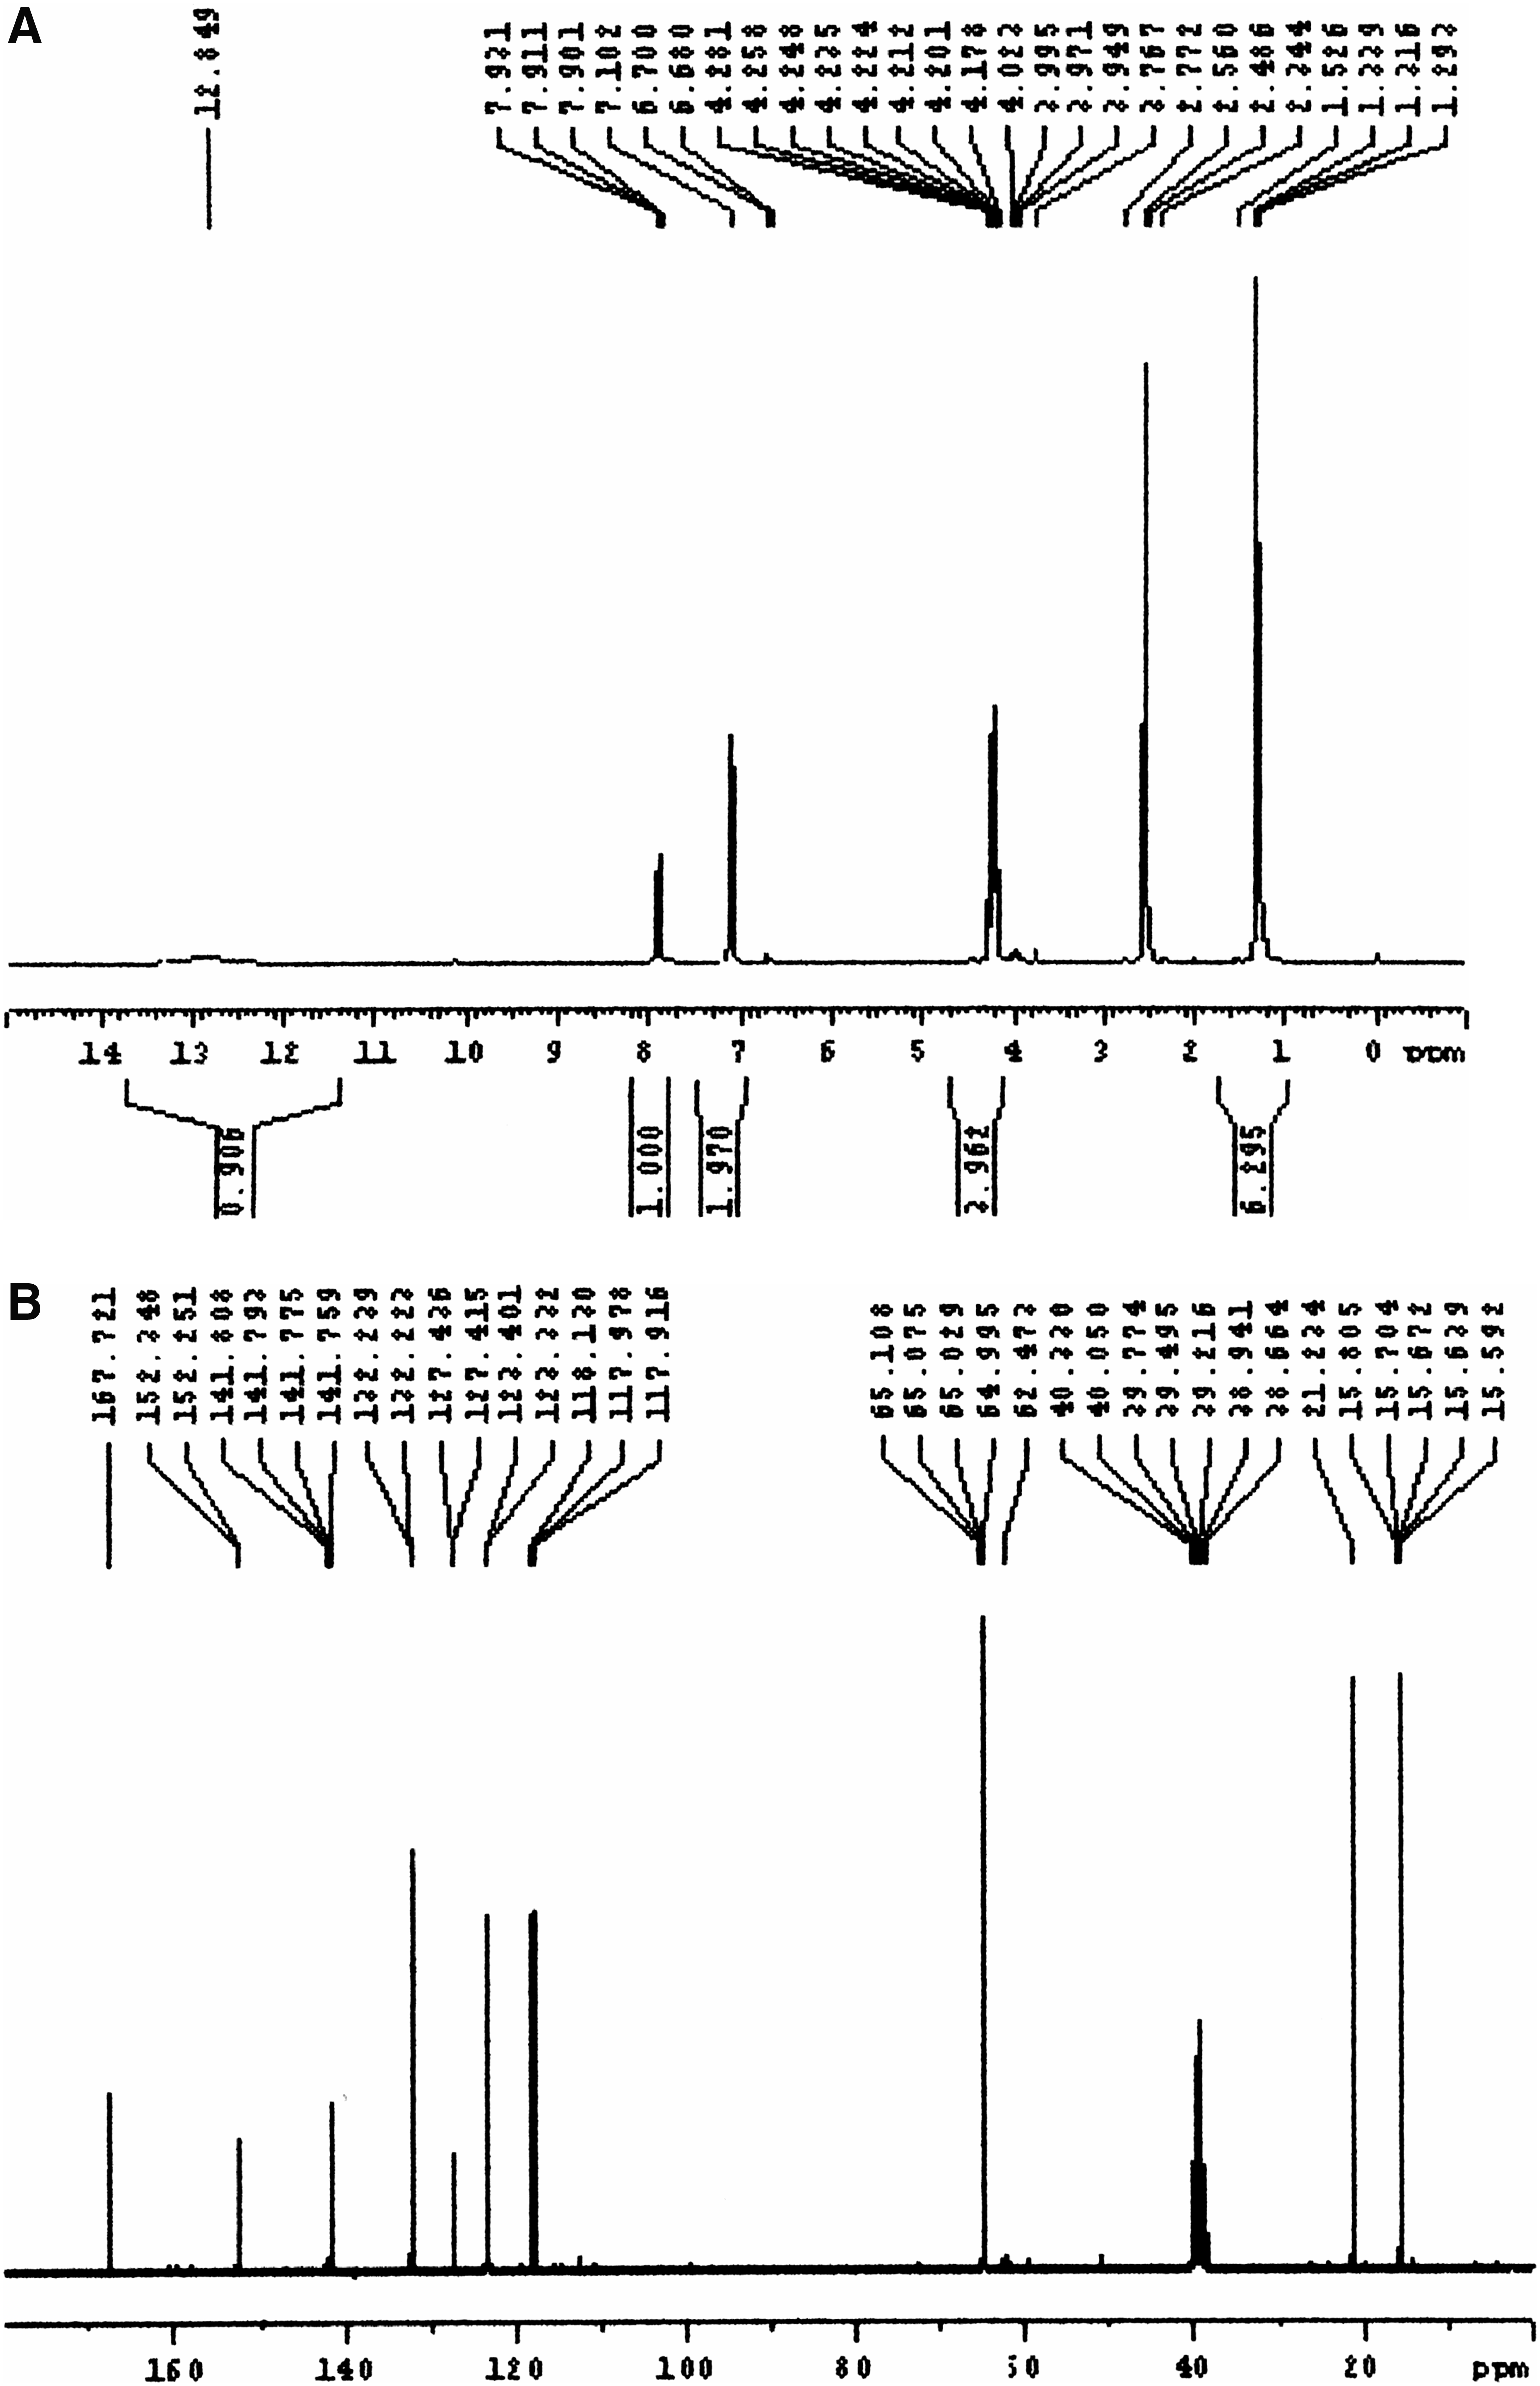
The yield for this hapten is 23%, and the chemical shift values in the NMR data presentation are relative to internal tetramethylsilane. The abbreviations s, d, t, q, sp, m, and ar represent singlet, doublet, triplet, quartet, septet, multiplet, and aromatic, respectively. Ha-He in the NMR data interpretation indicates the benzene ring protons as indicated in Figure 3. 1H NMR (CD3SOCD3): δ 12.849 (1H, s), 6.680−7.102 (2H, s Ha, Hb), 7.901−7.921 (1H, d, Hc), 3.767−4.281 (4H, d × q, CH3CH2O), 2.334−2.772 (3H, s, CH3-ar), 1.293−1.526 (6H, t × d, CH3CH2O). 13C NMR (CD3SOCD3): δ 167.721 (ar-COOH) 152.251−152.348 (Cf), 132.223−141.808 (Cc), 123.332−127.436 (Ca), 117.916−118.130 (Cd, Ce), 15.592−15.704 (-O-CH2-CH3), 38.664−40.330 (-O-CH2-CH3), 21.234 (ar-CH3).
1H NMR (
Substances with a molecular weight <1000 kDa are not immunogenic by themselves, so they were conjugated to highly immunogenic macromolecules to stimulate a potent immune response.(16) Keyhole limpet hemocyanin (KLH), a protein from mollusks, is often viewed as a superior carrier because it is foreign to the vertebrate immune system.(17) However, in this study we chose BSA as a carrier protein for its lower price, and repeated experiments satisfactorily validated its immunogenic effect. In addition, screening positive clones by indirect ELISA requires a heterologous carrier to avoid potential cross-reactivity with the target antigen. We chose OVA as a carrier to produce the antigens for screening.
Development and characterization of MAb against OP pesticides
All of the antiserum from the BALB/c female mice injected with immunogen (hapten-BSA) exhibited high titer values after the third injection (second boost). One clone secreting antibody was selected for further characterization.
The dilution of the antibodies for competitive indirect ELISA was optimized by running repeated assays under various conditions. To eliminate the effect of methanol on enzymatic reactions, we also applied 10% methanol to negative control wells and blank wells. Although 25% methanol was the tolerant limit for bioactive substances, we preferred 10% to obtain near-optimal standard curves.
The specificities of the antibodies toward four different OP pesticides—chlorpyrifos-ethyl, parathion-methyl, phoxiom-ethyl, and triazophos-ethyl—were not uniform. As the inhibition curves show in Figure 4, the 50% inhibiting concentration (IC50) values of phoxiom-ethyl and triazophos-ethyl were much higher than those of chlorpyrifos-ethyl and parathion-methyl, and the minimum IC50 value (93 ng/mL) was observed in chlorpyrifos-ethyl curve. This affinity difference is expected, since the similarities of chemical structures to the hapten vary. These results indicate that both the aromatic ring and the thiophosphate group were related in inducing antibodies against OP pesticides. The competitive indirect ELISA in this study had better sensitivities toward chlorpyrifos-ethyl and parathion-methyl. A study by Jang and colleagues(18) showed proximate results using an as semblable antigen. Bromophos-ethyl, bromophos-methyl, and dichlofenthion were tested in the Jang study with fine sensitivity.(18) We inferred that the three OP pesticides were also among the detection range of our test assays.
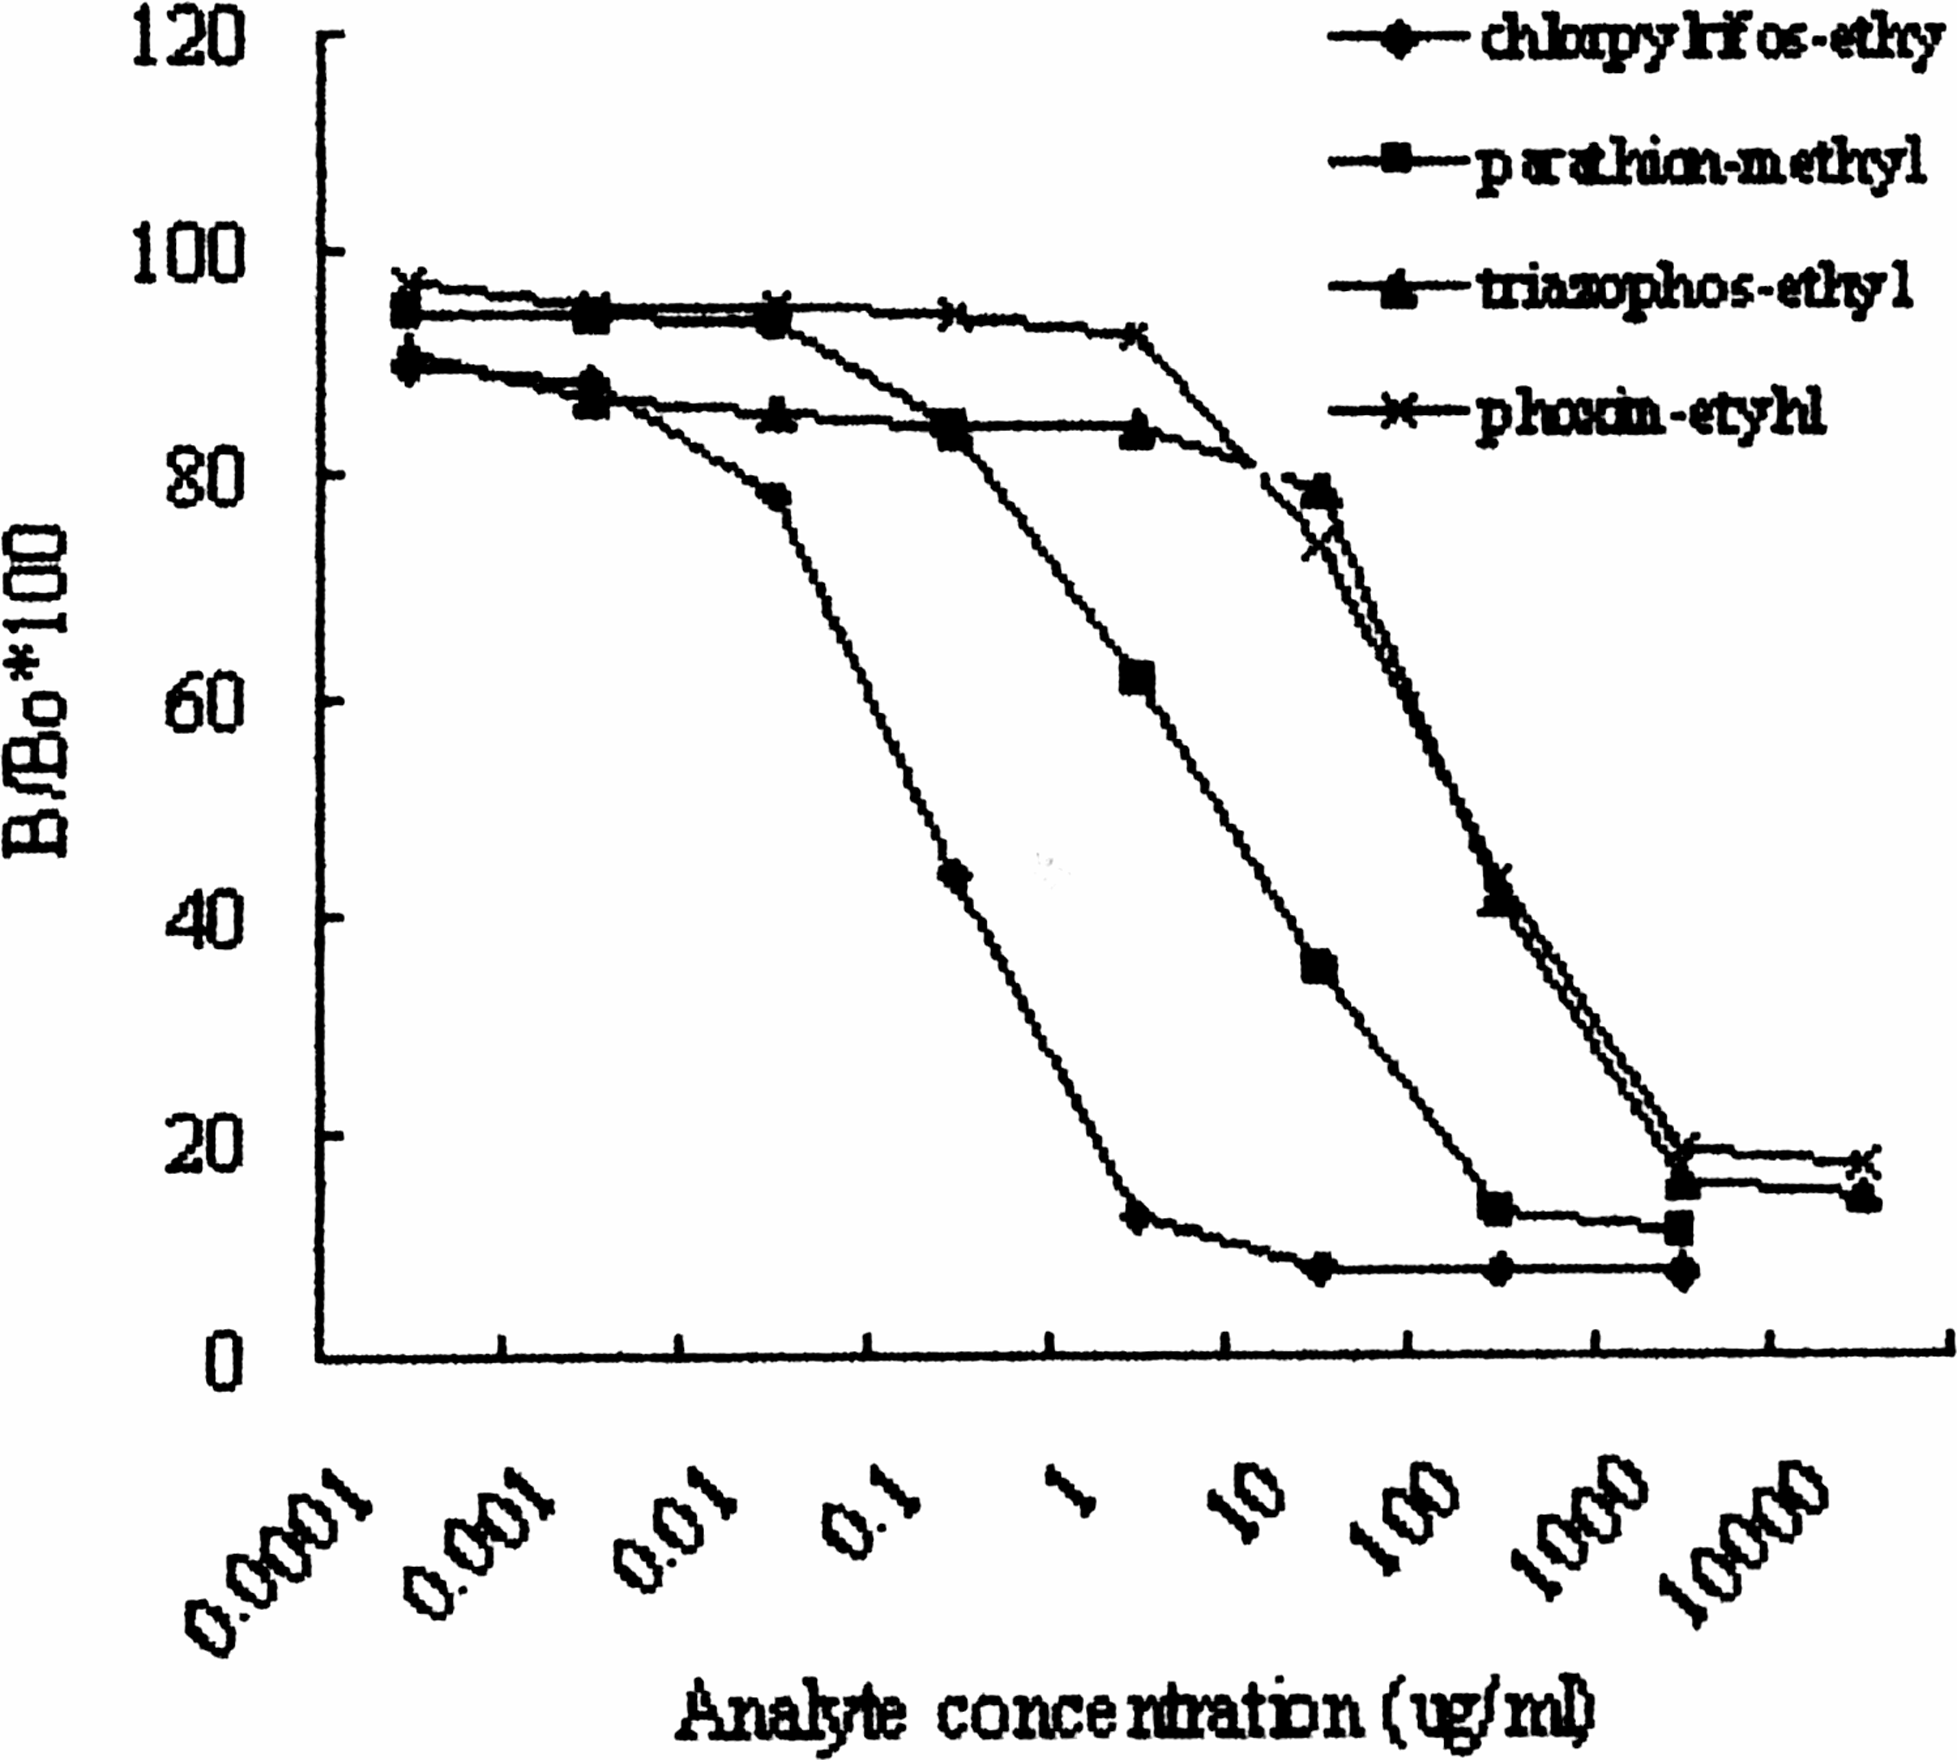
Dose-response curves for OP pesticides.
Characterization of antibody-colloidal gold conjugates
The antibody-colloidal gold conjugates were characterized by UV-vis spectroscopy. A peak at 519 nm in curve A (Fig. 5) can be ascribed to the surface plasmon resonance of colloidal gold. After the addition of antibodies, the band broadened and red shifted to 525 nm as a result of antibody-gold colloid interaction in curves B and C. Antibodies on gold surface were validated again by the peak at 280 nm due to electron transitions from tryptophane and tyrosine,(10) and the lower absorption band at 280 nm in curve C showed removal of unbound antibodies from antibody-colloidal gold conjugates by centrifugation.
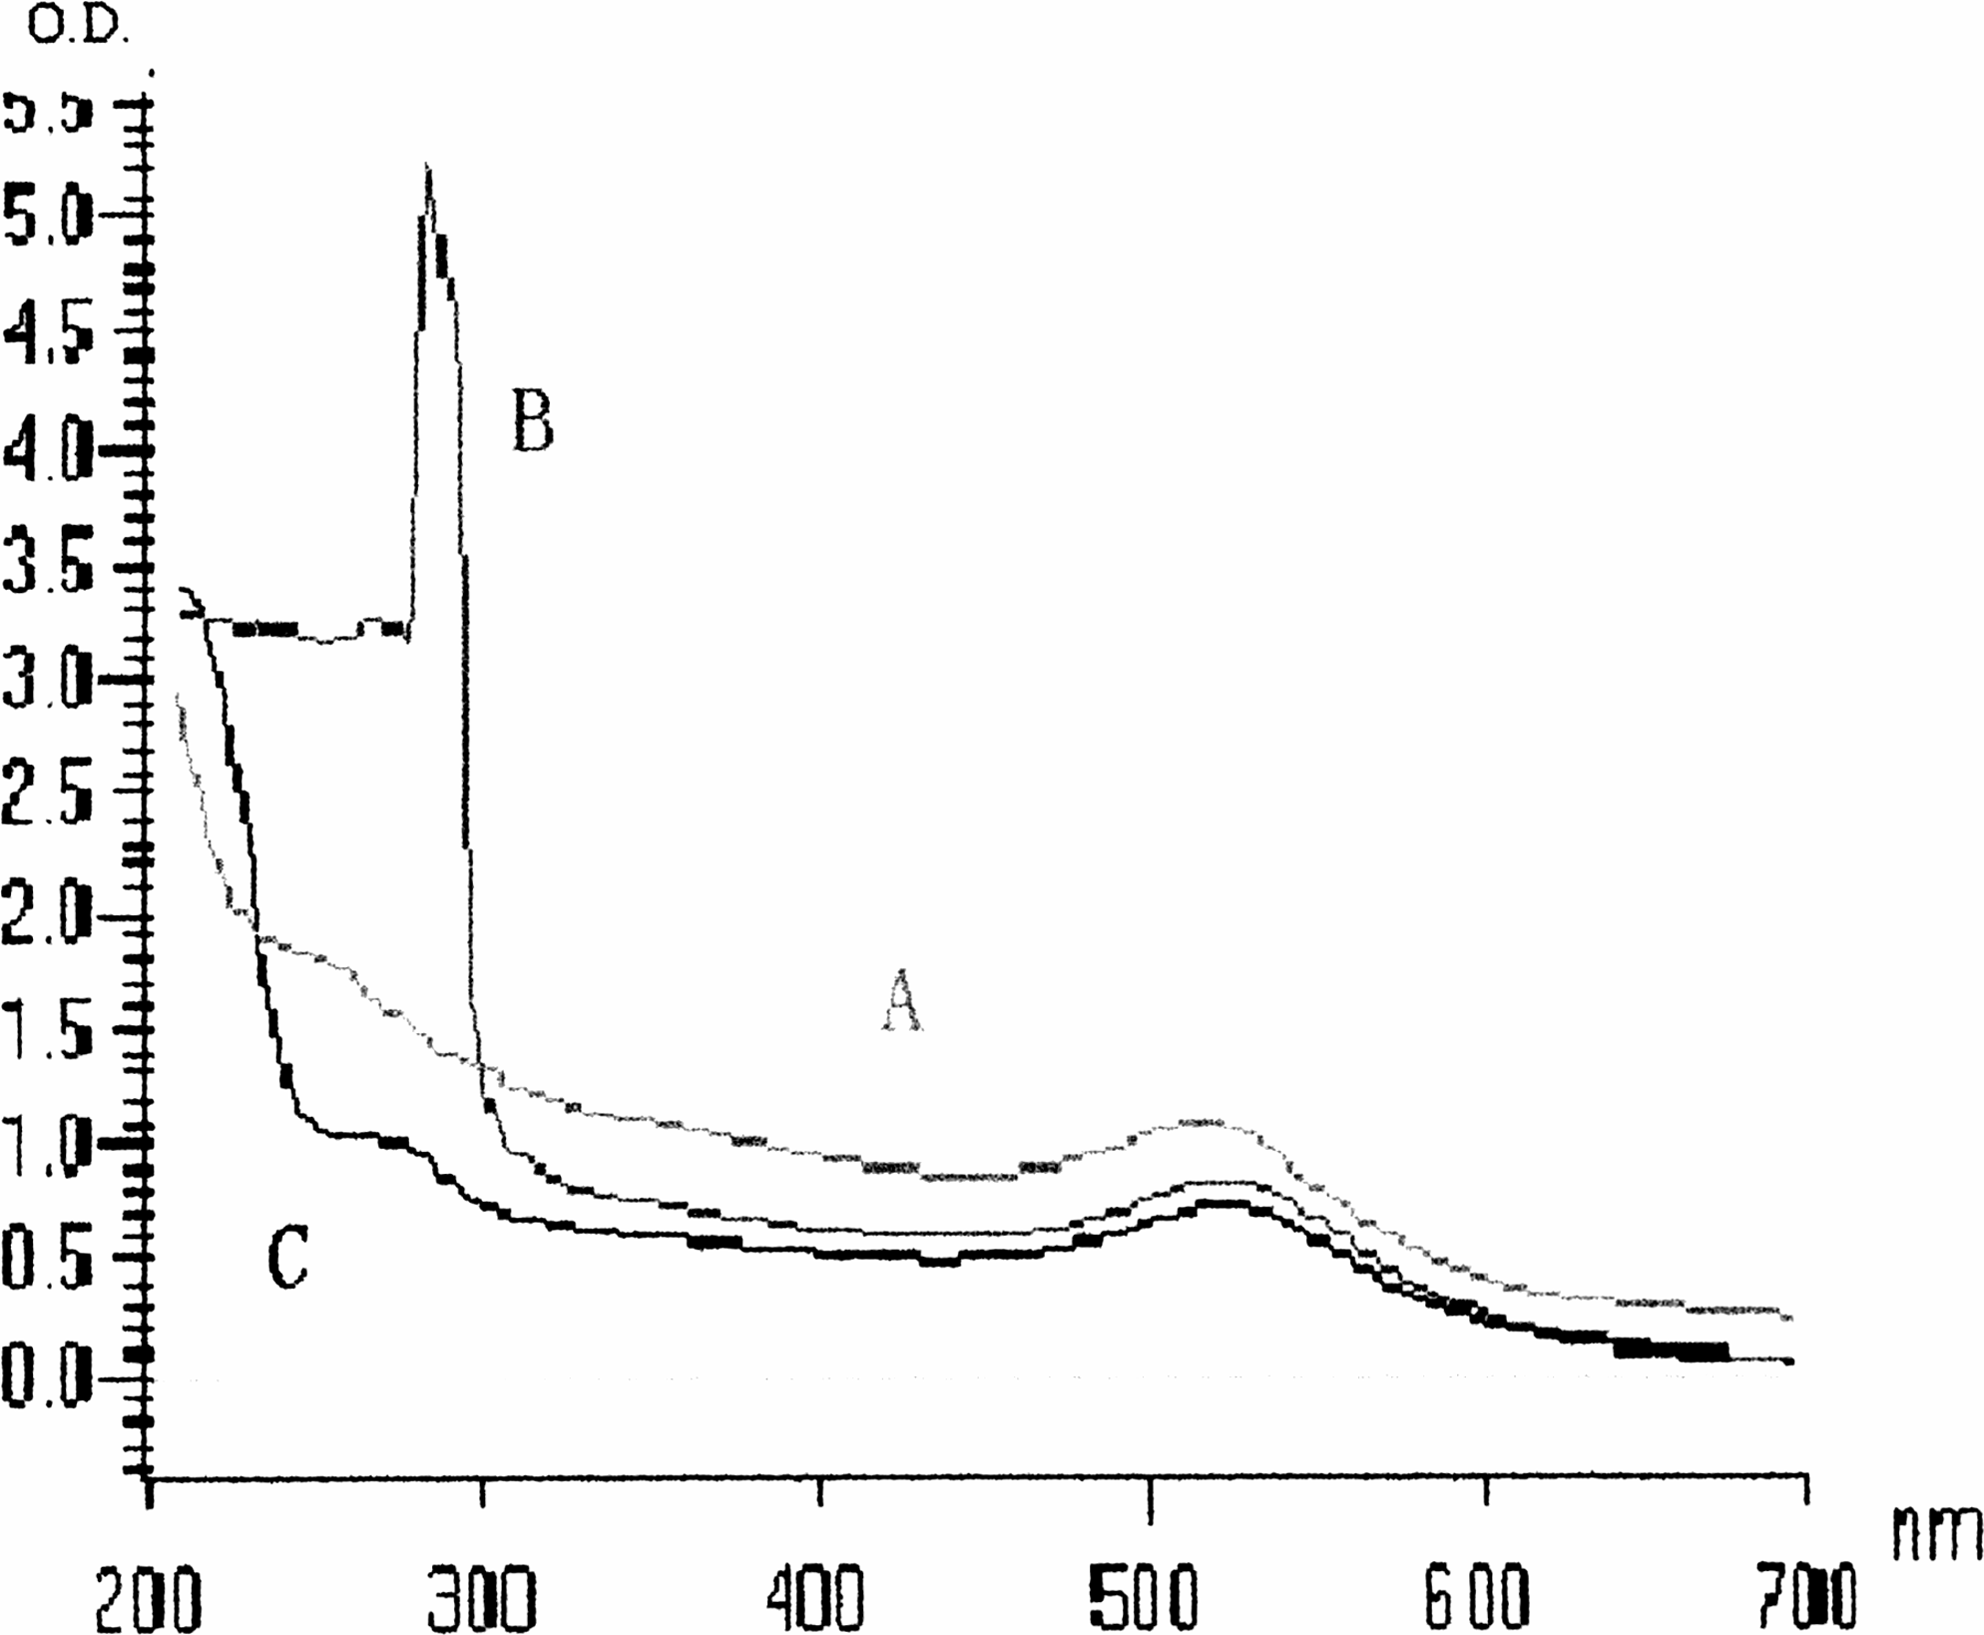
UV-vis spectra of colloidal gold (curve A), antibody-colloidal gold conjugates with unbound antibody (curve B), and antibody-colloidal gold conjugates after centrifugation and removal of unbound antibody (curve C) in the buffer (pH 8.3).
The tertiary structure of the antibody can be studied by fluorescence measurements. The sample was excited at a particular wavelength and the fluorescence emission was monitored from the tryptophan or tyrosine residues in the antibody.(19) The immunoreactivity of antibodies depends upon the tertiary structures remaining unperturbed after being conjugated with colloidal gold.(20) The samples were excited at 295 nm, and the emission bands were monitored in the range of 300∼500 nm. The bands (Fig. 6) observed at 340 nm indicate the intactness of the tertiary structure of antibodies. Curve B shows the fluorescence spectrum of the antibody-gold colloid conjugates recorded under the same excitation conditions. The form of the curve and the position of the peak are quite similar to the curve of free antibodies, which indicates the tertiary structure of the antibodies intact after conjugate formation. A significant fluorescence quenching by colloidal gold was observed, for gold particles in solution can increase the scattering of the emission light.
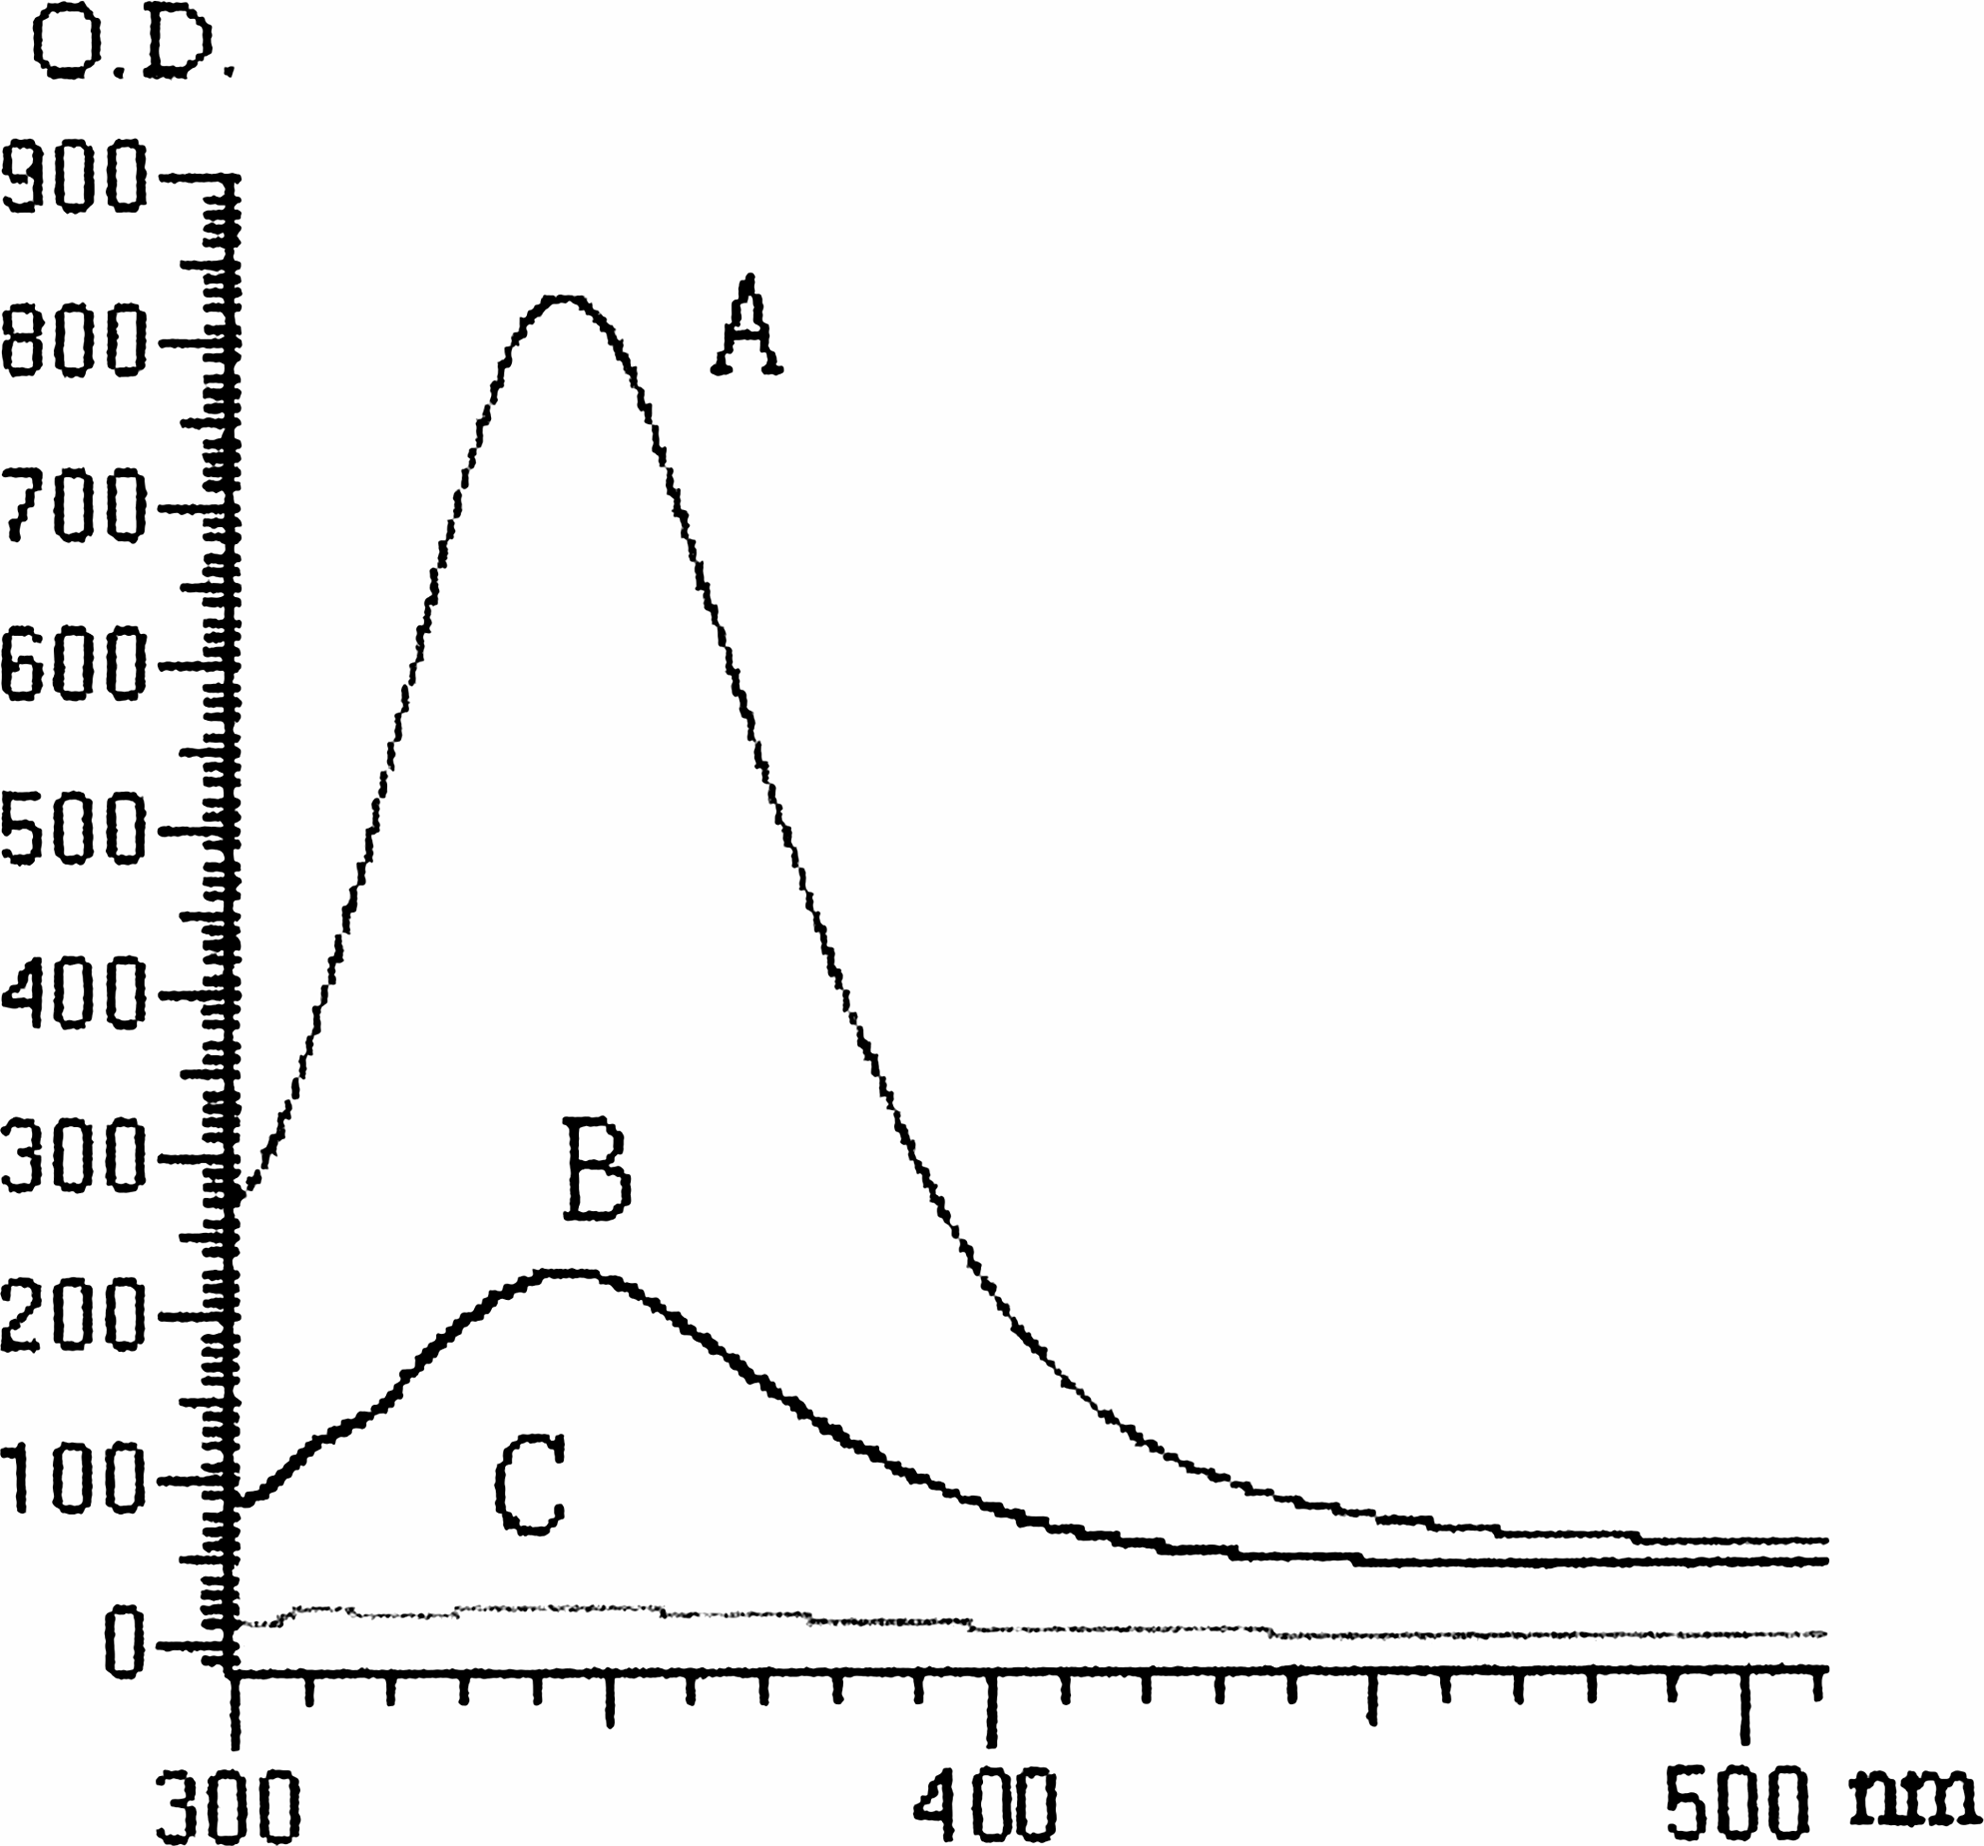
Fluorescence spectra of free antibody (curve A), antibody-colloidal conjugates (curve B), and colloidal gold (curve C) in buffer (pH 8.3, 0.5 mM).
In the TEM micrographs, the particles were homogeneous in shape and size (Fig. 7). The images of the conjugates showed halos around the particles. The size distribution of particles is shown in Figure 7, with a mean diameter of 16.08 ± 0.64 nm. This result was within the typical range of antibody-colloidal gold conjugates (10−20 nm) used in GICA strips.(21) The colloidal gold showed a mean diameter of 12.82 ± 0.48 nm. The difference between the two diameters was significant (p < 0.001).
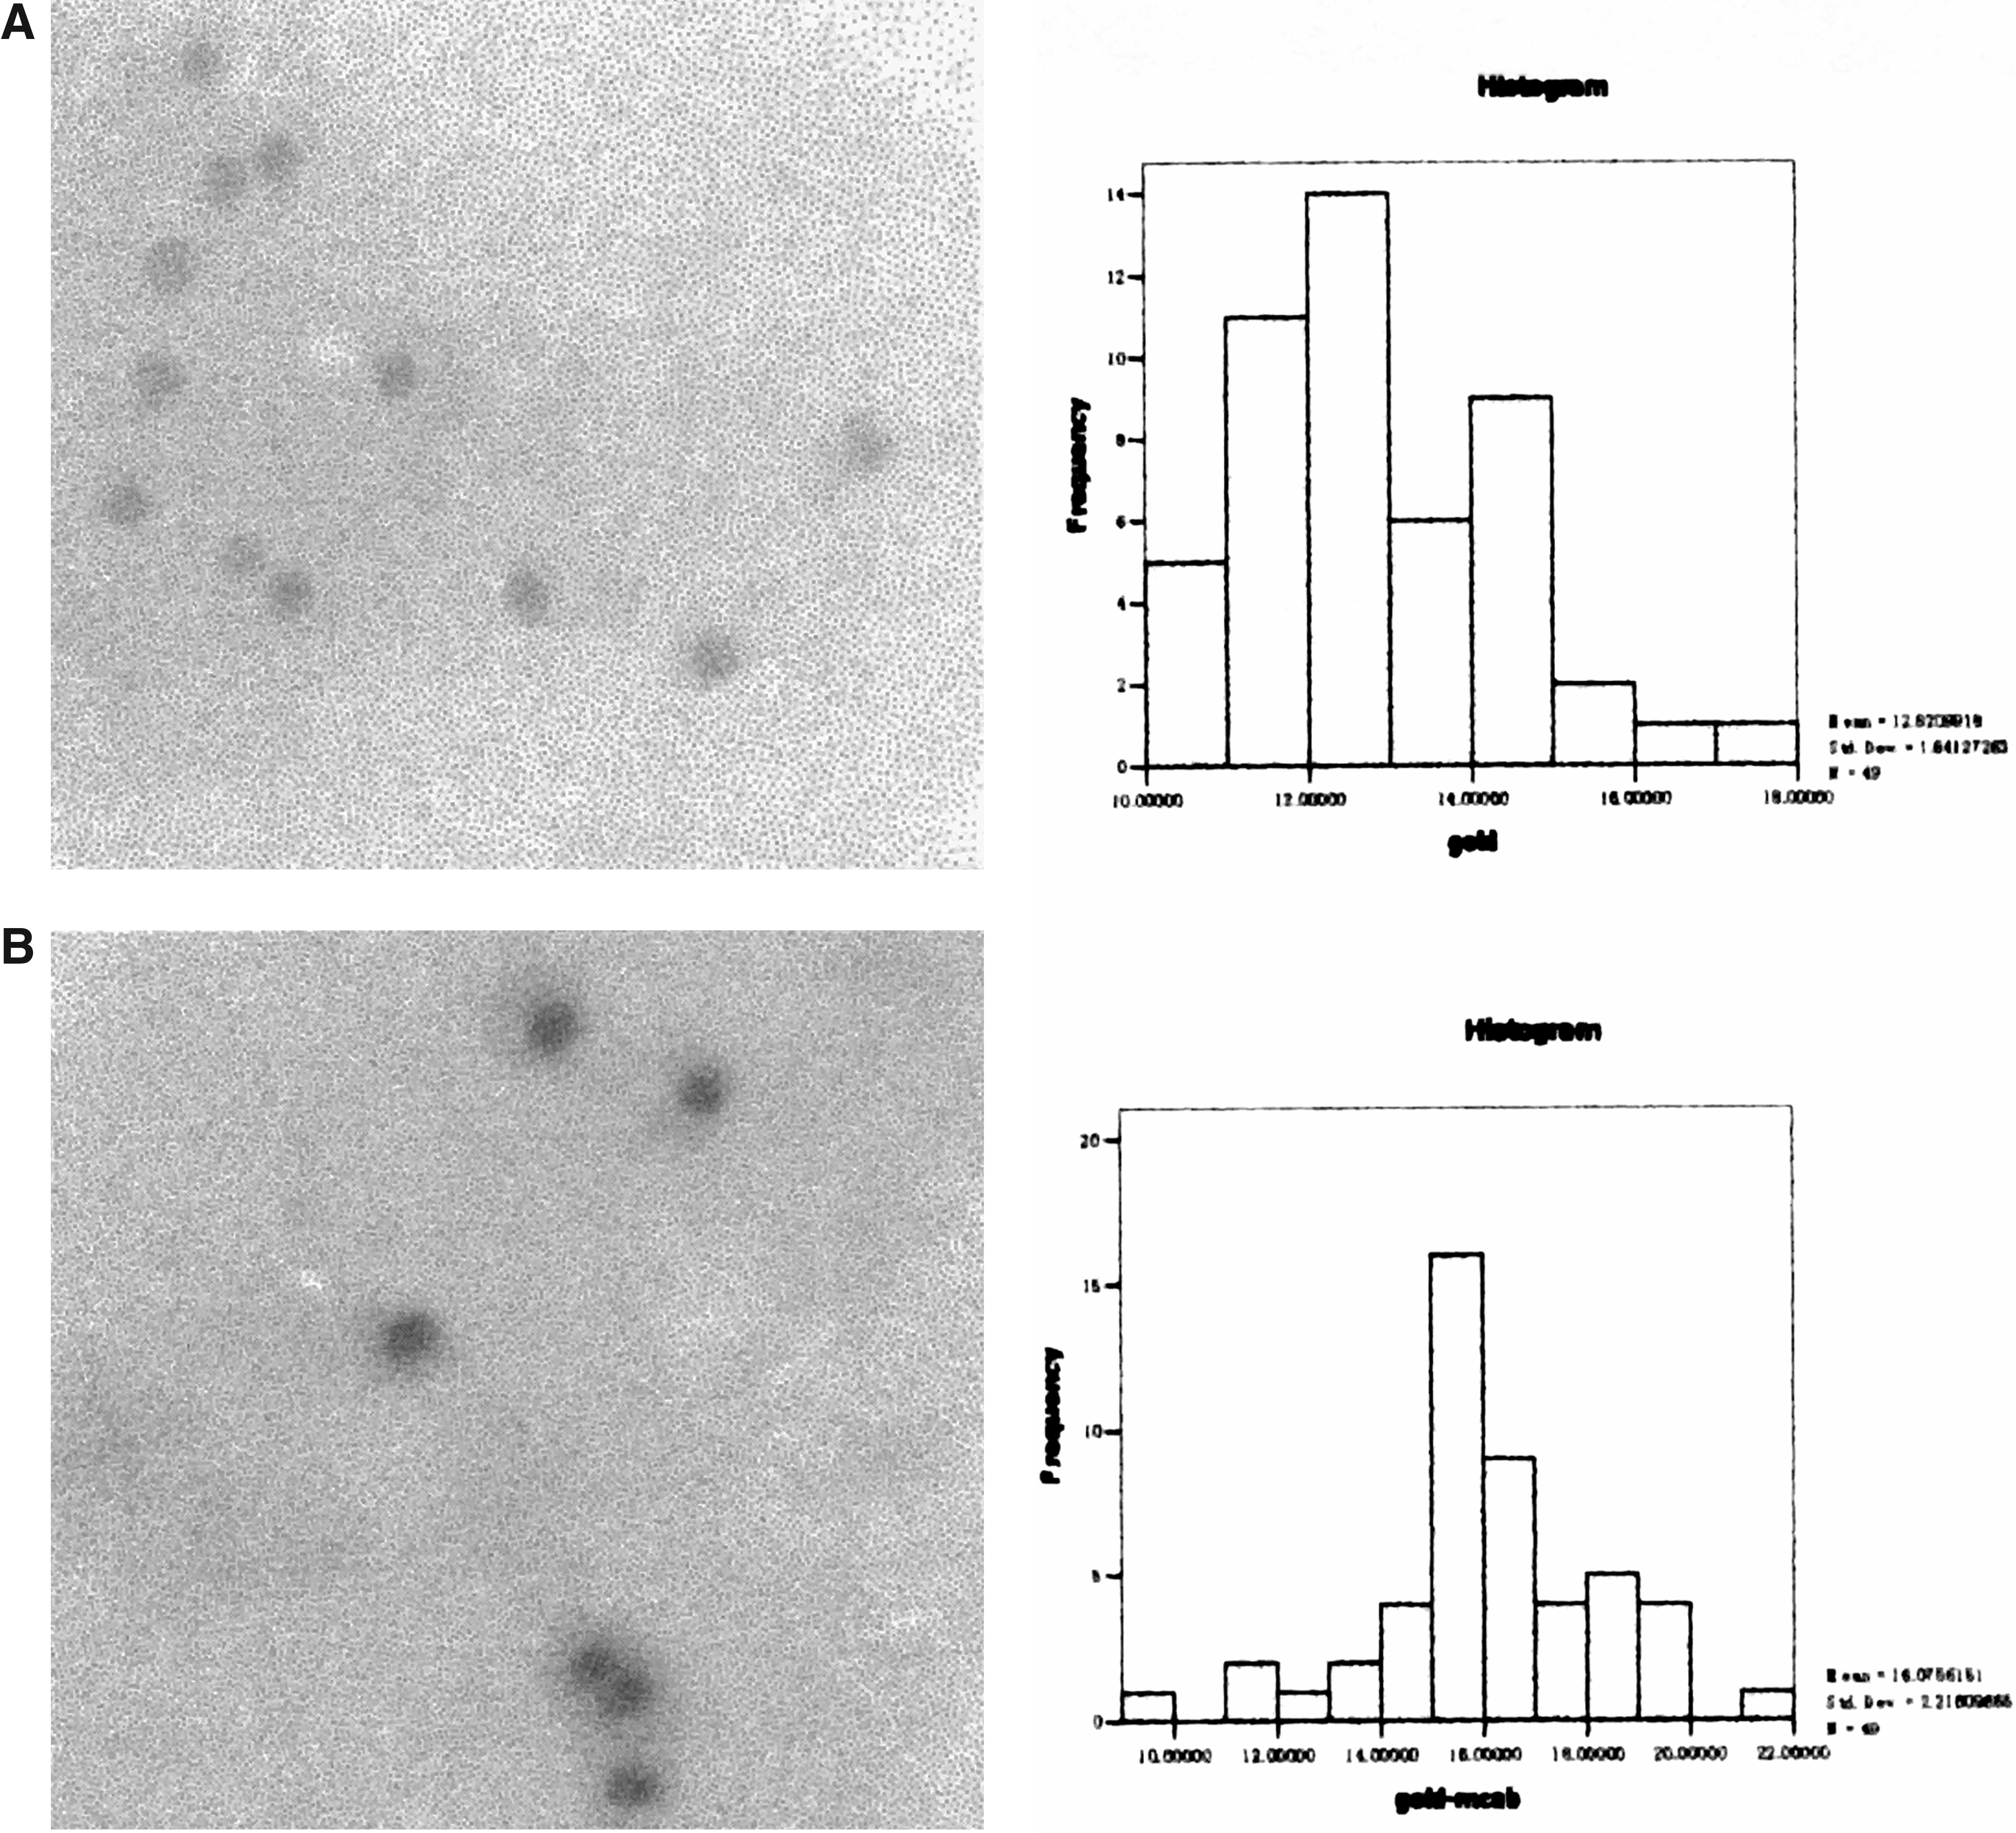
TEM images and size distribution of colloidal gold particles (
DLS is also known as photon correlation spectroscopy (PCS). It analyzes the size of the particles by measuring Brownian motion.(12) The estimation is based on the assumption that the particles are spheres; hence the data do not contain the information of geometric shape. Although the size and shape of the particles had been studied using TEM, the distribution of the particle diameters can be learned by DLS rapidly. The DLS calculated the mean diameter of the colloidal gold particles as 15.0 ± 3.4 nm, and 25.0 ± 6.45 nm for the antibody-colloidal conjugates. Aryal and colleagues(22) have determined size distribution of gold nanoparticles by DLS measurement, and they declared that the size distribution histogram is similar to the TEM image. Therefore the DLS measurement of particle size can be used as a cheap alternate to TEM.
Preparation of GICA test strip
A schematic diagram shows the areas where the components are immobilized on the IC test strip (Fig. 1). Dipping the IC strip into an aqueous sample causes the transport of the liquid and gold-labeled antibodies by capillary action. If no analytes are contained in the solution, the gold-labeled antibodies migrate to bind on the test line (T) and accumulate to generate a red-purple color. In contrast, if there is CE or PM in the solution, it can competitively bind to the labeled antibodies and prevent the antibody-antigen interaction. Then the intensity of the red-purple color is reduced. For the control line (C), a red-purple color will appear independently since the antibody-colloidal gold conjugates are in excess. The emergence of the control line indicates the result is available. This GICA test strip can complete a detection assay within 5 min. In comparison with fluorescence or enzyme-detection systems, it does not require the exacting operations of incubation, washing, and enzymatic reactions.(23,24) Additionally, the results can be read directly by the naked eye, so it will provide a convenient assay on site.
Detection of standard chlorpyrifos-ethyl by GICA test strip
The minimum concentration, which made the test line disappear but the control line emerge clearly, is the detection limit of the GICA test strips. Results of repeated experiments verified that the detection limit for CE was 4 μg/mL (Fig. 8).
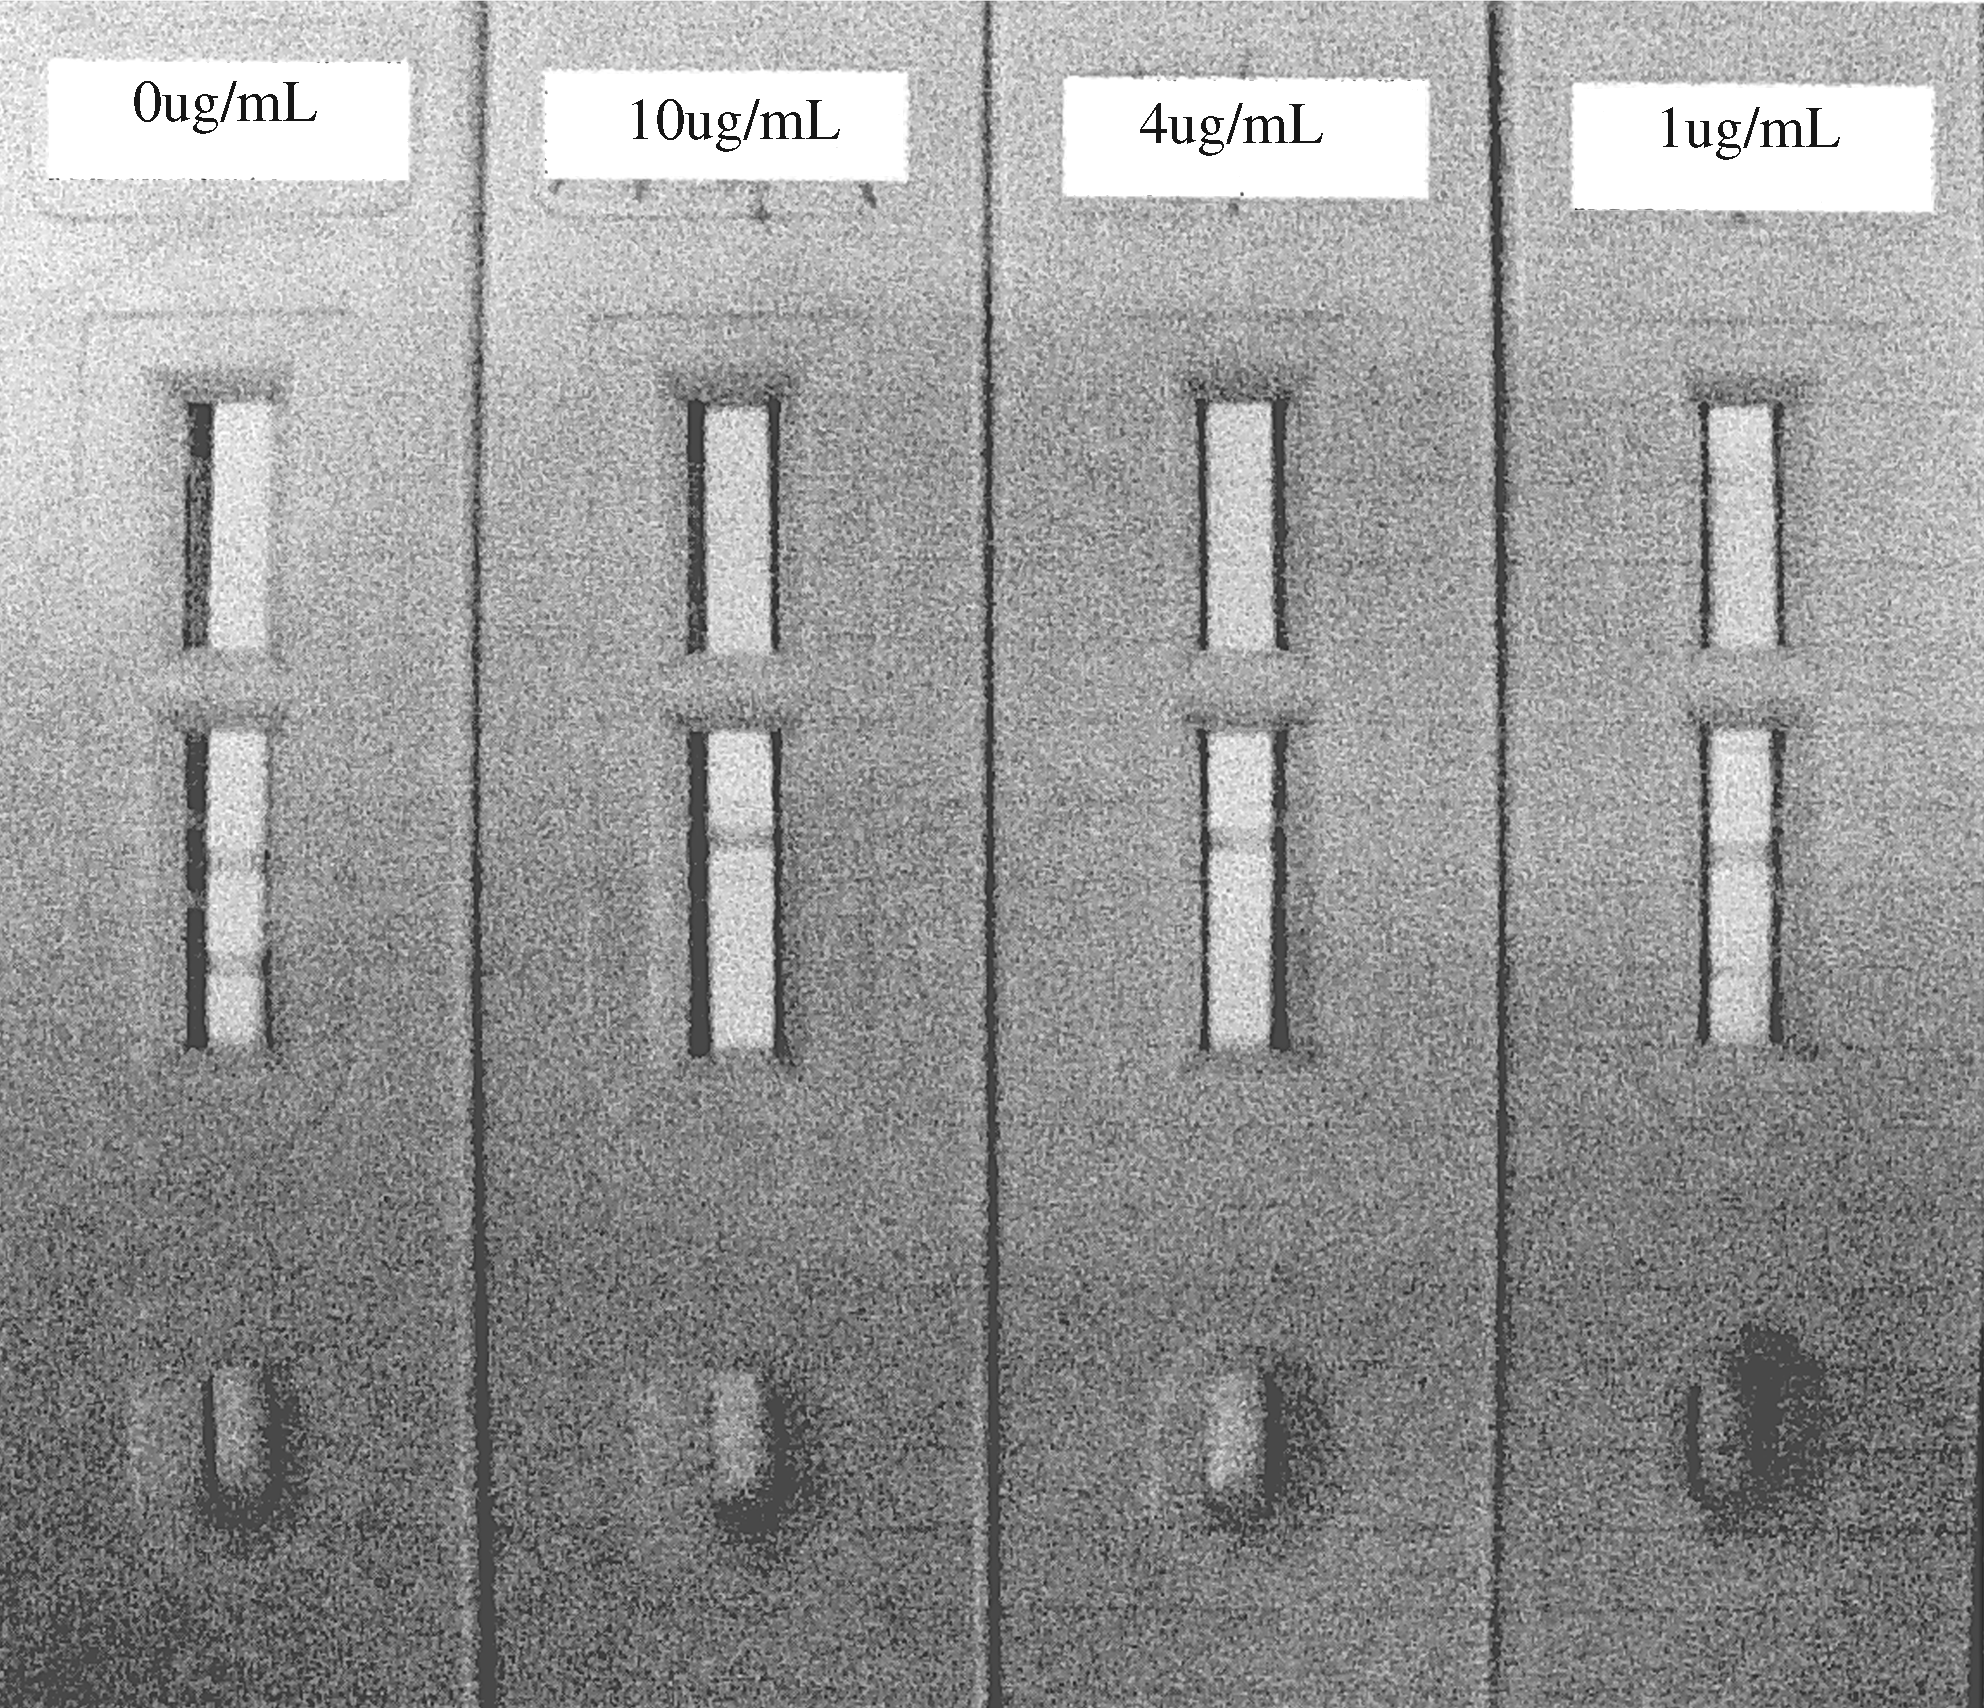
GICA strip test results at CE concentrations of 0, 10, 4, and 1 μg/mL (from the left) in PBS (pH 7.4). C, control line; T, test line.
To determine the interference from variously environmental matrix, samples of fruits, vegetables, and soil spiked with CE at the concentration of 6 μg/mL were tested (Fig. 9). The results showed that the pesticide could be detected and no interference was observed in the real samples.
Evaluation of GICA strip with blank soil extract (left strip) and soil extract spiked with CE at a concentration of 6 μg/mL (right strip).
Conclusion
Here we have developed a GICA test strip based on class-specific MAb against OP pesticides. Preliminary results showed that it was possible to detect the presence of CE at a concentration as low as 4 μg/mL. The maximum residue level (MRL) for OP pesticides on most fruits and vegetables is 1 mg/kg,(25) so the techniques developed can be applied as screening methods for CE residues on the spot. The established assay is simple and easy to interpret without any sophisticated instruments. However, this procedure has not met the ideal criteria of uniform response to all OP pesticides. Therefore, the present work demonstrates the need to improve the detection homogenicity.
Footnotes
Acknowledgment
This work was funded by a grant (no. 2006K01G21) from the Science and Technology Program of Shaanxi Province.