
Abstract

Introduction
Consumption of renewable energy in the United States is the highest in history, contributing to energy security, greenhouse gas reductions, and other social, economic, and environmental benefits. The largest single source of renewable energy is biomass, representing 3.9 quadrillion of 9.6 quadrillion British thermal units (Btu) in 2015. 1 Biomass includes agricultural and forestry resources, municipal solid waste (MSW), and algae.
For more than a decade, the U.S. Department of Energy (DOE) has been quantifying the potential of U.S. biomass resources, under biophysical and economic constraints, for production of renewable energy and bioproducts. The 2016 Billion-Ton Report: Advancing Domestic Resources for a Thriving Bioeconomy (BT16) evaluates the most recent estimates of potential biomass that could be available for new industrial uses in the future. BT16 consists of two volumes: Volume 1 (this volume) focuses on resource analysis—projecting biomass potentially available at specified prices. Volume 2 evaluates changes in environmental sustainability indicators—water quality and quantity, greenhouse gas emissions, air quality, soil organic carbon, and biodiversity—associated with select production scenarios in volume 1.
The following is a summary of BT16, volume 1:
Goals of the Analysis
BT16 is the third DOE-sponsored report to evaluate biomass resource availability in the conterminous United States. Each report addressed different goals. The 2005 Billion-Ton Study (BTS) was a strategic assessment of the potential biophysical availability of biomass. It identified the potential to produce more than one billion tons per year of agricultural and forest biomass sources—sufficient to produce enough biofuel to displace 30% of then-current petroleum consumption. However, this biophysical potential was not restricted by price, which is a key factor in the commercial viability of bioenergy and biofuels strategies.
The 2011 U.S. Billion-Ton Update (BT2) evaluated the availability of biomass supply as a function of price. Employing an economic model to simulate potential biomass supply response to market demands, BT2 evaluated the potential economic availability of biomass feedstocks under a range of offered prices and yield scenarios between 2012 and 2030. It again projected the potential for more than 1 billion dry tons of biomass per year to be potentially available by 2030, assuming market prices of $60 per dry ton at the farmgate or roadside (i.e., after harvest, ready for delivery to a processing facility).
This report (BT16) builds on previous research to address key questions: • What is the potential economic availability of biomass resources using the latest-available yield and cost data? • How does the addition of algae, miscanthus, eucalyptus, wastes, and other energy crops affect potential supply? • With the addition of transportation and logistics costs, what is the economic availability of feedstocks delivered to the biorefinery?
Scope of Analysis
Building on previous analyses, BT16 (1) updates the farmgate/roadside analysis using the latest available data and specified enhancements; (2) adds more feedstocks, including algae and specified energy crops; and (3) expands the analysis to include a scenario study to illustrate the cost of transportation to biorefineries under specified logistical assumptions.
The analysis is applied to a range of biomass resources. Currently used resources (biomass resources allocated to energy production) are described in chapter 2 and include resources from agricultural lands (grains and oilseeds for liquid fuels), forestlands (logging residues and forest thinnings for pellets, heat, and power), and wastes (black liquor, mill wastes, biosolids, and MSW for industrial sector power). Forestland resources, evaluated in chapter 3, include logging residues and whole-tree biomass. Agricultural land resources, addressed in chapter 4, include crop residues, herbaceous energy crops, and woody energy crops. The waste resources in chapter 5 include secondary and tertiary wastes from processing agricultural and forestry products, and urban wastes (e.g., mill wastes, grain hulls, manures).
The projections of potential biomass supplies in BTS and BT2 were limited in scope to the farmgate or forest roadside. As noted in the 2011 report, “It is important to understand that the estimates in the report do not represent the total cost or the actual available tonnage to the biorefinery. There are additional costs to preprocess, handle, and transport the biomass” (DOE 2011). Chapter 6 of this report broadens the scope of analysis with case studies to characterize the potential economic availability of select biomass resources as delivered to biorefineries.
Differences between the scope of this report and earlier reports, as well as differences in data sources, are summarized in chapter 1. Demands for food, feed, fiber, and timber are met before considering the biomass resources for bioenergy and bioproducts in this report. The simulation period for agricultural and forestry resources in this report is 2015 to 2040. Currently available resources are reported as those present in 2015, unless otherwise specified. For energy crops, the specified prices are applied nationally for all years from 2019 to 2040. Algae biomass is simulated under current productivities, 2014 costs, and higher future productivities.
Although the economic availability of future algal biomass is difficult to quantify, BT16 includes potential open-pond algal biomass production that may be associated with select resource co-location opportunities—co-location with carbon dioxide (CO2) from ethanol plants, coal power plants, and natural gas plants. Biomass, and price ranges for that biomass, are estimated for Chlorella sorokiniana (a freshwater strain) and Nannochloropsis salina (a saline strain) in chapter 7. Costs for freshwater production assume that only minimal lining is needed, whereas the costs of saline production are estimated using minimal and full liners.
Roadside: Forest Resources and Urban Wood Waste
Potential forest residues and forest thinnings were quantified from an empirical model using forest inventory and analysis data. Scenarios evaluated include combinations of housing demand (moderate or high), wood energy demand (low, moderate, or high), and plantation management intensity in the South (moderate or high). At prices of up to $60 per dry ton, 103 million and 97 million tons per year of biomass resources are potentially available from forestlands in 2017 and 2040, respectively, in the base-case scenario (all timberland, including federal lands). A summary of currently used and potential additional supplies from forestlands is shown in Table 1. These results represent a least-cost mix of resources up to a specified level of demand. Spatial distribution of the 97 million tons available at $60 per ton in 2040 are shown in Fig. 1.
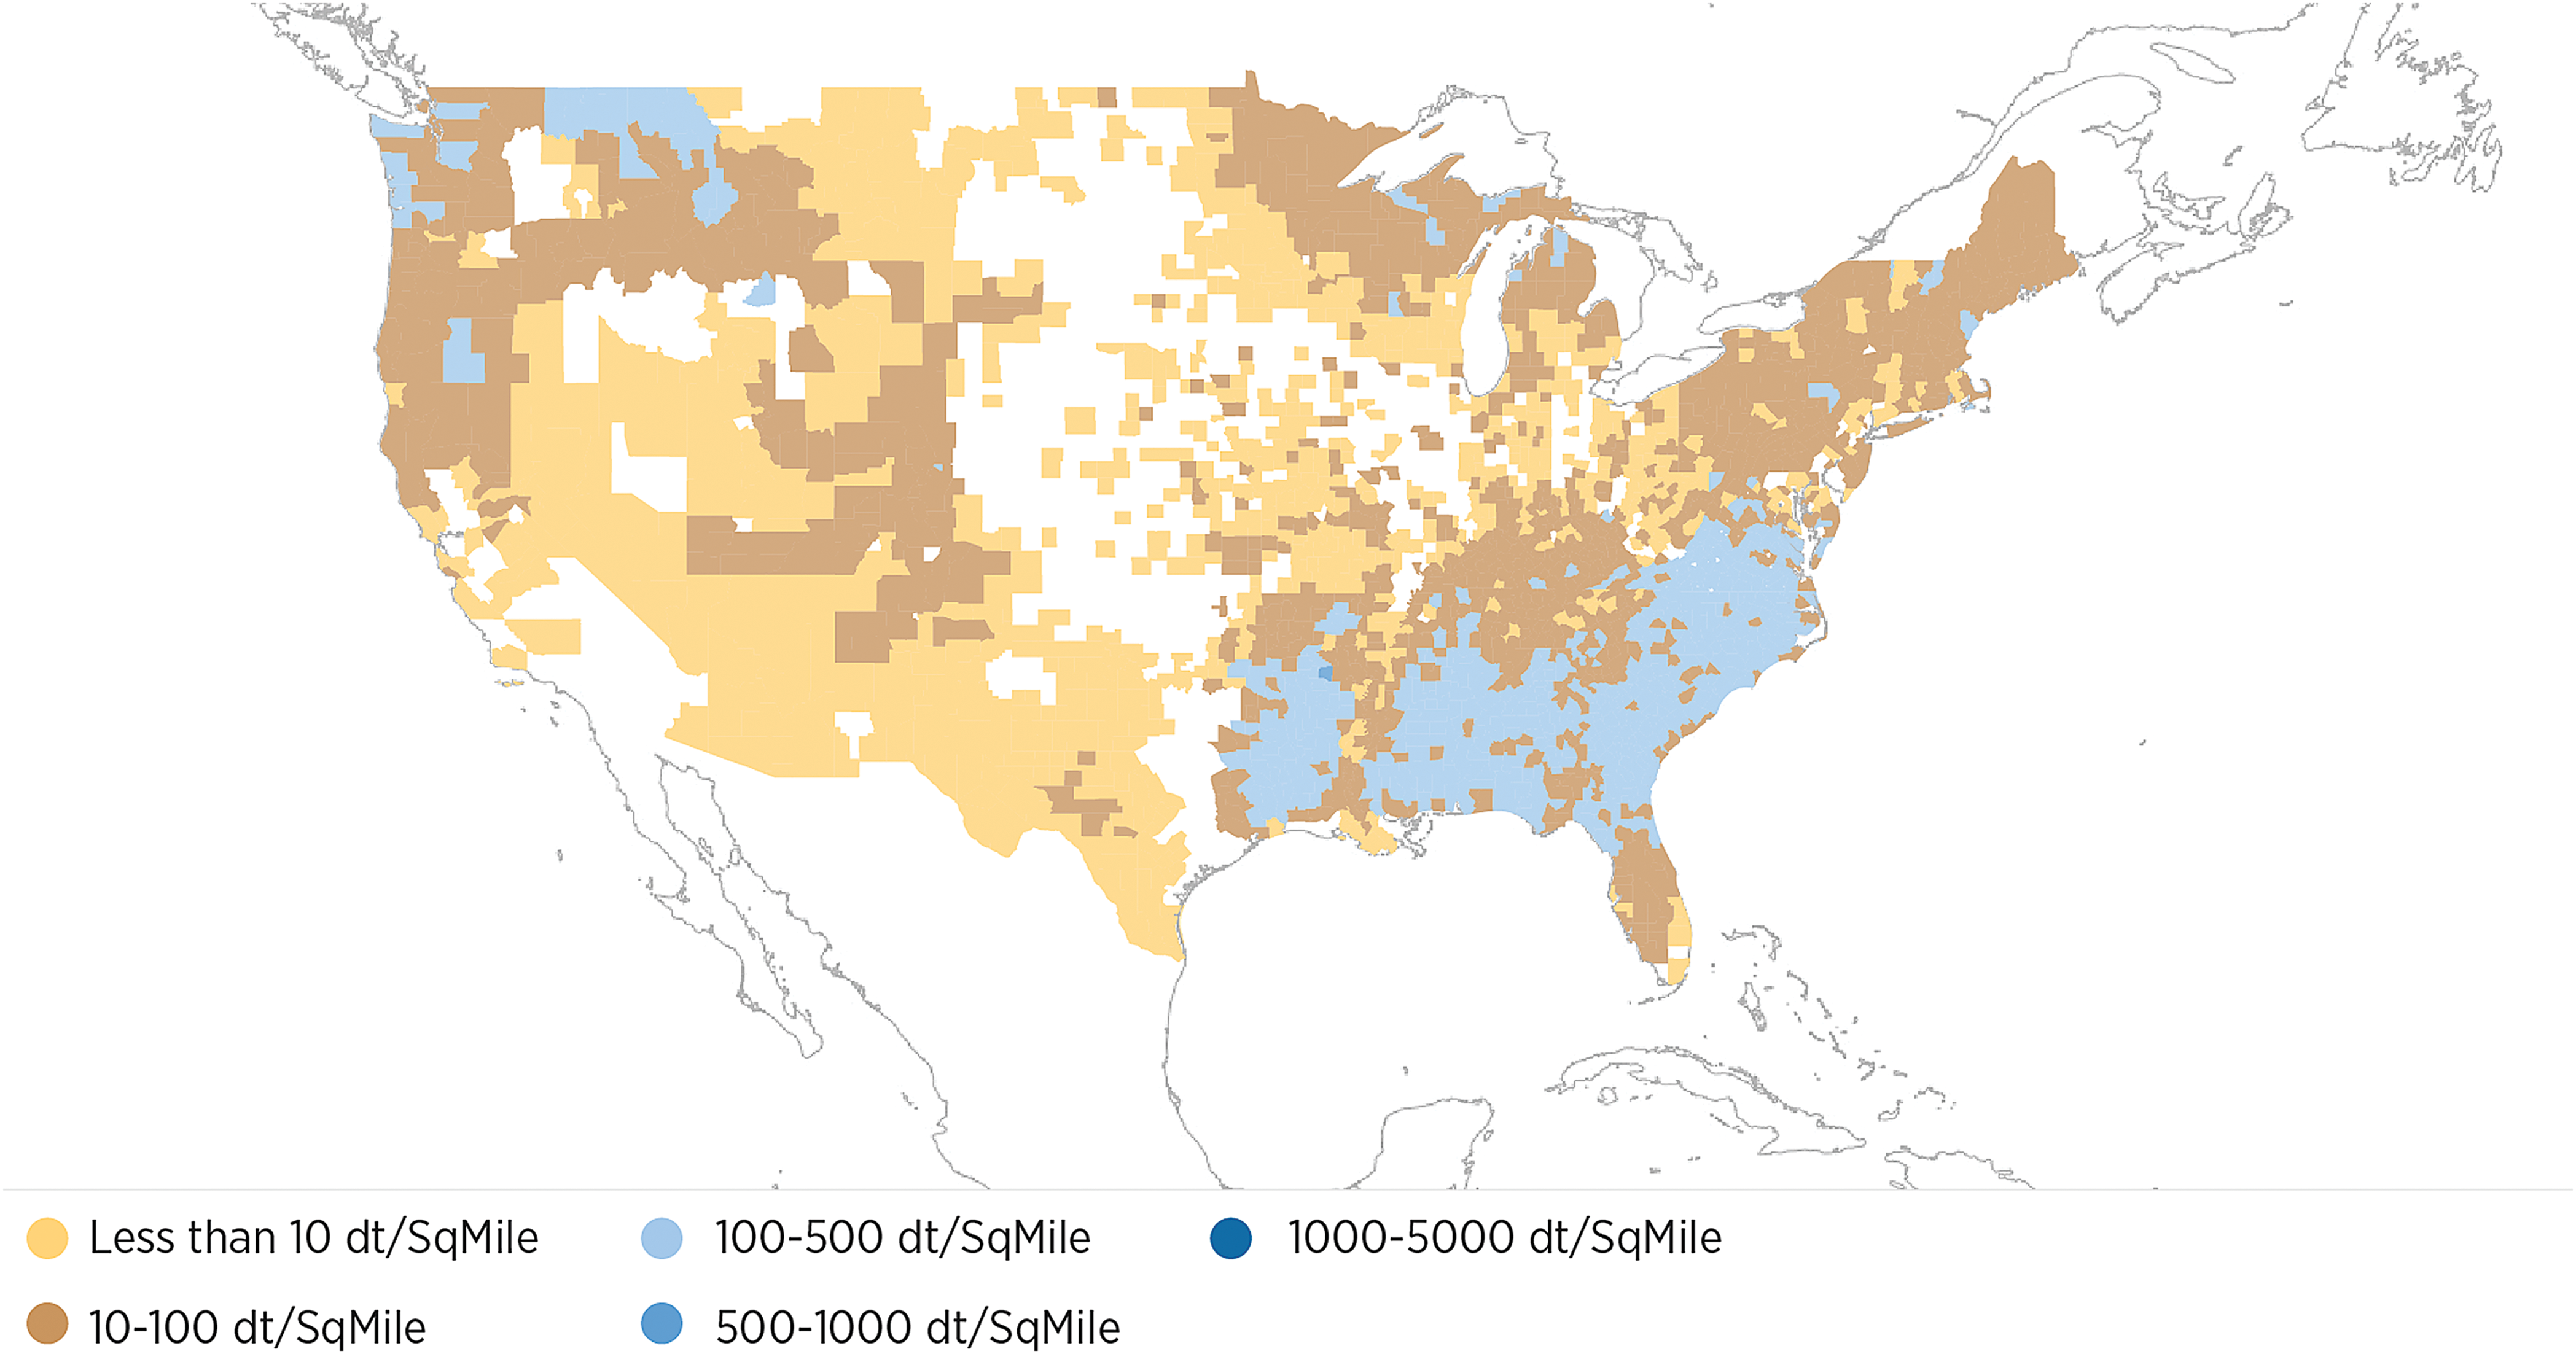
Forest resource totals, 2040, $60 per dry ton or less, roadside (with federal lands, base-case scenario). Color images available online at
Summary of Currently Used and Potential Forest, Agricultural, and Waste Biomass Available at $60 per Dry Ton or Less, Under Base-Case and High-Yield Scenario Assumptions (Microalgae Resources Reported in Table 2)
Numbers may not add because of rounding. Currently used resources are procured under market prices. aForestry baseline scenario; bForestry resources include whole-tree biomass and residues from chapter 3 in addition to other forest residue and other forest thinnings quantified in chapter 5; cEnergy crops are planted starting in 2019. Note: BT2 assumed a 2014 start for energy crops; dThe potential biogas from landfills is estimated at about 230 billion ft
3
per year; eForestry high-housing, high biomass-demand scenarios; fThe high-yield scenario assumes 3% annual increase in yield. Interactive visualization available at
At the Farmgate: Agricultural Supplies
Resources from agricultural lands include crop residues and biomass energy crops. While energy crops in BT2 were generalized to simulate energy crop categories, switchgrass, miscanthus, energy cane, biomass sorghum, willow, eucalyptus, poplar, and pine are simulated as individual crops in BT16. Energy market demand for energy crops is simulated starting in 2019. 2 Cellulosic biomass energy crop yields were derived from an empirical model calibrated with agricultural field trial data from across the United States. A base-case scenario assumes a 1% annual yield improvement for energy crop genotypes through the 2015–2040 simulation period; high-yield scenarios assume 2%, 3%, or 4% annual energy crop yield improvements and high-yielding corn. A $60 farmgate price offered over 25 years (offered from 2015–2040 for residues, and from 2019–2040 for energy crops) in the base-case scenario (1%) produces a potential 588 additional million tons in 2040; a 3% annual yield improvement scenario under the same farmgate price and time horizon results in a potential 936 million tons in 2040. 3 Farmgate resources potentially available at specified market prices under the base-case and high-yield scenarios, in addition to currently used agricultural resources, are described in Table 1. The spatial distribution of the 588 million tons potentially available at $60 or less in 2040 is shown in Fig. 2.
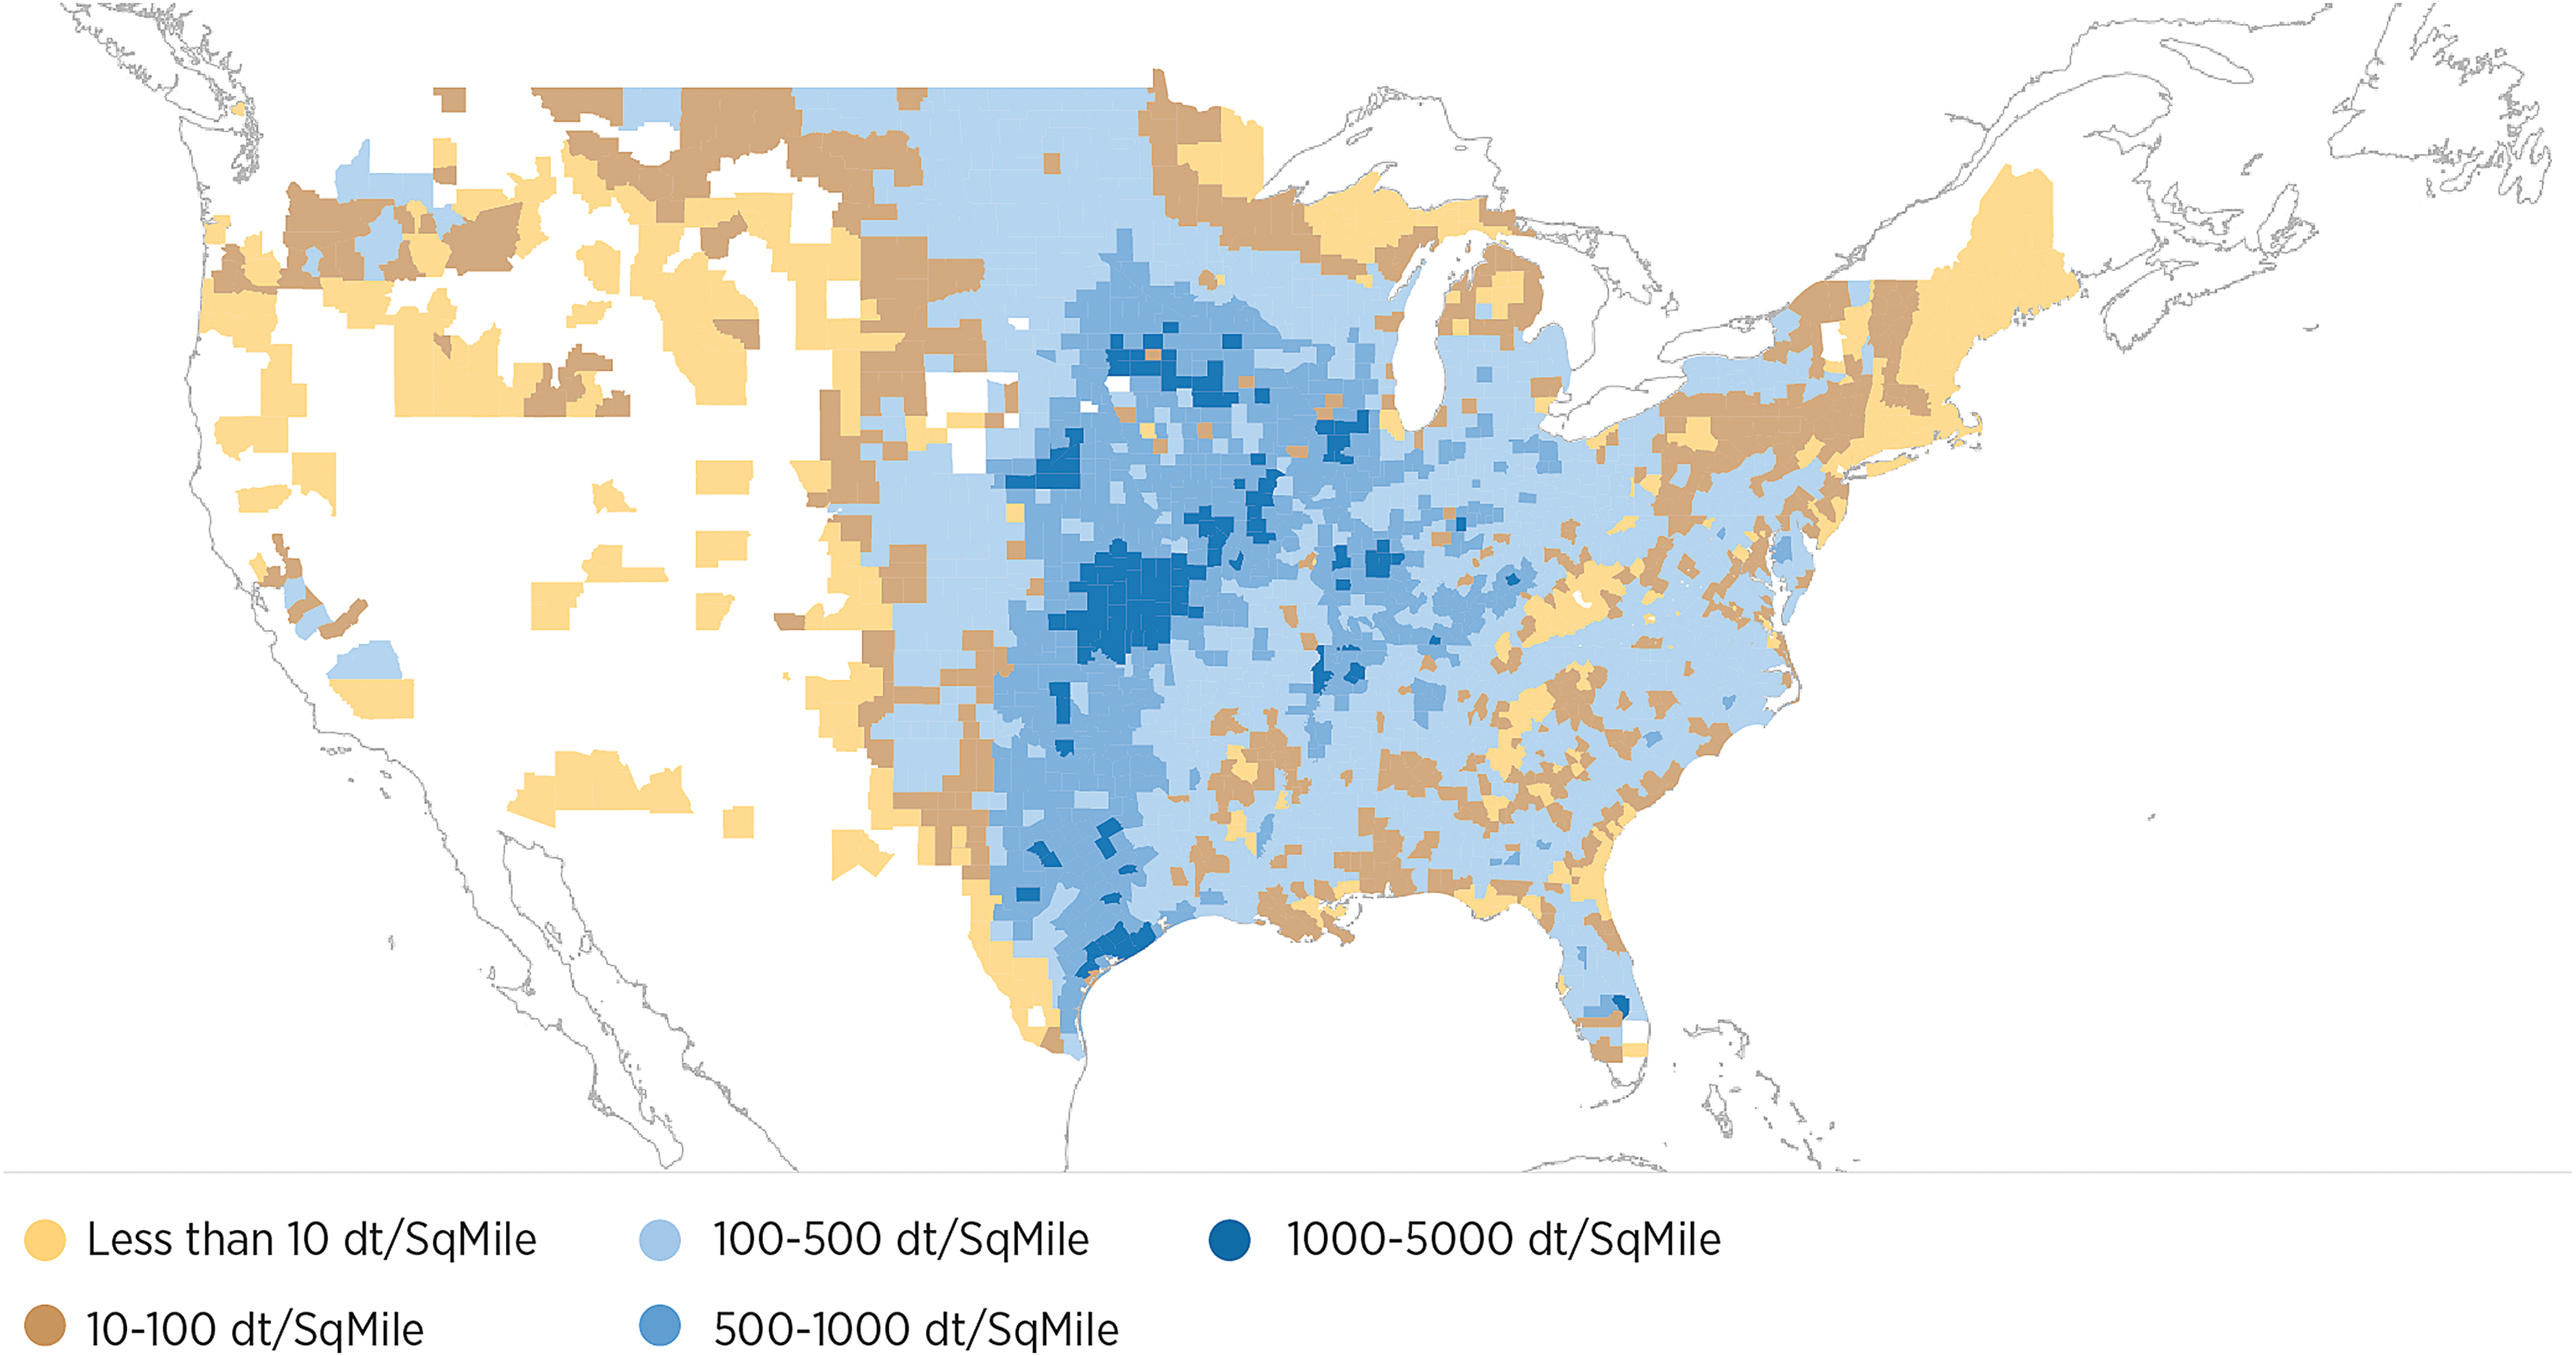
Agricultural resource totals, base case, 2040, $60 per dry ton or less, roadside. Color images available online at
Wastes
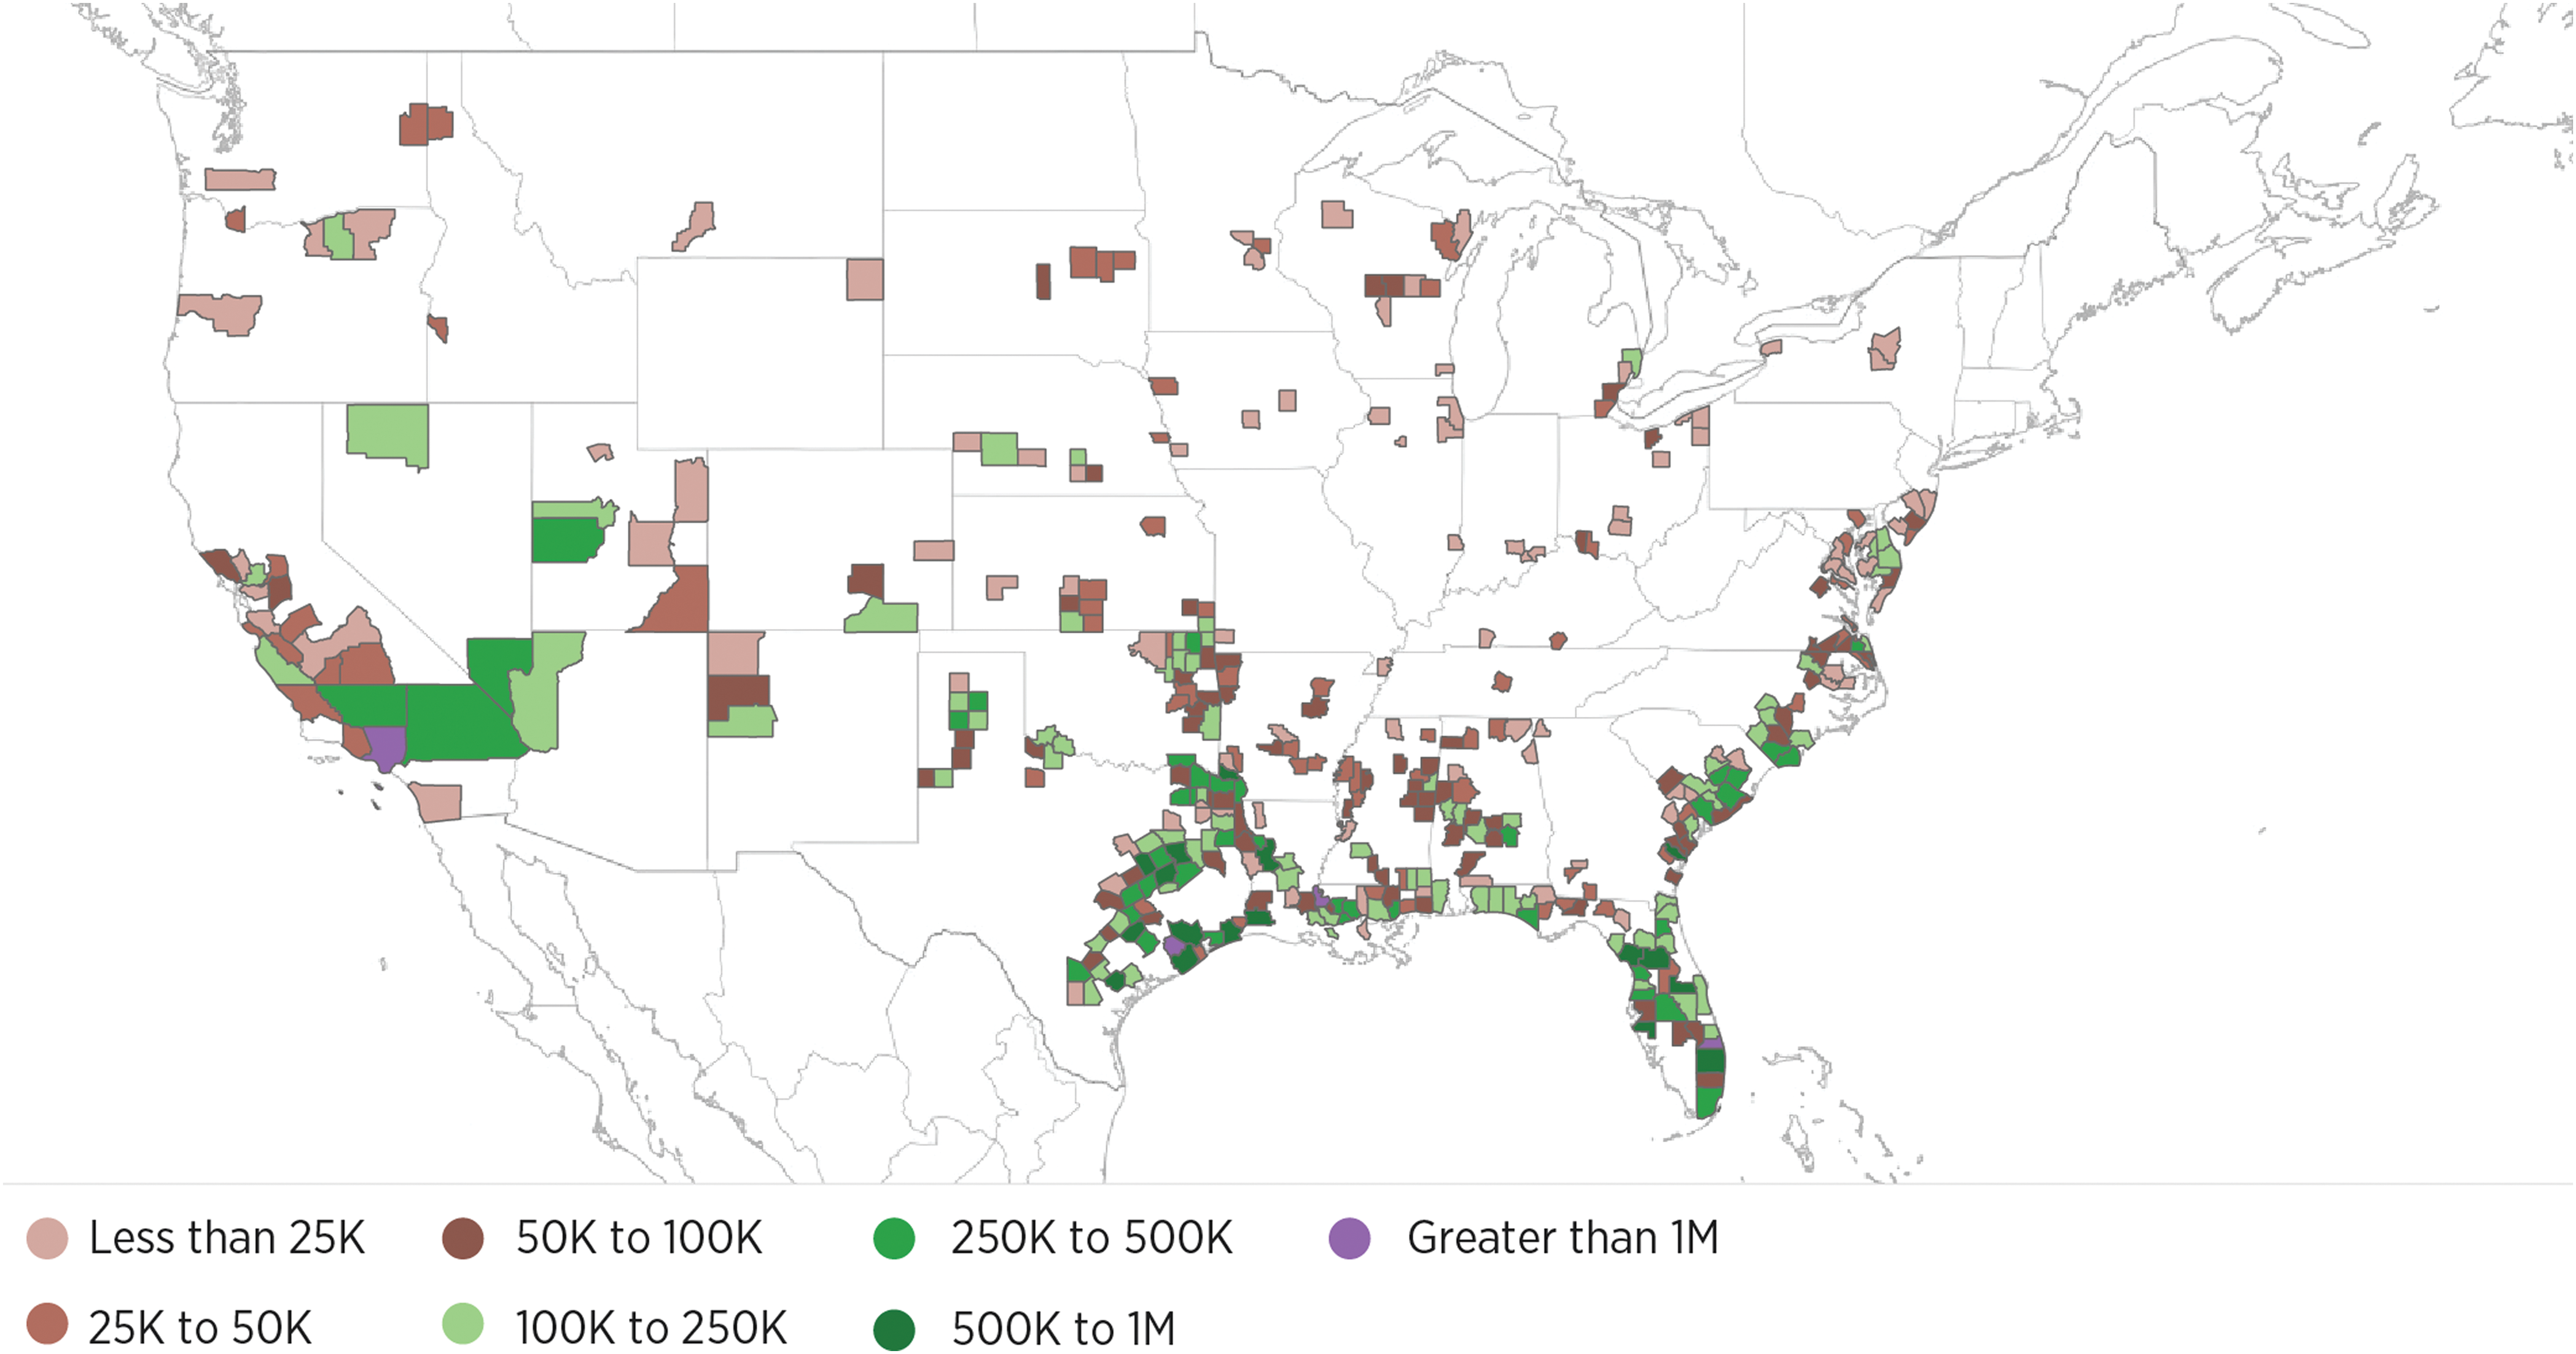
Estimates for agricultural wastes, forestry wastes, and MSW were drawn from a variety of sources, as described in chapter 5. Total supplies nationally of potential waste resource above current uses range from approximately 137 million dry tons to 142 million dry tons from 2017 to 2040 at $60 per dry ton or less. Currently used and potential additional waste resources are shown in Table 1. The spatial distribution of 132 million tons of MSW, secondary crop residues, and manure (estimated available at roadside at $60 per ton or less), is shown in Fig. 3.
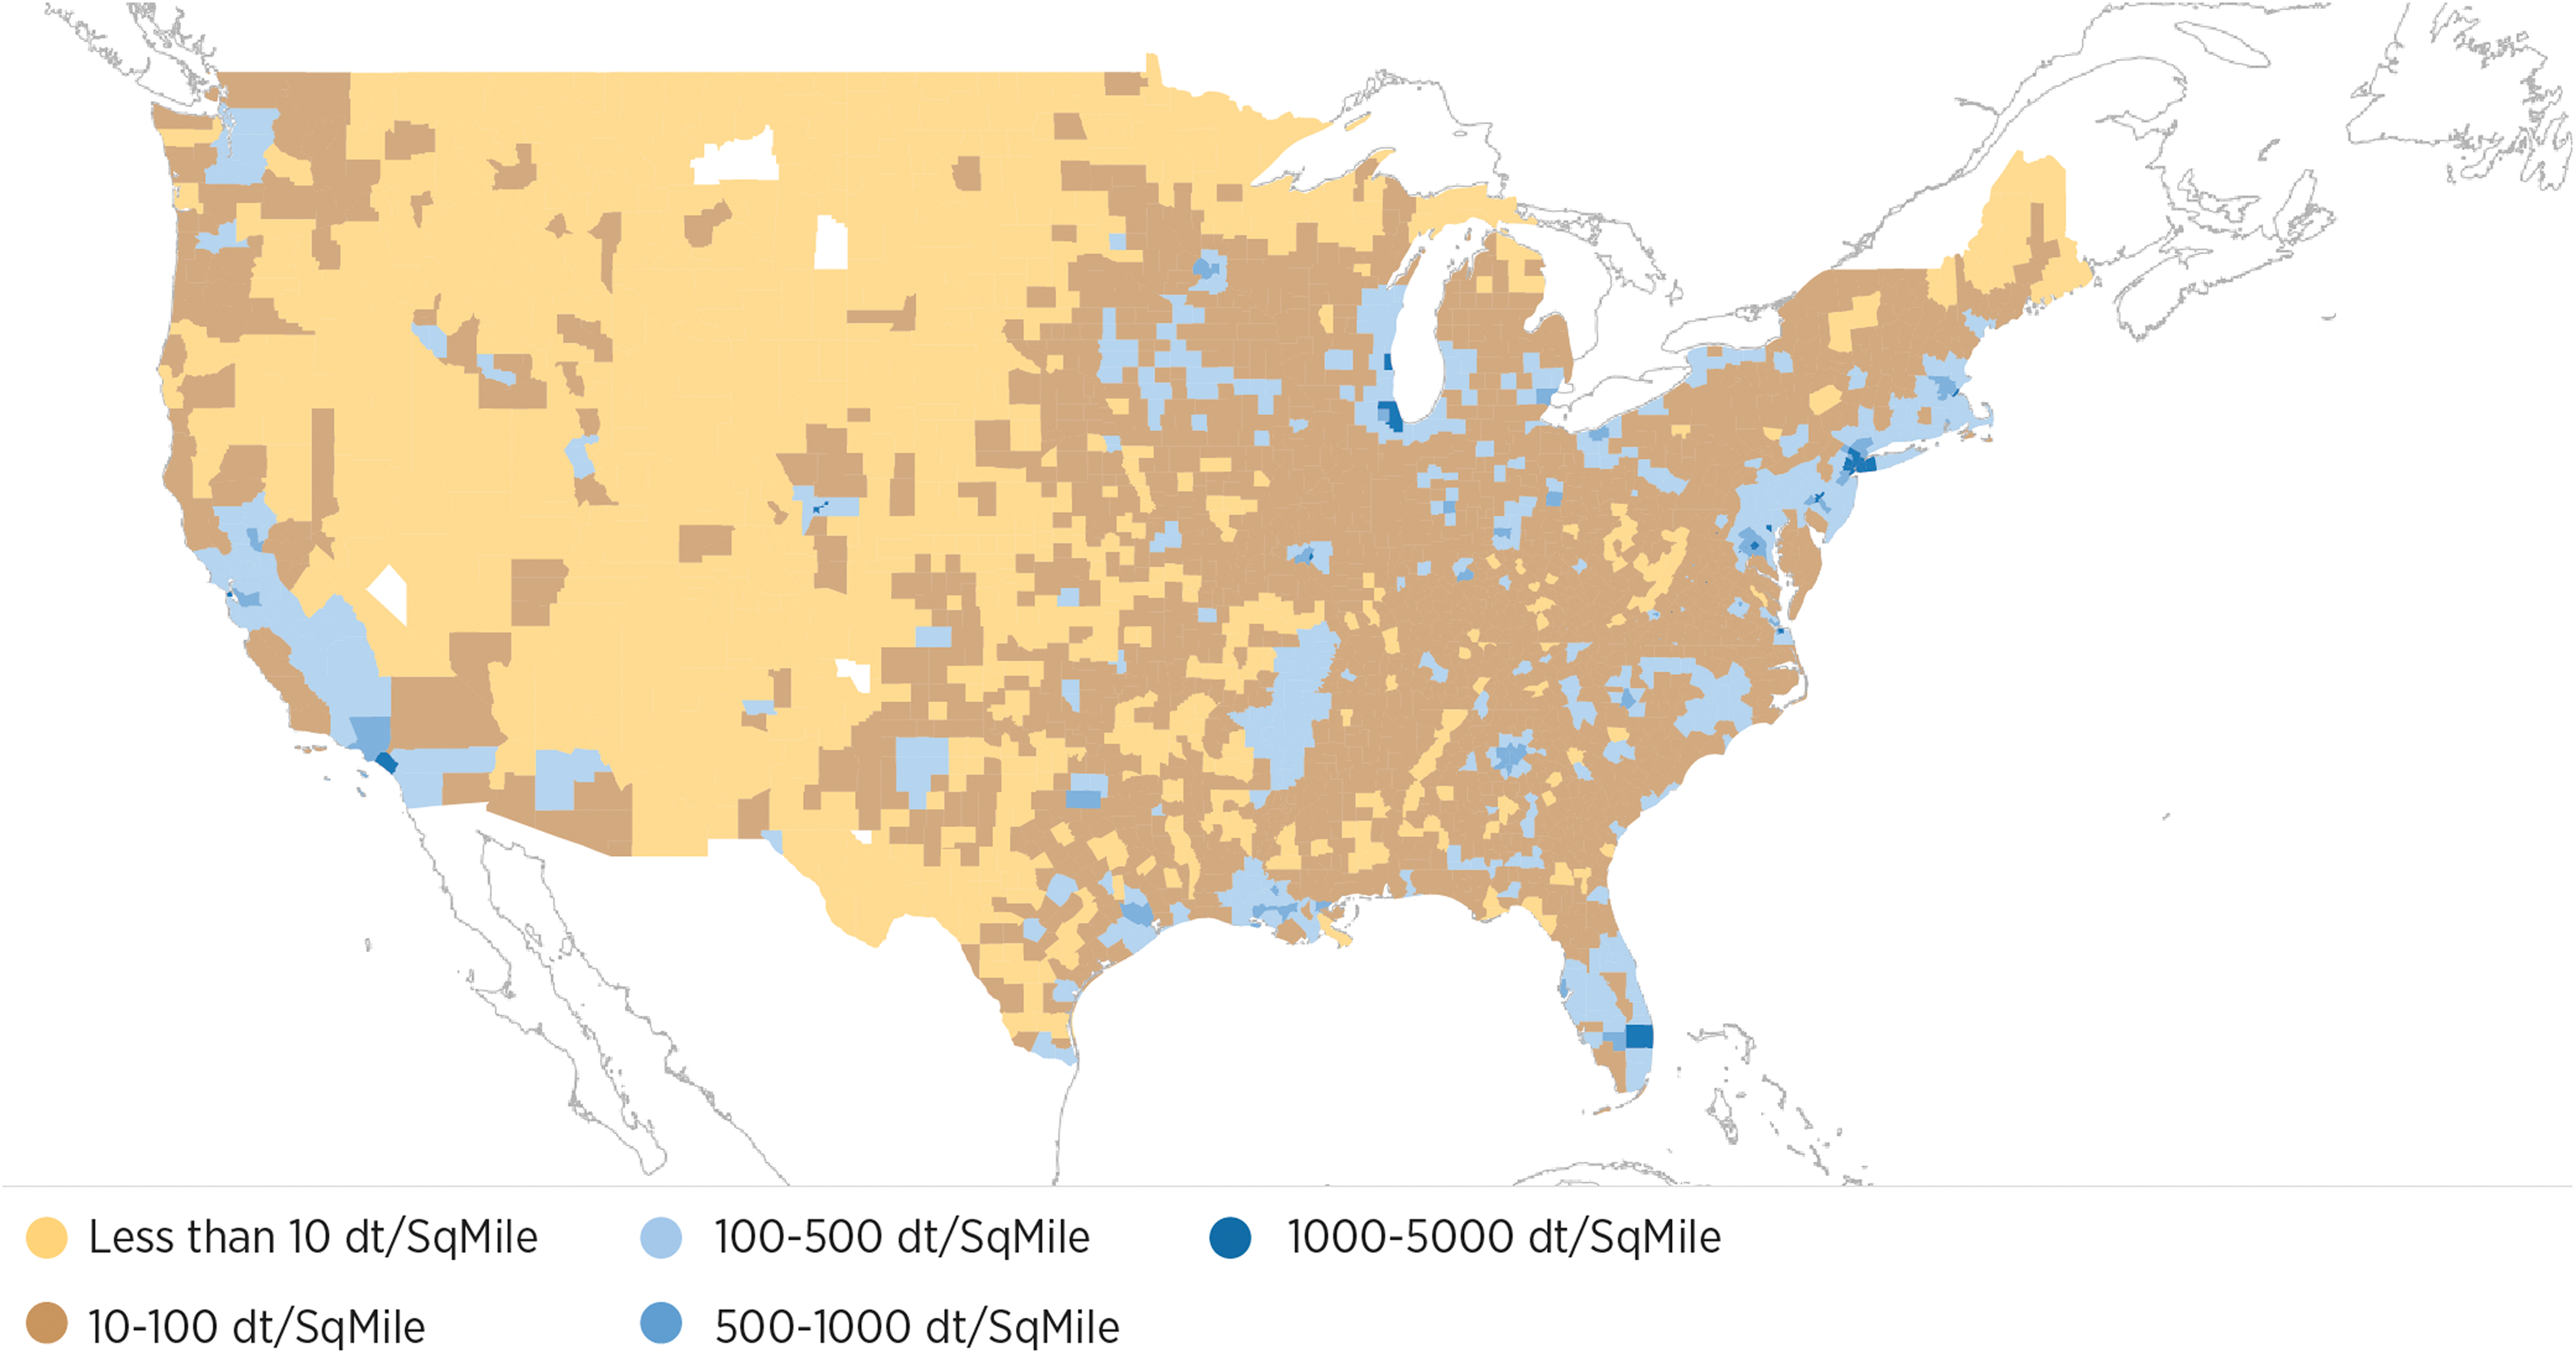
Construction and demolition waste, and municipal solid waste resources, totals to 2040 up to $60 per dry ton, roadside (excludes 10 million tons of fats and oils, data not available at the county level). Color images available online at
Combined Resources from Forestry, Agriculture, and Wastes
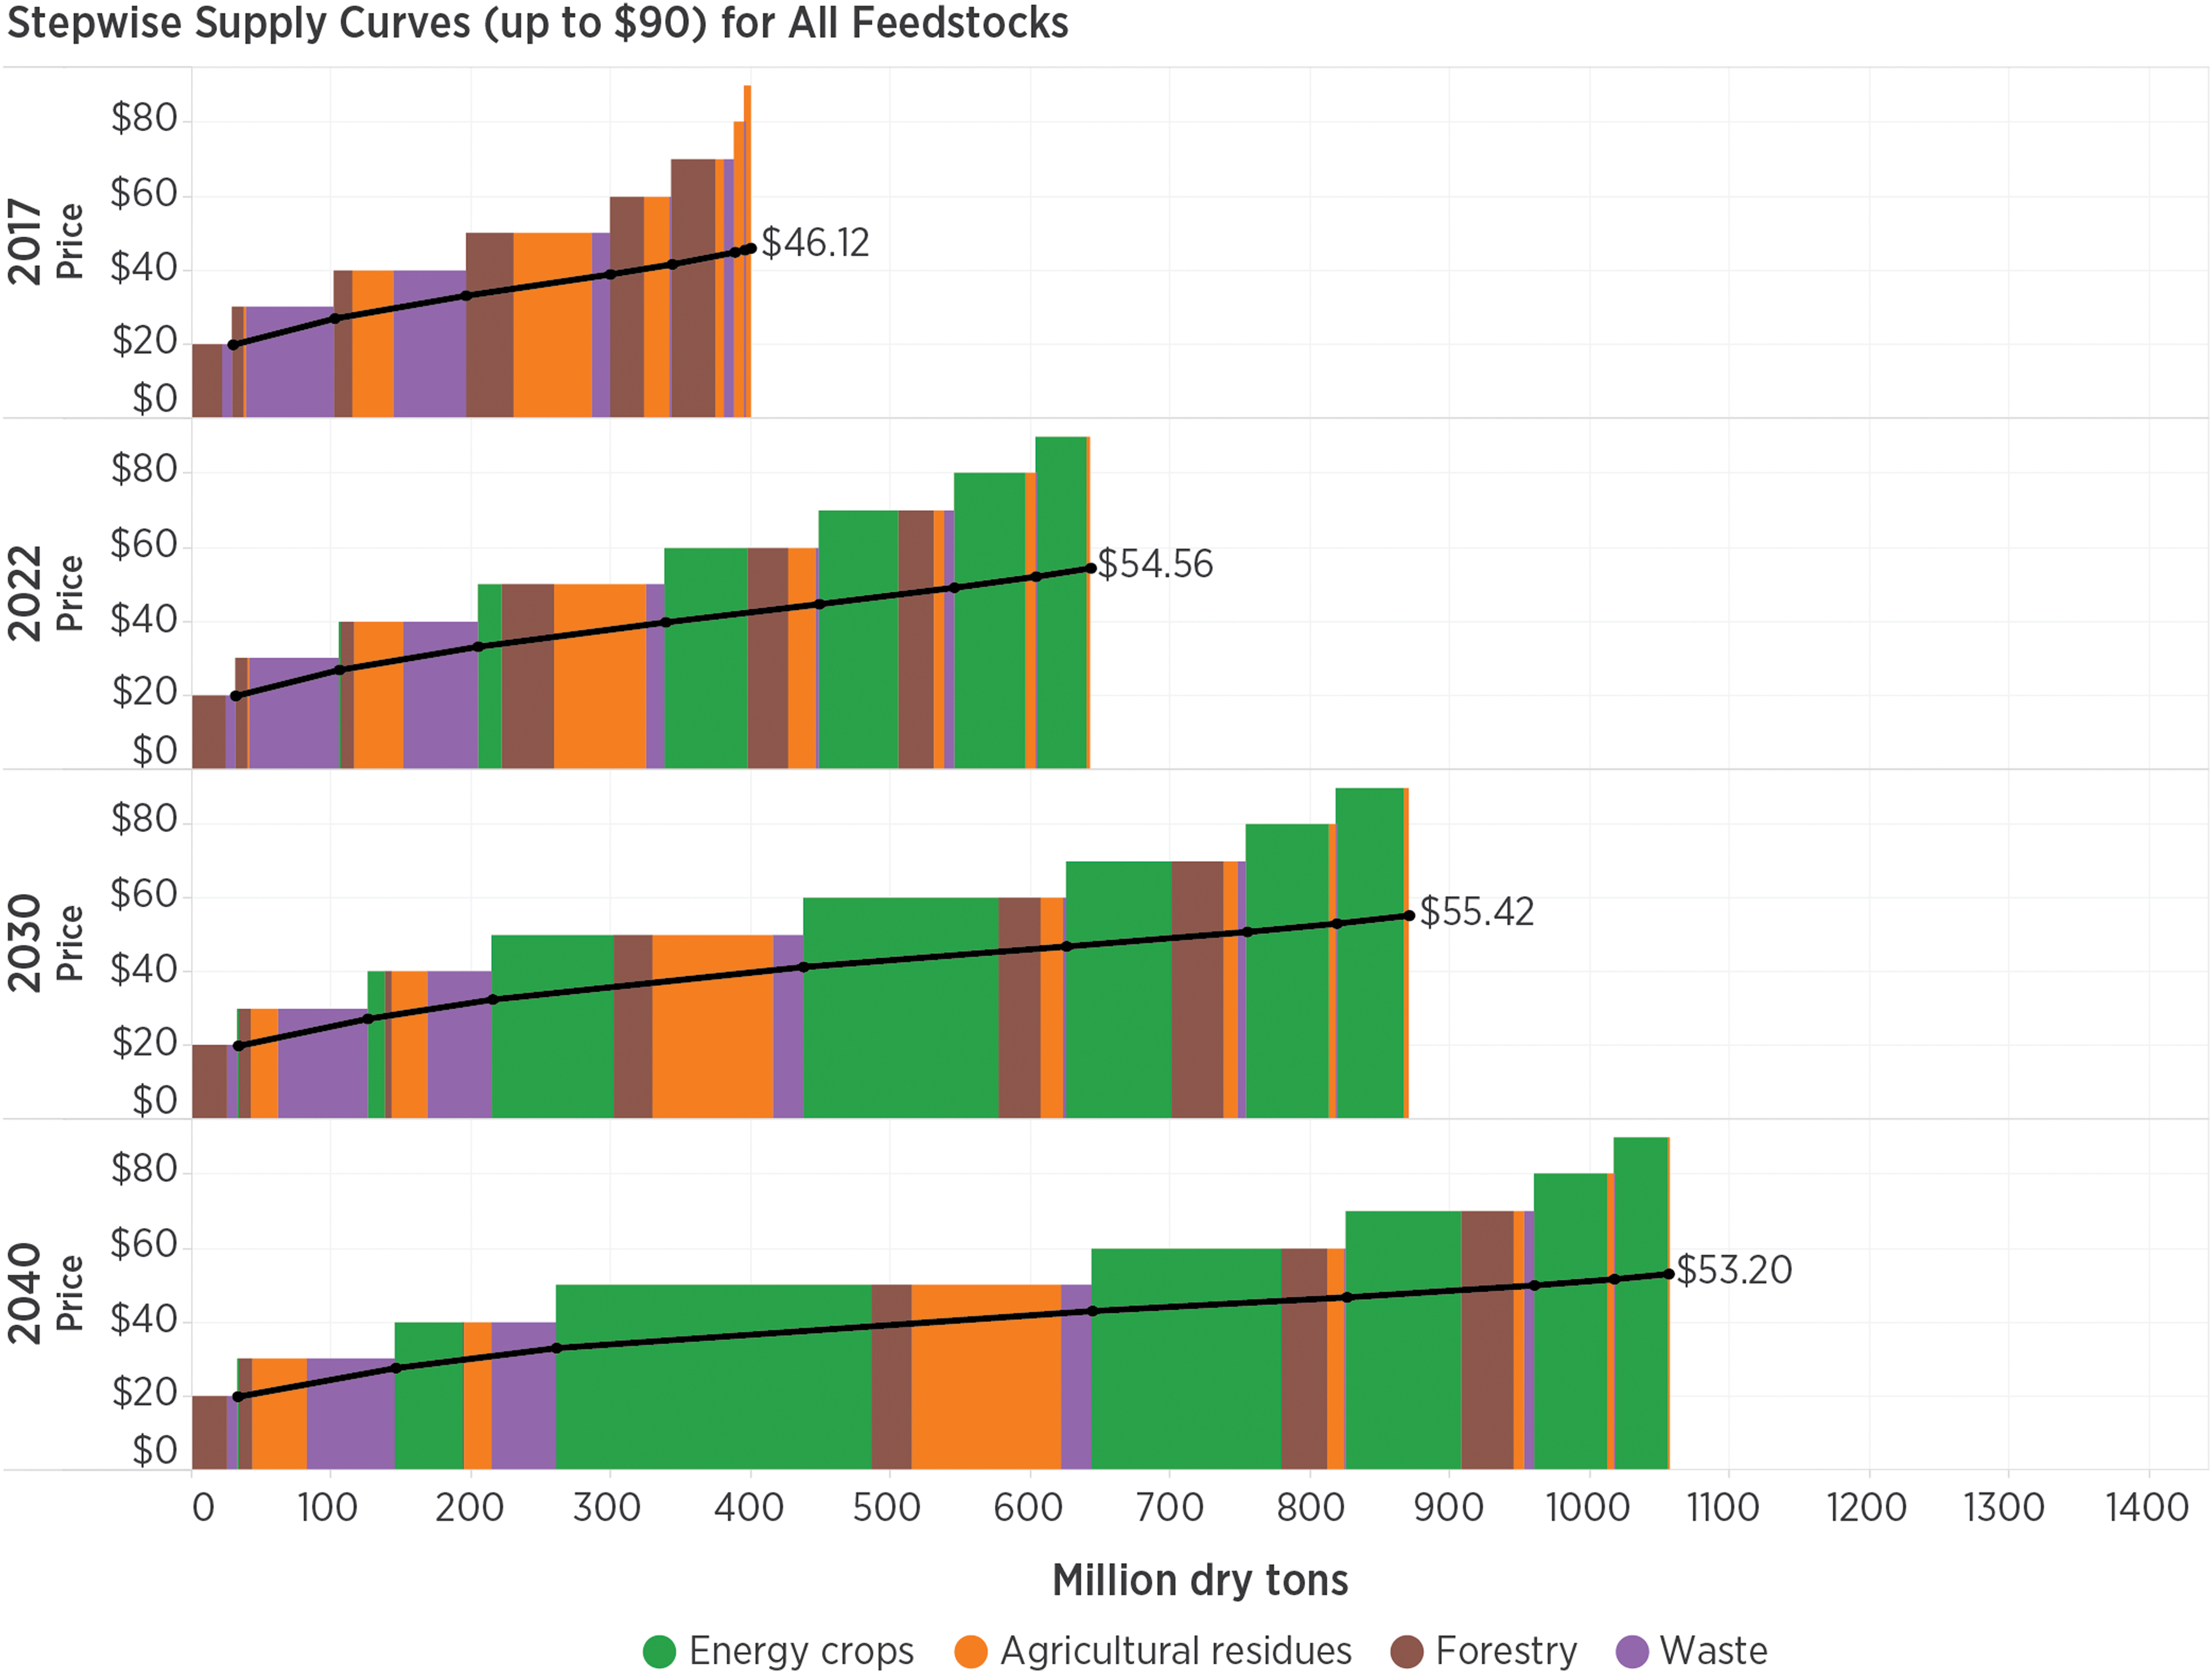
Combined forestry resources, agricultural resources, wastes, and currently used supplies potentially available at $60 or less in select years are shown in Table 1. Combined resources total 1.2 billion tons under the base-case scenario and 1.5 billion under tons a high-yield scenario by 2040. Notably, resources potentially available in the near term include agricultural residues, wastes, and forest resources, totaling 343 million tons in 2017 in the base-case scenario. Conversely, energy crops shown are scarce in the near term, but are the greatest source of potential biomass in the future, contributing 411 million tons and 736 million tons in 2040 under the base-case and high-yield scenarios, respectively. Combined potential supplies from forestry, wastes, and agricultural resources under the base case in 2040 are shown in Fig. 4. Potential forestry, agricultural, and waste biomass resources as a function of marginal and average prices at the roadside in 2040 are shown in Figs. 5 and 6.
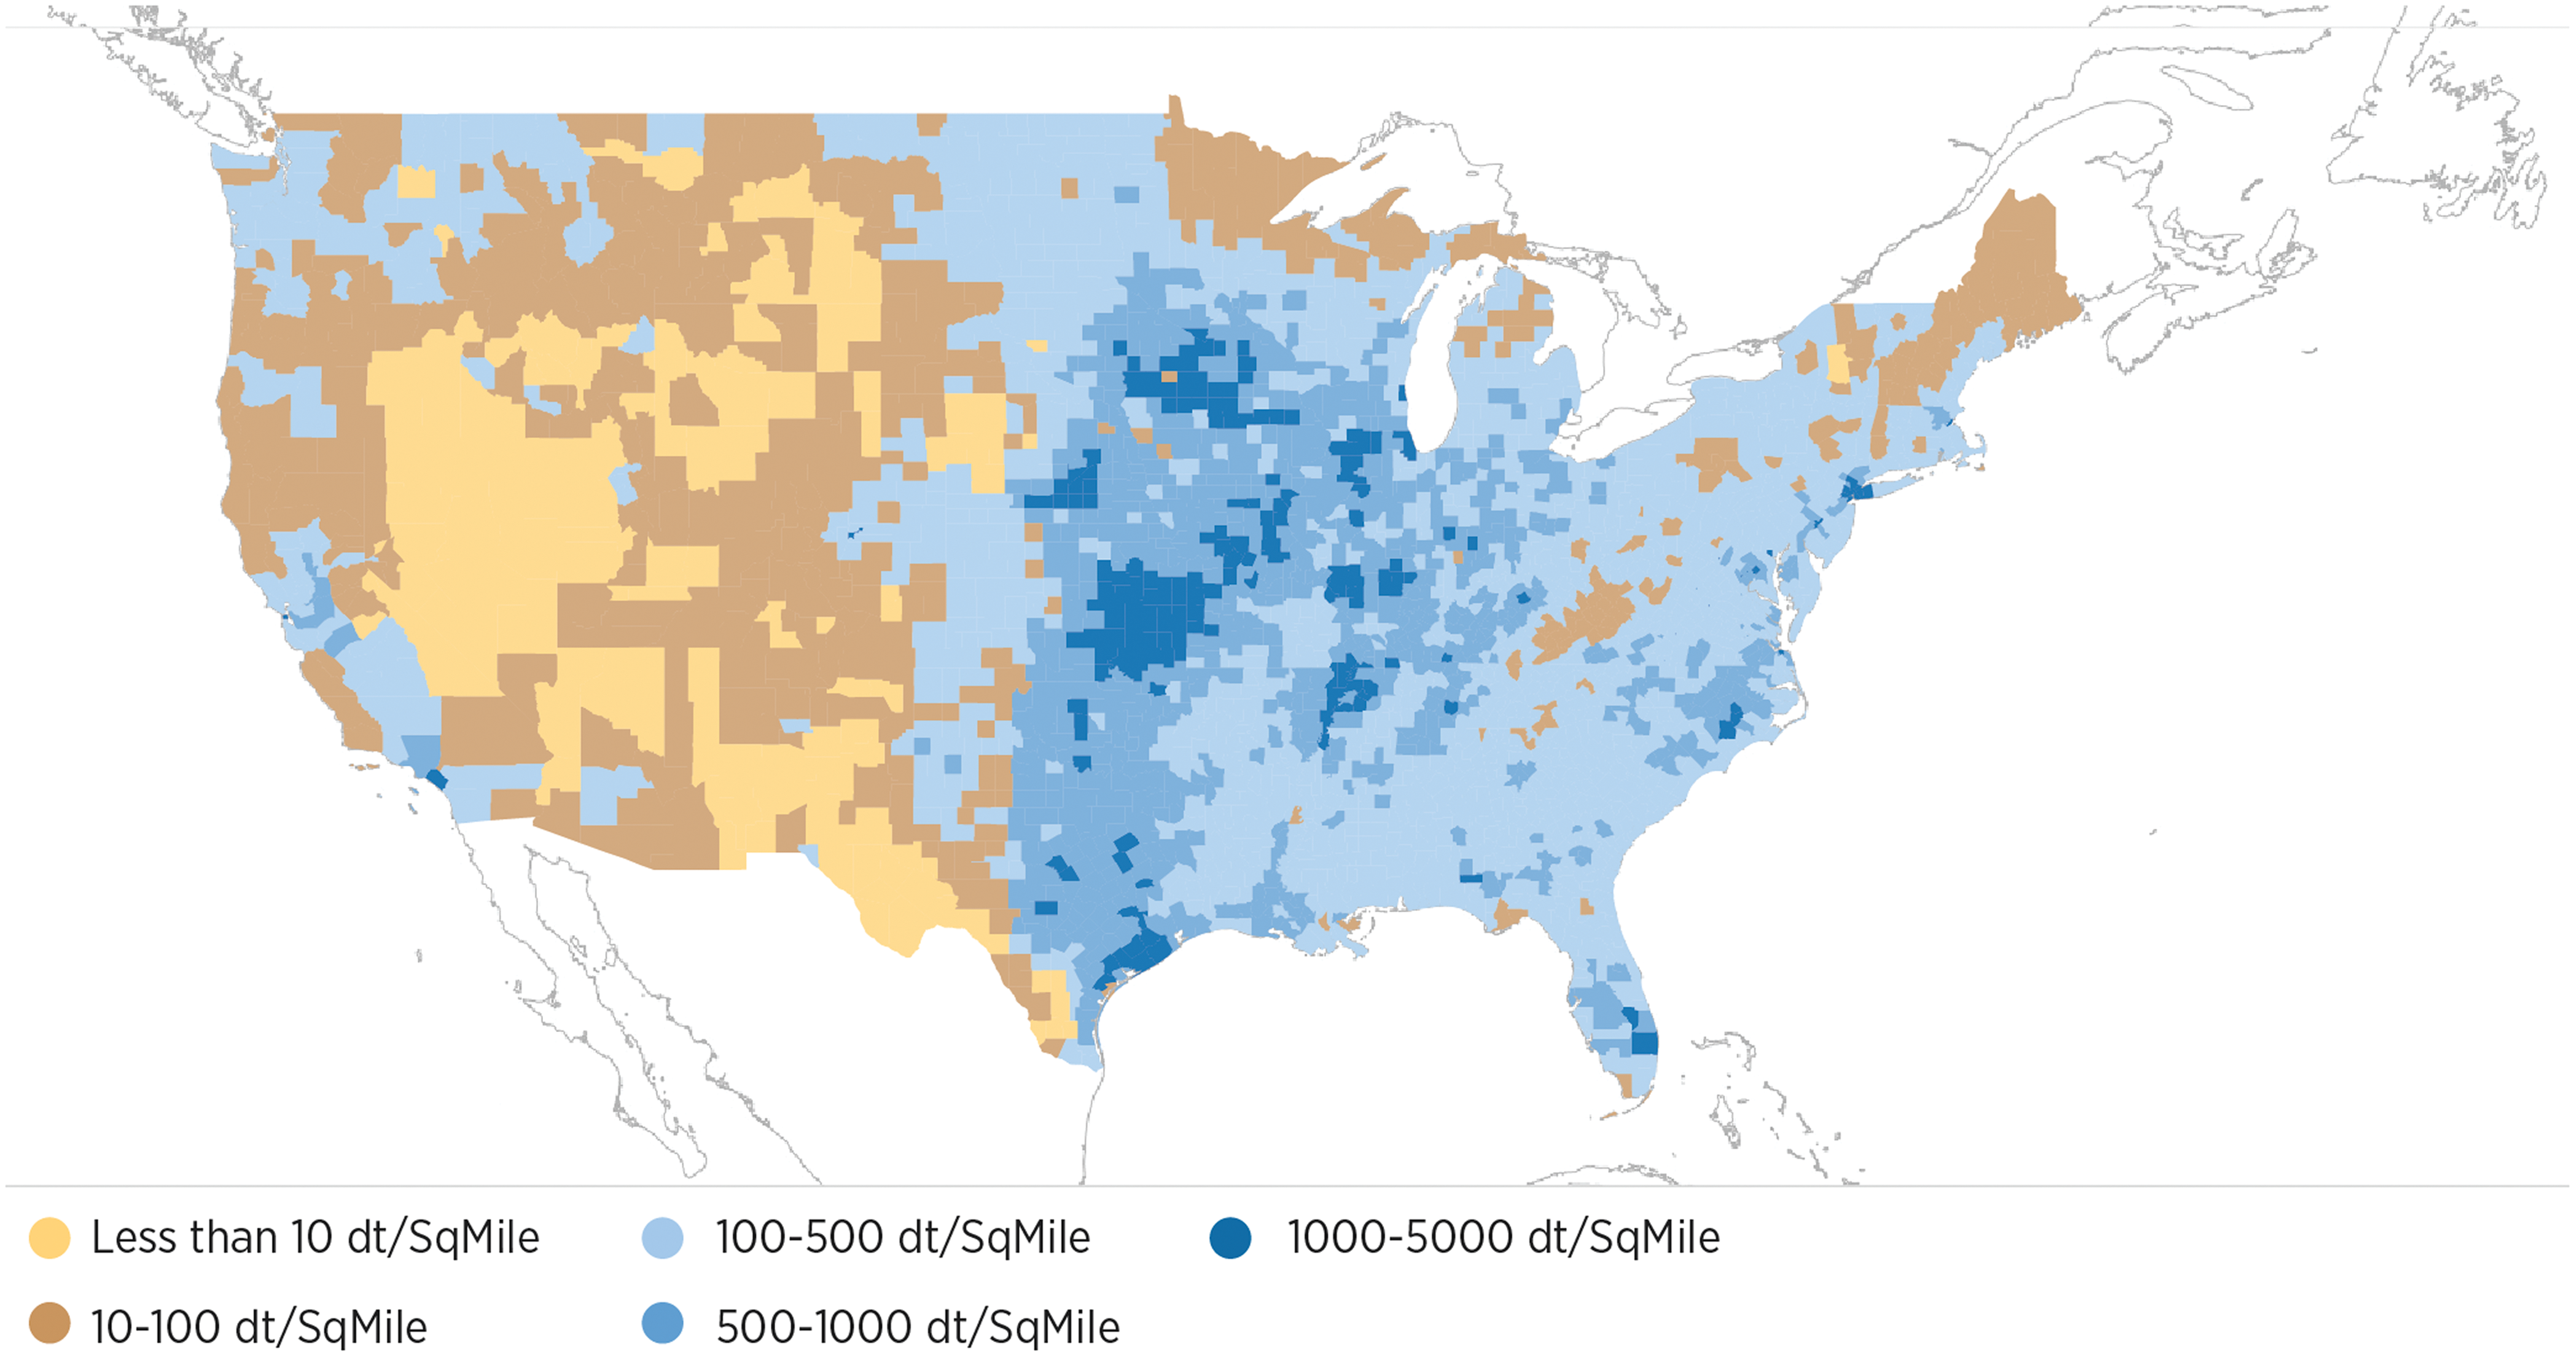
Combined potential supplies from forestry, wastes, and agricultural resources, base case, 2040. Color images available online at
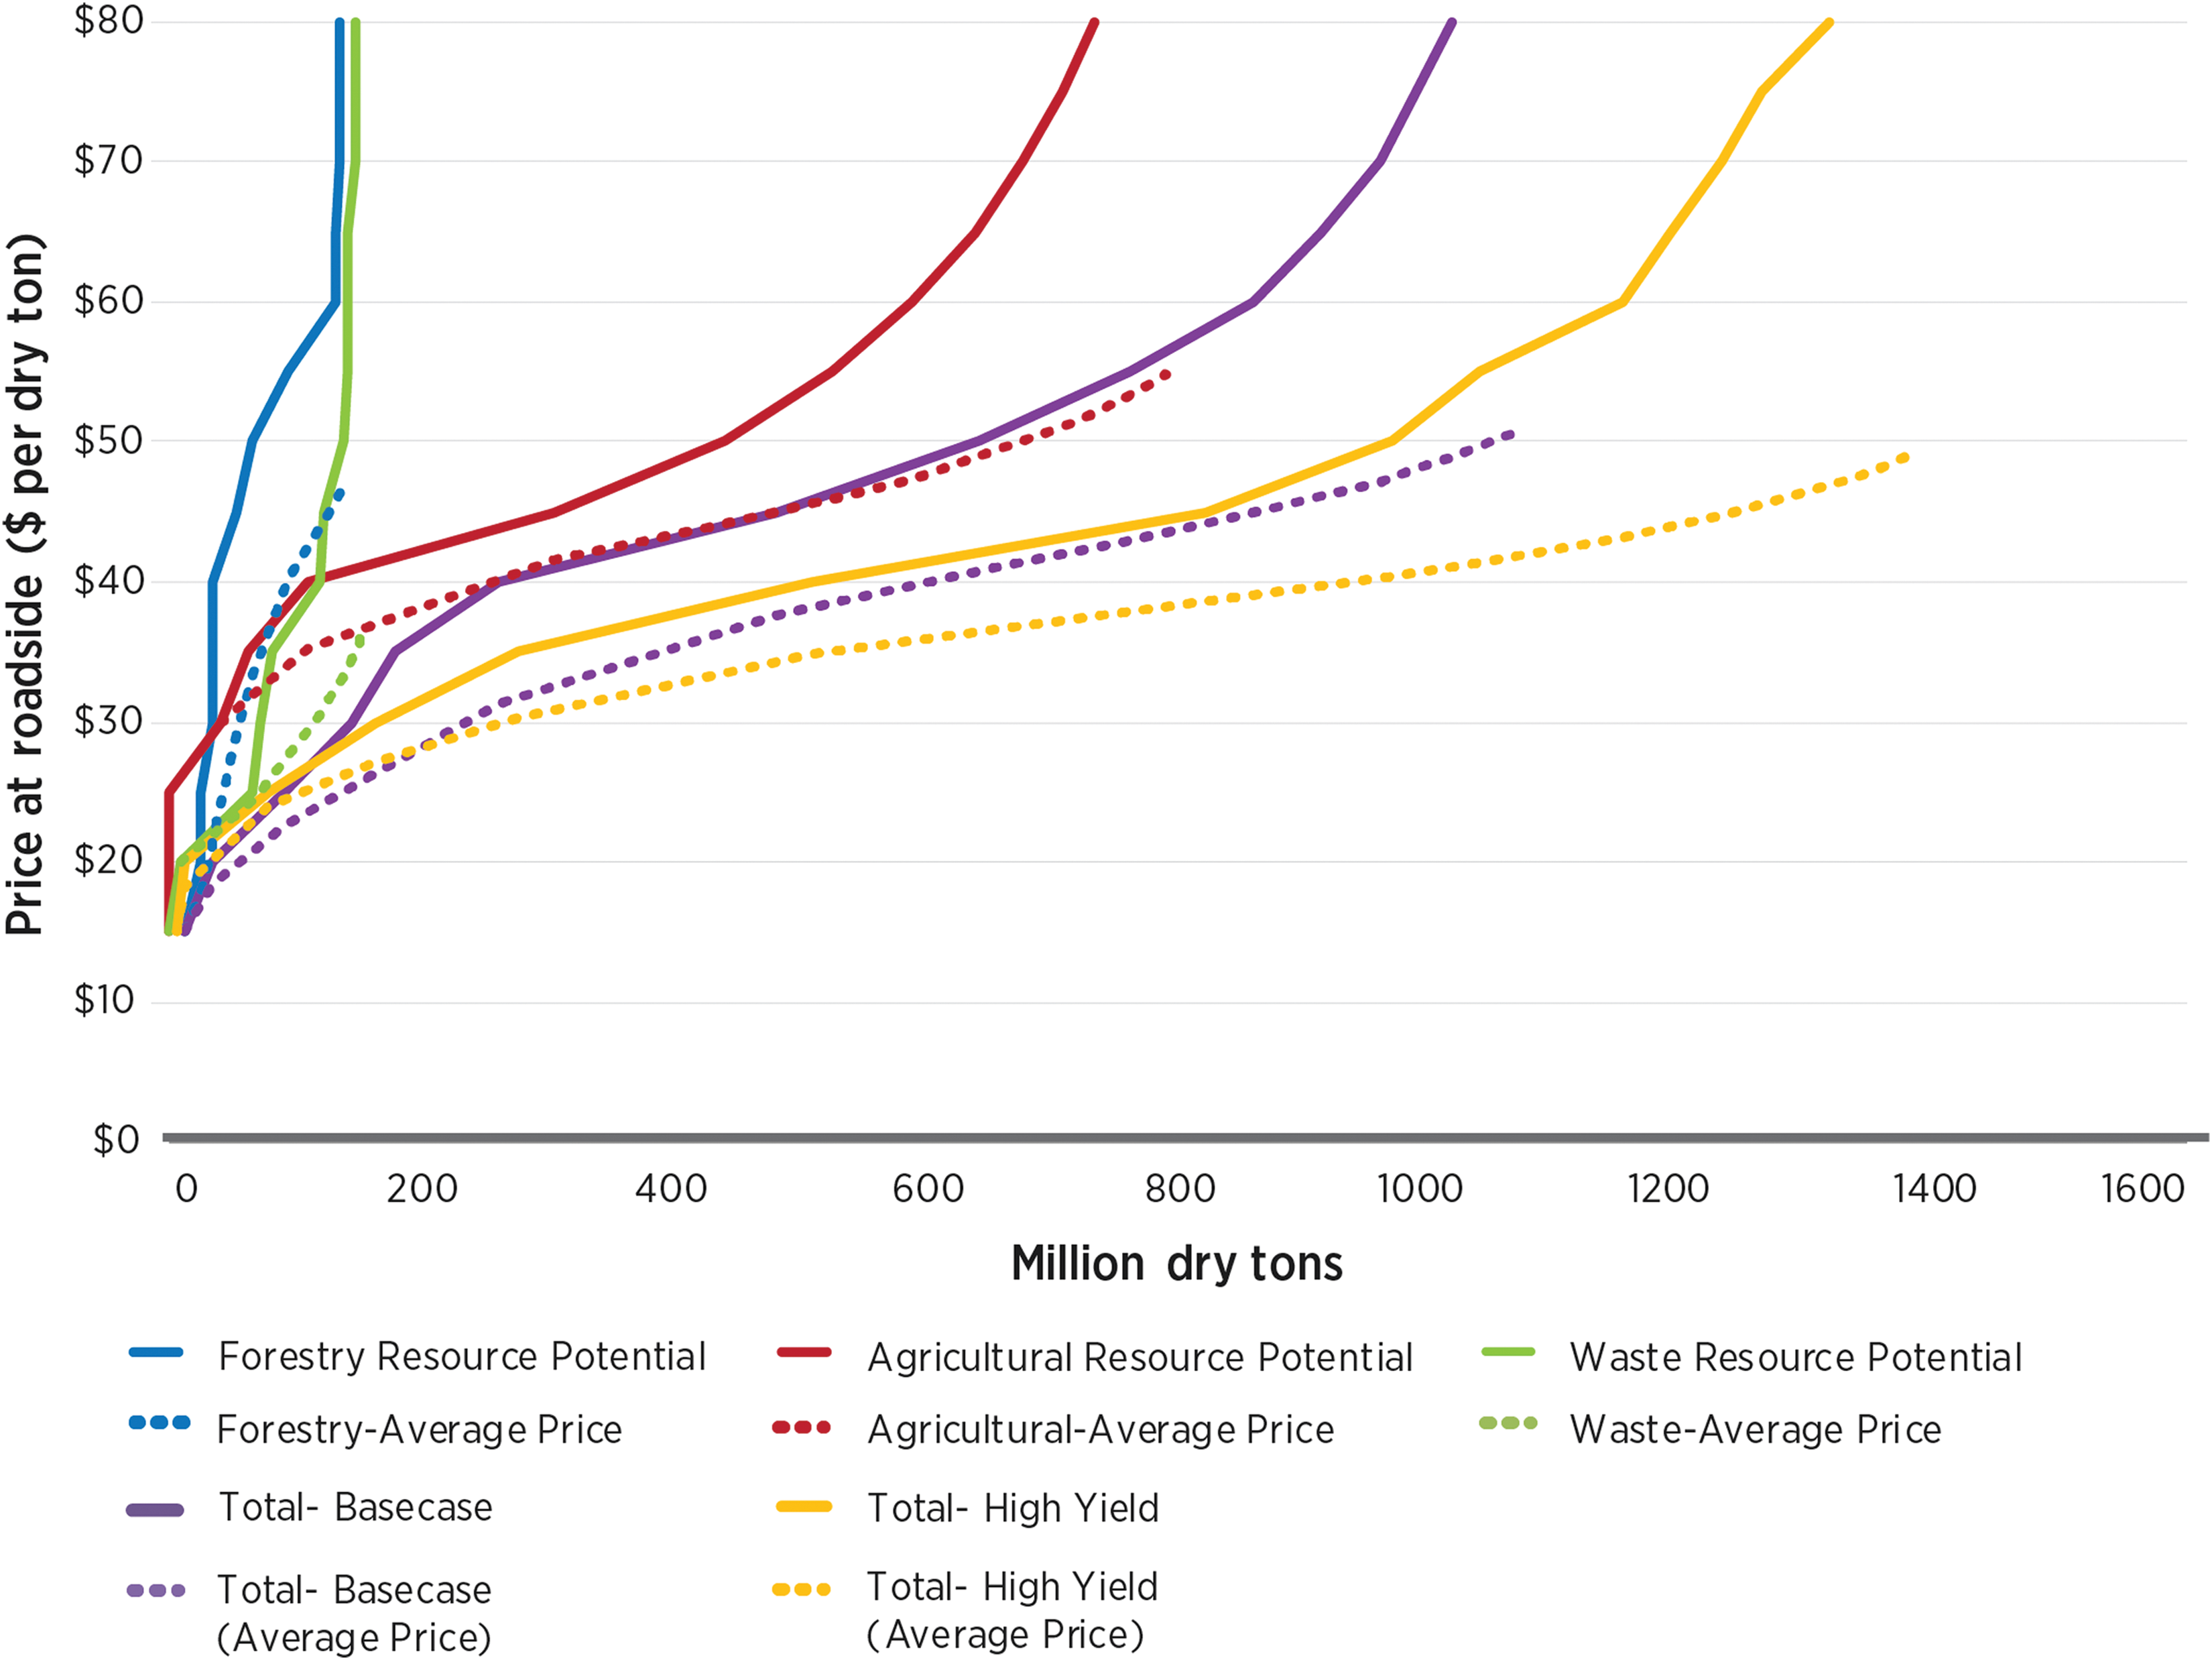
Potential forestry, agricultural, and waste biomass resources shown as a function of marginal and average prices at the roadside in 2040 (base case). Color images available online at
Combined potential forestry, agricultural, and waste biomass resources shown as a function of marginal and average prices at the roadside for select years (base case). Color images available online at
Algae
Biomass estimates for algae grown in open pond-raceway systems using freshwater or saline water sources were derived from a biophysical model calibrated with algae production data and using costs from an established techno-economic model. The national biomass potential for algae co-located with ethanol production plants, coal-fired power plants, and natural gas-fired power plants is highly dependent on the algae strain, media, local meteorology, and assumed productivities. Under current productivities and operational assumptions, biomass potential for Chlorella sorokiniana in freshwater media is estimated to be 12 million, 19 million, and 15 million dry tons for co-location scenarios with CO2 from ethanol production plants, coal-fired electric generating units (EGUs), and natural gas EGUs, respectively. Current productivities for Nannochloropsis salina in saline media are potentially higher (Table 2). Costs (equivalent to minimum prices) for algae production and dewatering to a 20% solids content are estimated to range from $490 to $2,889 per dry ton depending on production scenario (Table 2). The broad range of costs reflects regional annual productivity differences, as well as source of CO2 and distance to that source. The spatial distribution of potential co-located algae production using saline water assuming present productivities is shown in Fig. 7. A summary of the biomass available under other scenarios is shown in Table 2. Interactive visualizations are available online for both. Minimum prices are much lower when future, higher productivities are used than when current productivities are used in simulations. Minimum prices of potentially available biomass are also dependent on the extent of pond liner coverage (i.e., minimal—only covering corners prone to erosion—or full). Cost savings from co-location are clear in many regions of the country but are lower than cost savings from doubling productivity or reducing liner costs. Minimum prices per ton for algae are much higher than those for terrestrial feedstocks, but algae has potential for higher fuel yields per dry ton of biomass than terrestrial feedstocks. Reducing the cost of algae feedstock production is a research priority. However, algae has other benefits, such as flexibility in land and water requirements, use of less land for an equivalent yield, and flexibility in coproduct options.
Spatial distribution of potential co-located algae production (near-term saline scenario, prices ranging from $755 to $2,889 per dry ton). Color images available online at
Summary of Biomass Potential from Co-Location (Million Tons/Year); Chlorella sorokiniana is the Example Algae Strain Grown in Freshwater Media, and Nannochloropsis salina is the Example Algae Strain Grown in Saline Media
Totals are uncertain because analyses of different co-location sources were run independently, therefore some production facilities that are close to multiple CO2 sources may be double-counted; bFor Nannochloropsis salina, the range of minimum prices includes both minimally lined ponds and lined ponds. For Chlorella sorokiniana, the range of minimum prices includes only minimally lined ponds. Interactive visualization available at
Delivered Resources
Major categories of forest, agricultural, and waste resources available at $60 per ton or less at the roadside are included in the scenario analysis of resources delivered to the throat of the biorefinery. This subset of the total potential supply includes 310, 679, and 985 million dry tons in the near-term, long-term base-case, and long-term high-yield scenarios, respectively. Results indicate that 45%, 37%, and 54% of the supplies for the near-term, long-term base-case, and long-term high-yield scenarios, respectively, can be delivered at prices of $84 per dry ton (including production, harvest, transportation, and grinding) or less. When calculated as weighted average prices, 70%, 69%, and 84% of the near-term, long-term base-case, and long-term high-yield scenarios, respectively, can be delivered at prices up to $84 per ton. Near-term and long-term base-case results are shown in Fig. 8. BT16 results are generally consistent with BT2 and BTS in terms of total potential supply. All three reports show a potential supply in approximately 20 years of more than 1 billion tons of biomass annually. It should be noted that prices for energy crops in this report are simulated to begin in 2019, five years later than simulated in BT2. Thus, the expansion of energy crops is delayed 5 years from that of BT2. Energy crops comprise approximately 400 to 700 million tons of the total potential supply depending on the scenario assumed. As with the BTS and the BT2, realization of the potential described on this report is contingent upon research, development, commercialization, and markets.
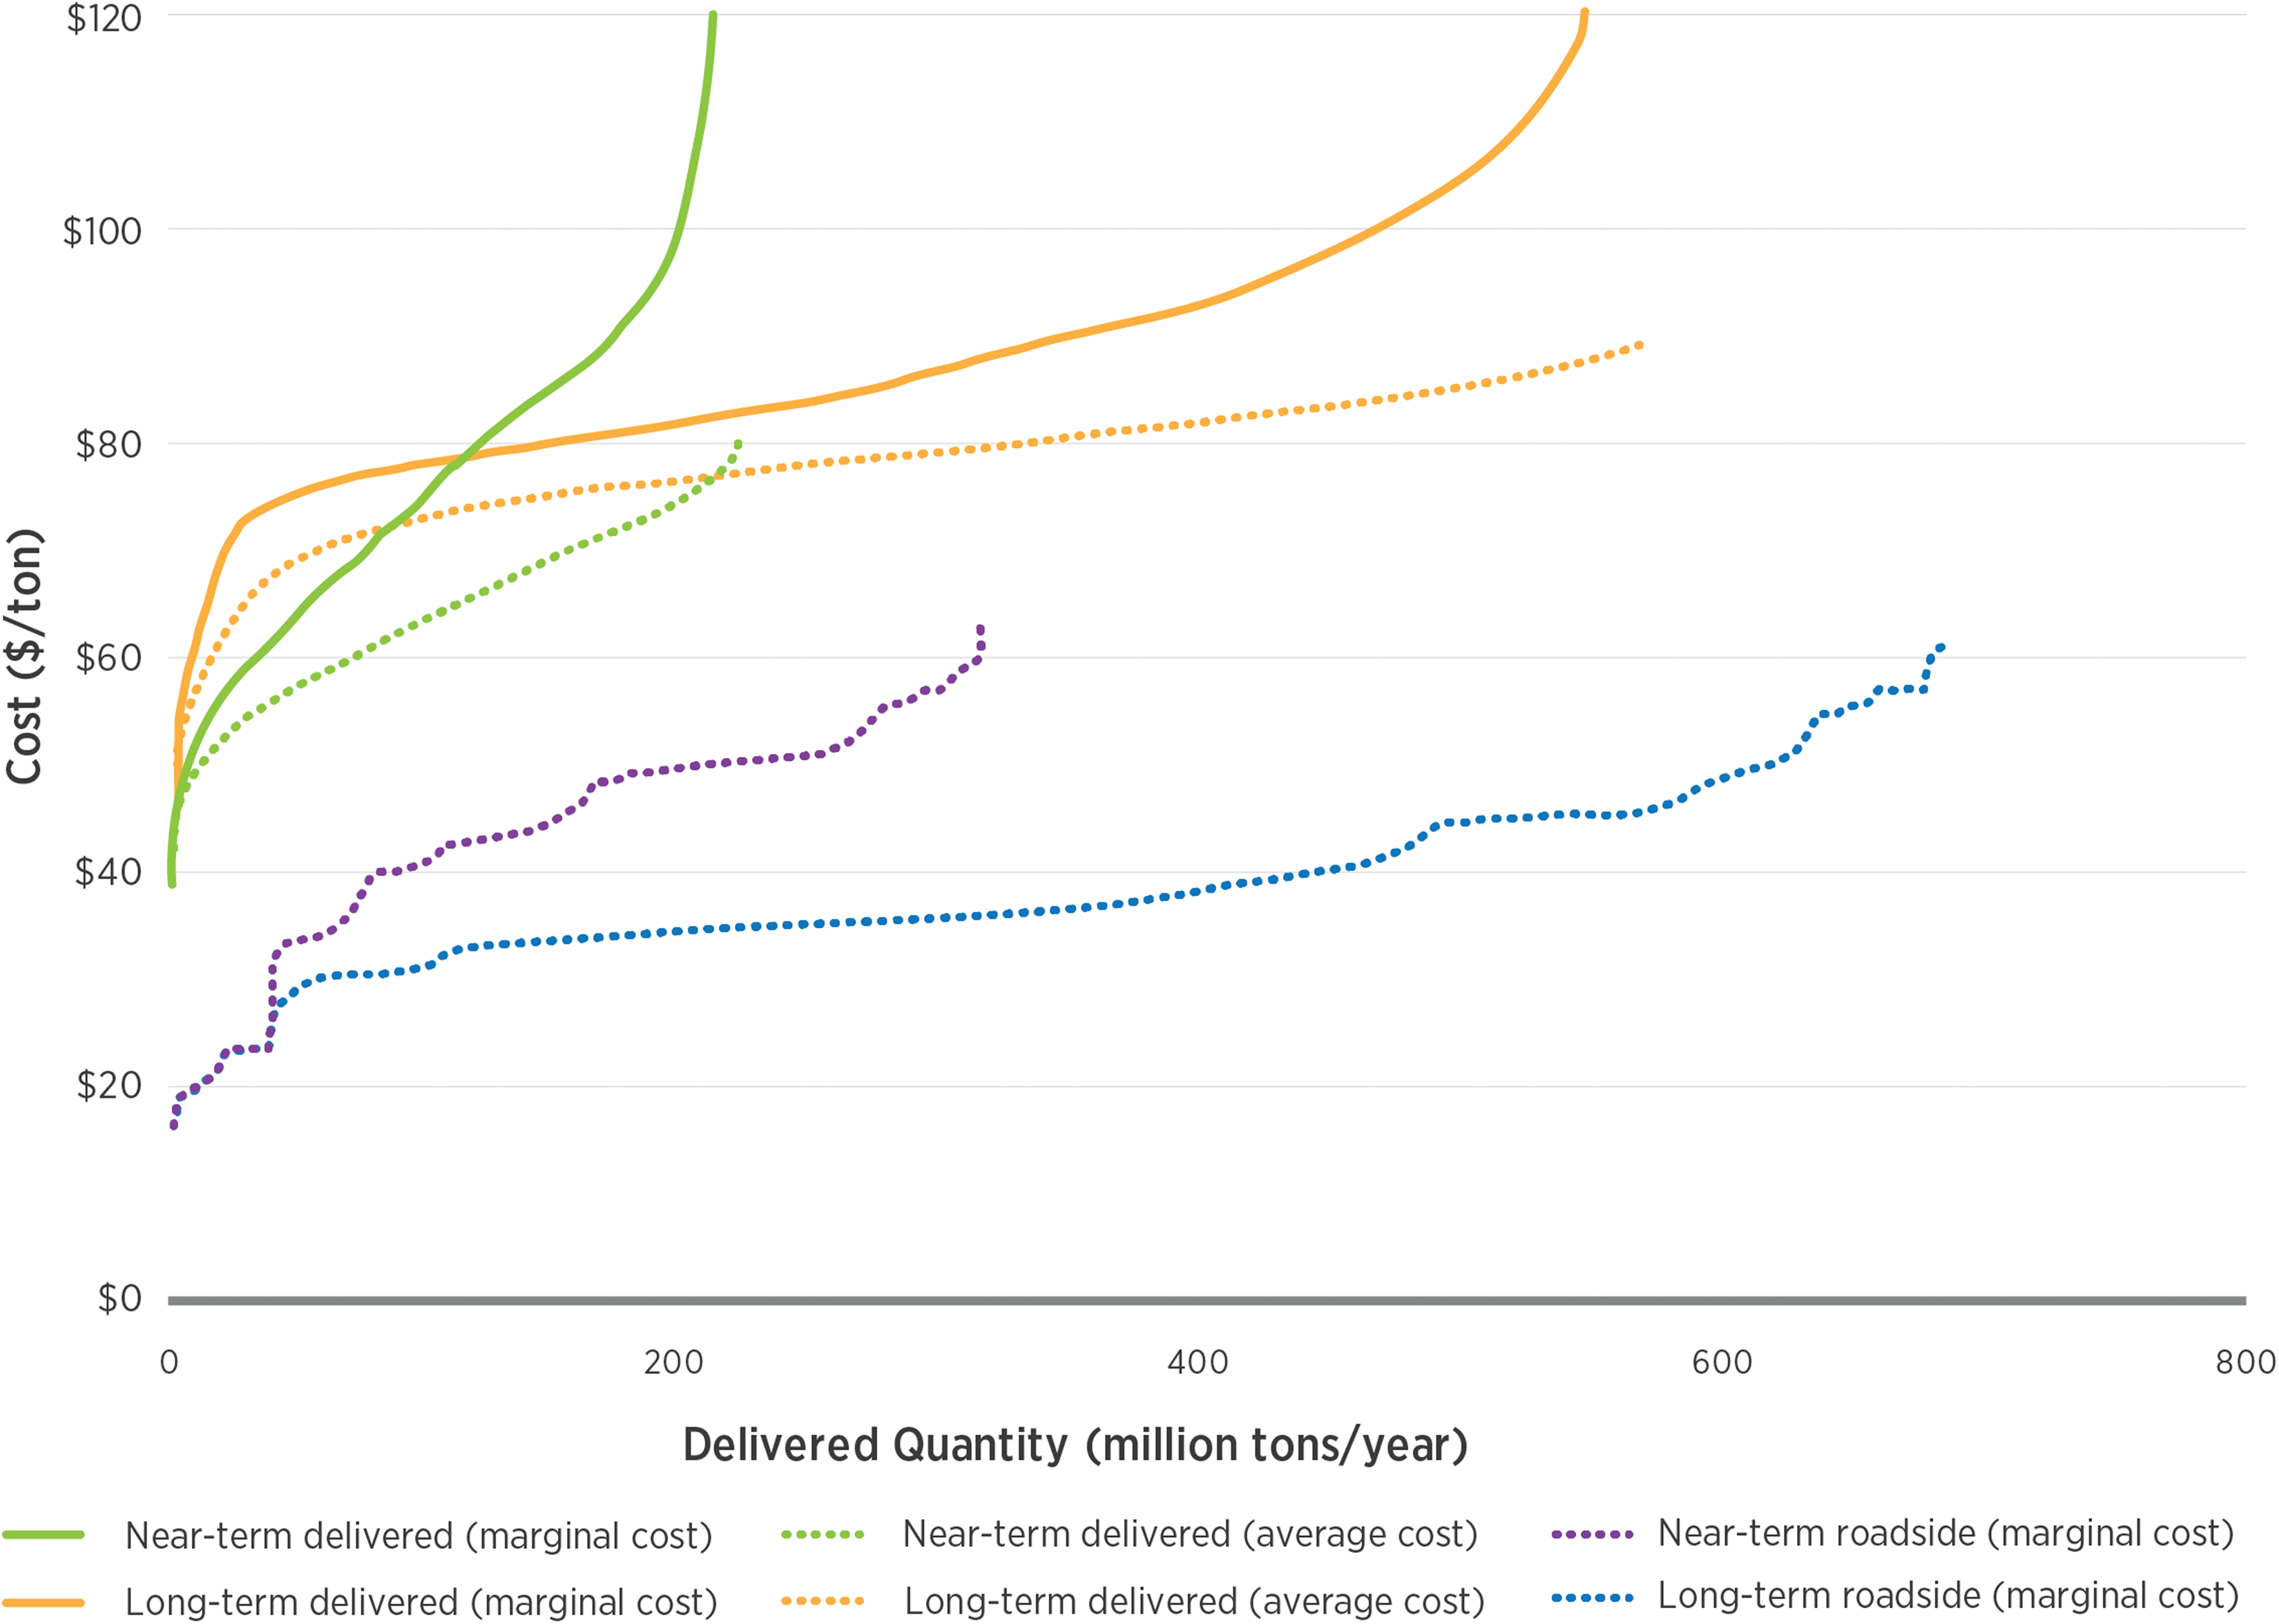
Marginal and weighted average costs ($/dry ton) of select herbaceous and woody feedstocks at the roadside and delivered to the reactor throat (base case). Color images available online at