
Abstract
Abstract
Background:
A new in vitro test method for dry powder inhalers (DPIs) was recently found to be predictive of the published in vivo results for Budelin Novolizer. The present study was intended to assess the method's robustness by evaluating correlations between average drug deposition in vitro and in vivo from five different DPIs.
Methods:
In vitro drug deposition from five marketed DPIs was assessed in a realistic physical airway model of a “medium” sized adult in an experimental setup that allowed deposition to be characterized regionally for carefully selected simulated air flow rate versus time profiles. The DPIs studied were Spiriva® HandiHaler®, Relenza® Diskhaler®, Salbutamol Easyhaler®, Pulmicort® Turbuhaler®, and Foradil® Aerolizer®. In vitro regional deposition results were compared with those reported in the literature in order to create in vitro–in vivo correlations (IVIVCs) for each inhaler.
Results:
Mean percent total lung deposition (TLD±SD) in vitro for Spiriva HandiHaler, Relenza Diskhaler, Salbutamol Easyhaler, Pulmicort Turbuhaler, and Foradil Aerolizer were 17.3±1.2, 22.6±1.1, 29.0±1.1, 28.0±3.0, and 21.7±1.2, respectively. These results showed excellent agreement with reported in vivo values, with absolute prediction errors in TLD of ≤2% for all DPIs except Relenza Diskhaler. Similarly, in vitro mouth–throat and device deposition results were stoichiometrically comparable to those reported in vivo for all DPIs except Relenza Diskhaler and Turbuhaler. Inspection of the scintigraphy studies for Relenza Diskhaler and Turbohaler revealed possible problems with powder labeling and result interpretation in their in vivo clinical assessments.
Conclusions:
A characteristic physical airway model representing a medium-sized adult, when coupled to carefully chosen characteristic inhalation maneuvers used in the clinic, produced results that correlated with regional drug deposition estimates from scintigraphy across a group of different DPIs.
Introduction
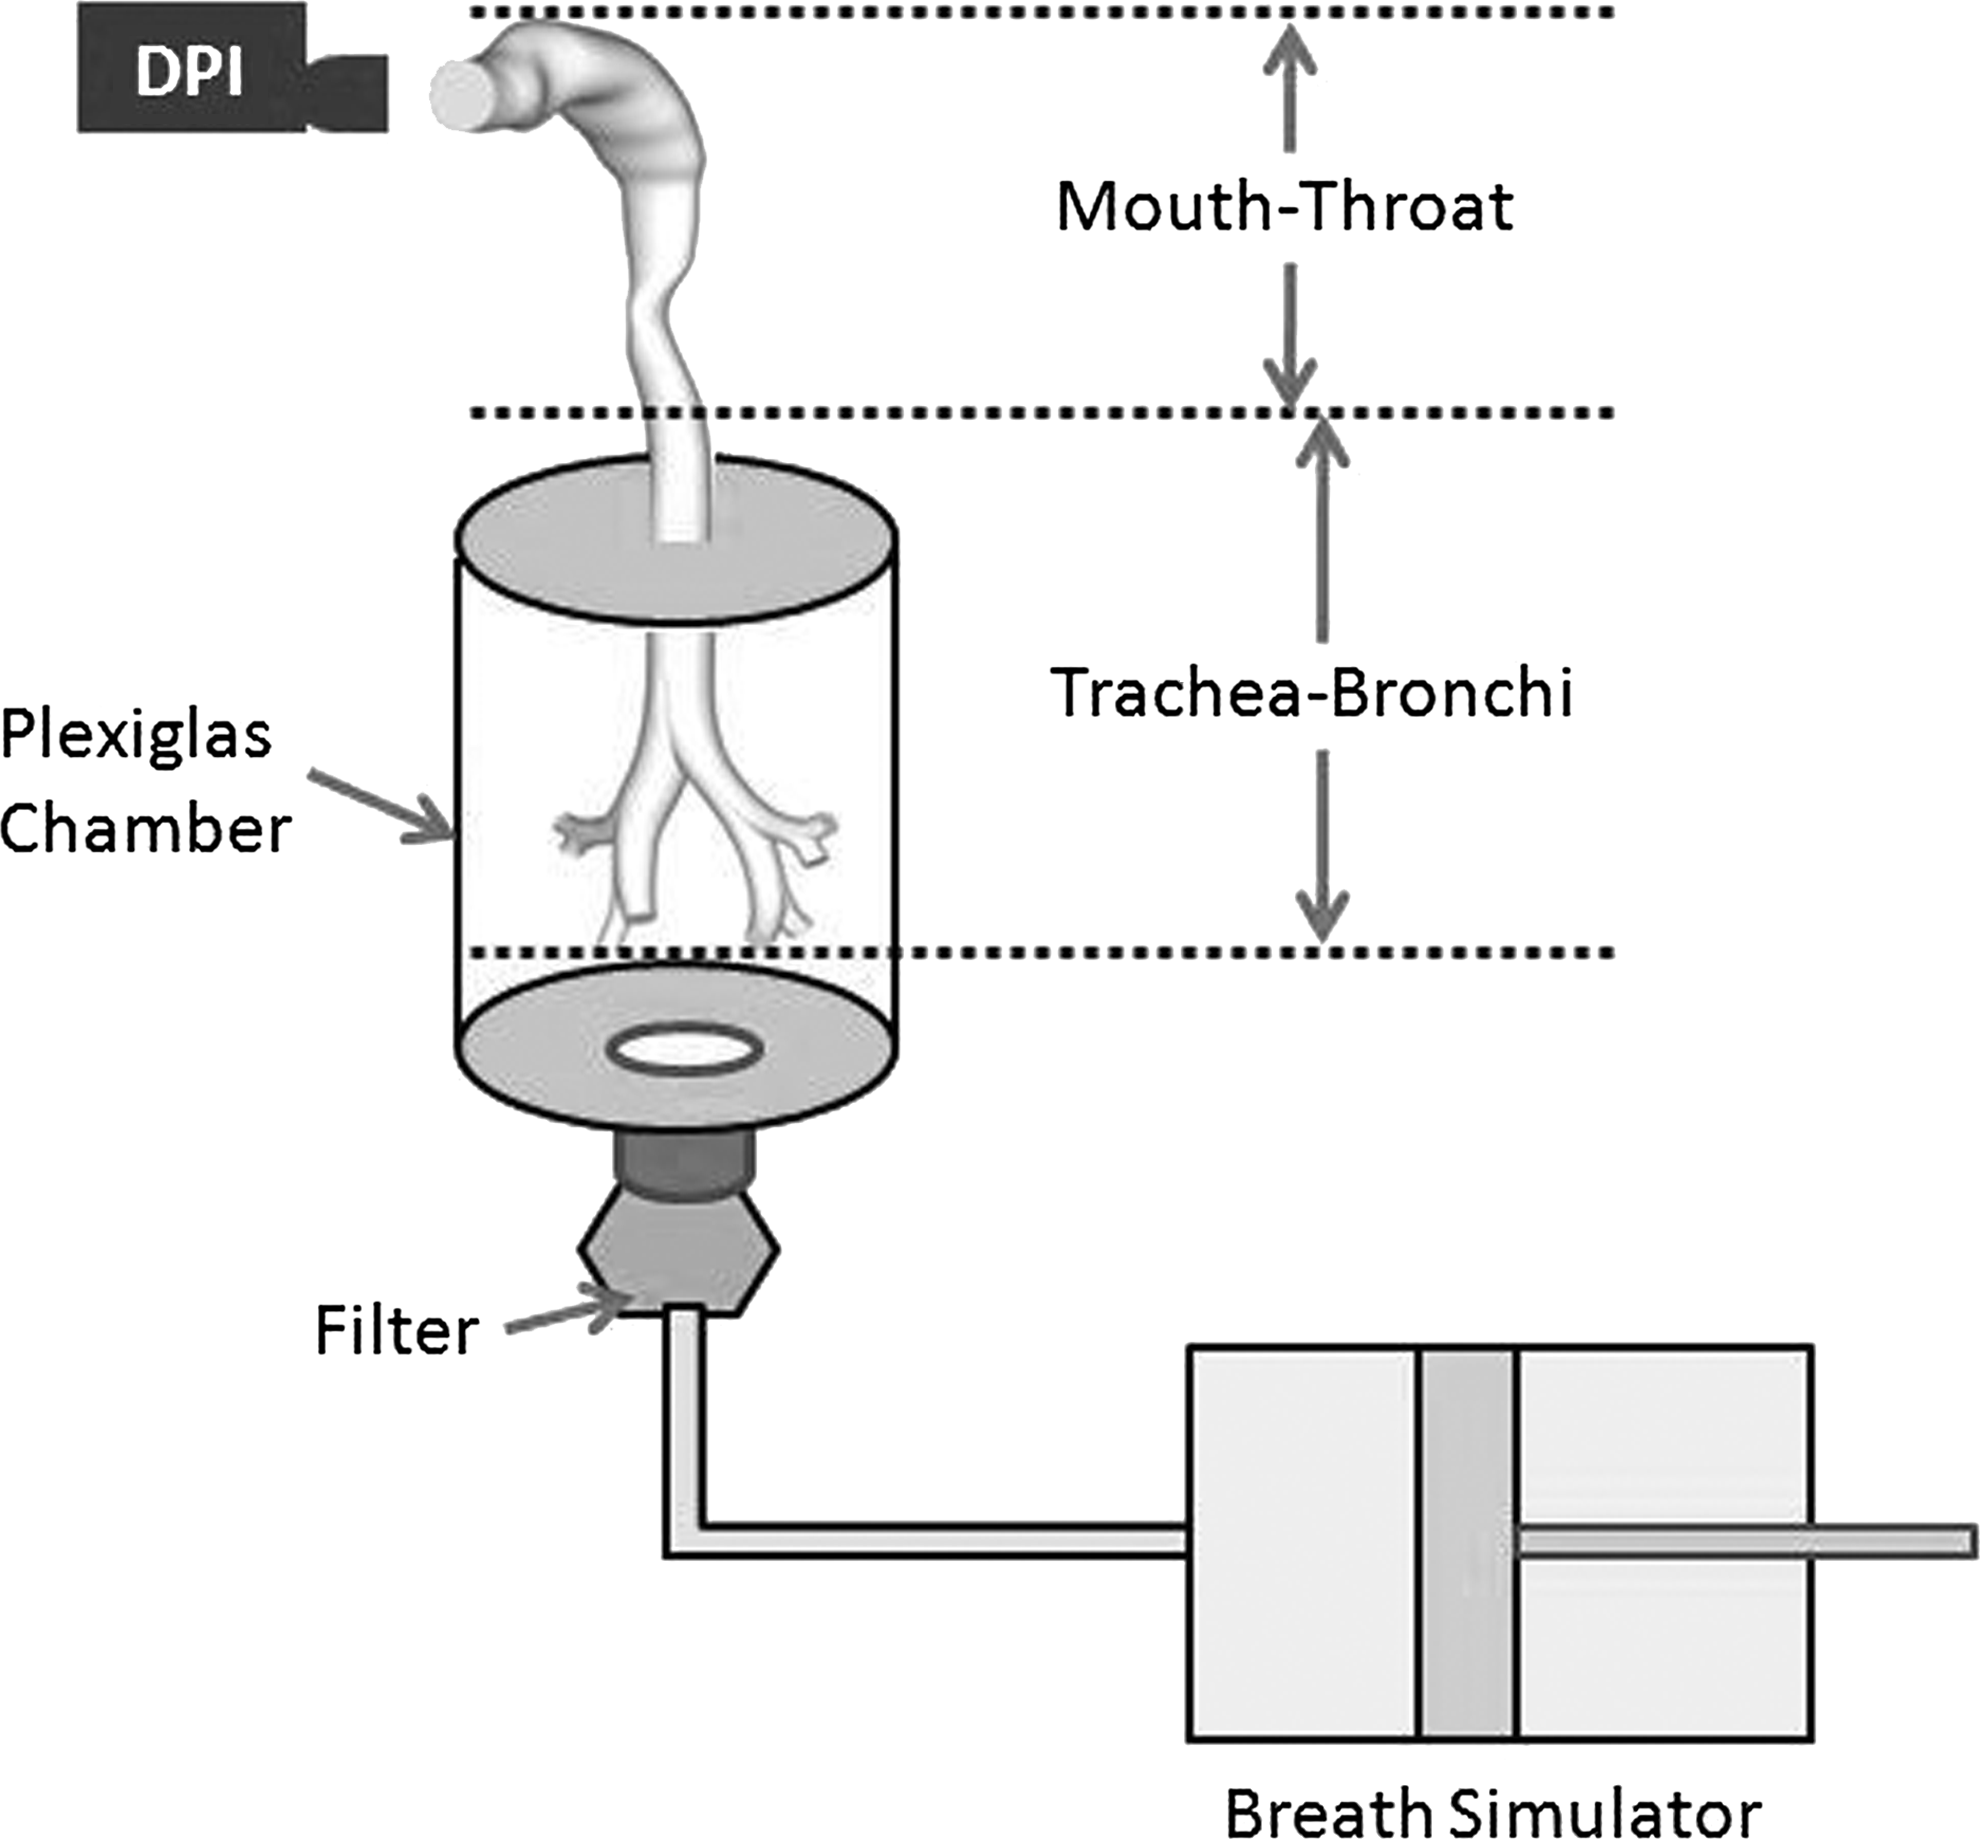
In our previous study, we described different airway models of the mouth–throat, trachea, and upper bronchi that, after scaling, could create small, medium, and large versions (MT-TBS, MT-TBM, MT-TBL) that together spanned 95% of the geometric variation seen in the upper airways of normal human adults of both genders.(4) When these models were parsed with the simulated inhalation maneuvers (and used in the equipment setup shown in Figure 1), it proved possible to quantify median lung deposition in vitro and its 95% confidence limits that correlated 1:1 with in vivo results from differently trained healthy adults inhaling from an early version of Budelin Novolizer.(4) To extend our previous findings, the present study aimed to assess the robustness of these in vitro methods by evaluating “average” in vivo deposition patterns in normal adult humans across a range of different DPIs. Deposition patterns from five marketed DPIs were determined in vitro and compared with literature values reported following gamma scintigraphy studies in healthy volunteers to evaluate the in vitro–in vivo correlation (IVIVC) stoichiometry across inhalers from different manufacturers.
Materials and Methods
Physical model of the upper airways and test apparatus
An anatomically accurate airway model of the mouth–throat, trachea, and upper generations of the bronchial tree (MT-TB) was used to assess aerosol drug deposition from five different marketed DPIs. This model and the methods used to study inhaler deposition have been described in detail previously.(4) The complete geometry of the MT-TBm model that was used for in vitro testing is the same as that described as the “medium” model in the previous study. In brief, the model consisted of a characteristic MT geometry developed by Xi and Longest,(5) the trachea, and the first three bifurcations of the upper TB airways based on the data of Yeh and Schum(6) scaled to approximately adult medium-size dimensions.(7) The MT-TBm model was constructed from laser-cured resin (Accura 60, 3D System, Valencia, CA) using rapid prototyping (Viper SLA, 3D Systems), housed in a Plexiglas® vessel with the mouth–throat (MT) section exposed for attachment to different inhalers (Fig. 1). Suitable mouthpiece adapters were created to connect the mouthpiece of each inhaler to the mouth inlet of the model so that air could be drawn through the assembly according to breath simulator–defined flow profiles (Fig. 2). The MT-TB model and a sample mouthpiece adapter as used in this study are freely available for download from the RDD Online website.(8) The MT-TBm model housed in Plexiglas, connected to the ASL 5000 breath simulator via a total capture high-flow filter (Pulmoguard II, SDI Diagnostics, MA), was designed as a low-resistance setup with a small overall volume.(4) Because of this design, volumetric air flow rate versus time profiles programmed on the breath simulator could not be distinguished graphically from profiles measured at the mouthpiece of the test inhalers using a high-quality, calibrated flowmeter (Mass Flow Meter EM1, Sensirion Inc., Westlake Village, CA) with a digital capture frequency of 200 sec−1. Figure 3 shows the raw data for a programmed simulator flow compared with the measured volumetric flow into MT-TBm in the absence of an inhaler; although a small lag between the induction of flow at the simulator and its appearance at the mouth orifice was evident, it was barely distinguishable from the noise in the data.
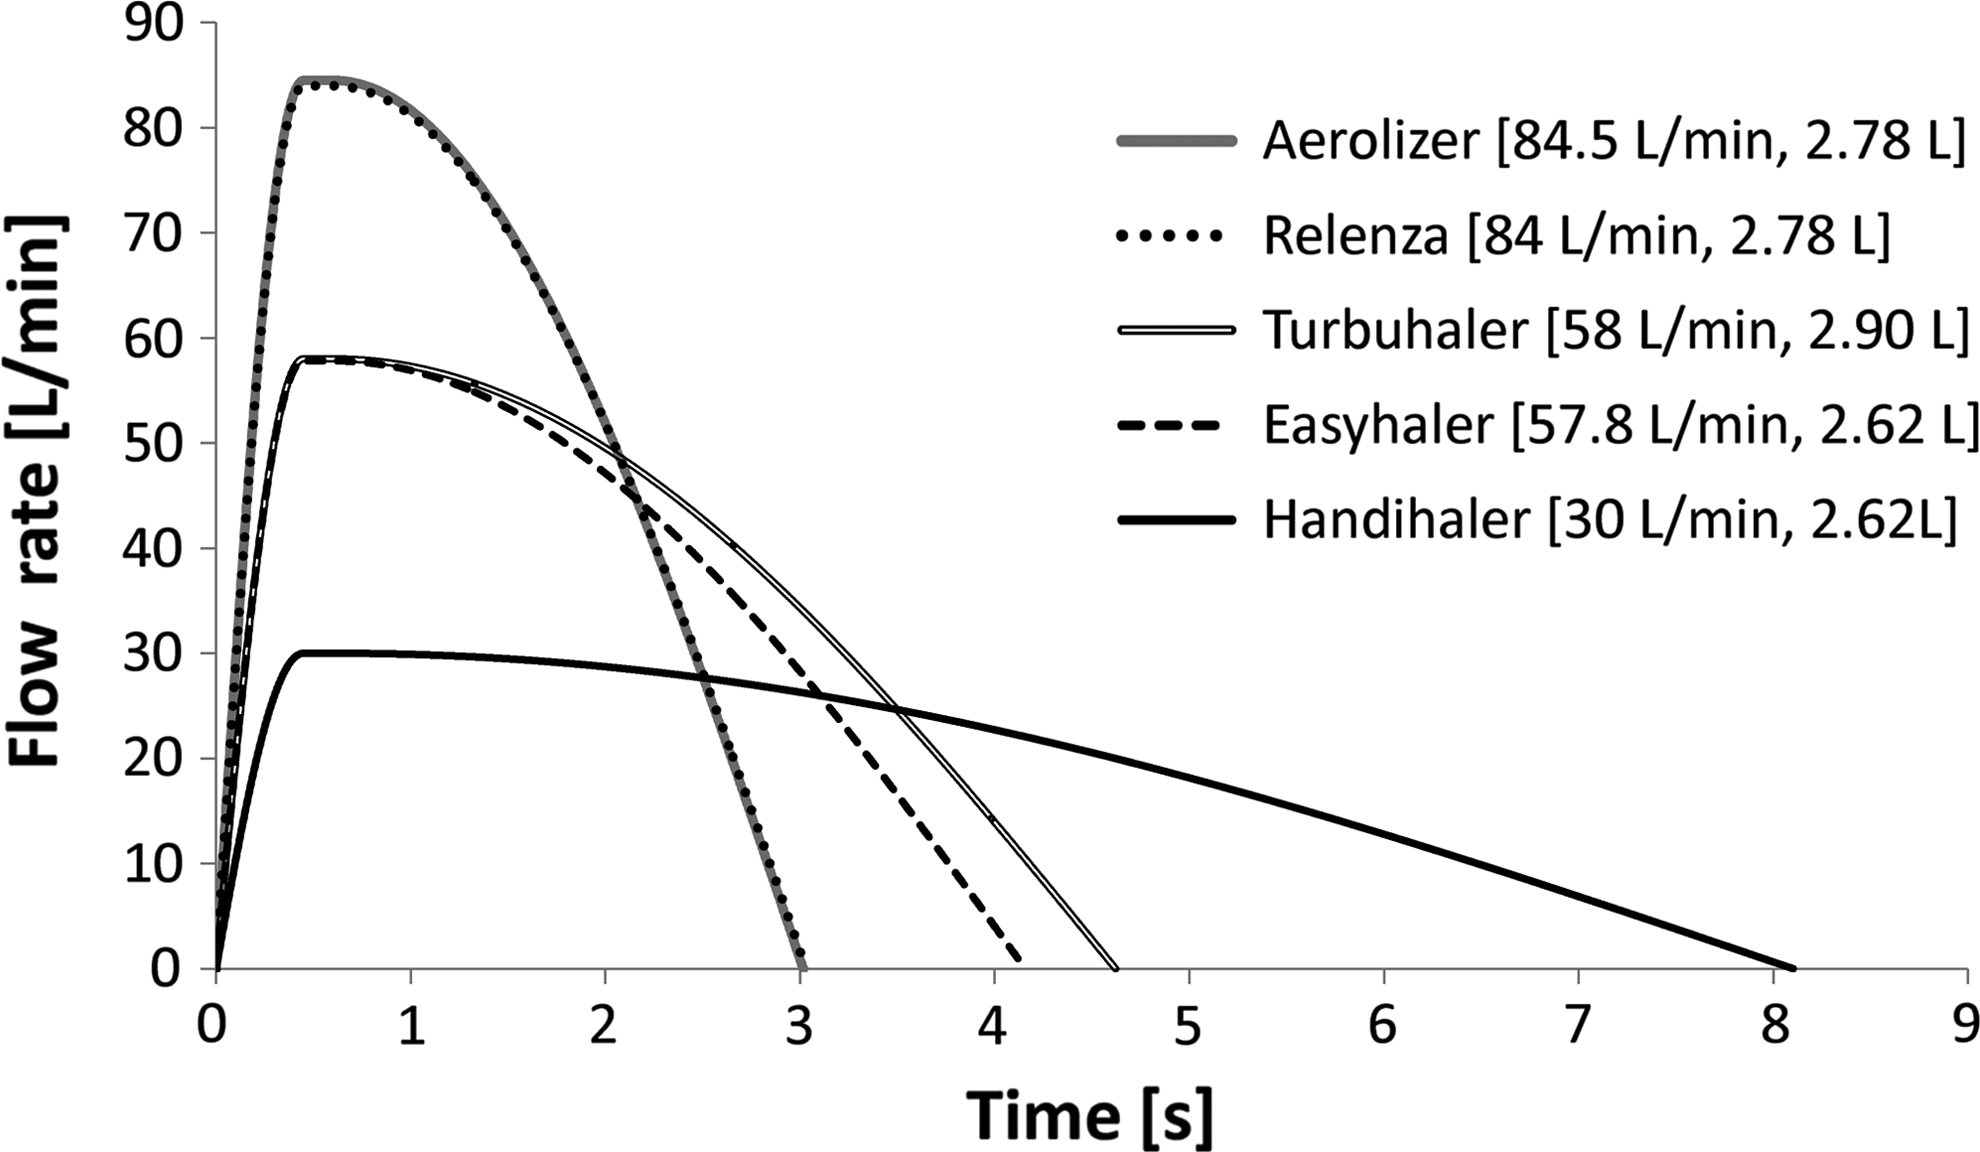
Simulated “average” flow rate versus time profiles used in testing different DPIs. Profiles were generated using methods described in detail previously(4) to represent reported or estimated values for peak inhalation flow rate (PIFR) and inhaled volume (V) from clinical testing of DPIs in normal human volunteers.(4,12–17) PIFR was held constant between T=0.45 and 0.6 sec in each case. Values for V for Aerolizer and HandiHaler were not reported in the literature (Table 1); test values for those inhalers (Table 3 and here) were estimated from reports for Relenza Diskhaler and Easyhaler (based on their comparable air flow resistances).
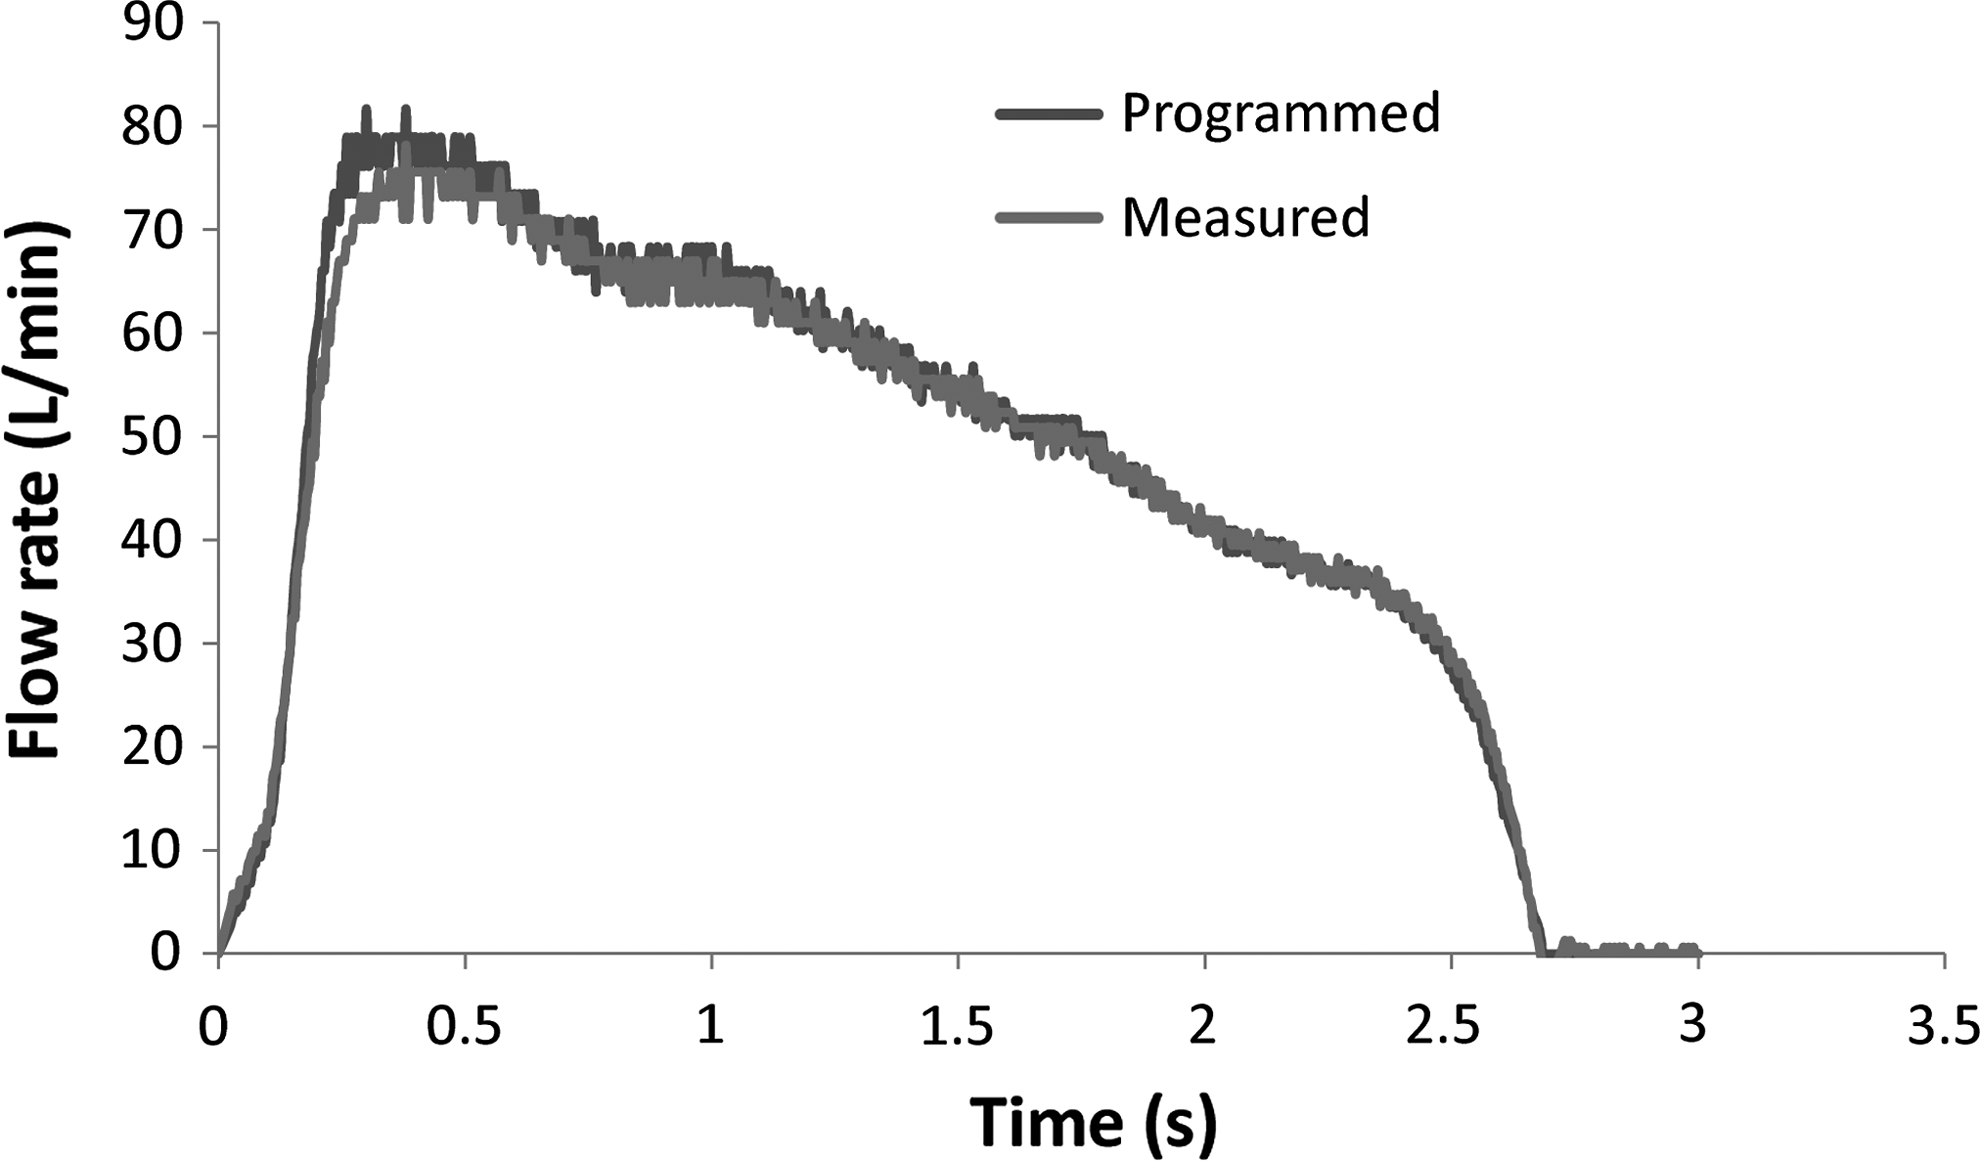
Comparison of a typical programmed breath simulator profile and the measured air flow rates at the mouthpiece of Novolizer in an in vitro experiment.
D, number of doses inhaled; F, female; M, male; N, total number of healthy volunteers; NR, not reported; PIFR, reported peak inhalation flow rate; V, reported inhalation volume (experimental ranges and±SD are shown as reported).
Apparent air-flow resistance of test inhaler (kPa0.5min L–1) based on linear regression of pressure drop1/2 versus flow rate.
Materials
The commercial DPIs used in this study are shown in Table 1. DPIs were chosen based on the availability of gamma scintigraphy studies in the literature performed in normal adults for which inspiratory profile information was either reported or could be reasonably deduced. All inhalers were obtained from pharmacy outlets in either the United States or United Kingdom. Chemicals and solvents used in the study were HPLC grade obtained from Fisher Scientific (Pittsburgh, PA). Drug analysis used reverse–phase HPLC analysis with a Waters HPLC separations module and photodiode array detector (Waters models 2690 and 2996, Waters Corporation, Milford, MA). Separation columns and assay conditions are shown in Table 2.
All methods used Waters 2690 HPLC separations modules and a Waters 2996 PDA detector (Waters Corporation, Milford, MA). HPLC conditions and columns were as shown.
In vitro deposition testing
The general method used to assess in vitro regional deposition from the different inhalers has been described in detail previously.(4,9) The medium airway model was installed in a purpose-built airtight Plexiglas housing (artificial thorax) connected to a programmable breath simulator capable of pulling air at variable flow rates as shown in Figure 1. Before each deposition experiment, internal surfaces of the model were coated with either a glycerol:methanol mixture (1:2) or silicone fluid (Dow Corning® 316 Silicone Release Spray, Dow Corning Corp., Midland, MI) to prevent re-entrainment after particle deposition. When activated, the breath simulator pulls air, through the inhaler, model, chamber housing, and total drug-retention filter using a flow rate profile typical of inhaler use in vivo (Figs. 2 and 3). Drug deposited in the various regions of the model and the DPI device was recovered using appropriate volumes of solvent as listed in Table 3. Total drug recovery was calculated by adding the drug deposited in the device, MT (including the trachea), and total lung (bronchi+chamber+filter) as described previously.(4) Regional deposition results were expressed as the percentage of total drug recovery. Inhalers were tested as if they were being used in practice according to their package inserts; thus, for three of the five inhalers, single doses were actuated once, whereas for Aerolizer®, each capsule was actuated using two separate flow rate versus time profiles to ensure good device emptying. Also, in the case of HandiHaler®, two capsules were used for each in vitro deposition experiment to achieve drug concentrations well within the quantification range of the analytical method (HandiHaler package insert, Aerolizer clinical study,(10) and personal communication). Before testing, each HPLC method (see summaries in Table 2) was validated according to ICH guidelines(11) and shown to have inaccuracy and imprecision values below 3% in all cases. Each in vitro deposition experiment was performed five times.
PIFR and V values that comprised the “average” air flow profiles (Fig. 2) were either derived from clinical reports in Table 1 or, when these were not reported, estimated based on (a) Newman et al.(17) (Easyhaler) or (b) values reported in the literature for inhalers with comparable resistances (Aerolizer and HandiHaler).(12,16)
Number of doses inhaled/number of inhalations per dose.
Simulated inhalation flow rate versus time profiles used for the in vitro studies are shown in Figure 2. Simulated profiles were created and replicated by the breath simulator (ASL 5000, IngMar Medical, Pittsburgh, PA) as described in detail previously by Delvadia et al.(4) Values for peak inhalation flow rate (PIFR) and inhalation volume (V) (Fig. 2) were chosen based on the inhalation parameters reported in the literature for trained normal adults as described in Table 1 except for HandiHaler.(12–17) For HandiHaler, values for PIFR and V were chosen based on the mean values reported in patients as shown in Table 3 and Fig. 2. In all cases, an inhalation flow profile was chosen that was specific to the inhaler and the average peak inhaled flow rate and volume reported for the subjects during gamma scintigraphic deposition studies (Table 1); notably, however, in vitro data generated for each device used an average profile, whereas in vivo scintigraphy data used profiles that varied with the subjects studied.
In order to further assess the validity of deposition correlations based on these methods, results for mean percent drug deposition in each in vitro region were compared with those from the in vivo gamma scintigraphy studies listed in Table 1(10,12–15) for each of the inhalers investigated.
Results and Discussion
The five DPIs used in this study differed in many respects. The drug, drug formulation, metered and delivered doses, aerosol dispersion mechanisms,(18–20) and air flow resistances all varied markedly (Table 1). The labeled drug dose across inhalers ranged from 12 μg (Foradil® Aerolizer®) through 5 mg (Relenza® Diskhaler®). The inhalers also covered the range of airflow resistances that is typical across all commercial DPIs that are presently available. Relenza Diskhaler and Aerolizer are examples of low- resistance inhalers; HandiHaler and Easyhaler® have high resistances, whereas Turbuhaler® fell between these extremes (Table 1). Even though our previous work implied that our in vitro tests were good post-hoc predictors of in vivo drug deposition and that a 1:1 IVIVC was possible,(4) we performed this study with the inhalers in Table 1 to further challenge our methods across products with a range of different properties.
Unfortunately, published in vivo deposition studies on inhalers are rarely as well designed or described as those of Newman et al. with the Budelin Novolizer,(21) which described both the subjects and the multiple ways in which those subjects were trained to inhale. Based on those data, it was possible to study the performance of the newly described in vitro methods in small, medium, and large MT-TB models across a range of reported in vivo air flow profiles.(21) This approach was used to create an IVIVC to show the median and the likely 95% confidence limits of drug deposition from Budelin in the lung.(4) Because of the way that the in vivo drug deposition studies for inhalers shown in Table 1 were executed and reported,(10,12–15) such a thorough approach involving confidence limits was not possible in the present study. Instead, this study was designed to evaluate the “average” drug deposition correlations for different inhalers in vitro, following the use of the medium airway model (MT-TBm) coupled with inhalation profiles based on the average inhalations reported in the in vivo deposition studies. These average in vitro deposition results were compared with the average in vivo values from scintigraphy in normal volunteers to create and evaluate IVIVCs for different products.(10,12–15)
It is important to recognize that the in vitro determinations were performed by direct drug assay following the use of “in date” commercially produced inhalers that had been subjected to regulatory inspection and quality control. Tests were also performed under normal laboratory conditions of temperature and humidity (21–23°C and 30–60% relative humidity) that were not necessarily the same as the environmental conditions used during scintigraphy studies. In the selected in vivo studies from the literature, volunteers inhaled 99mTc-radiolabeled drug formulations and the label, not the drug, was used to assess deposition.(10,12–15) In the selected studies, the labeling process was reported to produce comparable aerodynamic particle size distributions (APSDs) to the unlabeled drug products by impingement/impactor testing under constant flow conditions.(10,12–15) Notably, however, radiolabeling techniques that are routinely used to prepare these physical admixtures of label and the dry powder drug formulation are rarely without problems. For example, due to short radioactive half-life concerns, APSDs are usually only checked for formulations that are not actually administered to volunteers, whereas those doses that are administered are prepared and used in “one-off” experiments following radiolabeling procedures that may not always be robust.(22) To create the correlations described here, the gamma camera counts as reported from different regions were processed by the study authors to correct for radioactive decay, tissue attenuation, and scattering. With the exception of Easyhaler, in which all the results were expressed as a percentage of the delivered radioactivity (measurement of DPI device retention was impractical), corrected counts from the DPI device, lungs (trachea is omitted as described previously),(4) MT (combined deposition from the oropharynx, gastrointestinal, and tracheal regions), and exhalation filter were each reported as a percentage of the total count from each experiment. Percent counts in each region were considered to be an indirect measure of the percentage of drug deposited in different sites, based on the radiolabeling validation studies conducted prior to scintigraphy. Because tracheal deposition was reported separately for the antiviral Relenza Diskhaler,(15) in vivo data for that product was adapted to conform to the definitions used for all other inhalers.
Figures 4, 5, and 6 show the observed drug deposition in vitro and in vivo for each different DPI. The literature values from the clinical scintigraphy studies are for healthy adults of both genders in each of the small studies summarized in Table 1. In vitro regional deposition results were a function of the inhalation profiles (Fig. 2) used for testing and the number of actuations per dose shown in Table 3. These waveforms were chosen carefully based on the literature descriptions of the in vivo studies and our inhalation profile simulation methods described in detail previously.(4) Total lung (Fig. 4), MT (Fig. 5), and DPI device retention (Fig. 6) are presented as percentage of total drug recovery in vitro in comparison with percentage of total counts in vivo.(10,12–15) Figure 4 shows clearly that mean in vitro deposition was comparable to that seen in vivo, with the exception of Relenza Diskhaler where the in vitro results apparently overestimated the average lung deposition of the antiviral drug, zanamivir, from Diskhaler. The IVIVCs in Figure 4 (except Relenza Diskhaler) showed a 1:1 comparison between in vitro and in vivo results with an absolute percent total lung deposition (%TLD) difference of 2% or less for all the DPIs. This finding is significant, because it shows that our in vitro method appears capable of accurately correlating the average in vivo lung deposition across a variety of DPI devices and formulations, even when the latter is collected in small numbers of mixed gender normal human adults using methods that are commonly believed to be quite variable.(1,2) As expected, variance in vitro was much smaller than the variance seen in each in vivo study (Figs. 4–6), showing that the in vitro methods, when used with a single inhalation profile and DPI device, were quite robust. In the case of Relenza Diskhaler, a high drug dose DPI, we took care to avoid the powder re-entrainment we had seen and reported previously with this device during cascade impaction studies.(23) In this case, it appeared that the disparity between the average in vitro and in vivo results for Relenza Diskhaler was most likely due to the poor labeling validation in the in vivo study, resulting in differences in deposition patterns between the radiolabel and the drug. This supposition is supported by the values for device retention in the in vivo study (Fig. 6), where Relenza Diskhaler shows unrealistically good device emptying in the clinic that in practice leads to overestimates for both MT and TLD (Figs. 5 and 4, respectively); inference is supported by independent reports of Relenza Diskhaler device retention.(23)
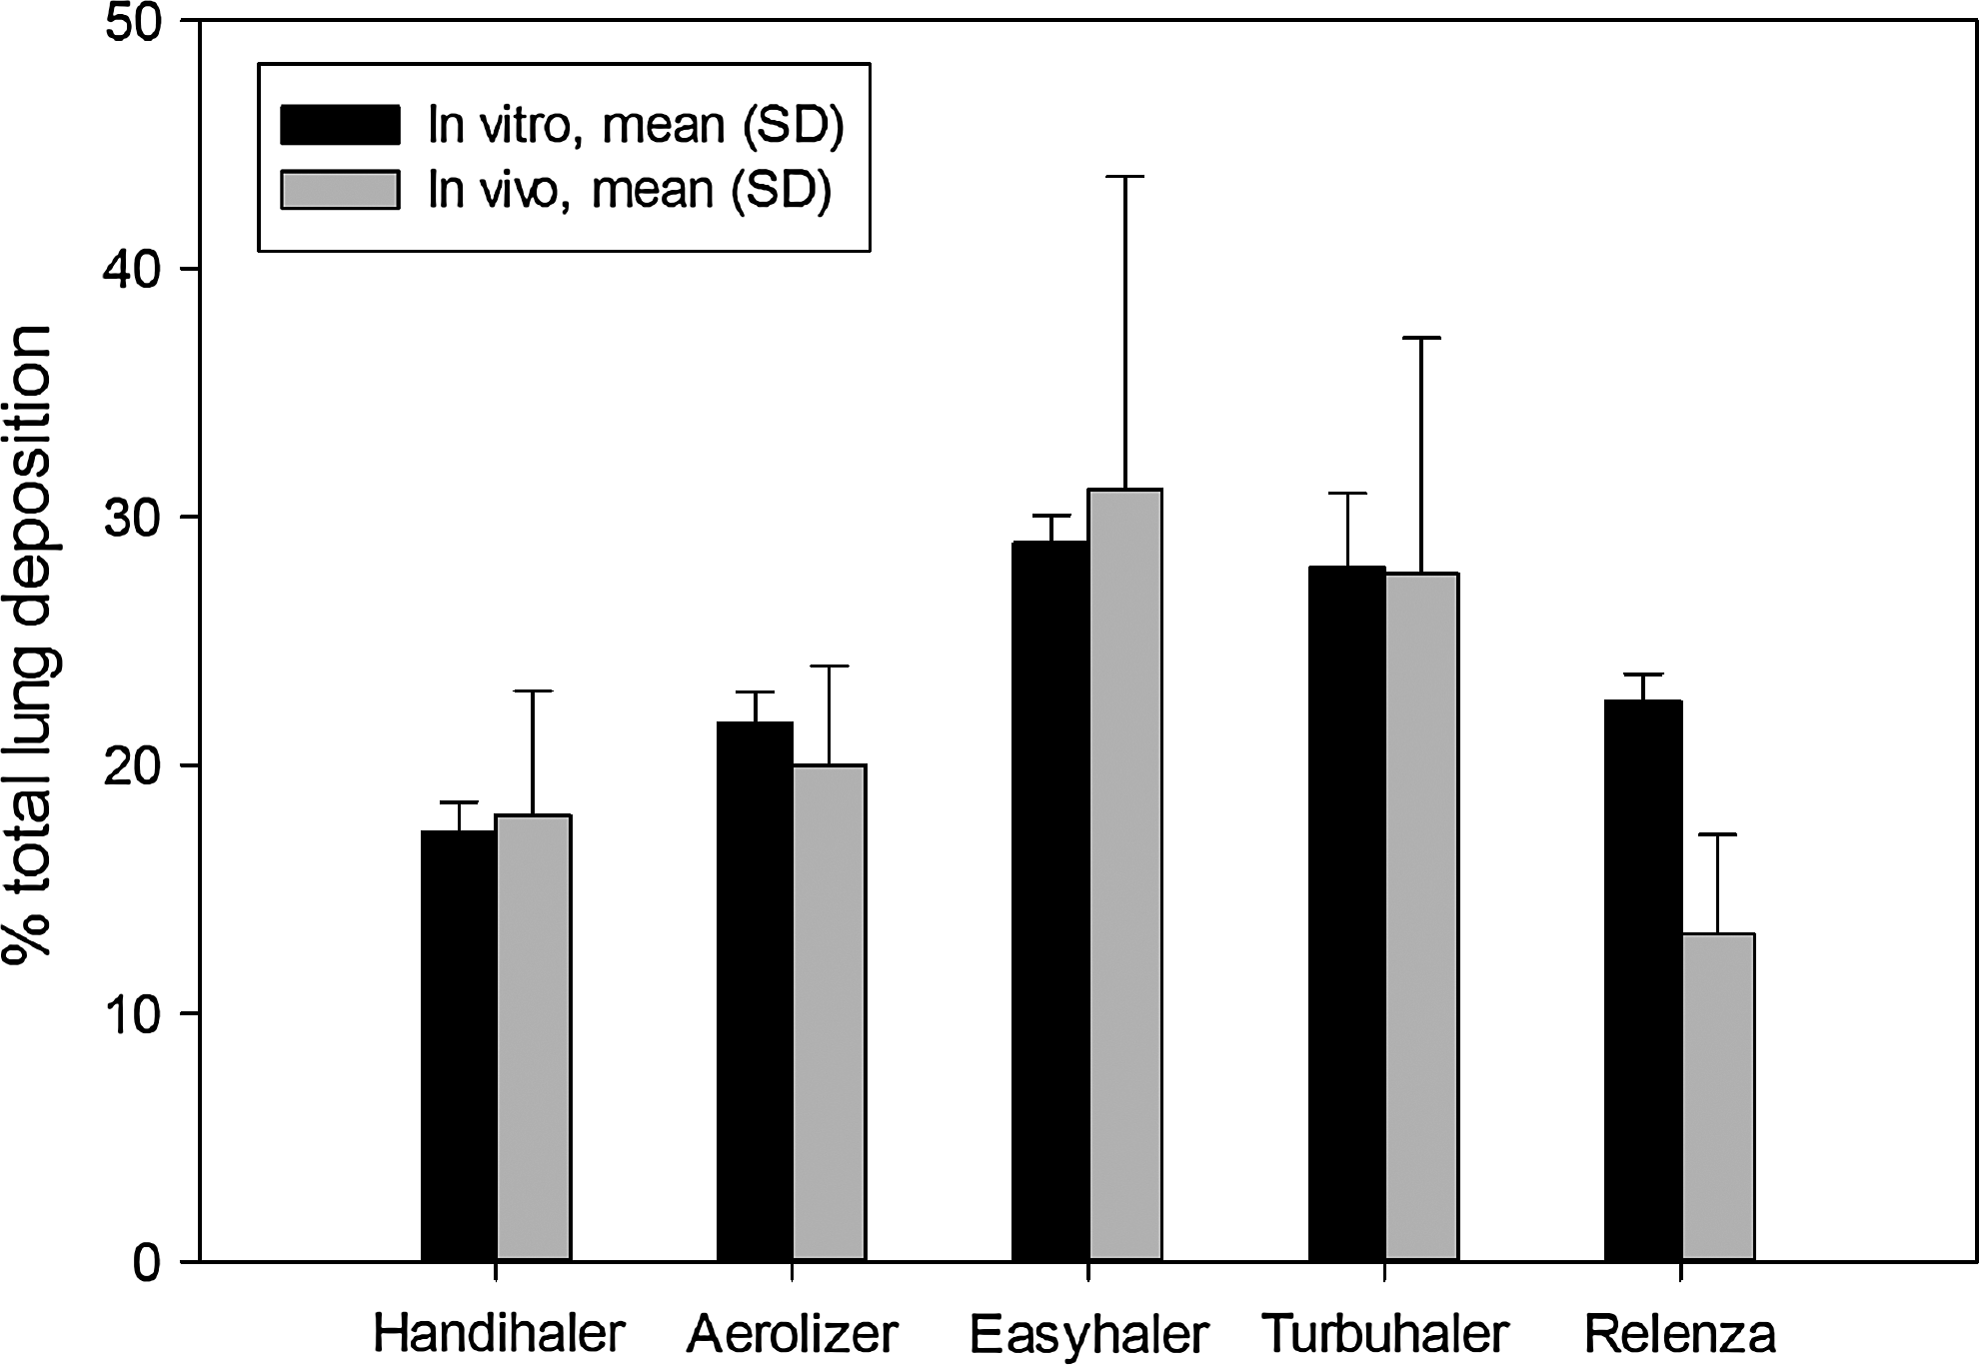
Mean percent total lung deposition (TLD) for five DPIs following in vitro testing (n=5) in the medium airway model described in detail previously.(4,8) Tests used the “average” flow rate profiles shown in Figure 2 in all cases. Results are shown in comparison with mean (SD) values reported in the literature.(10,12–15) Error bars are standard deviations.
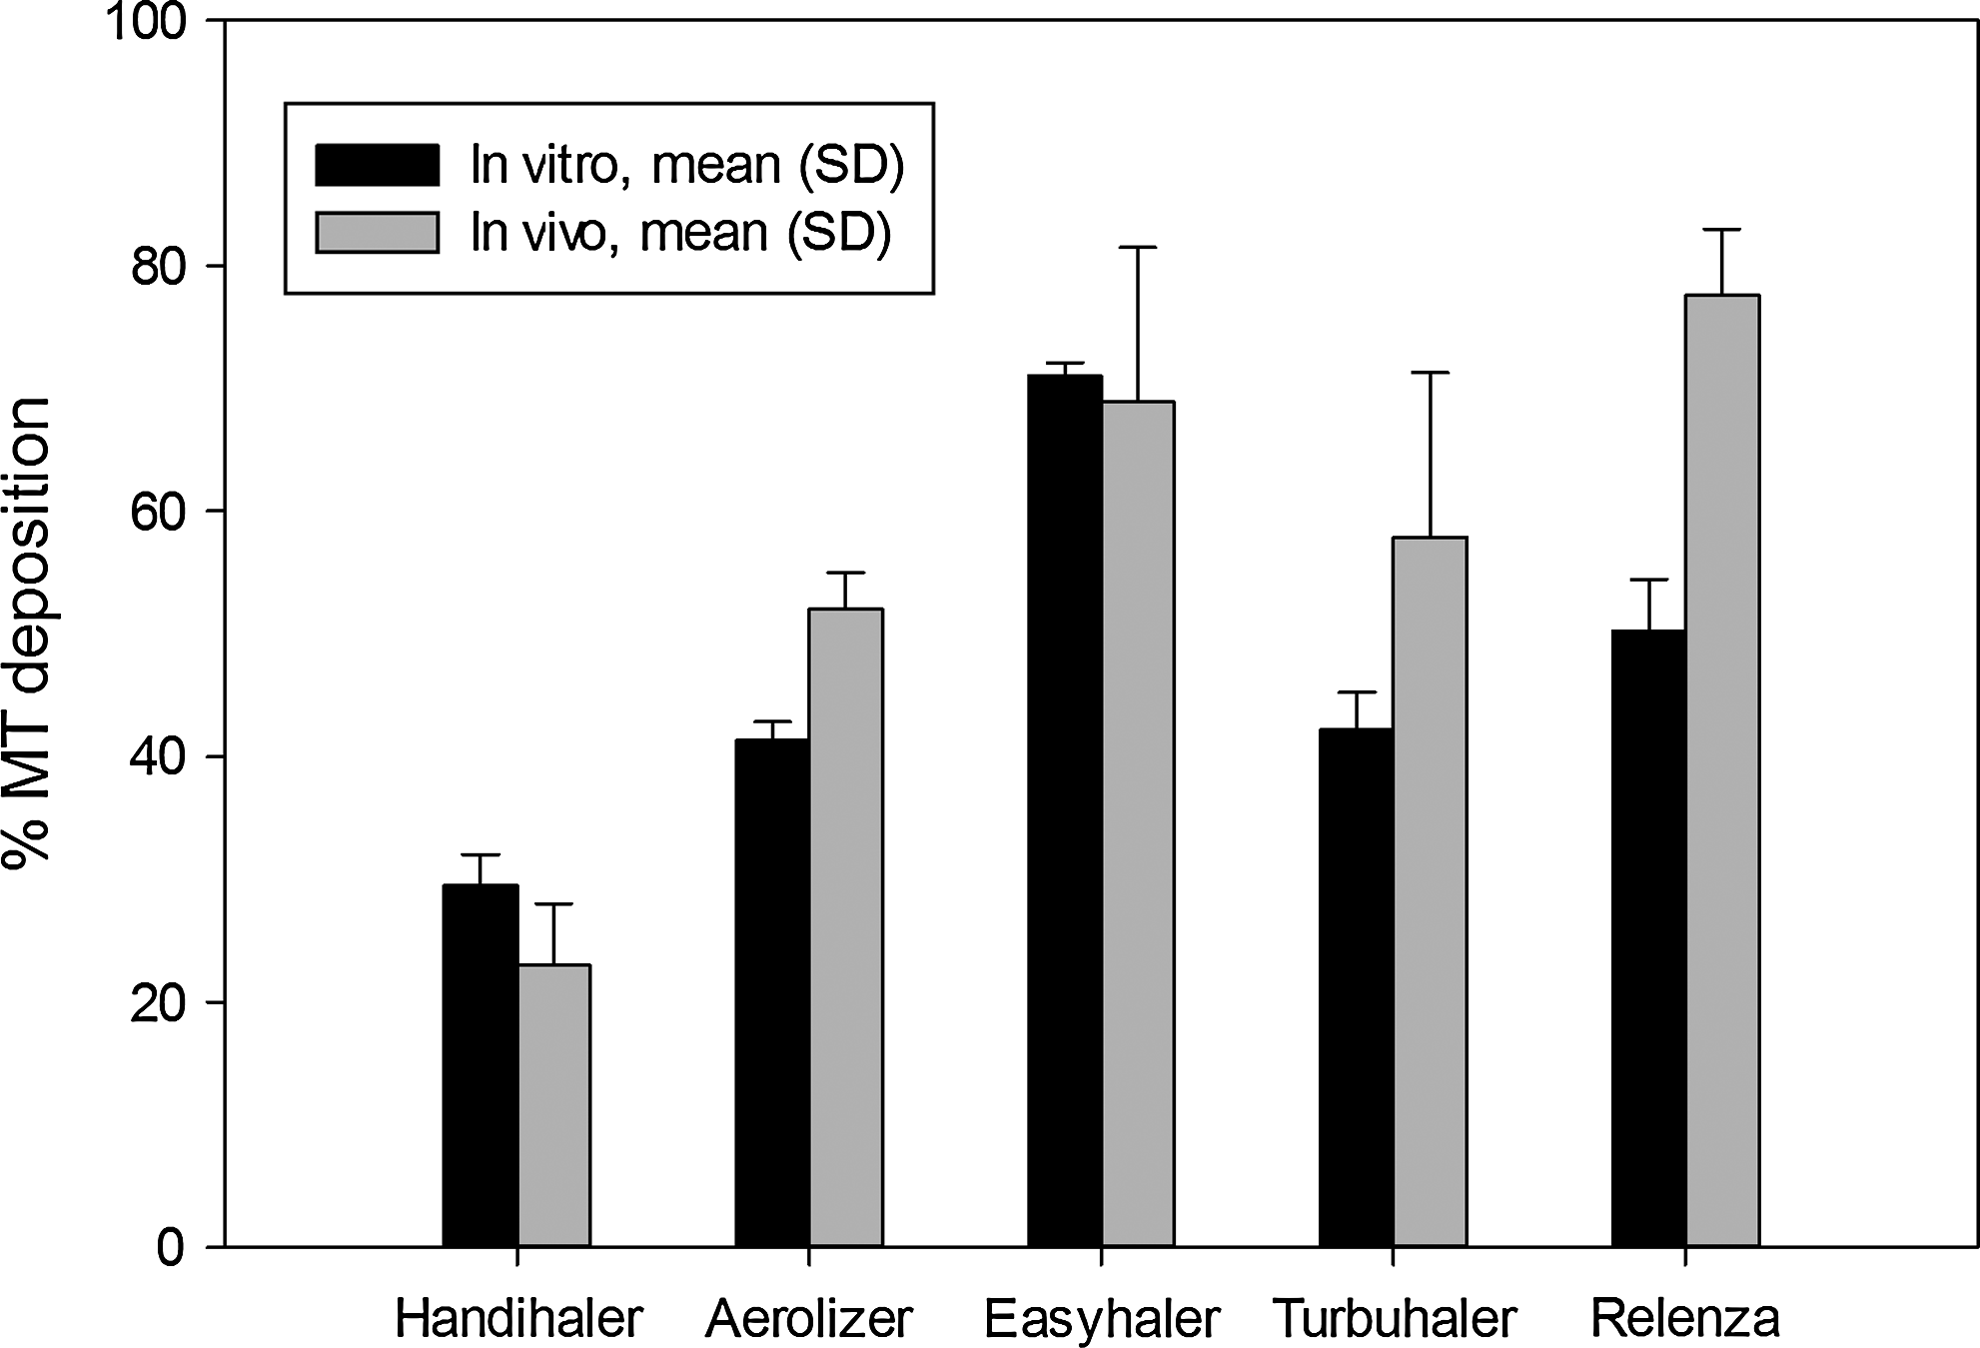
Mean percent mouth–throat and tracheal drug deposition (MT+trachea) for five DPIs following in vitro testing (n=5) in the “medium” airway model described in detail previously.(4,8) Tests used the “average” flow rate profiles shown in Figure 2 in all cases. Results are shown in comparison with mean (SD) values reported in the literature.(10,12–15) Error bars are standard deviations.
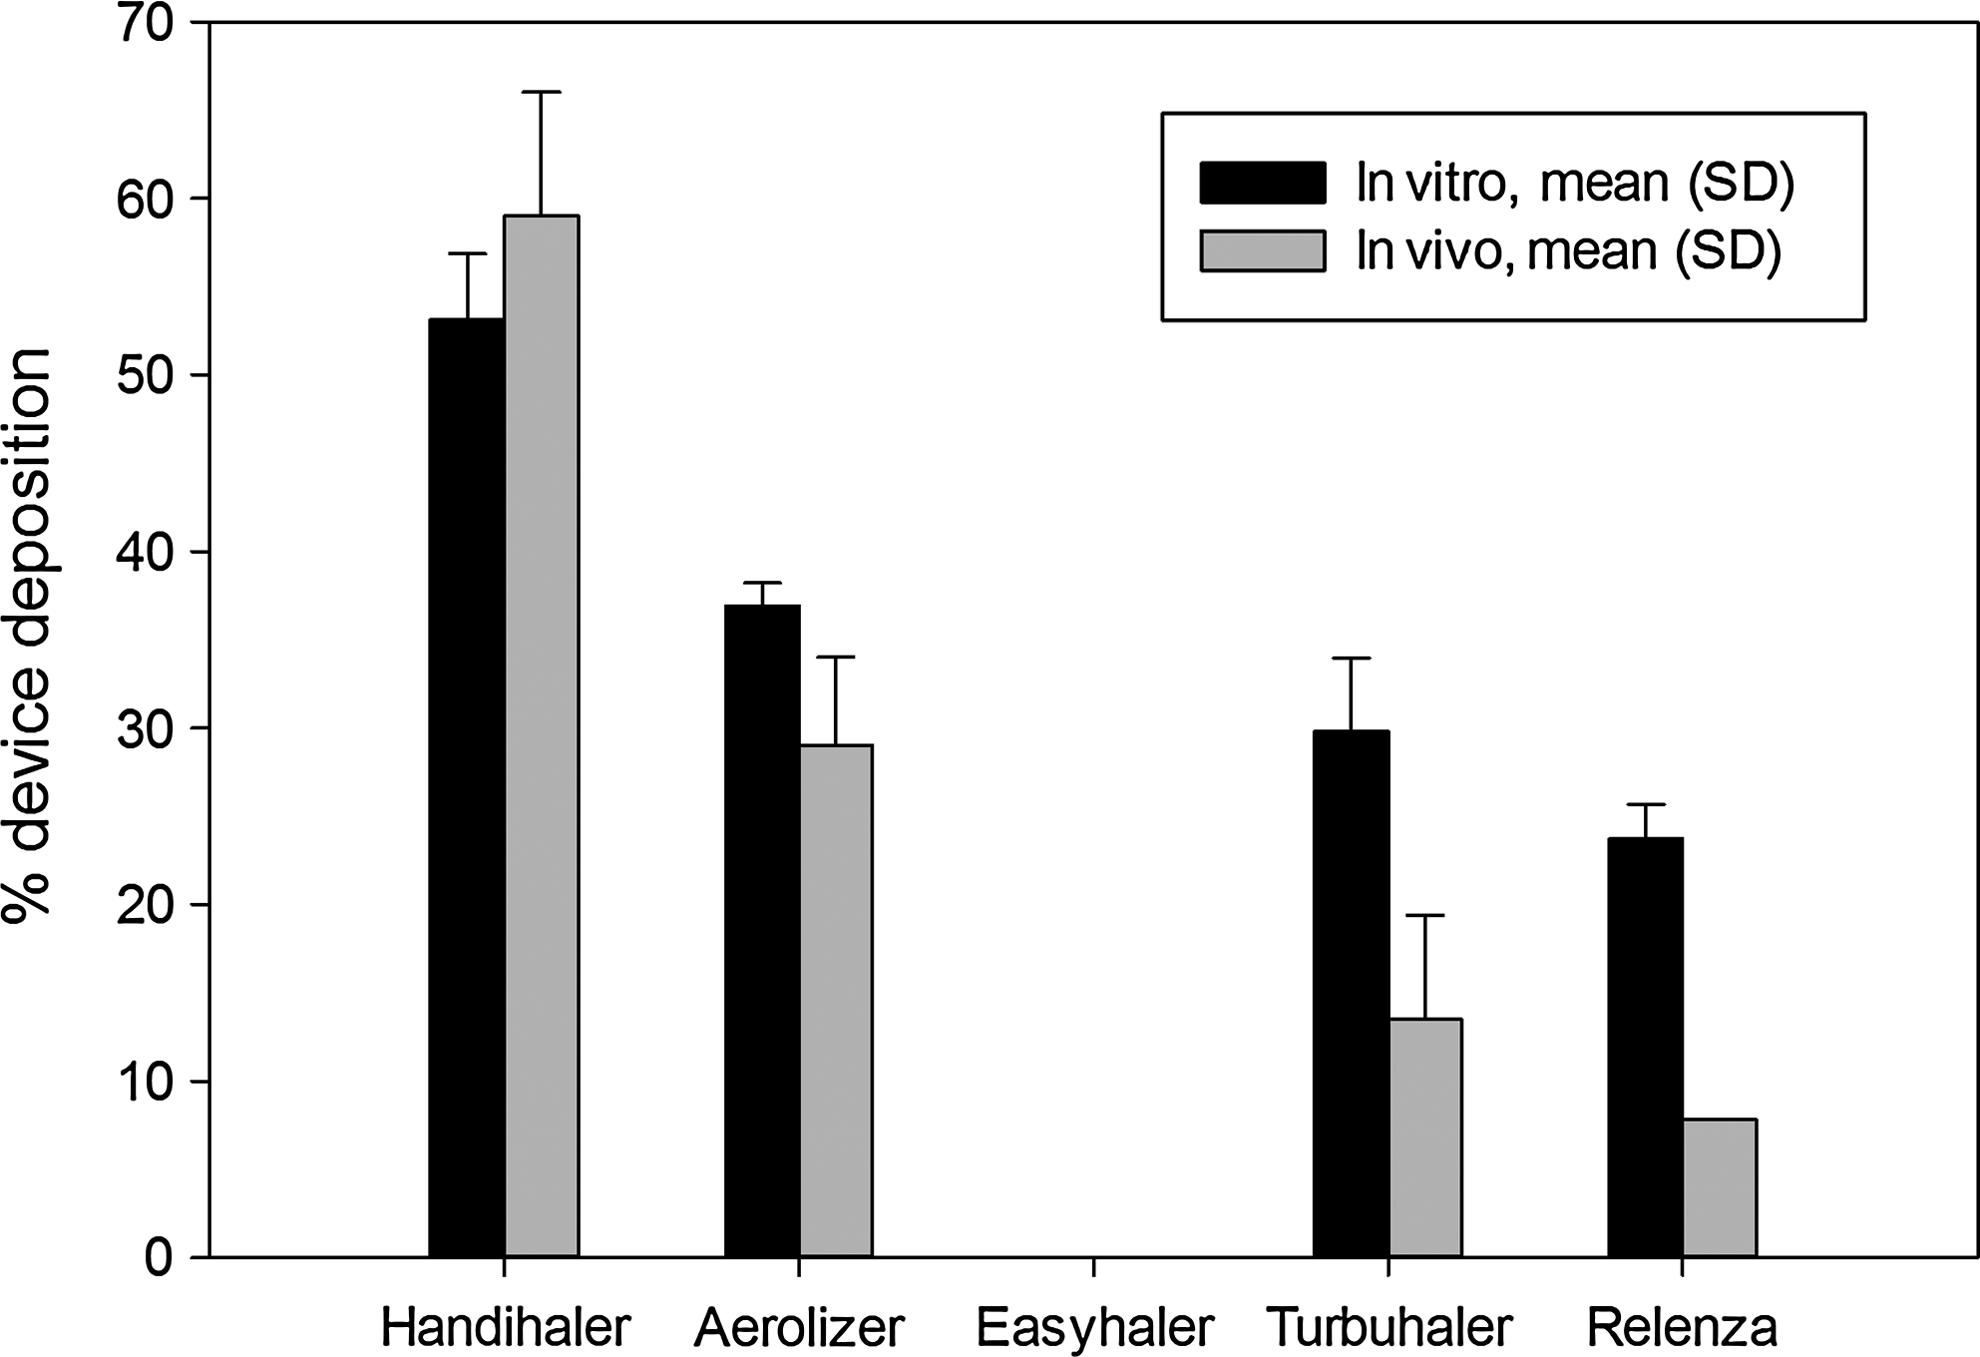
Figure 5 shows relatively good agreement between the values for MT deposition in vitro and in vivo for all DPIs except Relenza Diskhaler, whereas with Turbuhaler and Aerolizer, a tendency to underestimate reported in vivo MT deposition was also observed. One explanation for the inconsistencies observed between the in vitro and in vivo deposition data for Relenza Diskhaler may be that there was a mismatch between drug and radiolabel on the device and throat; notably, Cass et al. compared in vitro APSDs of drug and radiolabel based only on the dose collected in the impactor (rather than the complete metered dose).(15) This “powder sampling” approach may lead to false conclusions concerning labeling validity when a poor match exists between drug and radiolabel in the large-size fractions that fail to enter the impactor.(15) In fact, considering the invasive nature of the radiolabeling techniques most often used for in vivo DPI deposition estimates (these involve “wetting” the powder to be aerosolized with a nonsolvent in which the radiolabel is suspended),(22) it seems quite likely that the size distributions of the complete radiolabeled dose and the unaltered drug dose may differ. For example, Borgström et al., in their radiolabeling method validation studies for Pulmicort Turbuhaler, reported that mouthpiece retention was about 13% for radiolabel, whereas for nonlabeled budesonide deposition the value was around 19%.(14)
From the present study, we concluded that our in vitro methods using a “medium” geometry MT-TB model coupled with an appropriately simulated inhalation profile was capable of correlating the average values for total lung deposition very well; values for average MT deposition, and drug retention in the DPI device across a broad range of differently designed inhalers, were more of a challenge, especially given the variable data available from the small clinical studies in the literature. The method was found to produce robust in vitro data that was independent of inhaler variables such as the dispersion mechanism, the magnitude of each inhaler's resistance to air flow, and/or the precise design of the formulation. Moreover, because there is no need to radiolabel the powder formulations, the methods described here and in a previous publication(4) appear to be a cost-effective adjunct to pulmonary drug-deposition studies in vivo.
Footnotes
Acknowledgments
The Medical College of Virginia Foundation funded these studies. Guoguang Su and Ross Walenga (VCU School of Engineering) helped to develop the MT-TB models used for in vitro testing. We are grateful to Brian Meakin for his help obtaining inhalers from the United Kingdom.
Author Disclosure Statement
The authors are faculty and students of Virginia Commonwealth University. No conflicts of interest exist.