
Abstract
Abstract
Background:
Very little is known about the role of nasal morphology due to ethnic variation on particle deposition pattern in the sinonasal cavity. This preliminary study utilizes computational fluid dynamics (CFD) modeling to investigate sinonasal airway morphology and deposition patterns of intranasal sprayed particles in the nose and sinuses of individuals from four different ethnic groups: African American (Black); Asian; Caucasian; and Latin American.
Methods:
Sixteen subjects (four from each ethnic group) with “normal” sinus protocol computed tomography (CT) were selected for CFD analysis. Three-dimensional reconstruction of each subject's sinonasal cavity was created from their personal CT images. CFD simulations were carried out in ANSYS Fluent™ in two phases: airflow phase was done by numerically solving the Navier-Stokes equations for steady state laminar inhalation; and particle dispersed phase was solved by tracking injected (sprayed) particles through the calculated airflow field. A total of 10,000 particle streams were released from each nostril, 1000 particles per diameter ranging from 5 μm to 50 μm, with size increments of 5 μm.
Results:
As reported in the literature, Caucasians (5.31 ± 0.42 cm−1) and Latin Americans (5.16 ± 0.40cm−1) had the highest surface area to volume ratio, while African Americans had highest nasal index (95.91 ± 2.22). Nasal resistance (NR) was highest among Caucasians (0.046 ± 0.008 Pa.s/mL) and Asians (0.042 ± 0.016Pa.s/mL). Asians and African Americans had the most regions with particle deposition for small (5 μm–15 μm) and large (20 μm–50 μm) particle sizes, respectively. Asians and Latin Americans individuals had the most consistent regional particle deposition pattern in the main nasal cavities within their respective ethnic groups.
Conclusions
: Preliminary results from these ethnic groups investigated showed that Caucasians and Latin Americans had the least patent nasal cavity. Furthermore, Caucasians and African Americans had the lowest inter-subject consistency in regional particle deposition pattern; this may be due to greater inter-subject variability in their respective nasal vestibule morphology.
Introduction
F
The morphology of the nasal and paranasal sinuses is considered a factor that influences penetration of particle transport in the airspace. Sinonasal anatomy is characterized by variations across individuals, and these variations can be exaggerated by underlying pathology. In particular, the presence of nasal anatomic deformities such as septal deviation has been reported to severely impede particle deposition.(6–8) Similarly, normal paranasal sinuses are usually altered by chronic rhinosinusitis, and management of this disease requires a combination of medical and surgical therapies.(31–35) Following sinus surgery, topical nasal drug medication is often prescribed to prevent recurrent disease.(36)
In the absence of pathological abnormalities, anthropologists believed that variations in normal nasal shapes and sizes of the external nose were due to evolutionary adaptation of humans to climatic conditions.(37,38) Specifically, the ratio between the width and height of the external nose, known as the “nasal index” has been reported to correlate with geographic regions:(39) the “platyrrhine” (broad-nose) nasal index, described as a typical nose of the African race is associated with a hot, moist climate; a typical Caucasian nose, classified as “leptorrhine” (narrow-nose) nasal index is associated with a cold, dry climate; and a classic Asian nose is considered medium sized and is classified as “mesorrhine”.(38–40) In addition, studies have reported that the internal nasal morphology of Caucasians tend to be narrower and longer than African-Americans (Blacks).(41–44) It is worthwhile to note that inter-racial variability in nasal morphology is not limited to these racial groups.(45)
With regard to nasal physiology, it is hypothesized that individuals from ethnic origins associated with cold and dry climates tend to have greater nasal surface area to volume ratio (SA:V), a characteristic that would allow for greater airflow interactions with nasal mucosa, as well as enhance heat and moisture exchange in the cavity during respiration.(44) However, a systematic review study conducted by Leong and Eccles(37) reported no consistent evidence in the literature to support the notion that differences in nasal shape and size based on ethnic descent influence nasal physiology. Nonetheless, little is known concerning the effect (if any) of differences in inter-racial nasal morphology on particle transport in the sinonasal cavity.
The goal of the present study is to use computational fluid dynamics (CFD) modeling to investigate the relationship between nasal morphologic differences due to ethnicity and the distribution of particle deposition from simulated intranasal sprays in the nasal and paranasal sinuses of 16 subjects with nasal morphology associated with individuals from four ethnic descents: African American (Black); Asian; Caucasian; and Latin American. Furthermore, our study cohort is made up of 8 males and 8 females to investigate whether deposition patterns are sensitive to variability between genders. In addition, this study focuses on intranasal sprays because nasal steroid sprays are more frequently prescribed than other topical medications and are routinely recommended for nasal and sinus conditions.(46–48)
Methods
Selection of study cohort
After Institutional Review Board (IRB) approval, a search of Duke University Medical records was performed for all adult subjects with high resolution computed tomography (CT) images of the entire nasal cavity and paranasal sinuses from July 1, 2010 to June 30, 2013. Inclusion criteria was normal nasal cavity and sinus anatomy with septal deviation of less than five degrees in any direction including septal spurs, high resolution spiral CT scan with greater than or equal to 100 axial images of the face between the most superior portion of the frontal sinuses and the most inferior portion of the soft palate, and adequate medical records for evaluation of comorbid pathology.
Exclusion criteria was abnormal nasal cavity or paranasal sinuses, including septal deviation of greater than five degrees or perforation, radiographic evidence of sinusitis, co-morbid pathology significantly affecting the nasal cavity or paranasal sinuses, subject history or radiographic evidence of previous sinus surgery, and radiographic evidence of significant nasal cycling with unilaterally decreased airspace on visual inspection.
All images were evaluated by a Duke University attending radiologist and an otolaryngologist. All scans were noted by the radiologist and otolaryngologist to be “normal,” without substantial aberrant anatomy or significant nasal cycling. The medical records were evaluated to obtain demographic data and medical history. Sixteen subjects were chosen using the first two of each ethnic descent (African American; Asian; Caucasian; and Latin American) and gender (male and female) meeting criteria encountered in our research. A total of four subjects represented each ethnic group; two males and two females.
Sinonasal reconstruction and mesh generation
DICOM images of each subject were de-identified and imported into the image analysis software Avizo 8.1 standard (FEI Visualization Sciences Group, Burlington, MA); three-dimensional (3D) reconstructions of the nasal cavity and paranasal sinuses were created (Fig. 1) and cleaned of connections between the nasal cavities and sinuses that were due to artifacts from importing the DICOM images into Avizo.
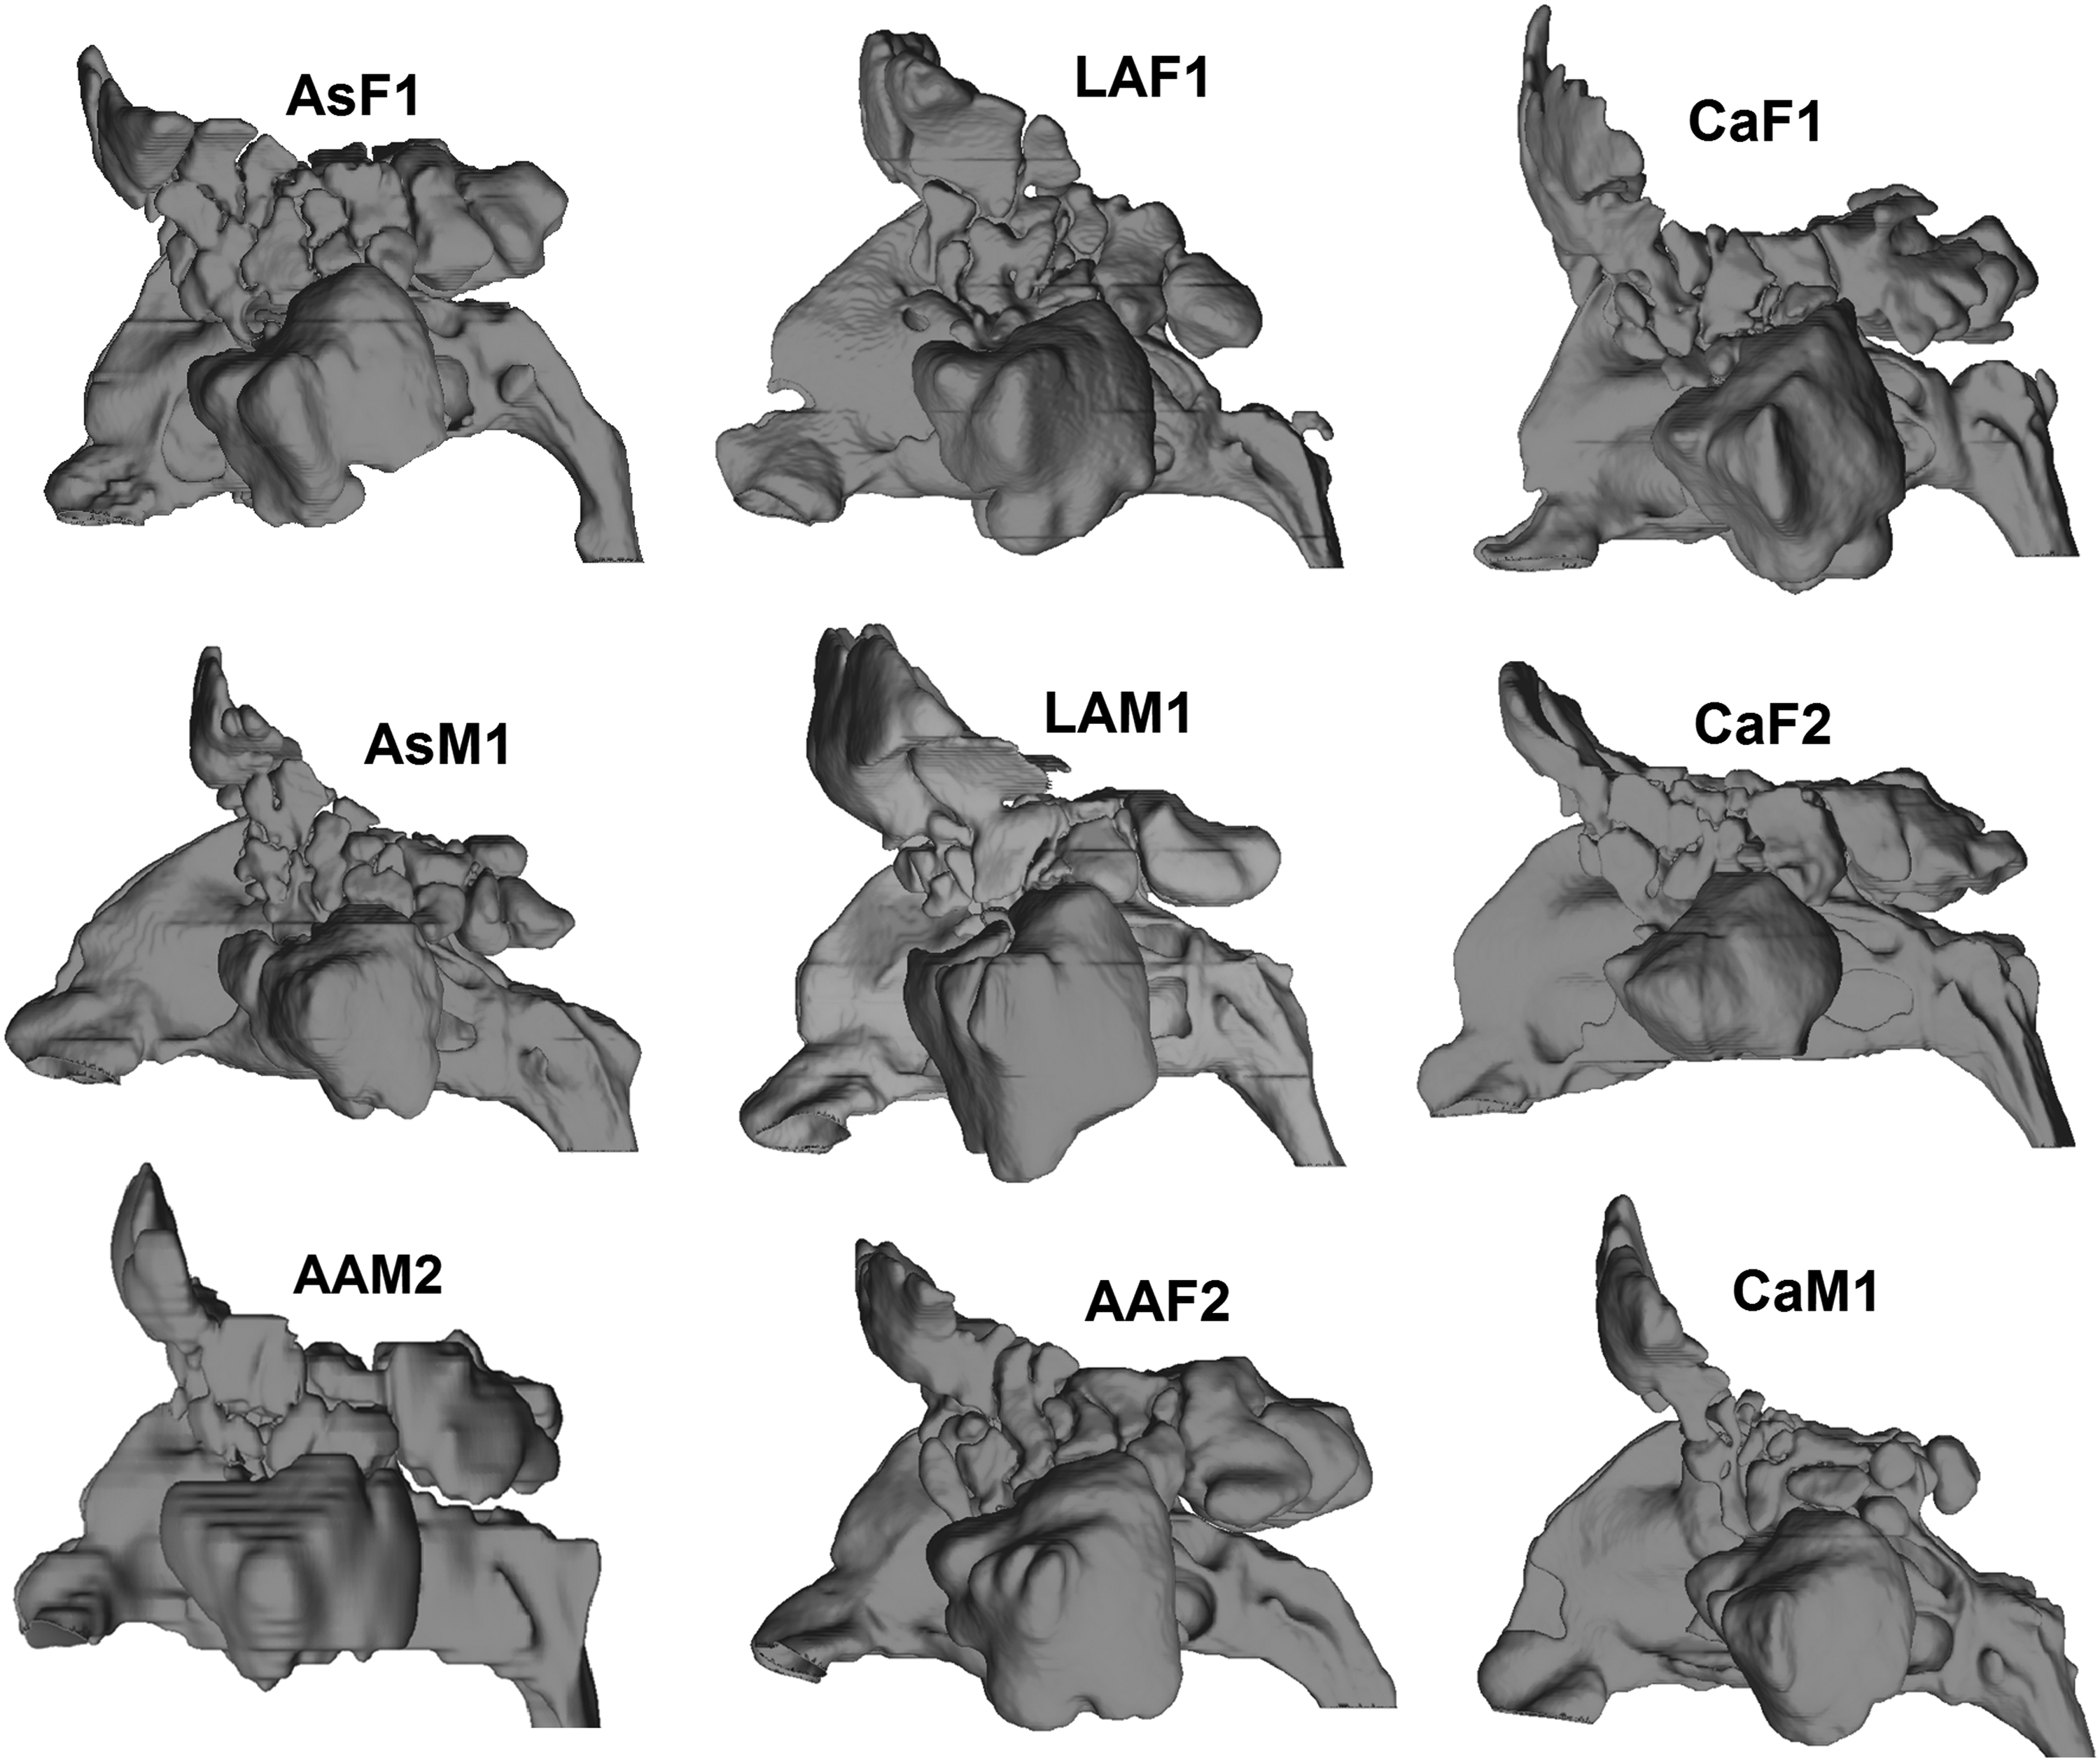
Side view of 3D reconstructed models of the nasal and paranasal sinuses for some subjects. AAF, African American female; AAM, African American male; AsF, Asian female; AsM, Asian male; CaF, Caucasian female; CaM, Caucasian male; LAF, Latin American female; LAM, Latin American male.
Next, each reconstructed 3D sinonasal model was exported in stereolithography file format from Avizo and imported into the CAD and mesh generating software package, ICEM-CFD™ 14.5 (ANSYS, Canonsburg, PA). Planar nostril and outlet surfaces, as well as the left and right maxillary sinuses regions for tracking particle deposition were constructed. Following the creation of these regions, unstructured tetrahedral meshes were generated with approximately 6 million graded elements; mesh density analysis conducted by Frank-Ito et al.(49) found asymptotic behavior for both outlet flow rate and transnasal pressure drop occurred around 4 million cells. This implies that a finer grid of 6 million elements will produce consistent results with those from 4 million unstructured tetrahedral elements.(49)
Mesh quality analysis ensured that all tetrahedral elements had an aspect ratio greater than 0.3, to prevent distorted elements from affecting the accuracy of the numerical simulation. A finer three-layer prism-element with a 0.1 mm prism thickness for each layer was created at the sinonasal airway walls to account for near-wall particle trajectories accurately. The mesh density and structure was chosen to agree with a detailed mesh refinement analysis study conducted by Frank-Ito et al.(49) For this reason, grid convergence test was not done for this particular study.
Numerical simulation
The numerical simulations were done in two phases: the airflow phase, which is carried out by solving the Navier-Stokes equations; and the particle transport phase is solved by tracking dispersed particles through the calculated airflow field. Steady-state, laminar inspiratory airflow was simulated in each mesh using the CFD software package Fluent™ 14.5 (ANSYS, Inc., Canonsburg, PA) under physiologic pressure-driven conditions. In simulating the fluid flow, we assumed that time-dependent variables were constant and all derivatives with respect to time were zero. Fluent™ uses the finite volume method to numerically solve the Navier-Stokes equations; the conservation of mass and momentum for laminar, incompressible flow for steady state are described, respectively, by the equations
where
For the constant inspiratory breathing pressure specified, the present study assumes simulations to be low to moderate breathing rate and the flow regime in the sinonasal cavity to be laminar. The assumption of laminar flow is based on reported results in the literature indicating that flow rates in the cavity during quiet to moderate breathing are typically ≤25 L/min, and are predominately laminar.(50) Second, simulations at negative 15 Pa, presented in Table 1, revealed that only two of the sixteen subjects (AsF2 and AsM2) had flow rate >25 L/min (26.9 and 27.32 L/min, respectively); however, computed Reynolds number at two different cross-sections (anterior-A and posterior-P; see Table 1 and Fig. 2) in the nasal cavity for all sixteen subjects was <700.
A and P; see Figure 2.
Based on simulating negative 15 Pa inspiratory pressure at the outlet.
A 10 mm spray release distance from each side of the nostril surface into the nasal vestibule was specified, representing the largest distance of those used previously by Kimbell et al.(11) that fit comfortably into the nasal vestibule of each subject. Spray was directed laterally, away from the septum and toward the outer portion of the eye as recommended by Benninger et al.(51) However, this recommendation had to be interpreted in the context of the anatomy of the subject such that the actual angle from the nostril center to the outer eye, which aimed the spray directly onto the lateral vestibule wall, was modified slightly to point toward the center of the eye rather than the outer corner.
The particle diameters ranged from 5–50 μm with diameter increments of 5 μm and spray plume angle of 70° simulated were similar to those implemented by Cheng et al.(20) The spray actuation velocity of 1 m/s chosen was within the average velocity range of most commercially available sprays (1–14.7m/s).(52) The choice of 1 m/s spray velocity was determined based on an earlier report by Frank et al.(8) that showed higher nasal spray penetration at 1 m/s compared to 3 m/s and 10 m/s.
The particle dispersed phase of our simulations dealt with simulating particle trajectories into the nasal cavity with inspiratory airflow present. In this phase, dispersed particles exchanged momentum and mass with the airflow phase. Particle trajectories were calculated using the Euler–Lagrange approach via the Lagrangian discrete phase model in Fluent™, assuming unit density, spherical particles, and ignoring particle-to-particle interactions. The Lagrangian reference frame of equations of motion for particles is given by
where FD(u – up) is the drag force per unit particle mass, and
where u is the fluid phase velocity, up is the particle velocity, μ is the molecular viscosity of the fluid, ρ is the fluid density, ρp is the density of the particle, dp is the particle diameter, CD is the drag coefficient, and Re is the relative Reynolds number, which is defined as
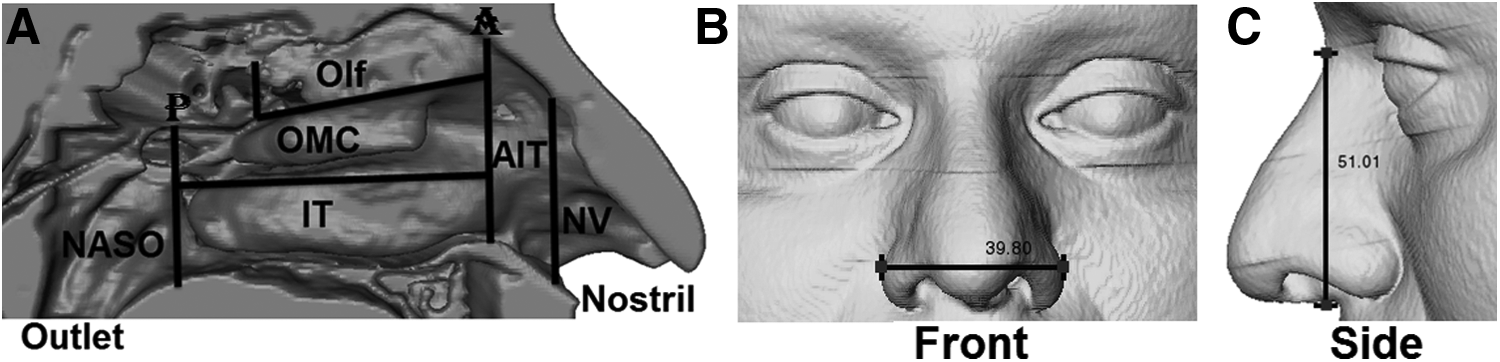
for ρ = 1.204 kg/m3, ρp = 1000 kg/m3, dp = 5–50 μm, and up = 1 m/s. Particle trajectories were tracked until each particle deposited or exited the sinonasal airway passages. Particles that exited the nasal airways at the outlet via the nasopharynx were categorized as “Escaped.” For particles that deposited in the main nasal cavity, SAS™ v9.3 (SAS Institute, Inc., Cary, NC) was used to parse deposited particles into the following localized regions: Nasal vestibule; Anterior inferior turbinate; Osteomeatal complex; Olfactory cleft; Posterior inferior turbinate; and Nasopharynx (Fig. 2A).
The “solid cone” injection type was specified in Fluent™ for the particle streams that emanated from the spray release position, which releases streams at randomly dispersed angles throughout the spray cone region. A total of 10,000 particle streams were released from each nostril, 1000 particles of per size ranging from 5 μm–50 μm with size increments of 5 μm. Particle sensitivity analysis was conducted to determine sensitivity levels of particle deposition fractions in the nasal cavity based on varying numbers of particles released (Fig. 3). The following numbers of particles were released for each particle size: 100, 300, 500, 700, 1000, 1500, 2000, 2500, and 3000. Sensitivity analysis from six (left and right) sides of the nasal cavity in three subjects revealed that for particle sizes between 15 μm–50 μm total nasal deposition was independent of number of particles released (Fig. 3). For 5 μm and 10 μm particle sizes, deposition fractions were slightly more sensitive, since varying numbers of particles released demonstrated asymptotic behavior at two different nasal deposition fractions.
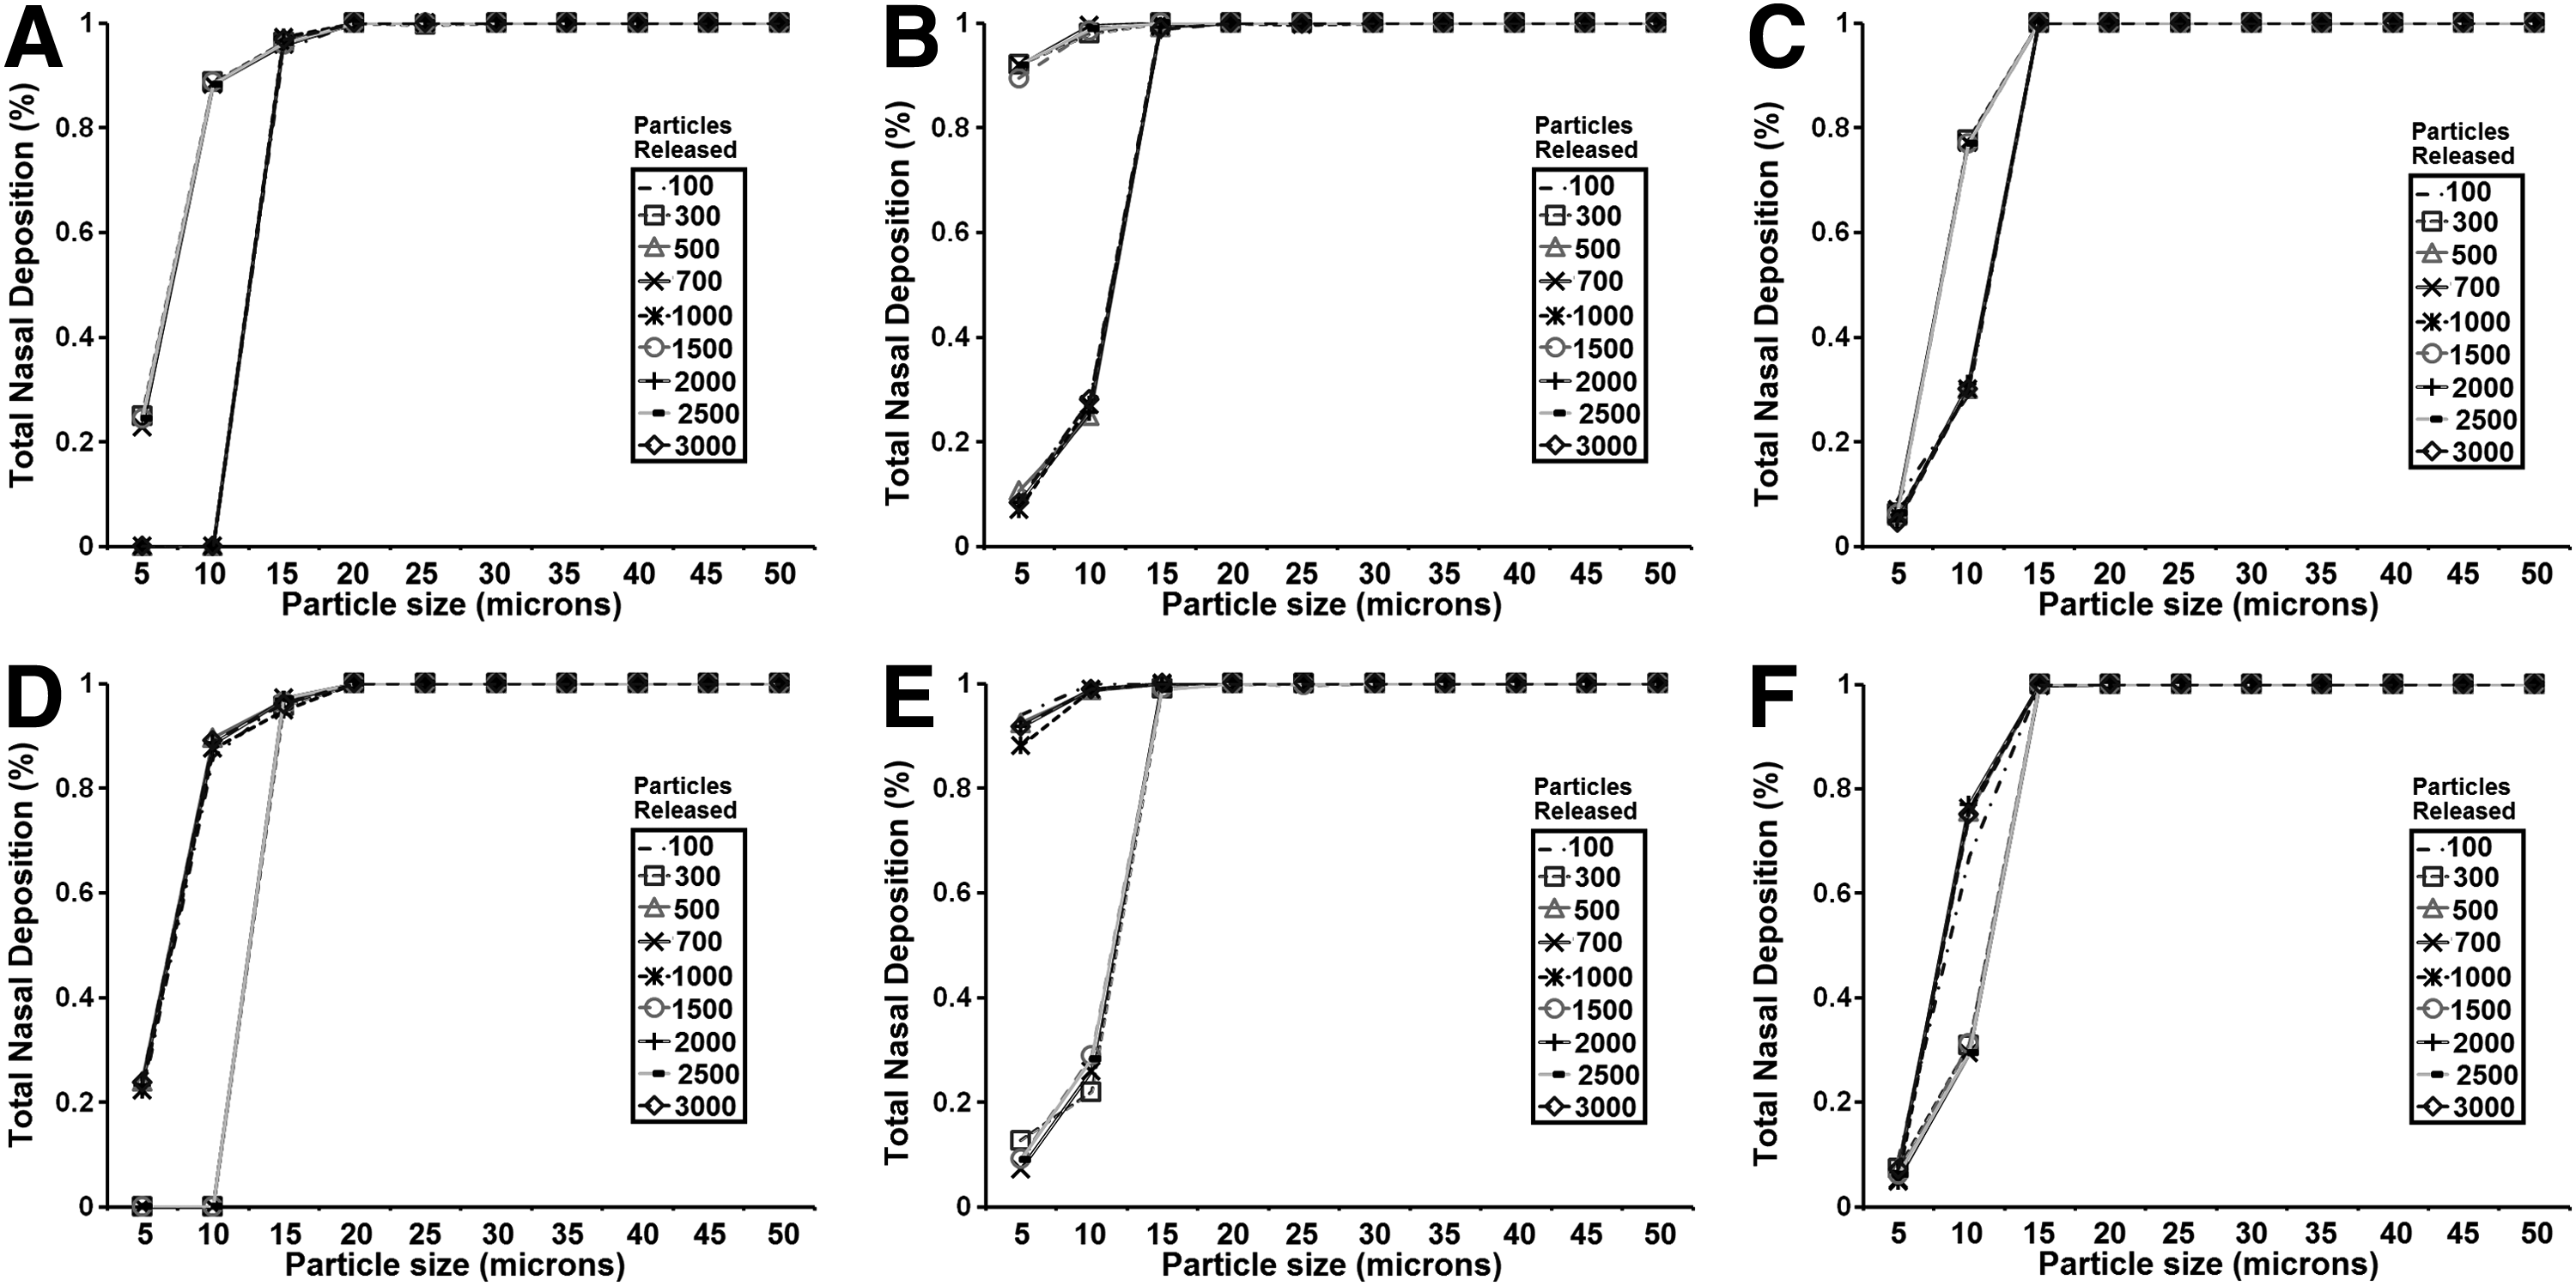
Particle sensitivity analysis based on total number of particles released into the nasal cavity.
Surface area to volume ratio, nasal resistance, and nasal index
The surface area to volume ratio (SA:V) was computed to quantify the magnitude of the sinonasal passage exposed to airflow and particle transport. The formula for calculating SA:V from nostrils to nasopharynx is given as:
where SA and V are the surface area (cm2) and volume (cm3) of the sinonasal cavity, respectively. To assess the patency of each sinonasal cavity, nasal resistance (NR) from nostrils surface (inlet) to choanae (cross-section denoted by P in Fig. 2A) was calculated as follows:
where ΔP is defined as transnasal pressure drop (Pa) from nostrils to choanae, and Q is volume flow rate in the nasal passage (ml/s). The nasal index (NI) is a commonly used measure to determine the shape and size of the human nose. NI is calculated as follows:
To determine the nasal height and width of each subject, the facial soft tissues were reconstructed from each subject's CT scan and viewed in both frontal and profile view to identify anatomic landmarks. The nasal height was measured from the nasion to the subnasale in profile, and the nasal width measured at the widest point of the ala in frontal view (Fig. 2B and C).
Analysis of deposition pattern
Particle deposition fractions (PDF) for each particle size that deposited in targeted regions of interest will be computed as
where D represents the number of particles that deposited in a given region for each particle size, and T is the total number of particles released into the sinonasal cavity for each particle size.
To analyze deposition patterns, PDF will be clustered into four distinct deposition categories:
• C1 for PDF between 3% and 10%, • C2 for PDF between 11% and 30%, • C3 for PDF between 31% and 50%, • C4 for PDF between 51% and 100%,
where C1 denotes very low deposition; C2 denotes low to moderate deposition; C3 is moderate to high deposition; and very high deposition as C4. The rationale for clustering into four deposition categories is our attempt to account for unusually large variability within ethnic descents due to our small sample size (16 subjects in all, 4 subjects from each ethnic descent), in addition to making it easier for us to have well-defined bounds that describe categories of deposition. Regions with ≤2% deposition are considered negligible and are not included in our analysis since such tiny deposition may be too small to make any meaningful clinical impact. For those particles that escaped (bypassed the nasal cavity via the outlet), our analysis will not include outlet PDF that are ≥60% since that indicates that most of the particles were not retained in the nasal and sinus cavities, our target regions of interest.
Deposition patterns will be characterized for (1) Ethnic descent and (2) Ethnic descent and gender. Ethnic descent: deposition pattern will be considered similar if subjects of the same ethnic descent have the same or adjacent deposition categories; for example, “C1, C1, C1, C1” or “C1, C1, C1, C2” but not “C1, C1, C2, C3”. Ethnic descent and Gender: deposition pattern will be considered similar if subjects of the same ethnic descent and gender have the same or adjacent deposition categories; for example, “C1, C1” or “C1, C2” but not “C1, C3”.
Results
Surface area to volume ratio
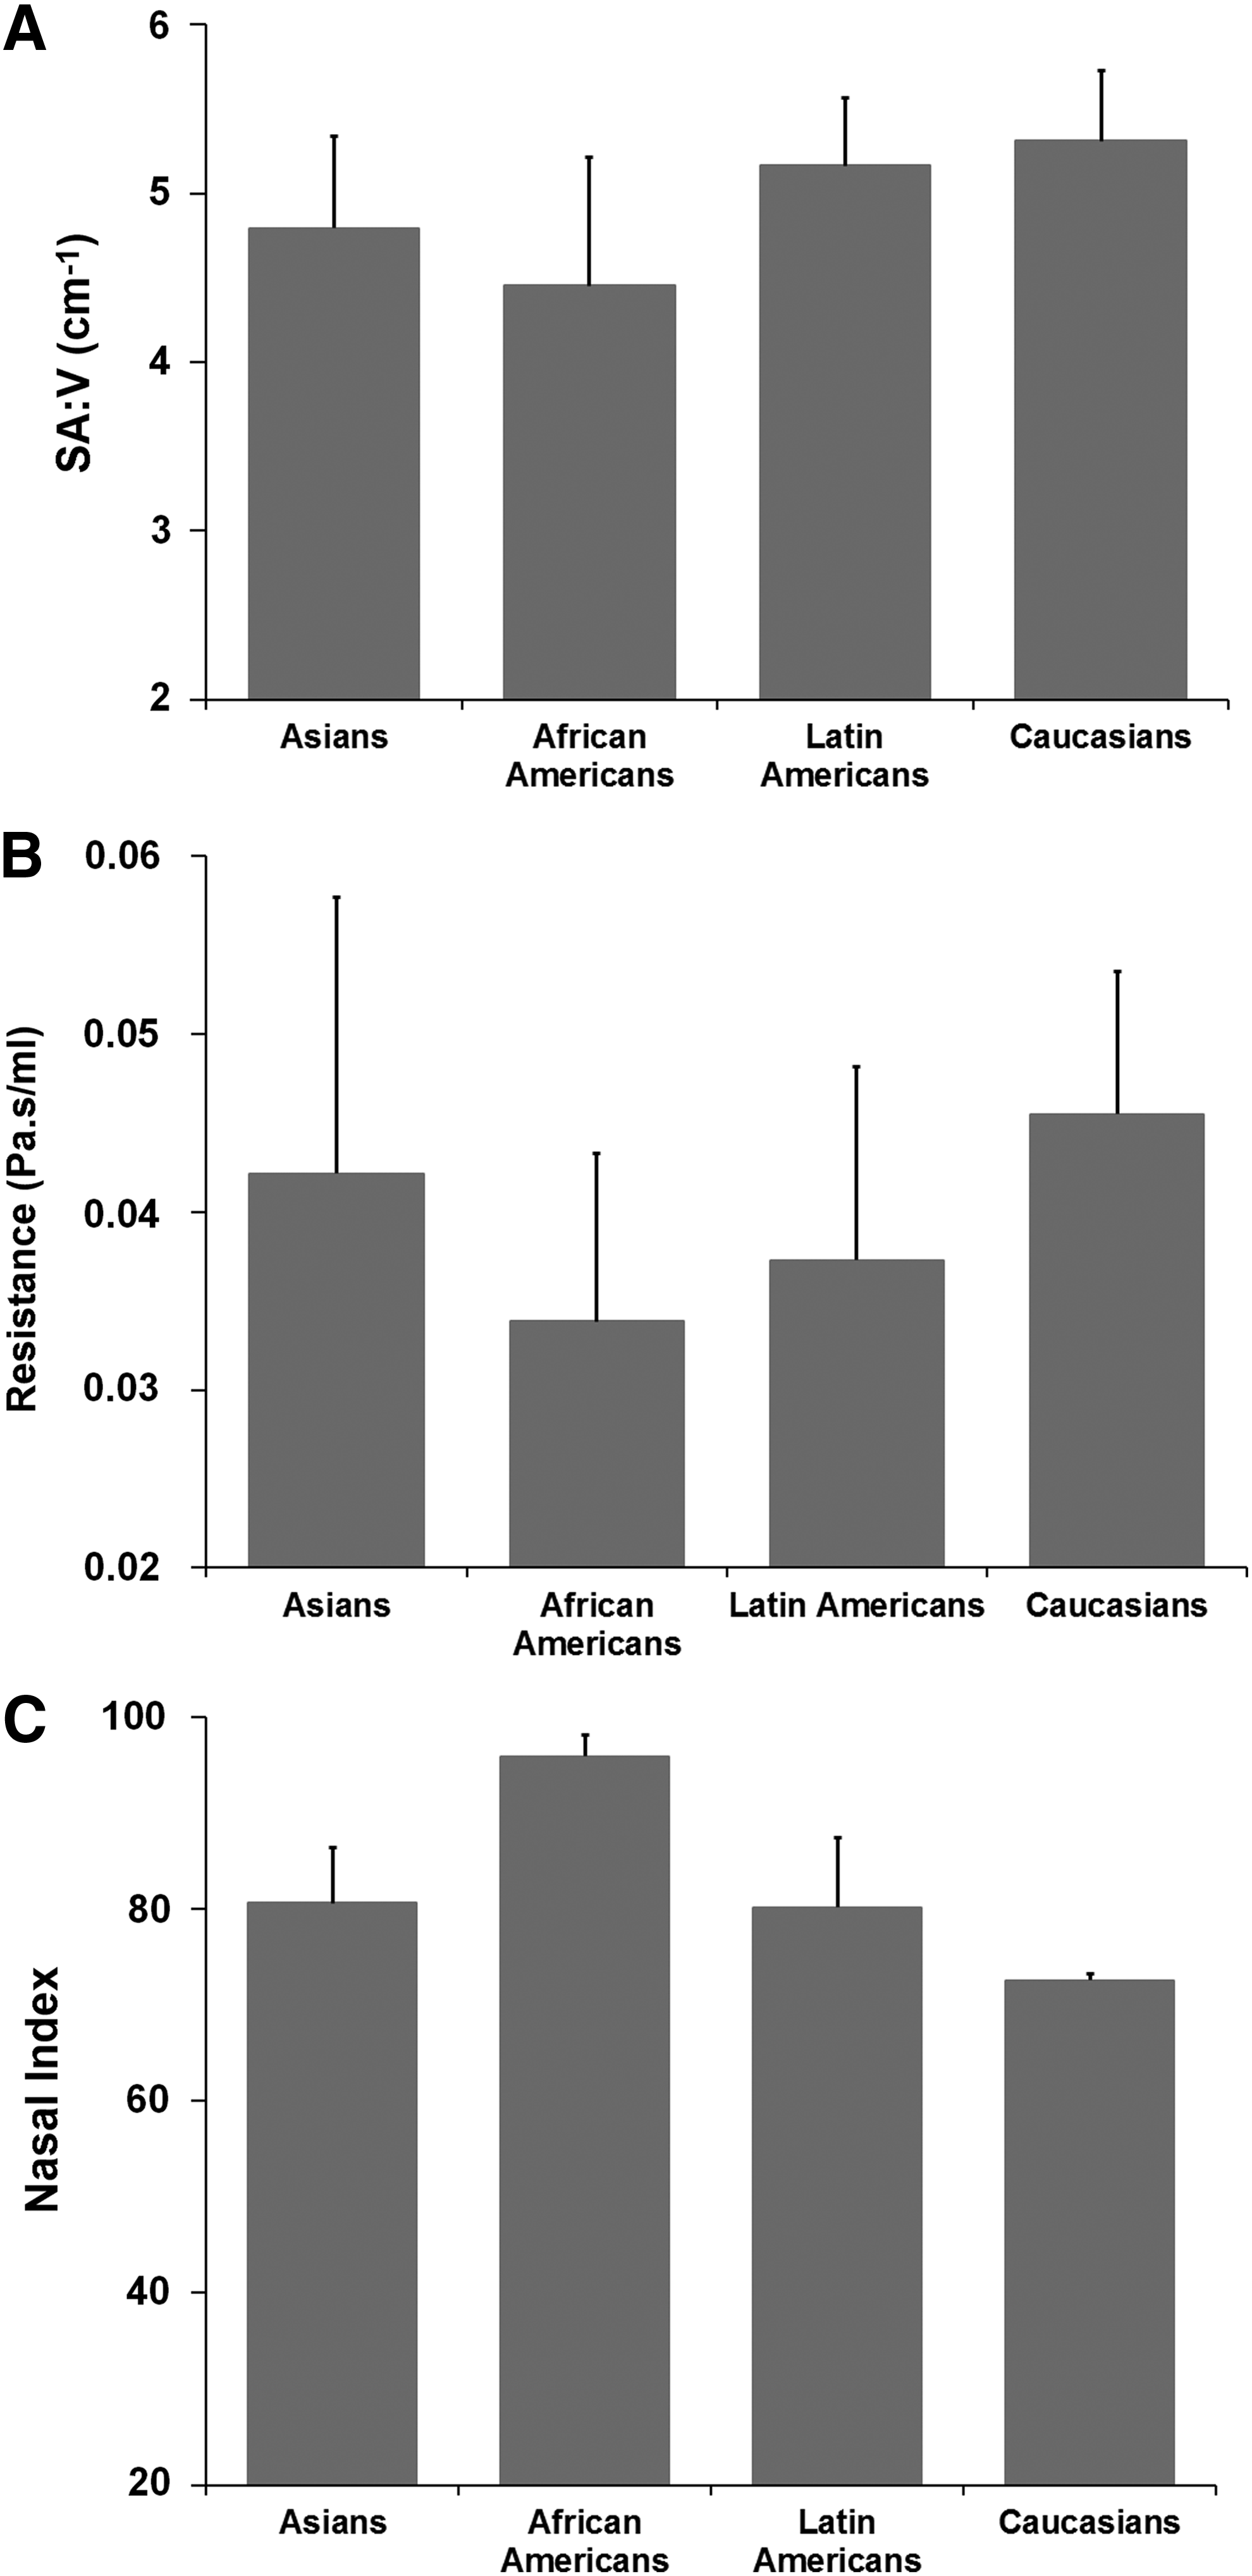
For each ethnic decent, mean (±standard deviation) SA:V are presented in Figure 4A. On average, Caucasians (5.31 ± 0.42 cm−1) had the largest SA:V, followed by Latin Americans (5.16 ± 0.40 cm−1), Asians (4.79 ± 0.55 cm−1) and African Americans (4.45 ± 0.76 cm−1), respectively.
Nasal resistance
Simulation results for computed mean (±standard deviation) nasal resistance are showed in Figure 4B; the bar plot indicated that the ethnicity with the lowest NR, on average is African Americans (0.034 ± 0.009 Pa.s/mL), next to Latin Americans (0.037 ± 0.011 Pa.s/mL). Caucasians (0.046 ± 0.008 Pa.s/mL) and Asians (0.042 ± 0.016 Pa.s/mL) had the highest mean NR. However, error bars showed that inter-subject variability in resistance within each group was considerably large for every ethnicity.
Nasal index
Figure 4C shows mean (±standard deviation) nasal index across all four ethnic groups. As expected, results confirmed that African Americans had the highest NI, 95.90 ± 2.22. In addition, NI for Asians and Latin Americans were 80.65 ± 5.82 and 80.21 ± 7.19, respectively, and Caucasians had the lowest NI, 72.57 ± 0.66.
Particle deposition pattern
Results of computed spray deposition fractions (PDF) across all target regions for all subjects are shown in Table 2 for particle sizes 5 μm, 10 μm, 25 μm, 30 μm, 45 μm, and 50 μm. CFD particle deposition simulation results showed that no particles deposited into the maxillary sinuses in all 16 subjects. Total nasal PDF for all subjects are presented in Figure 5. Every Asian subject had particles deposited in their nasal cavity for each particle size; Asians were the only group with a non-zero deposition in the cavity across every particle size. Analysis of deposition patterns clustered into four categories (C1–C4) to demonstrate regions with consistent/similar deposition behavior within each ethnic race, and genders in each ethnic race are presented in Table 3.
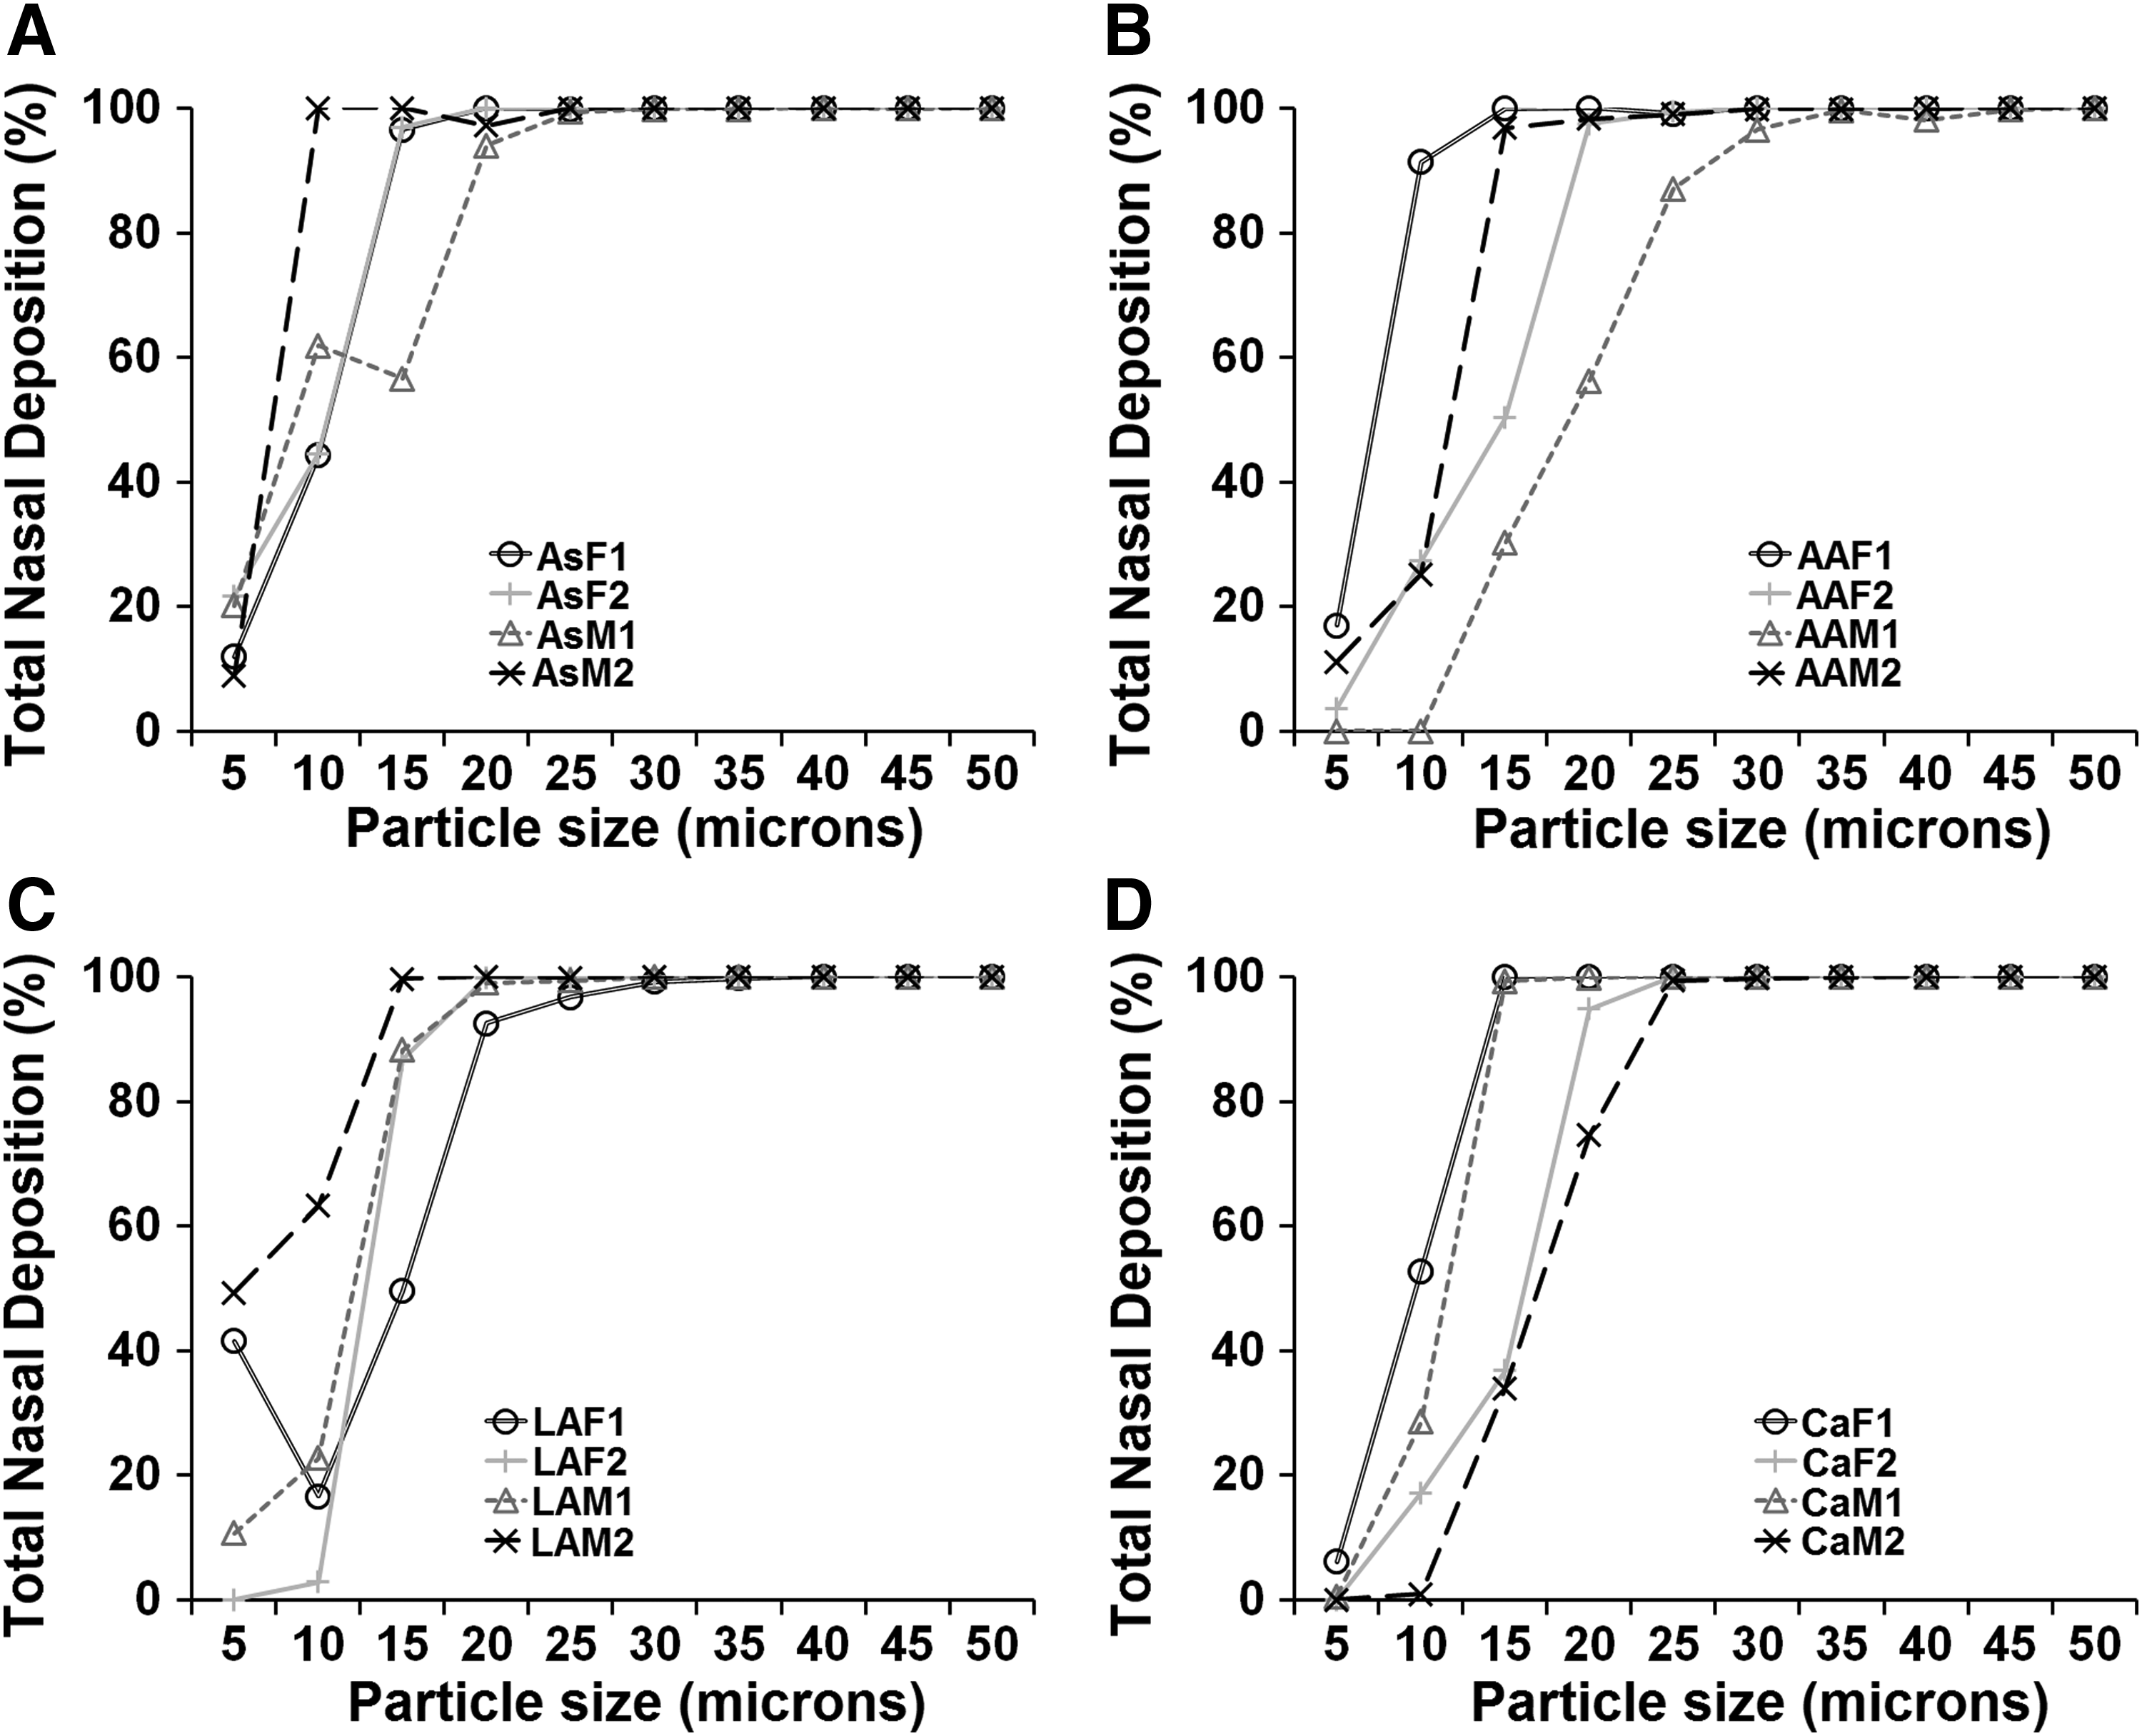
Total nasal particle deposition fractions in the sinonasal cavity across ethnic groups for all particle diameters.
PDF was computed using Equation 9.
Regions: AIT, anterior inferior turbinate; IT, posterior inferior turbinate; NASO, nasopharynx; NV, nasal vestibule; OLF, olfactory cleft; OMC, osteomeatal complex; outlet, escaped.
Ethnic group and gender: AAF, African American female; AAM, African American male; AsF, Asian female; AsM, Asian male; CaF, Caucasian female; CaM, Caucasian male; LAF, Latin American female; LAM, Latin American male.
C1 = very low deposition; C2 = low to moderate deposition; C3 = moderate to high deposition; C4 = very high deposition.
Subjects with no C1–C4 classification associated with a particular region had ≤2% deposition into that region (which we considered negligible in our analysis). For “Outlet” region, subjects with particle deposition fraction ≥60% will have no C1–C4 classification since that indicates that most of the particles were not retained in the nasal and sinus cavities.
Regions: AIT, anterior inferior turbinate; IT, posterior inferior turbinate; NASO, nasopharynx; NV, nasal vestibule; OLF, olfactory cleft; OMC, osteomeatal complex; outlet, escaped.
Ethnic group and gender: AAF, African American female; AAM, African American male; AsF, Asian female; AsM, Asian male; CaF, Caucasian female; CaM, Caucasian male; LAF, Latin American female; LAM, Latin American male.
Regional deposition count within ethnic descent
Total number of localized regions with computed depositions (as classified in Table 3) for all particle sizes were aggregated across each ethnic/racial decent and are displayed in Figure 6. Recall that particle depositions into the following regions were tracked: Nasal vestibule; Anterior inferior turbinate; Osteomeatal complex; Olfactory cleft; Posterior inferior turbinate; and Nasopharynx. For smaller particles with diameters ranging from 5 μm to 15 μm, Asians had the most localized regions with deposition, while Caucasians had the least localized regions with deposition. For larger particle diameters ranging from 20 μm to 50 μm, the ethnic decent with the most localized regions with deposition was African American, and the ethnic decent with the least localized regions with deposition was Caucasian.
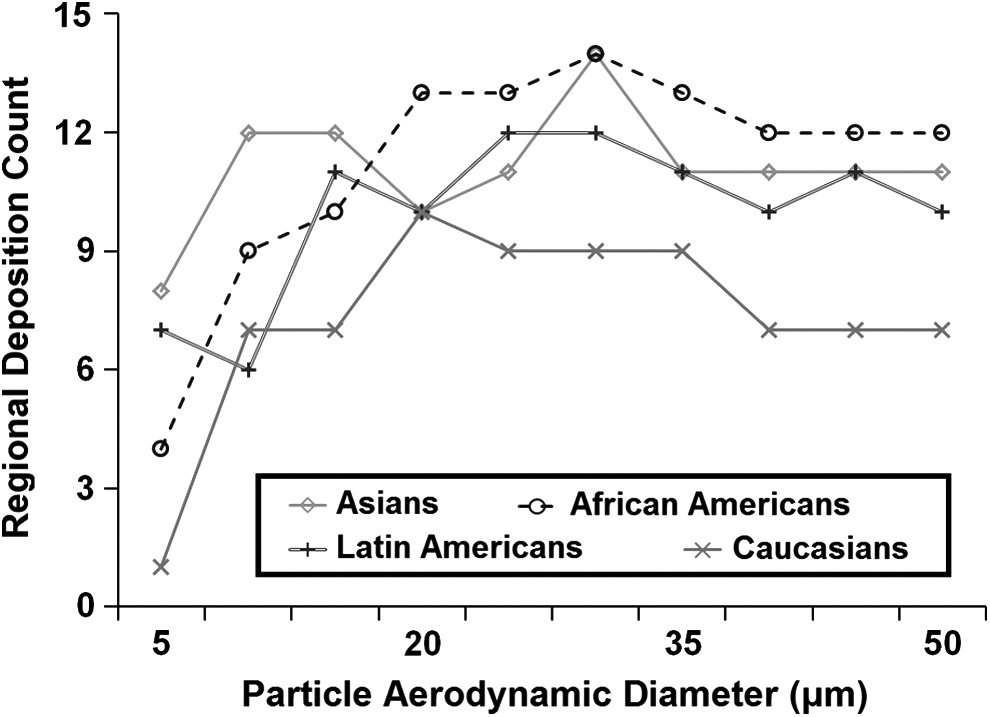
Total number of localized regions with particle deposition across ethnic groups for all particle diameters.
Consistent deposition frequency within ethnic descent
The frequencies of consistent particle deposition pattern in the main nasal cavities within each ethnic decent across all target regions are presented in Figure 7A. The ethnic descent with the most agreement in particle deposition behavior into the main nasal cavities were Asians, followed by Latin Americans and African Americans, respectively. Particle deposition patterns in the nasal cavities were largely inconsistent among ethnic decedents of Caucasian origin for all 10 particle sizes simulated. Asian subjects had similar deposition behaviors in the nasal vestibule and the anterior inferior turbinate regions; consistent deposition pattern within this group was only in the nasal vestibule for particle sizes 20 μm, 25 μm, and 35 μm, and in the nasal vestibule as well as the anterior inferior turbinate regions for larger particle sizes (40 μm, 45 μm, and 50 μm).
Frequency distribution plot of the number of consistent (similar) depostion patterns for
The OMC region is the only region African American subjects had agreement in deposition behavior, while Latin American subjects demonstrated similar deposition in the nasal vestibule for 35 μm particles and in the anterior inferior turbinate for 45 μm and 50 μm particles (Table 3). The frequency of consistent deposition pattern within ethnic descent increased as particle size got larger: there was no consistent deposition pattern between 5 and 15 μm; five occurrences of consistent deposition pattern between 20 and 35 μm; and nine occurrences of consistent deposition pattern between 40 and 50 μm (Table 3).
Consistent deposition frequency within ethnic descent gender
Asian female subjects had the most consistent particle deposition behavior (21 occurrences), followed by Latin American males (19 occurrences) and Asian males (18 occurrences), respectively (Fig. 7B). Agreement in deposition behavior for Asian males, Asian females, Latin American males, and Latin American females were mainly in these regions: anterior inferior turbinate; nasal vestibule; and OMC (Table 3). Caucasian females had the least consistent deposition pattern (2 occurrences), followed by African-American males (7 occurrences), and Caucasian males (6 occurrences), respectively. Across ethnic descent and gender, agreement in deposition pattern was highest in the OMC region for particle between 5 and 15 μm. As particle size increased from 20 to 35 μm, the region with the highest agreement in deposition pattern switched to anterior inferior turbinate; and for particles sizes between 40 and 50 μm, the nasal vestibule and anterior inferior turbinate regions had the most agreement in deposition behavior.
Discussion
Of all four groups studied, our preliminary findings demonstrate that on average, Caucasians and African Americans have the largest and smallest SA:V, respectively. Both SA:V and NI results computed in this study agreed with reports on climate-related variation in human nose, postulating that individuals that evolved from colder and drier climates (e.g., Caucasians) have greater SA:V and smaller NI than those from warmer and more humid climates (e.g., African Americans).(37,44,53) In addition, our preliminary reports revealed that Latin Americans and Caucasians have comparable SA:V, and the NI for Asians and Latin Americans were also similar.
Although average NR in the present study for African Americans and Caucasians were lowest and highest, respectively, among all the groups, inter-subject variability in NR within each group was noticeably large (error bars in Fig. 4B). The large inter-subject variability within each group and for every ethnic/racial groups observed in this study may be the reason why other studies have reported no significant differences in nasal airway resistance between African descents and Caucasians.(54–56) The nasal resistance of African descents from Nigeria was measure by Babatola(54) and were found to be similar to those of Caucasians and Asians. Similar conclusions were reached by both Calhoun et al.(55) and Ohki et al.(56) In their 1990 study, Calhoun et al.(55) measured the external nasal shape and size, as well as nasal resistance in 52 African descents, 56 Caucasians, and 22 Latin American descents. While their study found significant difference in the external nasal shape and size between African descents and both ethnic groups, nasal resistance was not significantly different among all three ethnic descents.
Although Ohki et al.(56) measurement of nasal airflow resistance using rhinomanometry showed that African descents (n = 17) had a lower mean nasal resistance (0.129 Pa.s/cm3) than Caucasian descents (n = 24; 0.184 Pa.s/cm3), this difference was not statistically significant. In contrast to the above studies, Canbay and Bhatia(57) used rhinomanometry to compared nasal resistance in 42 Caucasians and 32 African Americans; not only that their study found lower mean nasal resistance in African Americans than Caucasians, the differences in values were reported to be statistically significant. Zhu et al.(58) used CFD methodology to compare airflow pattern among three subjects from different ethnic descents (Caucasian, Chinese, and Indian), and they concluded that airflow behavior in the main nasal cavity was different between the Caucasian male subject and the Indian male subject. However, statistical conclusions were not made since only three subjects were simulated.
To assess consistency of particle deposition patterns within each ethnic group, particle deposition fractions were categorized into four distinct categories (C1–C4), as defined in the Methods Section. As the focus of this study is exploratory data mining, it is much easier to analyze deposition trends (or patterns) within each ethnicity since our sample size is small and therefore lacks statistical power to make any statistical conclusions. The range of particle deposition fractions (PDF) for each category was chosen arbitrarily, but with a general idea of what deposition fractions should be classified as: very low deposition (C1); low to moderate deposition (C2); moderate to high deposition (C3); and very high deposition (C4).
Results presented in this preliminary study of all 16 subjects from four distinct ethnicities showed that no particle deposition was reported in the maxillary sinuses despite substantial OMC deposition. This demonstrates that it is highly unlikely for particles to penetrate the maxillary sinuses through the natural ostia. The location of the maxillary sinuses, coupled with the size and position of the natural ostia, make particle penetration into the maxillary sinuses difficult regardless of particle aerodynamic diameter. Deposition of particles into the other regions revealed that Asians had the most cumulative regions with small particle depositions (5 μm–15 μm), while African Americans had the most regions with large particle depositions (20 μm–50 μm). With exception of 10 μm particles, Caucasians had the least cumulative regions with deposition across all particle aerodynamic diameters.
The lack of a consistent particle deposition pattern in the main nasal cavities of both Caucasian female subjects in Tables 2 and 3 is likely due to variability in their nasal morphology, particularly around the nasal vestibule. The shape and form of the nasal vestibule in CaF1 was very different from CaF2 (Fig. 1). In addition to Caucasians, we observed that African Americans also demonstrated low occurrences of consistent deposition behavior in their nasal cavities (Tables 2 and 3). As evident from Table 2, African Americans had high inter-individual variability in nasal particle deposition around the nasal vestibule (NV in Table 2 and 3). However, the variability in nasal morphology around the nasal vestibule appears to be small for those subjects of the same ethnic descent who had higher occurrences of agreement in particle deposition behaviors.
The role of nasal morphology due to race and ethnic variations on the transport of sprayed particles has not been well described. One of the few studies to investigate the effects of ethnic origin on particle deposition in the nose was done by Bennett and Zeman,(10) where it was reported that fine particles consisting of 1 μm–2 μm deposited less in the nasal cavity of African-Americans than in Caucasians.(10)
The present findings showed that for particles ranging from 5 μm–50 μm, African Americans had better particle distribution (coverage) into more regions of the nasal passage than Caucasians. However, the methodology used in assessing nasal deposition efficiency in Bennett and Zeman(10) has substantial differences from the computational methods presented in this study.
In their 2007 publication, Kimbell et al.(11) reported 100% deposition in the nasal cavity for 20 μm and 50 μm particles sprayed at 10 mm release distance from the nostril in a Caucasian healthy male, the results presented here are mostly in agreement with Kimbell et al.(11) since 100% deposition was reported for both Caucasian males at 50 μm particles and one Caucasian male had 100% deposition at 20 μm. In addition, Inthavong et al.(15) reported a slightly less than 100% particle deposition in regions “Zone 1” and “Zone 2” (similar to regions NV and AIT in this study) in an Asian healthy male at 50 μm particle size in a device with spray plume angle of 80°. Their results are comparable with those presented here since 88% and 90% combined particle deposition fractions into NV and AIT were calculated for the respective Asian males at 50 μm particle size in a device with spray plume angle of 70°.
Conclusion
In this preliminary study, we investigated the relationship between nasal morphology and particle deposition pattern in the nasal cavities in four ethnic groups using CFD techniques. In agreement with previous studies, our results showed that Caucasians and Latin Americans have greater surface area-to-volume ratio than Asians and African Americans, while the nasal index of African Americans is greatest. Although average nasal resistance for African Americans was lowest, followed by Latin Americans, Asians, and Caucasians, inter-subject variability in resistance within each group was considerably large. This may be the reason why several studies in the literature have reported no statistical significant difference in nasal resistance across ethnic groups.
In addition, our findings demonstrated that Asians and Latin Americans had greater similarities in deposition behavior than African Americans and Caucasians; in our opinion, African Americans and Caucasians may have had more variability in deposition pattern due to the differences in morphology of their nasal vestibules. However, it is not clear if both groups have more variability in their nasal vestibule or this study randomly selected subjects of the same race who had more nasal variability. The findings in this study are preliminary. An additional study with a larger cohort within each ethnicity is necessary to adequately make statistical conclusions.
Footnotes
Acknowledgment
The authors would like to thank ANSYS, Drs. Paolo Maccarini (Duke University) and Murali Kadiramangalam (ANSYS Global Academic Program Director) for support and strategic donation. Research reported in this publication was supported by the National Heart, Lung, and Blood Institute of the National Centers of Health under award number R01HL122154. The content is solely the responsibility of the authors and does not necessarily represent the official views of the National Institutes of Health.
Author Disclosure Statement
There is no conflict of interest and no financial disclosures by any of the authors.