
Abstract
Abstract
Background:
Computational fluid dynamics (CFD) provides a powerful tool for developing new high-efficiency aerosol delivery strategies, such as nose-to-lung (N2L) aerosol administration to infants and children using correctly sized aerosols. The objective of this study was to establish numerically efficient CFD solution methods and guidelines for simulating N2L aerosol administration to an infant based on comparisons with concurrent in vitro experiments.
Materials and Methods:
N2L administration of a micrometer-sized aerosol (mass median aerodynamic diameter [MMAD] = 1.4 μm) was evaluated using concurrent CFD simulations and in vitro experiments. Aerosol transport and deposition was assessed in a new nasal airway geometry of a 6-month-old infant with a streamlined nasal cannula interface, which was constructed as a CFD mesh and three-dimensionally printed to form an identical physical prototype. CFD meshes explored were a conventional tetrahedral approach with near-wall (NW) prism elements and a new polyhedral mesh style with an equally refined NW layer. The presence of turbulence in the model was evaluated using a highly efficient low-Reynolds number (LRN) k-ω turbulence model, with previously established NW corrections that accounted for anisotropic wall-normal turbulence as well as improved NW velocity interpolations and hydrodynamic particle damping.
Results:
Use of the new polyhedral mesh was found to improve numerical efficiency by providing more rapid convergence and requiring fewer control volumes. Turbulent flow was found in the nasal geometry, generated by the inlet jets from the nasal cannula interface. However, due to the small particle size, turbulent dispersion was shown to have little effect on deposition. Good agreement was established between the CFD predictions using the numerically efficient LRN k-ω model with appropriate NW corrections and in vitro deposition data. Aerosol transmission efficiencies through the delivery tube, nasal cannula, and infant nasal model, based on experimental and CFD predictions, were 93.0% and 91.5%, respectively.
Conclusions:
A numerically efficient CFD approach was established to develop transnasal aerosol administration to infants and children. Small particle aerosols with aerodynamic diameters of ∼1.5 μm were confirmed to have low inertial depositional loss, and have low deposition from turbulent dispersion, making them ideal for high-efficiency lung delivery through an infant nasal cannula interface.
Introduction
N
Studies also report that an airtight seal is required between the facemask and patient face for optimal aerosol delivery,(4,5) which is difficult to achieve. Furthermore, there is evidence in the literature that nasal cannula systems may provide improved lung delivery efficiency compared with facemasks in infants and children.(6,7) It is expected that using small diameter particles (mass median aerodynamic diameter [MMAD] <2 μm) for N2L aerosol administration leads to high-efficiency lung delivery, as the likelihood of impaction deposition is reduced.(8,9)
Computational fluid dynamics (CFD) provides a valuable research tool for developing respiratory drug delivery strategies, such as N2L aerosol administration, and associated devices.(10) CFD simulation divides the region of interest, such as an airway model, into small control volumes and numerically solves the equations governing mass, momentum, and energy transport within these control volumes. As turbulence adds structured chaos to the flow field, turbulent effects must be modeled and approximated. Aerosol transport is evaluated either coupled with, or from knowledge of, the flow field. The result is full resolution of the flow field and particle locations within three-dimensional (3D) realistic geometries over the time period of interest.
CFD results are most effective when they are validated with experimental data and used in conjunction with concurrent in vitro experiments. In a concurrent analysis approach,(11–17) in vitro experiments are used to provide initial particle size distributions, benchmark deposition data, and other necessary model inputs and validation points. Once validated with the in vitro and possibly in vivo experimental data,(18,19) the CFD model is then available to optimize the drug delivery strategy or device.
To achieve validation of CFD results with experimental data, it is imperative that sound methodology is used in the numerical model in the areas of geometry development, mesh generation, submodel selection, and solution parameters. Bass and Longest(20) recently developed a set of meshing and solution guidelines for application of the low-Reynolds Number (LRN) k-ω turbulence model when simulating microparticle deposition under conditions similar to the upper airways. This previous study presented an excellent match to both experimental and Large Eddy Simulation (LES) deposition data across a range of particle sizes and flow conditions in a representative 90°-bend geometry.
However, it is important to confirm the same meshing and solution guidelines are applicable to a more complex model of the infant nasal cavity. For example, it is currently an open research question if turbulence should be included in simulations of nasal particle deposition. This is further complicated by the presence of the nasal cannula interface, which forms two jets of airflow entering the nasal vestibule and progressing through the narrow nasal valve.
The primary objective of this study is to establish numerically efficient CFD solution methods and guidelines for simulating N2L aerosol administration to an infant based on comparisons with concurrent in vitro experiments. Previously developed meshing and solution parameters are applied to the CFD model, with additional considerations specific to infant nasal airways. Specifically, the commonly used tetrahedral and new polyhedral mesh types are compared, as well as laminar and turbulent flow conditions and monodisperse versus polydisperse aerosol approximations. To validate the CFD predictions, in vitro experiments are reported in a nasal airway geometry with a streamlined(21) nasal cannula interface. As a secondary objective, high-efficiency N2L aerosol delivery is demonstrated in an infant airway model using both CFD and in vitro approaches, which is enabled by the use of correctly sized micrometer particles.
Materials and Methods
Nasal model development from computed tomography scans
Pre-existing medically necessary computed tomography (CT) scans of nasal airways from 3- to 6-month-old infants were reviewed for scan quality and completeness under an Institutional Review Board-approved protocol. To develop an infant model with a targeted age of ∼6 months, the selected scan was of a 20-week-old (5 months) male with a crown-to-heel length and weight of 68.2 cm and 7.7 kg, respectively. The patient height and weight both fell within the 25th and 75th percentiles for a 6-month-old infant.(22) Therefore, it was expected that the model was representative of the 6 month target age,(9) despite being ∼1 month younger. Of the available scans, the selected scan was chosen because the infant's mouth was closed, it was complete from the nostrils through the larynx, and the slice resolution was sufficiently small at 1 mm. The scan was reviewed by a pediatric otolaryngologist and found to be free of nasal abnormalities.
The CT scan was segmented with the Mimics software suite (Materialise, Leuven, Belgium) to generate a 3D model of the infant nasal cavity from the 2D image slices. The process of segmentation involves selecting pixels in the CT scan, which combined with the slice thickness become voxels for each slice. The tools and capabilities provided by Mimics allow users to speed up the process by selecting threshold regions of pixels that fall within a grayscale range that are considered internal airways (i.e., not bone or soft tissue). Mimics also automatically smooths the block-shaped voxels to provide a realistic representation of physical anatomy. Once image segmentation is complete, the 3D model is transferred to 3matic (Materialise), where additional postprocessing steps are performed, such as wrapping, stereolithography (STL) mesh quality improvements, and surface triangle reduction.
Surface wrapping covers the initial surface with a second STL surface that removes any nonmanifold faces (where three or more faces share a single edge), free edges (holes), or sliver faces, thereby removing any erroneous triangles from the surface. The STL surface is then converted to CAD data using the skin surface capabilities available in SpaceClaim (ANSYS, Inc., Canonsburg, PA). This process involves manually creating polygonal patches (∼50) that are wrapped to conform to the faceted surface. Therefore, instead of the nasal cavity being defined by thousands of STL triangles, it is represented by ∼50 CAD format surfaces. This step makes it possible to import the model into third-party CAD software.
In SolidWorks (Dassault Systèmes, Paris, France), the nasal cavity was further modified to generate a suitable experimental model that can be produced with 3D printing. This included adding supports for locating the streamlined nasal cannula and a connection to an outlet filter to measure recovered lung dose. Design considerations were also made to simplify the 3D printing of the model. The model was separated into three regions that approximate the anterior nose, middle passage, and nasopharynx, as this makes it easier to clean support material from inside the nasal cavity and provides insight into the regional deposition within the nasal model. The nasopharynx part of the model was also split in half to remove support material from around the glottis and then sealed with locating pins and epoxy.
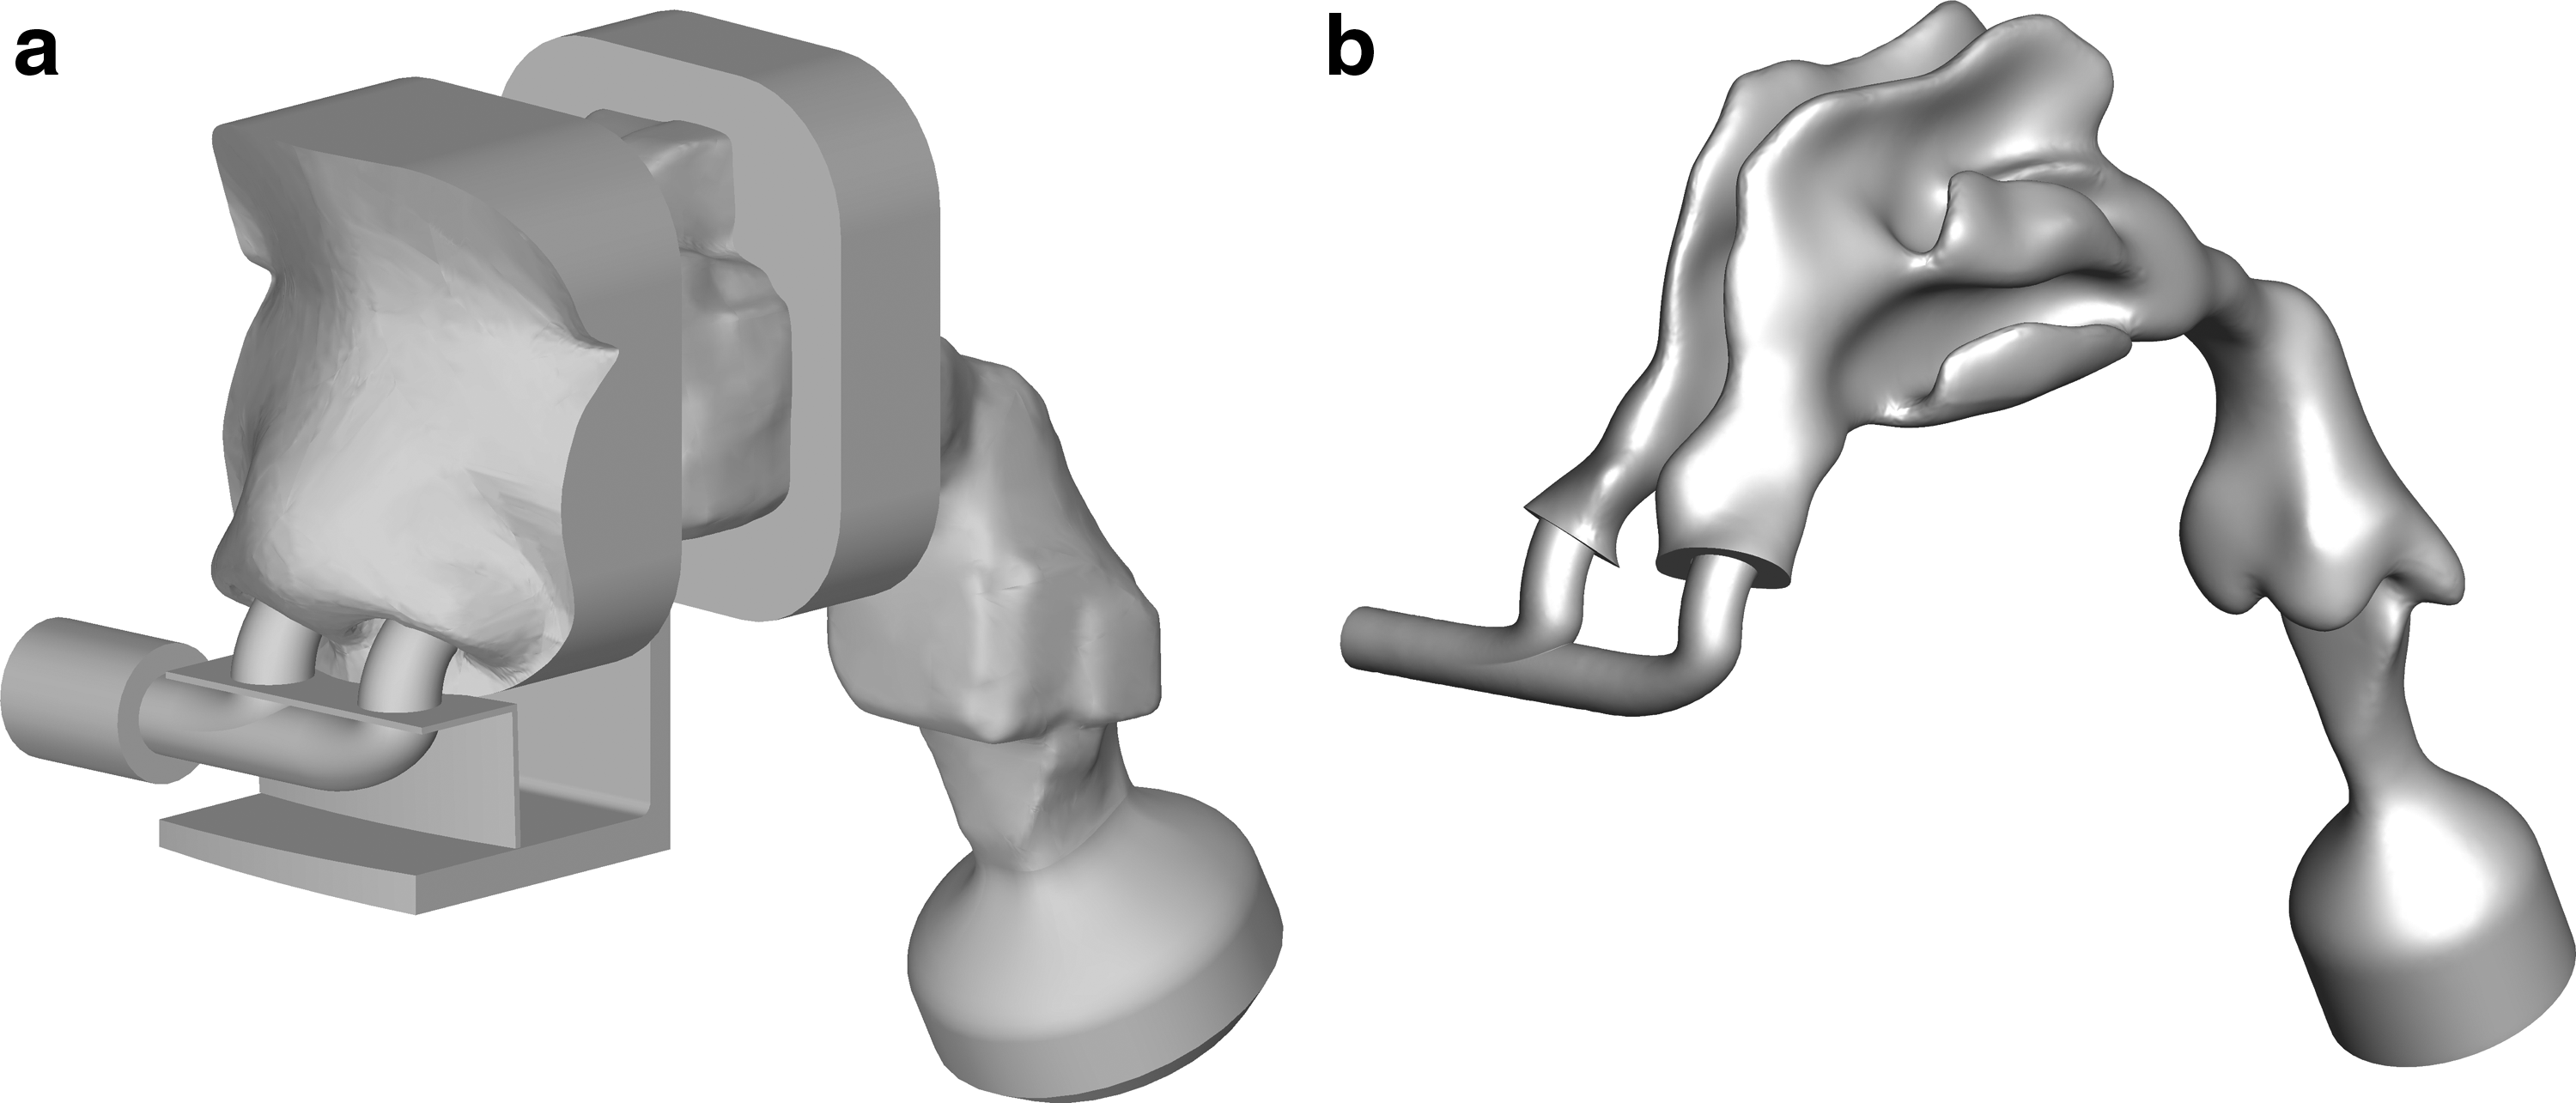
Figure 1a shows the CAD surfaces of the 6-month-old airway experimental model with cannula support, outlet filter connection, and connections between the three regions. Figure 1b shows the air interface of the cannula, nasal cavity, and filter connection that form the CFD model surfaces. Figure 1b also clearly illustrates the complexity of the infant nasal airway, especially in the region of the turbinates and larynx.
Overview of nasal geometry showing
Experimental set-up
Micrometer-sized aerosols were generated using a new mixer-heater in combination with a commercial nebulizer operating with reduced aerosol output. The mixer-heater delivery system is shown in Figure 2. The mixer-heater (61.6 mL internal volume) was designed to efficiently mix nebulized aerosol with incoming ventilation gas and then heat the aerosol to reduce it to micrometer or submicrometer size for inhalation. Consistent with infant high-flow nasal cannula ventilation, air at a flow rate of 6 L/min was introduced into the mixer-heater with the heating element set to 60°C, which resulted in an exit aerosol temperature from the streamlined cannula of 35°C. Aerosol was generated from a 0.5% w/v albuterol sulfate solution prepared by dissolving albuterol sulfate USP (Letco Medical, LLC, Decatur, AL) in water.
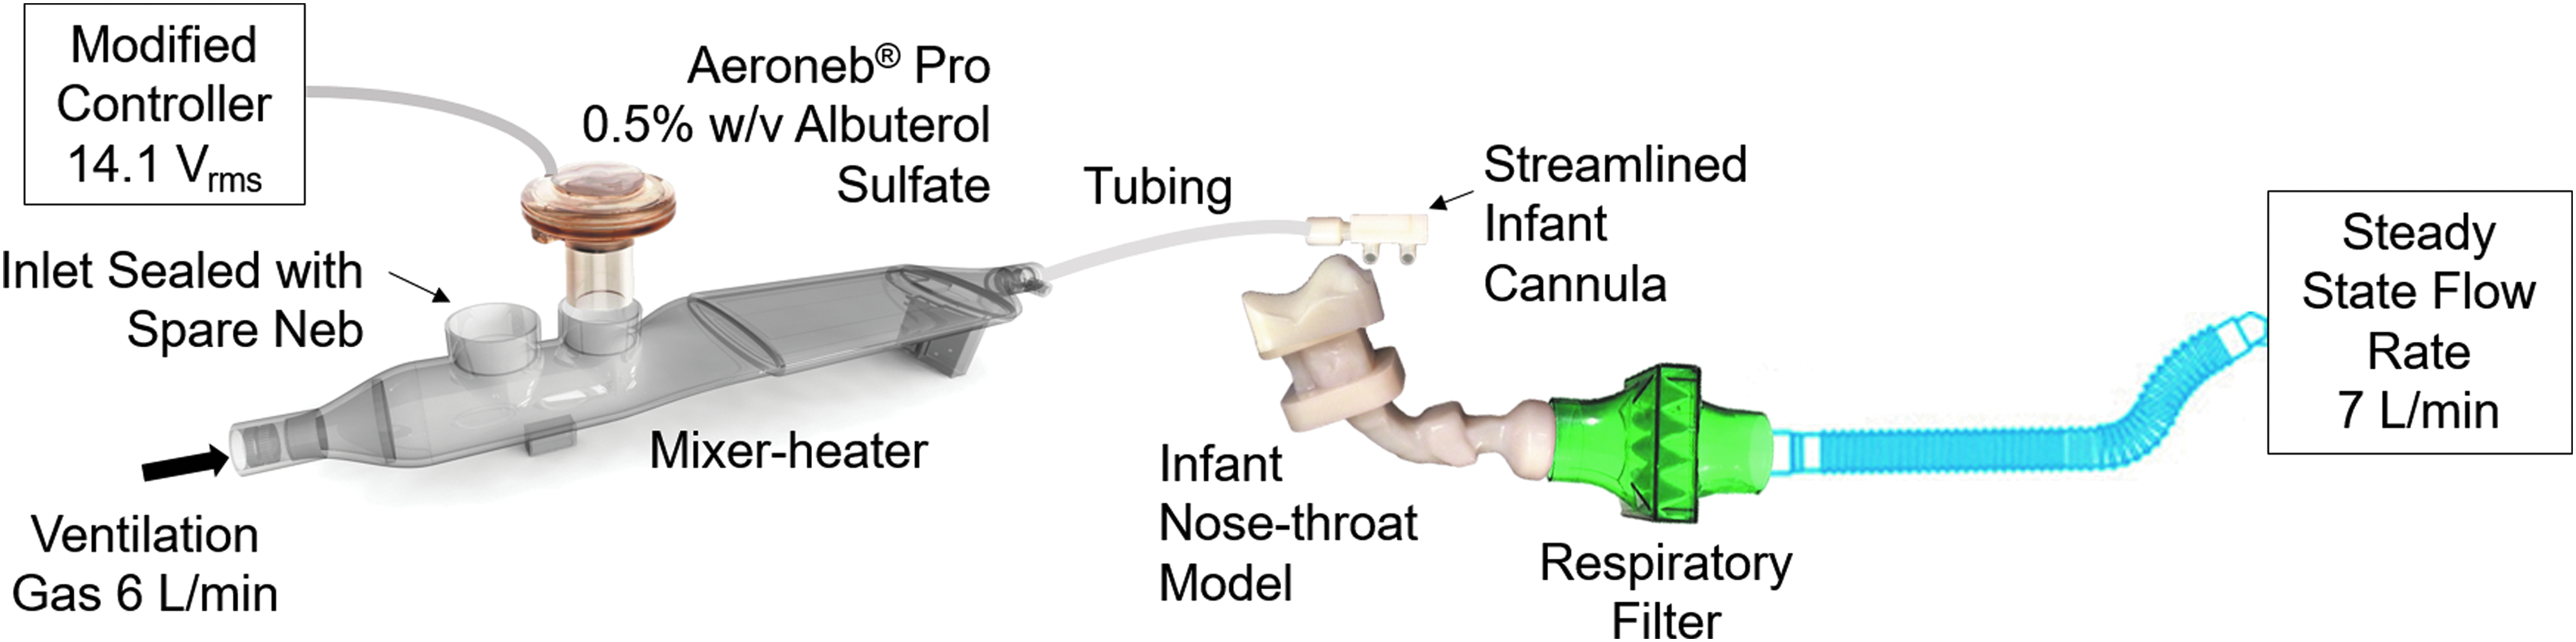
Experimental set-up schematic showing the mixer-heater aerosol-generating device, patient interface, and nose-to-lung model.
The targeted output particle size was ∼1.5 μm, which is expected to have low depositional loss in the nasal cannula and infant nasal airways. An Aerogen Pro nebulizer (Aerogen, Galway, Republic of Ireland) was used in the mixer-heater; however, the mean (standard deviation [SD]) output of the nebulizer was reduced to 70 (7) μL/min compared with typical values of 300–400 μL/min when operated using the Aerogen Controller. Reducing the output of the nebulizer was required to ensure drying of the aerosol to micrometer size at the infant gas flow rate. This was achieved by reducing the sinusoidal operating voltage amplitude of the controller to 14.1 Vrms compared with the normal operating value of 50 Vrms for the commercial nebulizer.
The nebulizer was filled with 3.5 mL of the nebulizer formulation and weighed before and following nebulization for each run (duration of 20 minutes). The mass of nebulized formulation and the concentration of the formulation was used to calculate the nominal dose of nebulized drug. Standard infant ventilator tubing with a diameter of 10 mm was used to connect the mixer-heater device to the streamlined infant cannula.
Aerodynamic particle sizing experiments were performed using the Andersen Cascade Impactor (ACI; Copley Scientific, Nottingham, United Kingdom) placed in an environmental chamber (Espec, Hudsonville, MI) set to 35°C and 99% relative humidity (RH) to minimize effects of evaporative size changes during measurements.
The aerosol output at the exit of the nasal cannula was positioned at the entrance to the ACI. The ACI inlet entrained the aerosol exiting the nasal cannula plus additional makeup air from the environmental cabinet for a total ACI flow rate of 28.3 L/min. Drug was collected from the impactor stages and filter to determine the emitted dose, the MMAD, and particle mass fraction less than 1 μm and less than 5 μm. MMAD and particle fractions were determined by linear interpolation. MMAD values were directly calculated as the size associated with a cumulative count of 50% based on mass percentages calculated relative to the impactor dose. Particle mass fractions were calculated as the cumulative mass fraction frequency associated with sizes of 1 and 5 μm, respectively. A minimum of three measurements were performed.
Studies were also performed to determine the regional deposition of the mixer-heater-generated micrometer drug aerosol in the infant model as shown in Figure 2. Aerosol was continuously generated in these steady-state flow experiments as described above, with the outlet of the streamlined infant nasal cannula inserted into the nostrils of the airway model. Aerosol delivered through the infant nasal model was captured on a low-resistance respiratory filter positioned at the exit of the trachea and was considered as the delivered in vitro N2L dose. A constant flow of 7 L/min was drawn through the airway model. As described previously, the physical model was identical to the CFD model and included the nostrils, turbinates, nasopharynx, larynx, and a portion of the trachea.
The model was segmented into three portions: (i) the anterior nose, (ii) the middle passage, and (iii) the nasopharynx, larynx, and upper trachea. Drug deposited on the model components and respiratory filter was recovered and analyzed using a validated isocratic high performance liquid chromatography (HPLC) method. The mobile phase consisted of 30% ammonium formate buffer (20 mM, pH 3.4) and 70% methanol, which was eluted at a flow rate of 0.75 mL/min. A Waters 2695 separations module with a 2475 fluorescence detector (Waters Co., Milford, MA) was used with the detector set to a wavelength of 276 nm.
Chromatography was performed using a Restek Allure PFP (150 × 3.0 mm column, 5 μm) (Bellefonte, PA). The recovered emitted dose from the mixer-heater was calculated as the mass of drug deposited on the ventilator tubing, cannula, nasal airway model, and respiratory filter. Regional drug deposition was expressed as a percentage of the recovered emitted dose from the mixer-heater.
Numerical model
The numerical model provided a close approximation of the experimental setup, with some simplifying assumptions. Aspects neglected by the numerical model in this study included variability in cannula positioning between experiments and wall surface roughness. The following sections detail aspects of the CFD model set-up and the steps taken to ensure accurate and reliable deposition results.
Meshing and solution guidelines
Bass and Longest(20) recently provided a set of CFD meshing and solution guidelines for modeling aerosol deposition in the respiratory airways, under transitional and turbulent flow conditions, using the LRN k-ω turbulence model. These guidelines detailed near-wall (NW) mesh parameters and solver settings that provided a good match to experimental and LES data of micrometer (from ∼1 to 7.5 μm) particle deposition in a characteristic 90° bend geometry. Table 1 summarizes the recommendations from that study, which will be applied to the current numerical model, with the intention of validating the mesh and solver settings against experimental data of micrometer particle deposition in an infant nasal cavity during N2L aerosol administration.
Summary of Recommended Mesh and Solver Parameters
L2L, layer-to-layer; LRN, low-Reynolds number; Mom., momentum; NW, near-wall; TKE, turbulent kinetic energy; Turb., turbulence; UDF, user-defined function.
In addition to validating the CFD meshing and solution guidelines, this study explores the assumption of laminar flow versus a turbulence approximation simulated with the LRN k-ω turbulence model for infant nasal airways. Results evaluate the turbulent nature of the flow and its influence on both monodisperse and polydisperse aerosols. Flow through the infant nasal cavity is generally in the laminar or transitional regime when considering the Reynolds number at the connection tubing inlet (∼900). However, the complexity of the nasal passages and transition from the patient interface to nostrils may induce turbulence in the flow. Specifically, the nasal cannula interface creates air jets that enter the most constricted portion of the nose, that is, the nasal valve.
CFD models with the LRN k-ω turbulence approximation generally tend to overpredict microparticle deposition, due to the assumption of isotropic NW turbulence. Longest and Xi(23) developed a method of NW correction by utilizing FLUENT user-defined functions (UDFs), which built upon previous work by Matida et al.(24) and Wang and James.(25) The NW correction UDFs include anisotropic velocity fluctuations in the continuous phase and damp the wall-normal velocity in the NW region to represent particle–wall hydrodynamic interactions.(26) Further details on these corrections have been reported in previous studies from our group,(23,27) and recent improvements to interpolation methods were reported by Bass and Longest.(20)
The key control parameter used by the NW correction UDFs is the NW limit, as it determines the particle-to-wall distance, below which wall-normal velocity is damped. This parameter is adjusted to match numerical and experimental deposition data, with Bass and Longest(20) reporting values of 1–2 μm provided good comparisons in a 90° bend geometry. The present work will compare results using the NW corrections versus the standard turbulent particle dispersion model, and a case that includes the LRN k-ω turbulence approximation of the flow field, but without the particle dispersion model activated. This investigation will also determine whether the NW limit control established in the simple 90° bend study can be applied to the highly complex infant nasal cavity model.
Meshing approaches
This study compares two types of unstructured meshes for modeling aerosol deposition in the patient interface and nasal cavity. Ideally, numerical models use structured hexahedral meshes, as they generally give the best solution accuracy, stability, and computational efficiency. However, the complex geometry of the infant nasal cavity makes it prohibitively difficult to apply a structured mesh. Unstructured tetrahedral meshes are often used when a hexahedral mesh is not possible, as they are able to conform to complex surfaces and efficiently fill the domain volume with good-quality cells. Bass and Longest(20) concluded that a tetrahedral mesh with five prismatic NW cell layers provides similar microparticle deposition to a hexahedral mesh in a simplified geometry under flow conditions similar to the infant airways. However, differences in the deposition predictions were observed for 1 μm particles between meshes with tetrahedral and prismatic NW cells.
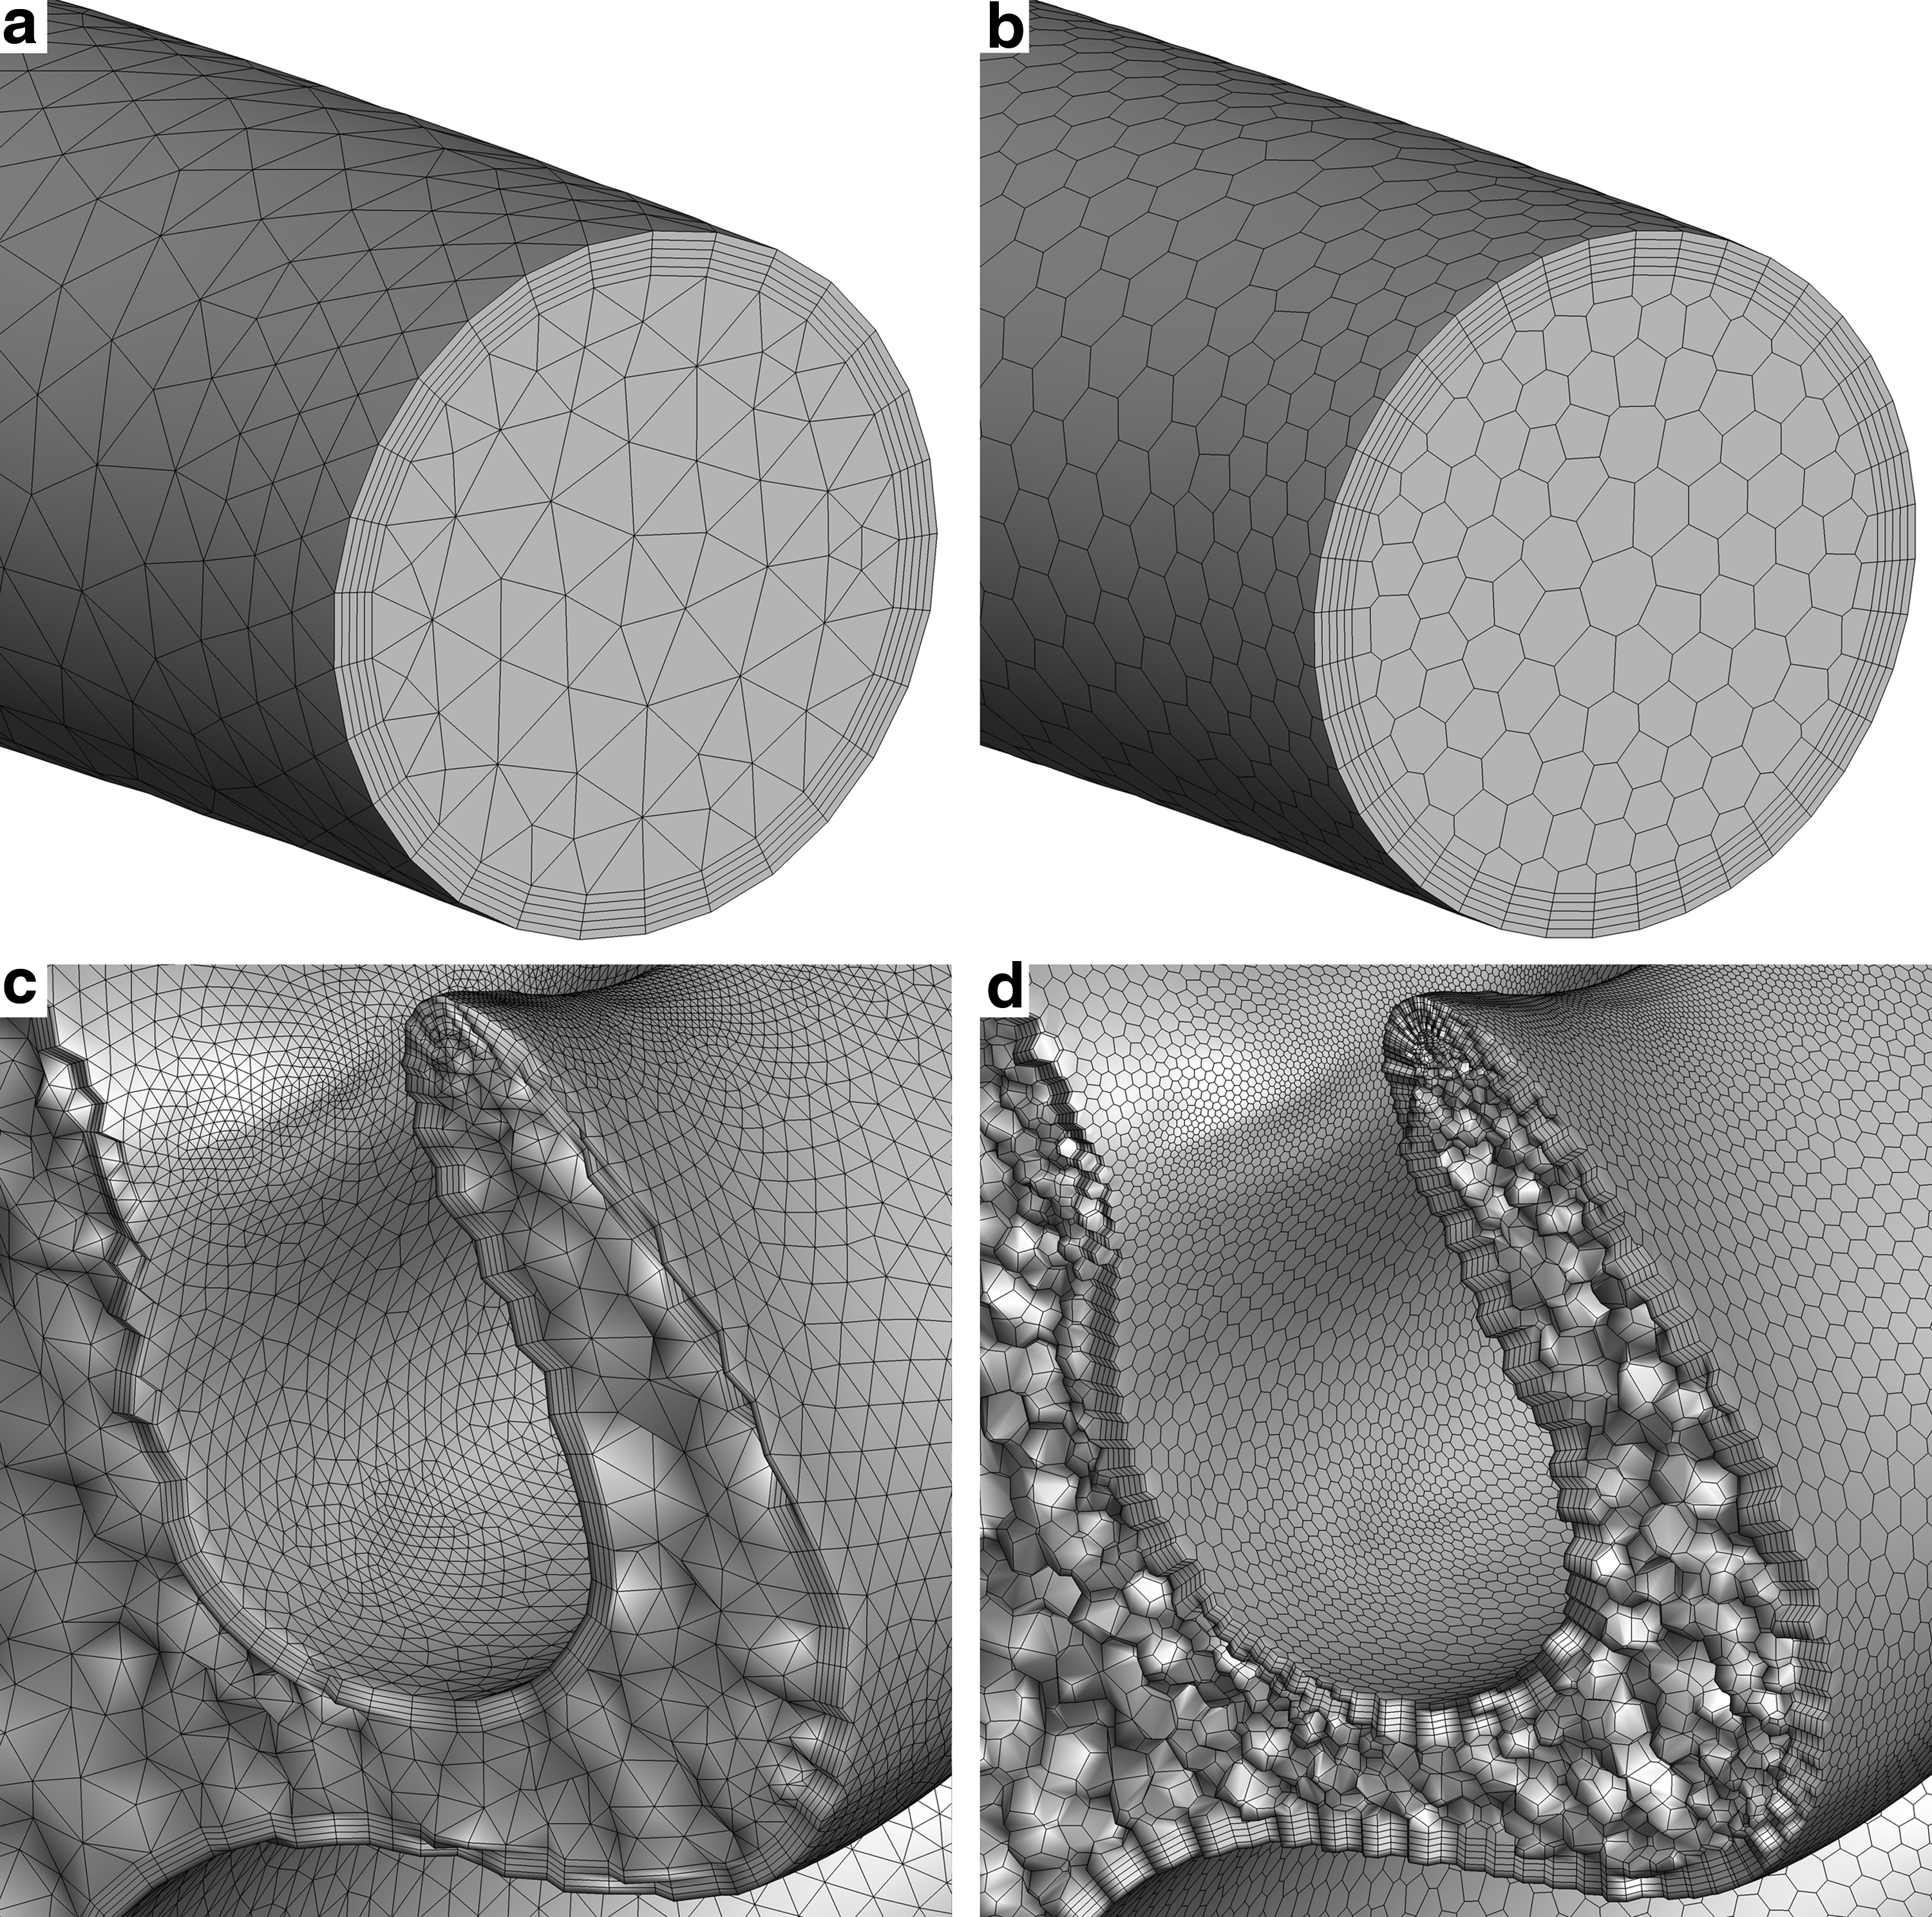
As one meshing option in the current study, the tetrahedral and prismatic NW cell mesh is explored and applied to the infant nasal geometry, with mesh parameters that were established in the much simpler 90°-bend considered by Bass and Longest,(20) as shown in Table 1. Figure 3a shows the meshing structure of the tetrahedral cells with prismatic NW cell layers at the tube inlet, and Figure 3c shows a cut through the middle meatus that exposes the interior nasal mesh.
Examples of polyhedral and tetrahedral volume meshes, including the
The tetrahedral and prism mesh shown in Figure 3a and c was generated using the FLUENT meshing capabilities (ANSYS, Inc.). The process begins by producing a triangular surface mesh that conforms to the complex geometry. Curvature, proximity, and locally defined size controls are used to adjust the mesh sizing to obtain an accurate representation of the geometry surface and increase fidelity in regions of interest and importance.
To generate the volume mesh, the software uses a Delaunay algorithm to fill the domain with tetrahedral cells, and the five-sided prismatic NW cells are added by inflating the surface mesh toward the cell interior. Definition of the NW cell layers follows the recommendations provided by Bass and Longest(20) of five equally spaced layers with an approximate wall y+ of one (Table 1). Once the meshing process is complete, the cell nodes are smoothed using the capabilities in FLUENT meshing to ensure that all cells have an orthogonal quality greater than 0.25, which provides a high-quality discretization of the domain.
In addition to tetrahedral meshes, FLUENT meshing is capable of producing polyhedral meshes, which are composed of cells with any number of faces, edges, and vertices. Polyhedral cells generally have more faces than hexahedral or tetrahedral cells, which results in more cell neighbors, and hence better resolution of gradients in and out of the control volume.(28) The various orientations of each cell face (Fig. 3d) also increases the likelihood of having flow aligned with a cell face, which can reduce numerical diffusion, as it does for flow-aligned hexahedral meshes. There is much anecdotal evidence in the CFD community that polyhedra provide faster convergence with lower cell counts than tetrahedra.
However, a review of the literature shows there has been no direct evaluation of these two unstructured meshing approaches in the field of respiratory drug delivery research. The closest comparison comes from Lotfi et al.(29) who concluded that polyhedra provided superior results to tetrahedra when modeling flow through a stented artery. However, their study did not provide details on convergence or computational efficiency. van Ertbruggen et al.(30) developed a CFD model representation of alveolar structures in the lungs, which used a polyhedral mesh, and made good comparisons with experimental data for laminar, very low speed flow.
However, a direct comparison of results from tetrahedra and polyhedra was not made. Furthermore, both of these previous studies did not include particle transport and deposition. Peric(31) provided a complete comparison of polyhedral and tetrahedral meshes for a simple 3D lid-driven cavity flow model under laminar conditions, and showed that polyhedra required 50% less memory and less than 20% of the computation time.
The advantages described here make polyhedral meshes a promising approach for developing computationally efficient airway models. Figure 3b shows the polyhedral mesh at the tube inlet and Figure 3d shows the interior mesh in the middle meatus. These images show that the polyhedral cell faces are generally five- or six-sided polygons, and as such, the NW cell layers have a varying number of sides. The process of generating a polyhedral mesh is similar to tetrahedral meshing, including the generation of a tetrahedral volume mesh. Once the volume mesh is complete, the software uses dualization and agglomeration algorithms to convert the tetrahedral cells to polyhedral. The details of this conversion are covered in more detail in the ANSYS User Guide(32) and other resources. As with the tetrahedral mesh, the final step is to smooth the mesh and ensure all cells are acceptable with orthogonal quality greater than 0.25.
Mesh dependency study
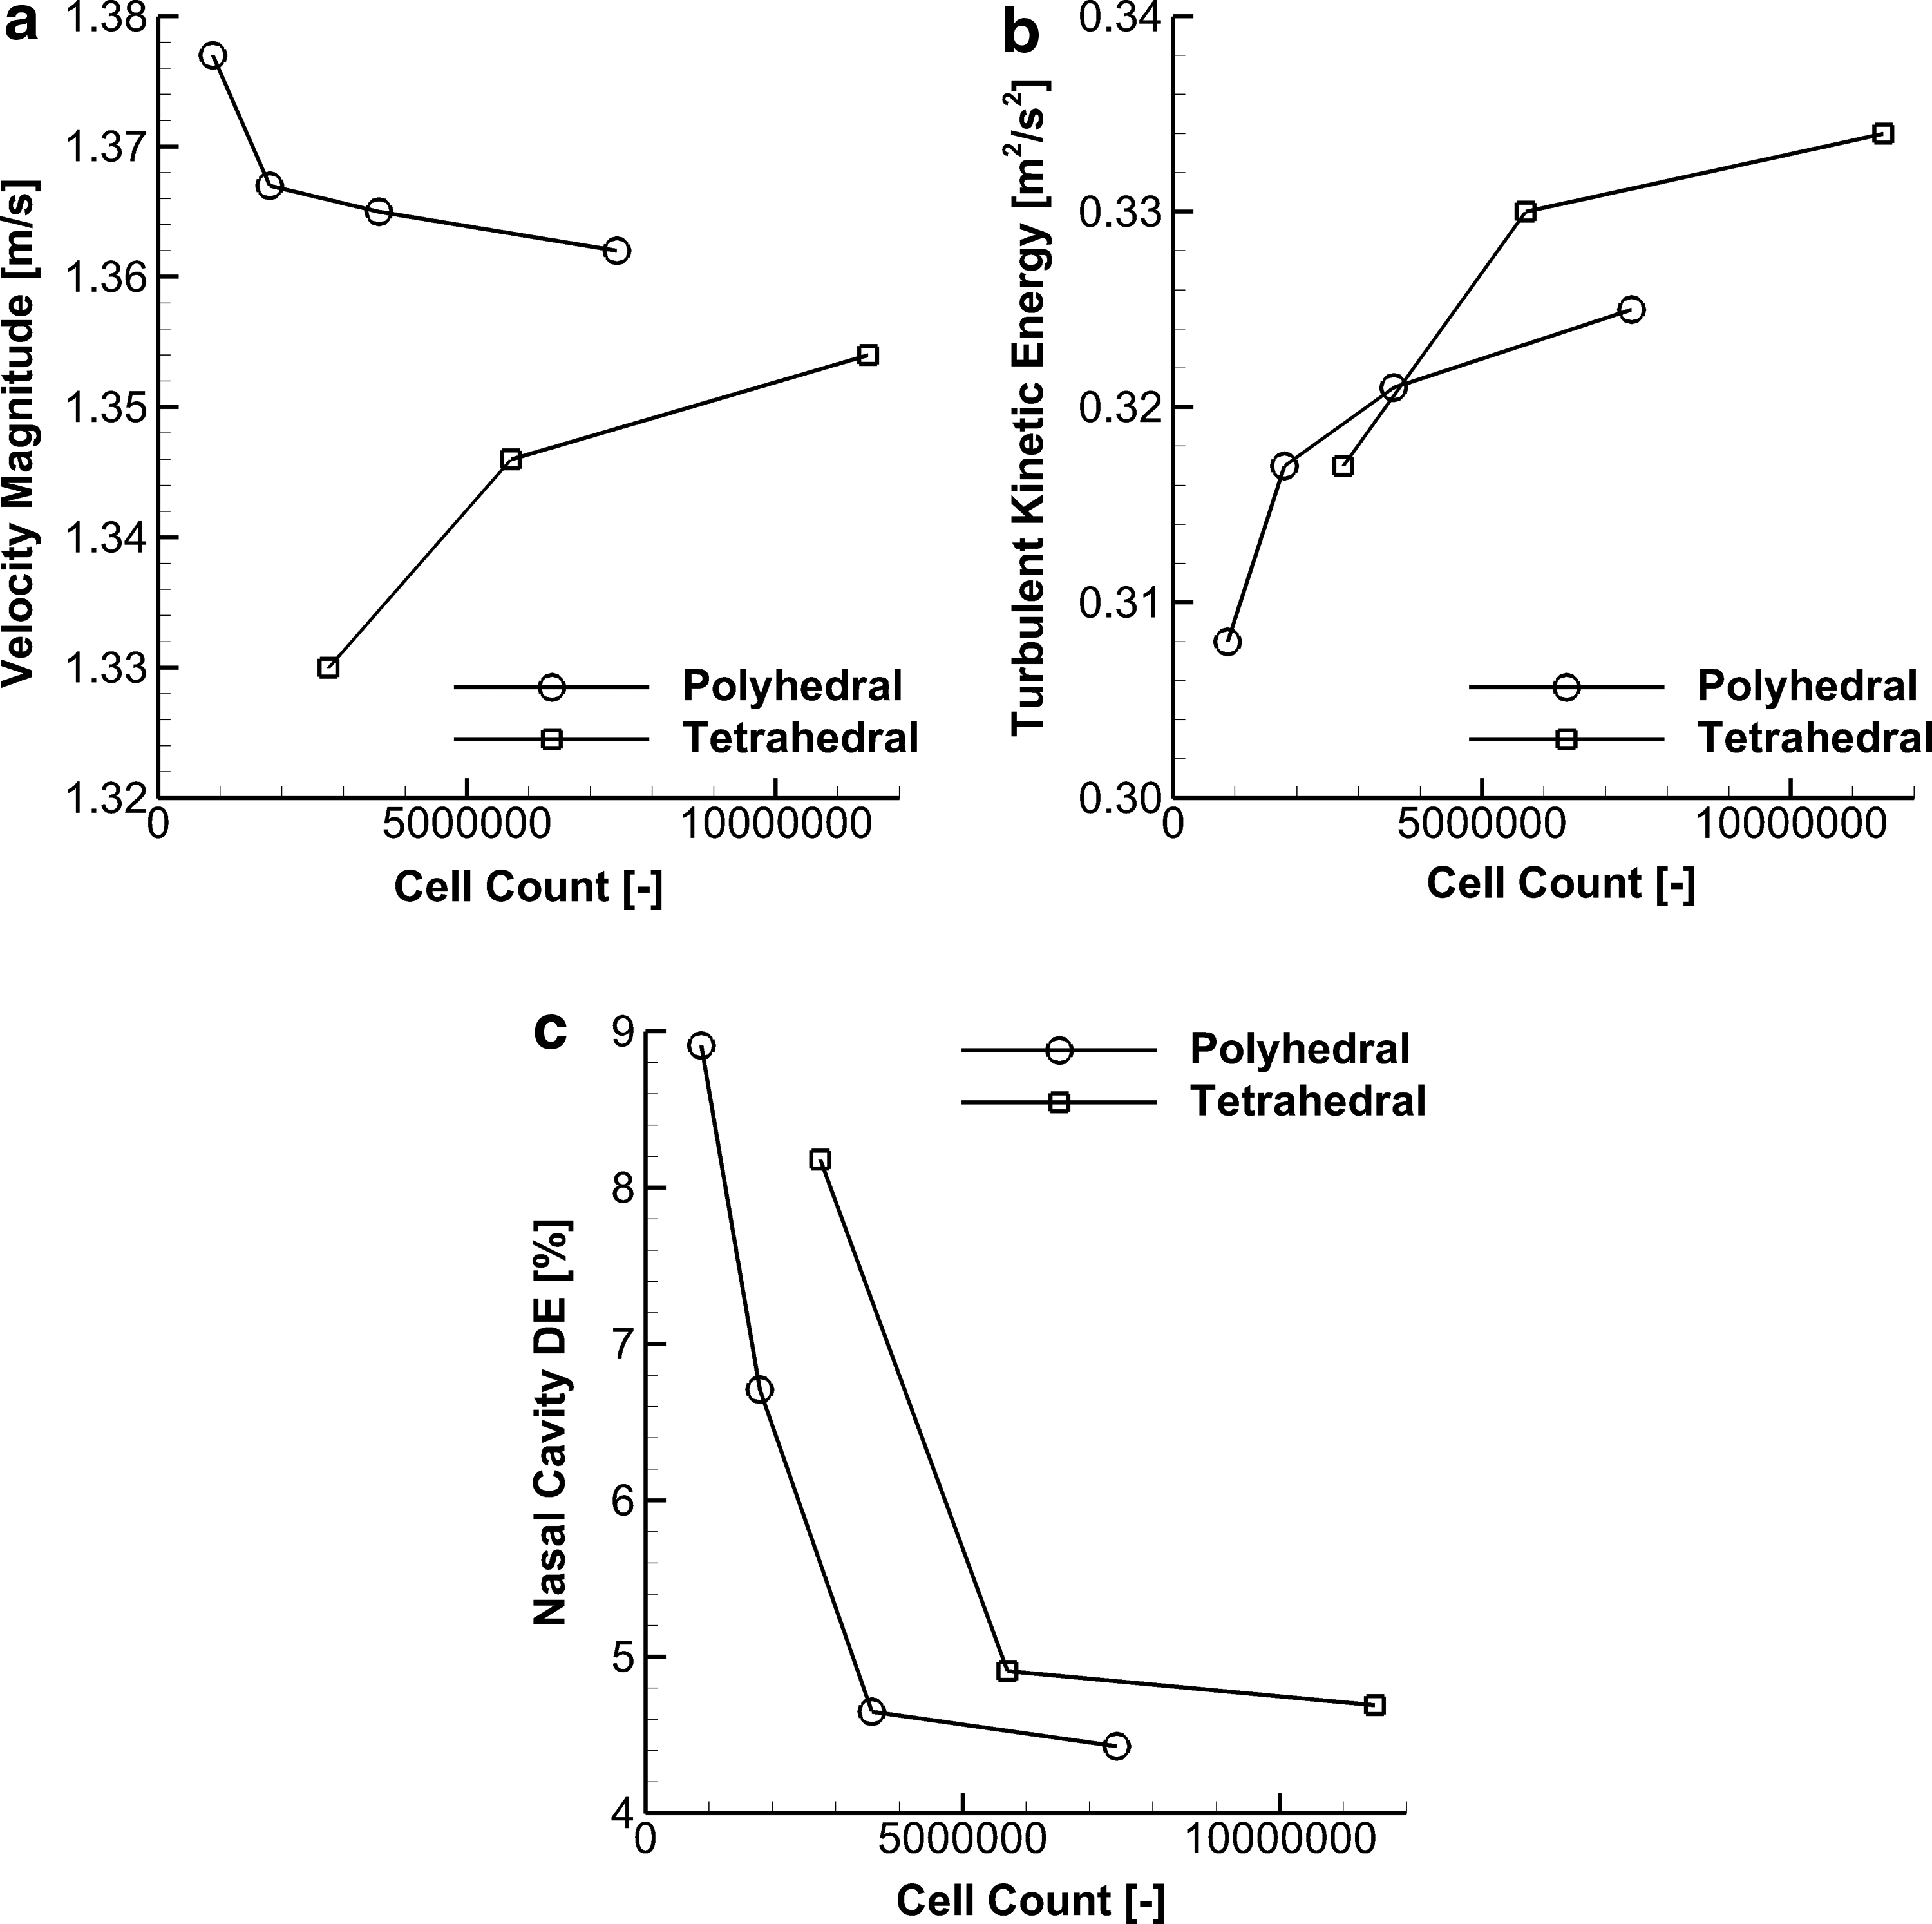
A mesh dependency study was performed on both the tetrahedral and polyhedral meshes to determine the optimum grid resolution. In Figure 4, the volume average velocity magnitude, turbulent kinetic energy (TKE), and nasal cavity deposition efficiency (DE) are compared for a coarse (2.76 million cells), medium (5.71 million cells), and fine (11.50 million cells) tetrahedral mesh, and also a coarse (0.88 million cells), medium (1.80 million cells), fine (3.56 million cells), and extra fine (7.42 million cells) polyhedral mesh. The DE is calculated from particles that are exposed to the turbulent dispersion model, but no NW corrections are applied. The comparison shows that the 5.71 million cell tetrahedral mesh and 3.56 million cell polyhedral mesh each give the best compromise between grid convergence and solution processing times.
Summary of mesh convergence for both polyhedral and tetrahedral mesh types for key flow and turbulence field quantities and particle deposition characteristics, including
Between the medium and fine tetrahedral mesh, the volume average velocity magnitude, TKE, and nasal cavity DE differ by only 0.008 m/s, 0.004 m2/s2, and 0.2%, respectively. Similarly, these factors in the fine and extra fine polyhedral mesh differ by 0.003 m/s, 0.004 m2/s2, and 0.2%. Therefore, the remainder of this study uses the 5.71 million cell tetrahedral mesh and 3.56 million cell polyhedral mesh to compare each cell type and validate the CFD solution parameters. These cell counts are similar to grid convergence established in other nasal studies, including the 3–6 million cells used by Walenga et al.(11) and the 4 million cells used by Frank-Ito et al.(33)
Boundary conditions
Boundary conditions in the CFD model were set to replicate the flow in and out of the experimental model. Mass flow inlet and outlet boundary types were applied at the tube inlet and filter connection outlet, with mass flow rates that gave 6 and 7 L/min, respectively. The inlet conditions in the delivery tube, with a 10 mm inner diameter (ID), gave an inlet Reynolds number of ∼900, which suggests the flow in the tube will be laminar. However, it is known that changes in cross-section, obstructions, and changes in flow path can induce transitional and turbulent flow regardless of inlet flow conditions.(34,35)
As mentioned previously, the effect of laminar and LRN k-ω models on flow and particle deposition are evaluated in the Results section. Pressure inlet boundaries were applied to both the left and right nostrils in the gap between the cannula surface and airway walls, which were exposed to ambient pressure (gauge pressure of 0 Pa). The additional 1 L/min flow from the difference between the delivery tube inlet and filter connection outlet flow rates enters the domain through the nostrils, and using pressure inlets enables this inflow to vary in local velocity.
For the LRN k-ω model cases, turbulence boundary conditions are required at each of the inlet boundaries, which were defined with hydraulic diameter and turbulence intensity. For the tube inlet, the hydraulic diameter is simply the 10 mm tube ID, as the cross-section is circular. Turbulence intensity at the tube inlet is estimated to be ∼6% based on the approximation
where I is turbulence intensity and
An additional geometry extension was applied to the inlet, which was 30 mm long (three times the inlet diameter), to provide a parabolic flow profile at the ventilator tubing inlet. Similarly, a numerical extrusion was also added to the filter connection outlet, but due to recirculation in the filter connection, its length was increased until there was no reverse flow at the mass flow outlet. Particles did deposit on the outlet extrusion wall, but these particles were not included in evaluations of deposition in the nasopharynx region. That is, it was assumed that any particles that deposited on the outlet extrusion were collected by the outlet filter.
Solution strategy
As is typical for CFD simulations, the first convergence check was that the residuals for all transport equations fell below at least 1e-4. Flow rates through the pressure inlet nostrils were also checked to ensure that mass was conserved through the domain. Due to the difference in flow rates between the filter connection outlet and tube inlet, flow through both nostrils should be 1 L/min. Therefore, we were confident that mass through the domain was conserved if the flow rate through the pressure inlet boundaries is within ±0.01% of this expected value. Volume average velocity magnitude and TKE were also monitored for the entire domain, and the solution was deemed converged when these quantities converge to a stable value with negligible fluctuation.
During the CFD model development, we were unable to reach a converged solution using the steady-state formulations due to mass imbalance in a number of cells in the filter connection region. Further investigation of the flow field in this region showed an area of recirculation, where the flow leaves the nasopharynx and enters the filter connection. Physically, this recirculating region is unstable, with the reattachment point oscillating in time, making the problem fundamentally transient (time-dependent). To correct this issue, we switched from the partially converged steady-state solution to a time-dependent formulation. This solution strategy, with an appropriately small time step, allows the model to capture the physically correct oscillatory flow and reach a high degree of convergence, which was less than 1e-5 on all residuals.
To confirm this method is valid, flow quantities are compared at the end of each time step to ensure there is little change in the flow field outside of the oscillating region. Particle DFs are also compared at the 10th and 20th time step to make sure particle trajectories do not change with respect to time. For all cases considered, switching from the partially converged steady-state solution to transient provided excellent convergence and showed negligible change in the flow field and deposition characteristics. Furthermore, evaluation of the flow field revealed the flow recirculation was in a region outside of the infant nasal cavity and nasopharynx (in the filter connection), and therefore does not contribute to extrathoracic losses. However, the effect of flow recirculation on the in vitro deposition results is discussed in later sections of this study.
Particle injections
In the experimental model, the tube that connects the mixer-heater device to the streamlined nasal cannula has a 10 mm ID, but the outlet from the mixer-heater used for aerosol generation is 6 mm ID. That is, the 10 mm tubing fits around the outside of the 6 mm mixer-heater outlet, which has a 2 mm wall thickness. Therefore, particles are injected into the CFD model at the inlet to the tube, with a 6 mm circular diameter and a blunt profile spatial distribution.
Both monodisperse and polydisperse particle size distributions were evaluated in this study. The polydisperse size distribution used in the CFD model neglects the three larger particle size bins (5.8, 9.0, and 10.0 μm) of the ACI analysis, as these bins combined account for less than 1% of the total particle mass delivered to the experimental model (0.28%, 0.19%, and 0.15%, respectively). To ensure good particle deposition convergence, Tian et al.(19) recommended 10,000 particles be injected for each size bin, which in this case results in 60,000 total particles. To compare the total DF in each region of the CFD model to the experimental data, the DF for each size bin is multiplied by the mass of particles for that bin and divided by the total injected mass, which is then summed over all bins. This is described as
where ni is the number of particles deposited for size bin i, Ni is the number of particles that enter the CFD domain for bin i,
A monodisperse aerosol is also evaluated by the CFD model to determine whether it gives comparable results to a polydisperse size distribution. The monodisperse particle size is 25% larger than the MMAD of the polydisperse aerosol, which results in 1.78 μm (where the measured MMAD is 1.4 μm). This approach has previously given comparable results for both in vitro(36) and in vivo(19) deposition in the upper airways. Theoretically, the multiplication factor is needed because the particle deposition increases at a nonlinear rate for an increasing particle diameter. For particle deposition convergence, 10,000 particles are injected into the domain for the monodisperse aerosol.(19) The monodisperse aerosol profile also uses the same diameter and spatial distribution at the tube inlet as the polydisperse injection.
Results
Experimental
The droplet size of the albuterol sulfate aerosol exiting the infant cannula was determined to have a mean (SD) MMAD of 1.4 (0.1) μm and GSD of 1.4 (0.0) with 99.5% and 25.5% of the particles less than 5 and 1 μm, respectively. Particle sizes representing the 10% and 90% cumulative mass distribution are 0.7 and 2.1 μm, respectively.
For the aerosol deposition experiments, the overall mean (SD) drug recovery was 84.3% (3.4%) of the nominal dose. Deposition in the mixer-heater was low (2.1% of the nominal dose) demonstrating the efficiency of the delivery system.
Table 2 shows the mean (SD) experimentally determined DFs expressed as a percentage of the recovered emitted dose from the mixer-heater. Deposition on the patient interface (tubing and cannula) was low with only 2.23% of the dose being found in this region. Similarly, deposition in the infant nasal airway model was also low, with less than 5% of the recovered emitted dose being deposited in the combined nasal passages. For this micrometer-sized aerosol generated using the mixer-heater, the mean drug DF on the respiratory filter was 93.0%, indicating highly efficient N2L delivery under steady-state inhalation flow conditions.
Summary of Deposition Fractions for the Monodisperse and Polydisperse Aerosol Laminar Cases
Diff. is defined as the absolute value of absolute difference between the CFD and experimental data.
CFD, computational fluid dynamics; DF, deposition fraction; Exp., experimental; Mono., monodisperse; Poly., polydisperse; SD, standard deviation.
Comparison of polyhedral and tetrahedral meshes
As discussed in the Materials and Methods section, it is expected that polyhedral meshes may provide faster convergence than tetrahedra. Figure 5a and b plot the volume average velocity magnitude and TKE, respectively, in the CFD domain against solution iterations for the steady-state solution of the flow field. These plots show that the polyhedral mesh reaches a converged solution in ∼2000 iterations compared with ∼3500 iterations for the tetrahedral mesh. As described, the steady-state model is switched to a transient formulation, with constant boundary conditions, to capture flow oscillations in the filter connection and thereby enable convergence. It is also noted that the mesh-independent polyhedral case uses 3.56 million cells and the tetrahedral cases required 5.71 million cells.
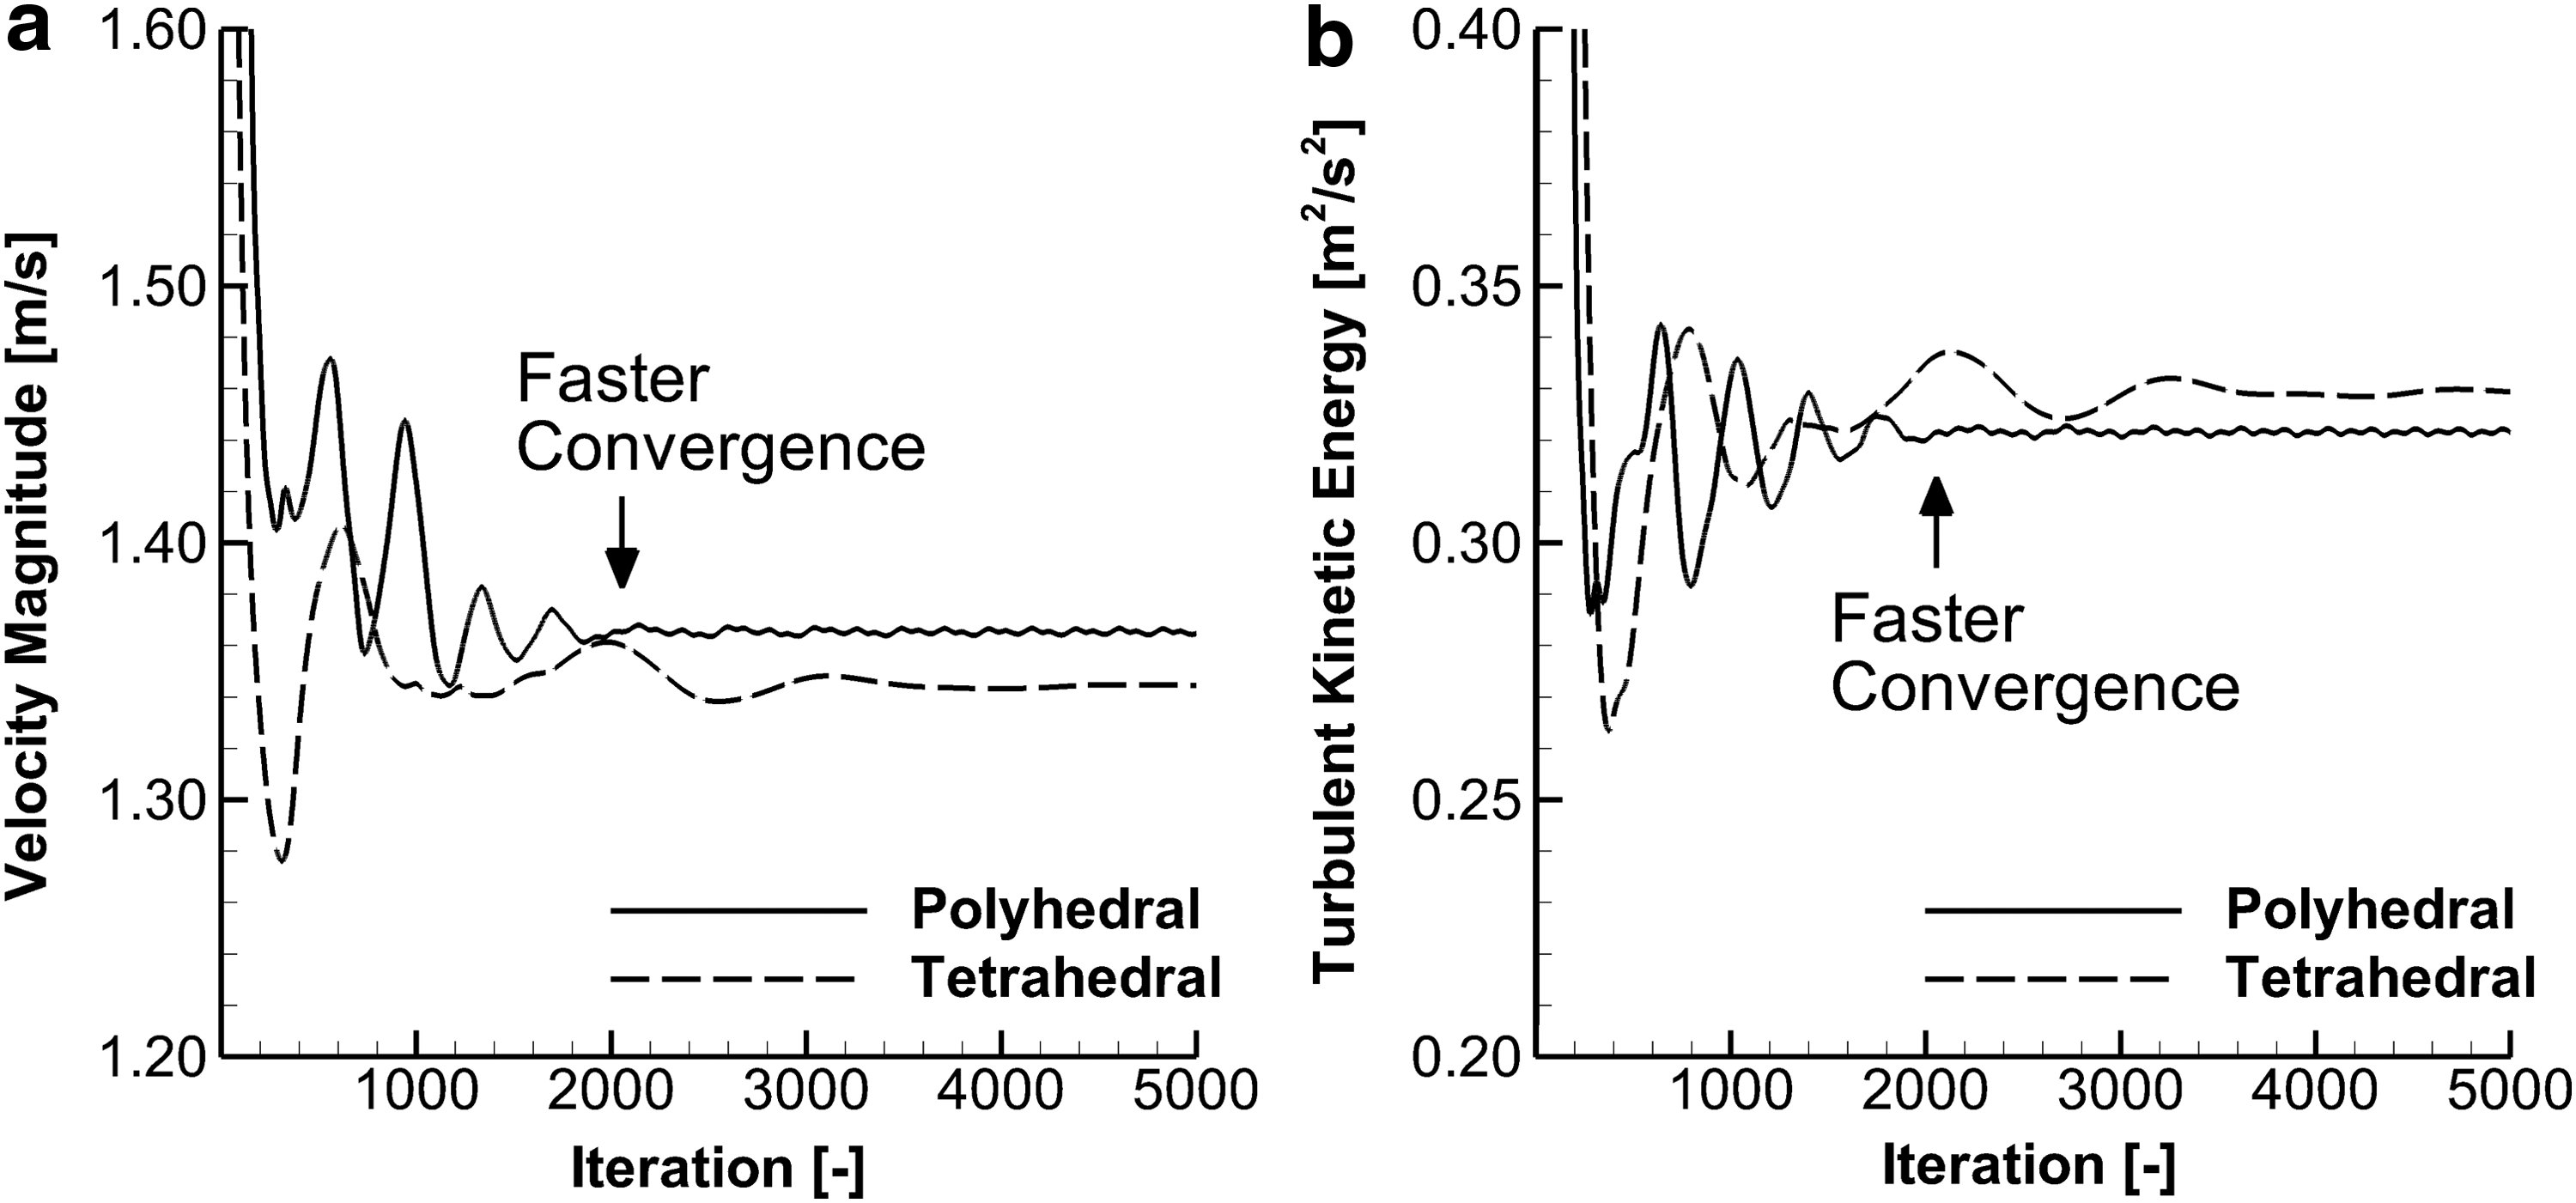
Progression of volume-averaged
Therefore, the polyhedral mesh is capable of reaching a converged solution faster, and with less computational expense. These combined benefits of polyhedral cells resulted in a CFD model that required 33% of the CPU time used by the tetrahedral case (on the same number of processors). As a result, the polyhedral mesh is more computationally efficient, which is beneficial for time-consuming transient simulations.
In addition to improvements in processing time, polyhedral cells provide the benefits described in the Materials and Methods section, specifically better call-face gradient resolution and reduced numerical diffusion. The accuracy of polyhedral cells is evaluated by comparing CFD particle deposition results with experimental data, as shown below.
Comparison of laminar and turbulence models
Figure 6 shows isosurfaces of turbulent viscosity ratio (TVR) in the CFD model, which is the ratio of turbulent viscosity to laminar viscosity. That is, a TVR of two means the turbulence in the flow makes the fluid twice as viscous as the laminar case. From Figure 6 it is clear that the TVR is at least two in a large portion of the nasal cavity, and reaches a ratio of at least five where the flow transitions from the patient interface to nasal cavity and around the glottis, which forms a flow constriction.
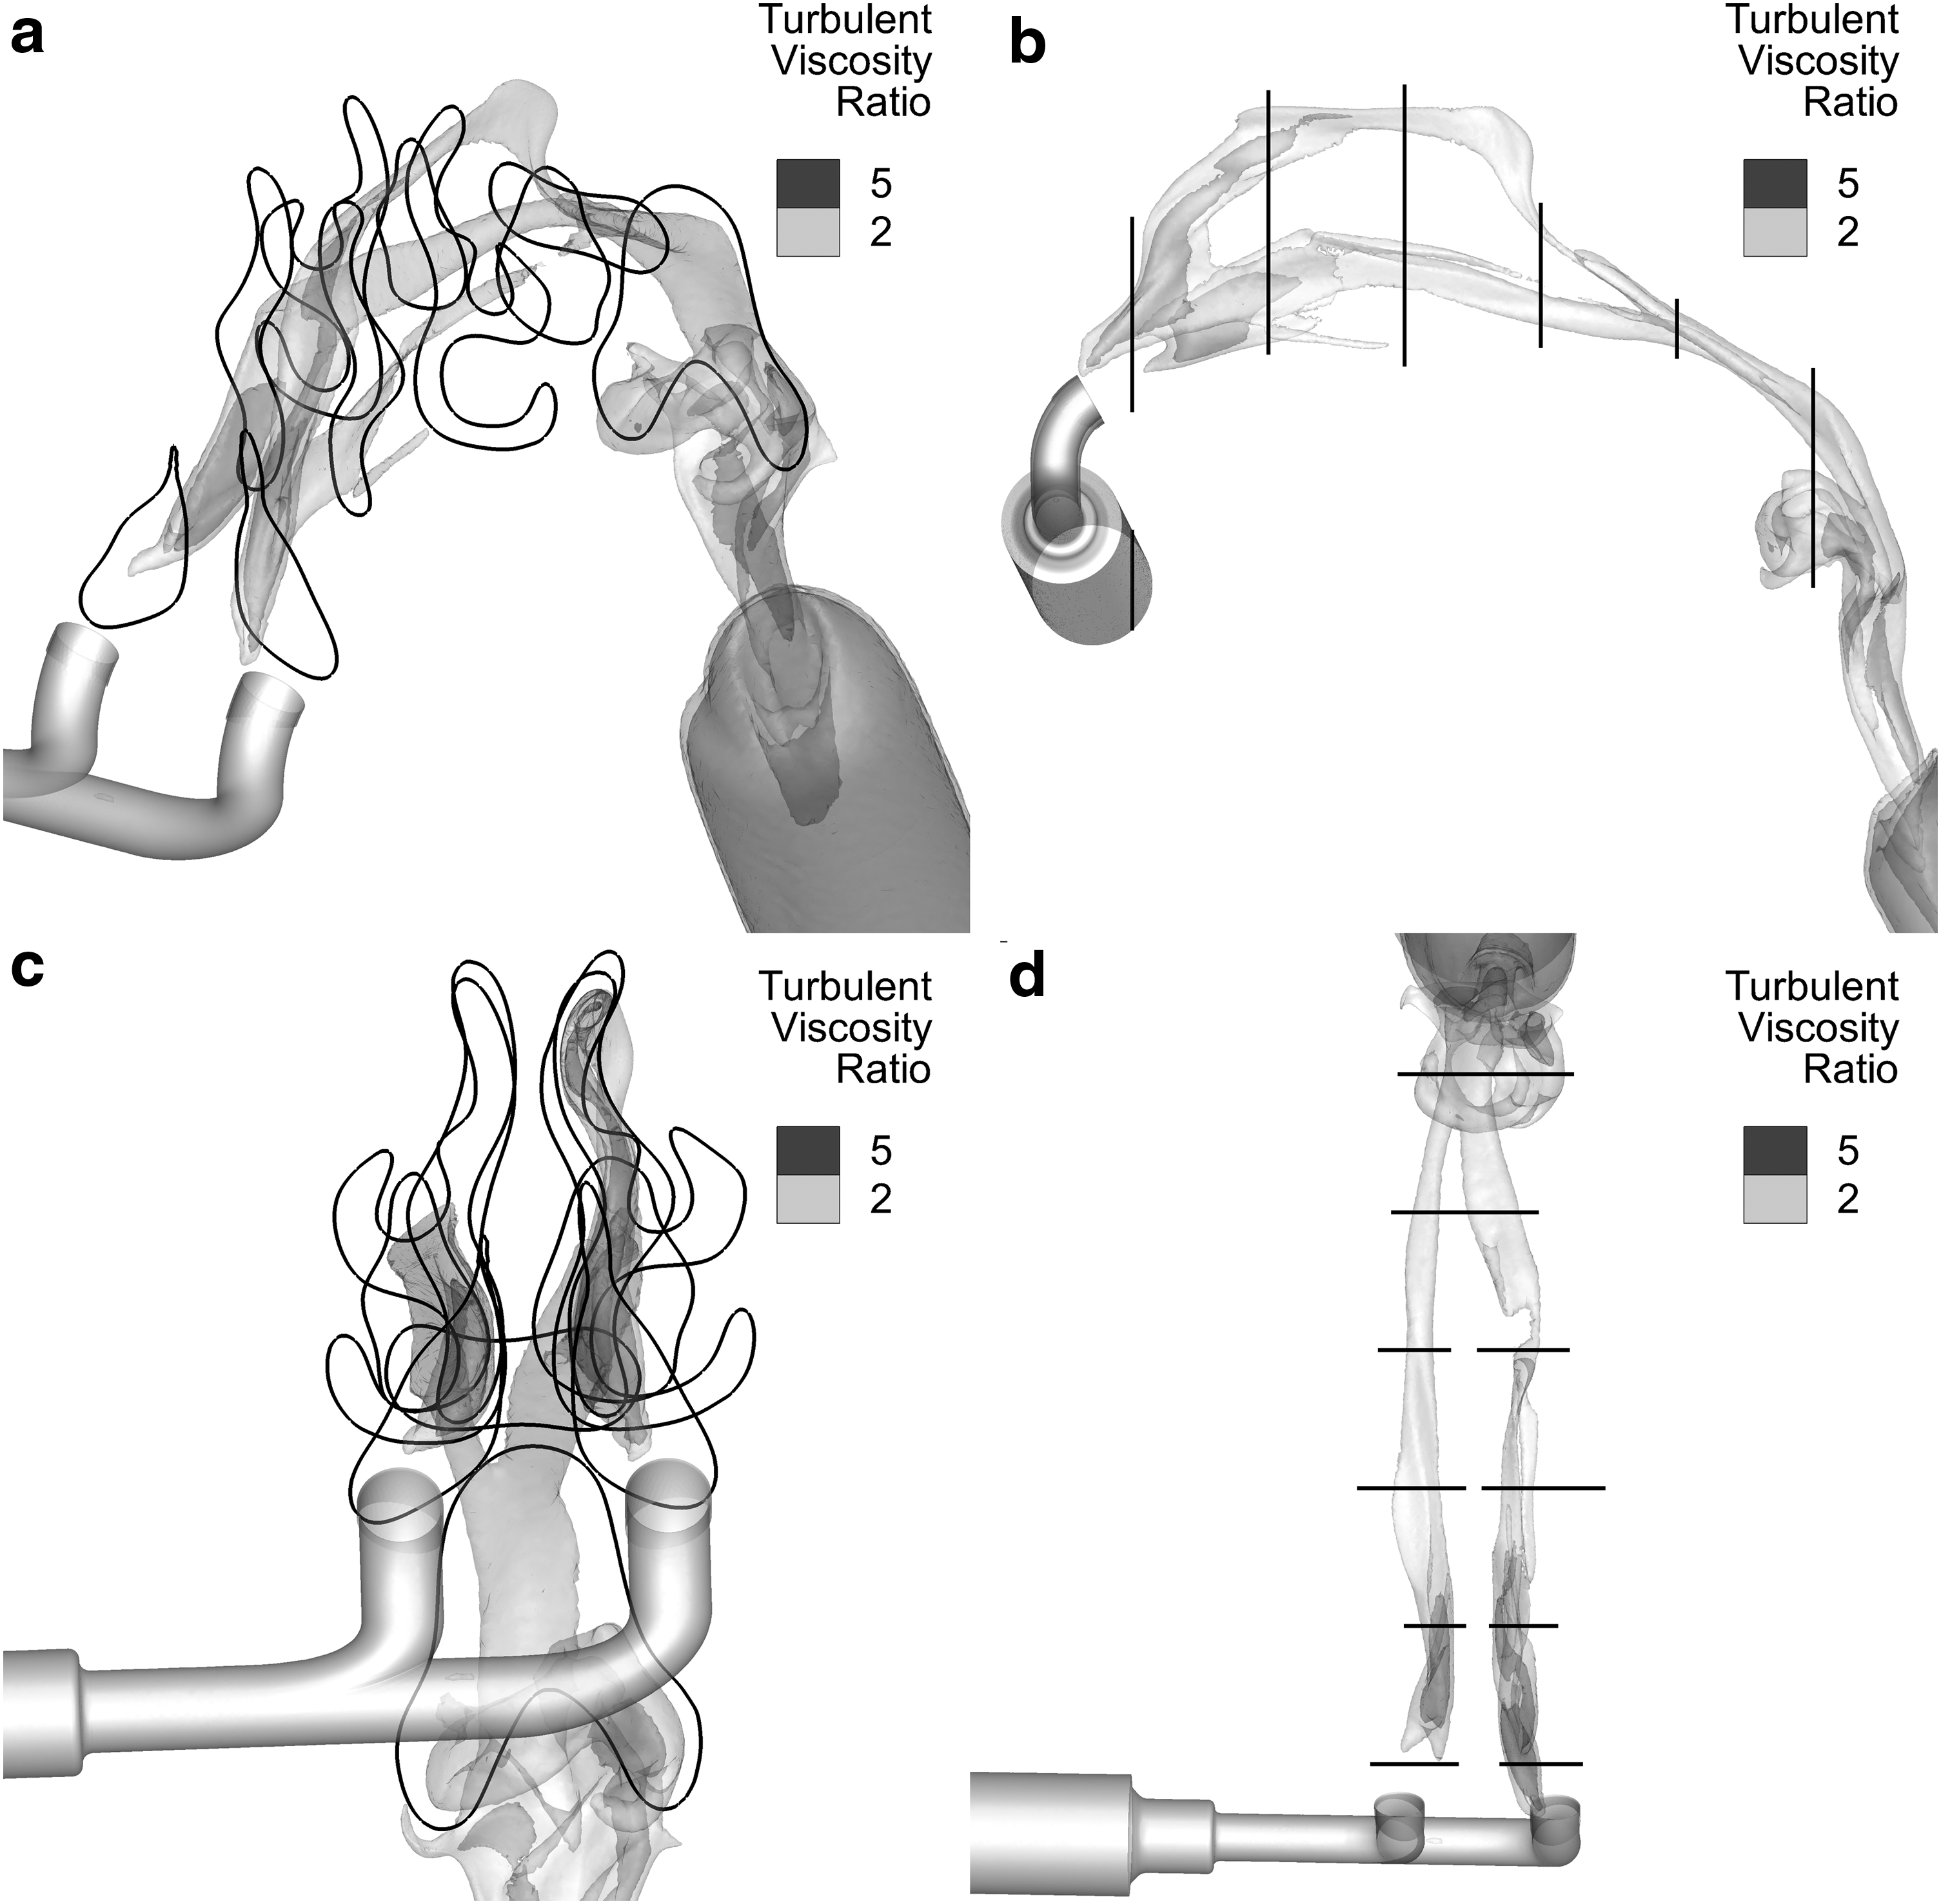
Isosurface plots showing TVR values of 2 and 5 in
Therefore, a turbulence model is required, in this case the LRN k-ω model, to accurately capture the flow conditions in the CFD domain. The inclusion of turbulence in the model also has an influence on particle trajectories and deposition, as the particles interact with both the mean flow and turbulent eddies. It is also interesting to note that the filter connection region exhibits a large amount of turbulent flow, which may reduce the amount of particles that reach the outlet filter and overestimate airway depositional loss compared with the nasopharyngeal region in vivo.
Figure 7 shows the DF as a function of particle aerodynamic diameter (ρp = 1000 kg/m3) for the laminar flow field and turbulent flow field with turbulent particle dispersion, over a span of aerosol sizes. The MMAD of the test aerosol (1.4 μm) is labeled within this span. Interestingly, at this small aerodynamic diameter, there is practically no absolute difference between the laminar and turbulent model DFs. This is because particles less than ∼1.5 μm lack sufficient inertia to remain on the random paths induced by turbulent fluctuations at the low level of turbulence in this flow field. They also lack sufficient inertia to traverse the viscous sublayer that is formed in turbulent flow. Note that the LRN k-ω model captures the viscous sublayer, which in this application has an off-wall height dimension of ∼0.25 mm, or ∼175 times greater than the 1.4 μm particle diameter.
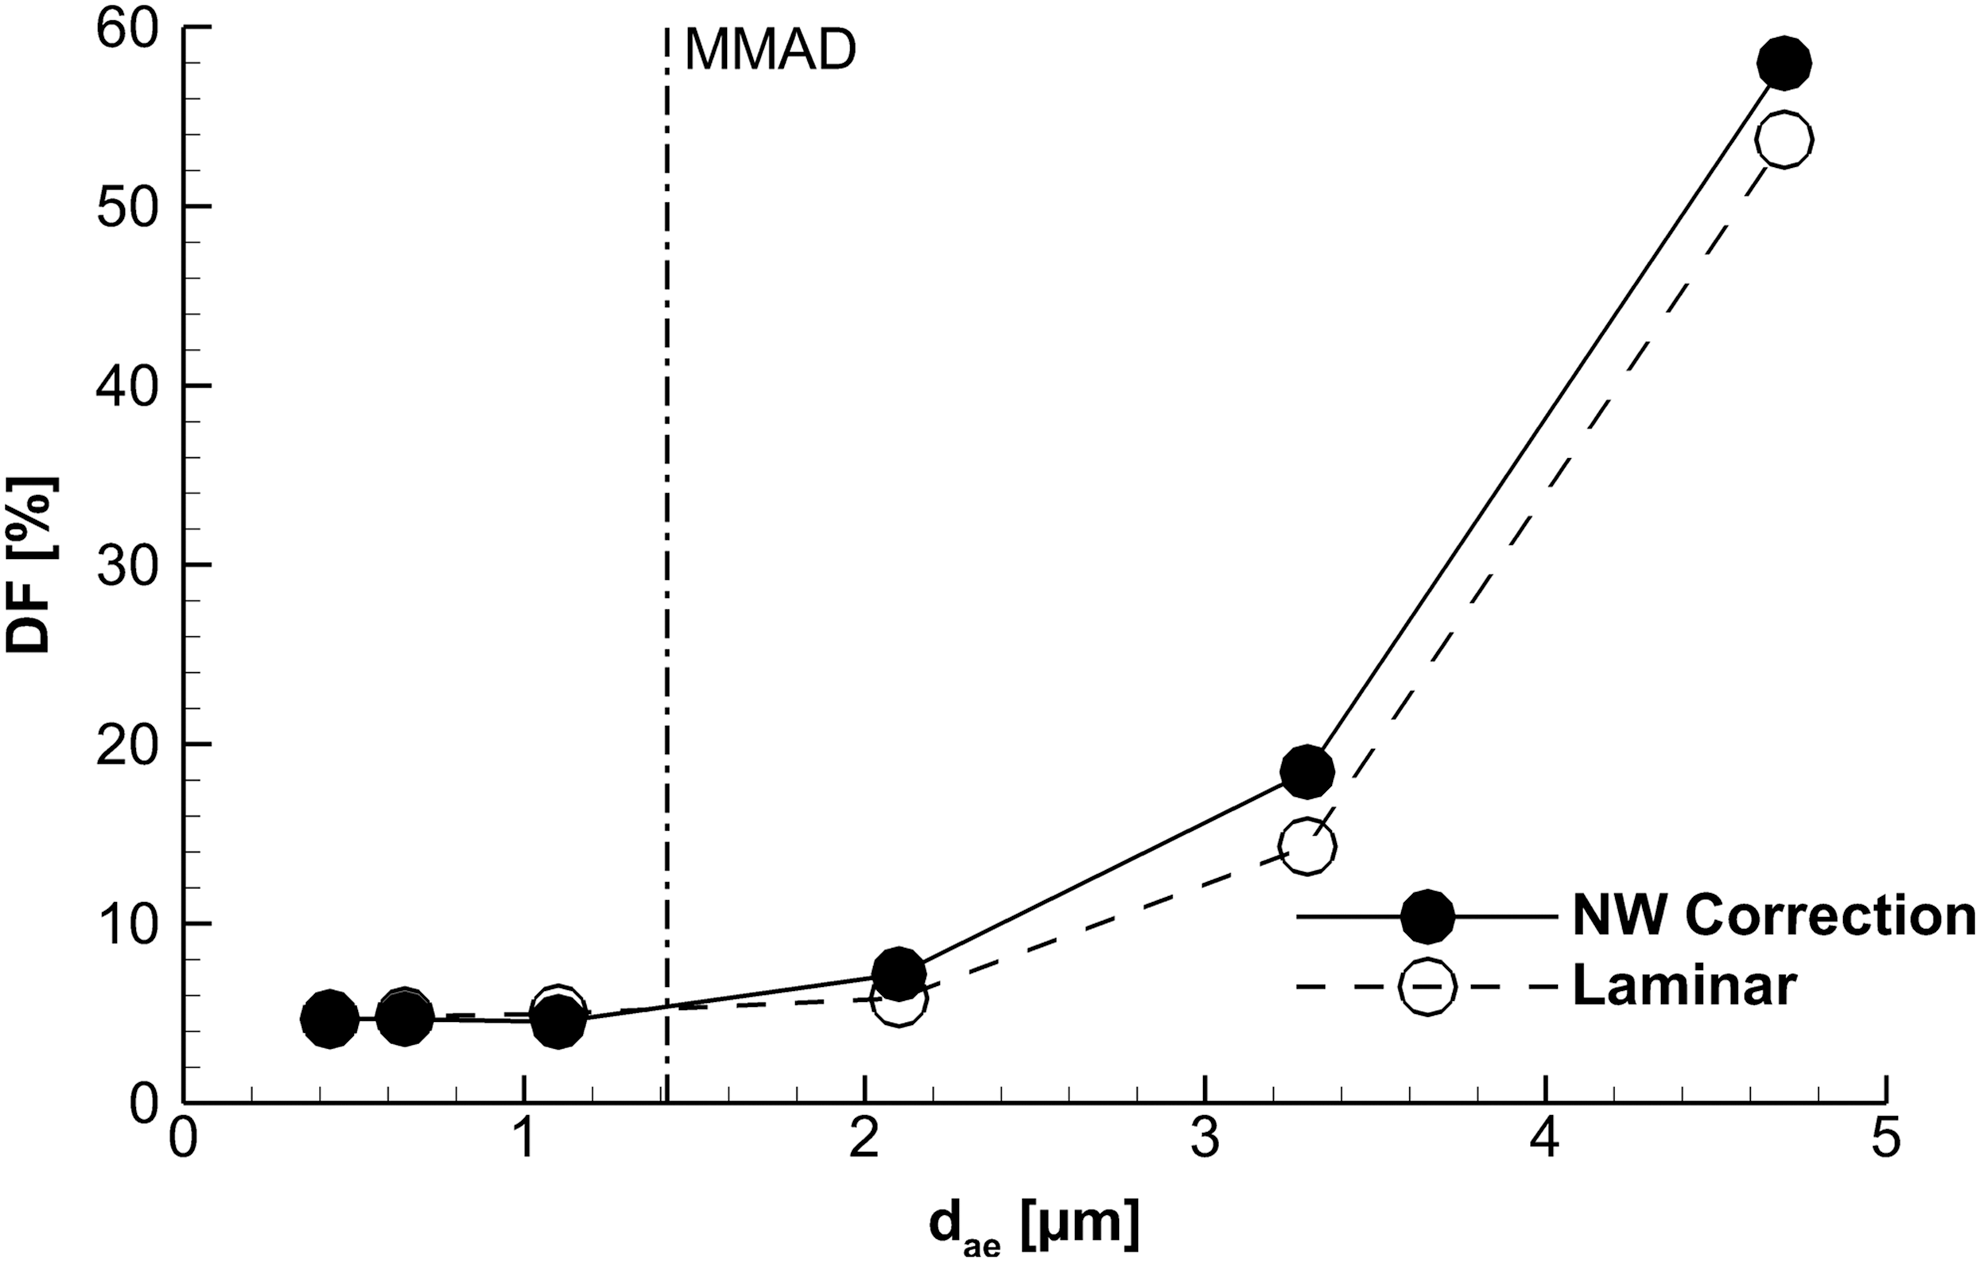
Comparison of DFs for laminar versus turbulent with NW correction cases. DFs are similar between the two cases for small (<2 μm) particles, but as the particle aerodynamic diameter increases (ρp = 1000 kg/m3) the laminar flow field predicts less deposition. DF, deposition fraction; NW, near-wall.
In contrast, as the particle aerodynamic diameter increases beyond 1.5 μm, particles are able to follow dispersion paths and reach the NW region by crossing the viscous sublayer. Therefore, for CFD models of aerosol deposition in the nasal airways to be applicable to the widest range of particle sizes, turbulence models should be included. In this instance, the small size of the test aerosol means that total DFs between laminar and turbulent models are similar. However, for an accurate and realistic representation of the flow field deposition across a relevant particle size distribution (i.e., 1–7 μm), CFD models should include turbulent flow conditions and dispersion.
Comparisons between CFD and experimental data
Comparisons of the CFD monodisperse and polydisperse deposition predictions to experimental data are provided in Tables 2–5. Table 2 presents the DFs for the laminar CFD case, Table 3 is the LRN k-ω case with turbulent particle dispersion deactivated, Table 4 is the LRN k-ω case with turbulent particle dispersion activated, and Table 5 is the LRN k-ω case with turbulent dispersion and NW correction UDFs. The difference parameter (Diff.) is defined as the absolute value of absolute difference between the CFD and experimental data (i.e.,
Summary of Deposition Fractions for the Monodisperse and Polydisperse Aerosol Turbulent Cases with Dispersion Deactivated
Diff. is defined as the absolute value of absolute difference between the CFD and experimental data.
Summary of Deposition Fractions for the Monodisperse and Polydisperse Aerosol Turbulent Cases with Dispersion Activated
Diff. is defined as the absolute value of absolute difference between the CFD and experimental data.
Summary of Deposition Fractions for the Monodisperse and Polydisperse Aerosol Turbulent Cases with Near-Wall Correction User-Defined Functions
Diff. is defined as the absolute value of absolute difference between the CFD and experimental data.
The polydisperse laminar case gives the closest match to the experimental data with an average absolute difference of 0.29% across all regions and a maximum absolute difference of 0.68% in the anterior nose.
However, from Figures 6 and 7 we conclude that turbulence should be included in the CFD model to provide a physically realistic representation of flow through the domain, and be applicable to a relevant range of microparticle sizes. Of the turbulent cases considered, both the monodisperse and polydisperse cases that used NW correction UDFs gave very close matches to the experimental data, with average absolute differences of 0.52% and 0.63%, respectively. It is noted that the NW correction UDFs used a NW limit control parameter of 2 μm on all wall surfaces and for both the monodisperse and polydisperse cases. This NW limit value corresponds well with the 1–2 μm value recommended by Bass and Longest(20) in their previous validation work.
In general, the monodisperse aerosol, which has a particle size 25% larger than the polydisperse MMAD, underpredicts deposition in the proximal regions (nearest the inlet) of the nasal cavity compared with the experimental data and polydisperse deposition.
For example, in the patient interface for the NW correction UDF case, the monodisperse aerosol predicts 1.21% less deposition (absolute difference) than the polydisperse case. In downstream regions, the monodisperse and polydisperse cases compare closely to one another. This is due to the larger particles in the polydisperse aerosol being filtered by the patient interfaces and to some extent the anterior nose, so the size distribution in the later stages is closer to the monodisperse aerosol.
However, using a monodisperse aerosol with a particle aerodynamic diameter that matches the MMAD of the polydisperse aerosol would underpredict both regional and overall deposition in the CFD model. Therefore, using a representative monodisperse aerosol that is 25% larger than the MMAD gives a better approximation of overall deposition.
The close comparison between each aerosol type is apparent in Tables 2–5 and Figure 8, which shows particle deposition sites in the model for the monodisperse (Fig. 8a) and polydisperse (Fig. 8b) aerosols for the laminar flow case. The key difference between Figure 8a and b is that the polydisperse case highlights deposition hot spots that are not apparent in the monodisperse case, in particular the cannula bifurcation and in the nasal cavity close to the left prong. Both cases show a region of deposition at the rear of the nasopharynx, which is expected, as this is the region where the bulk flow undergoes its most abrupt change in direction.
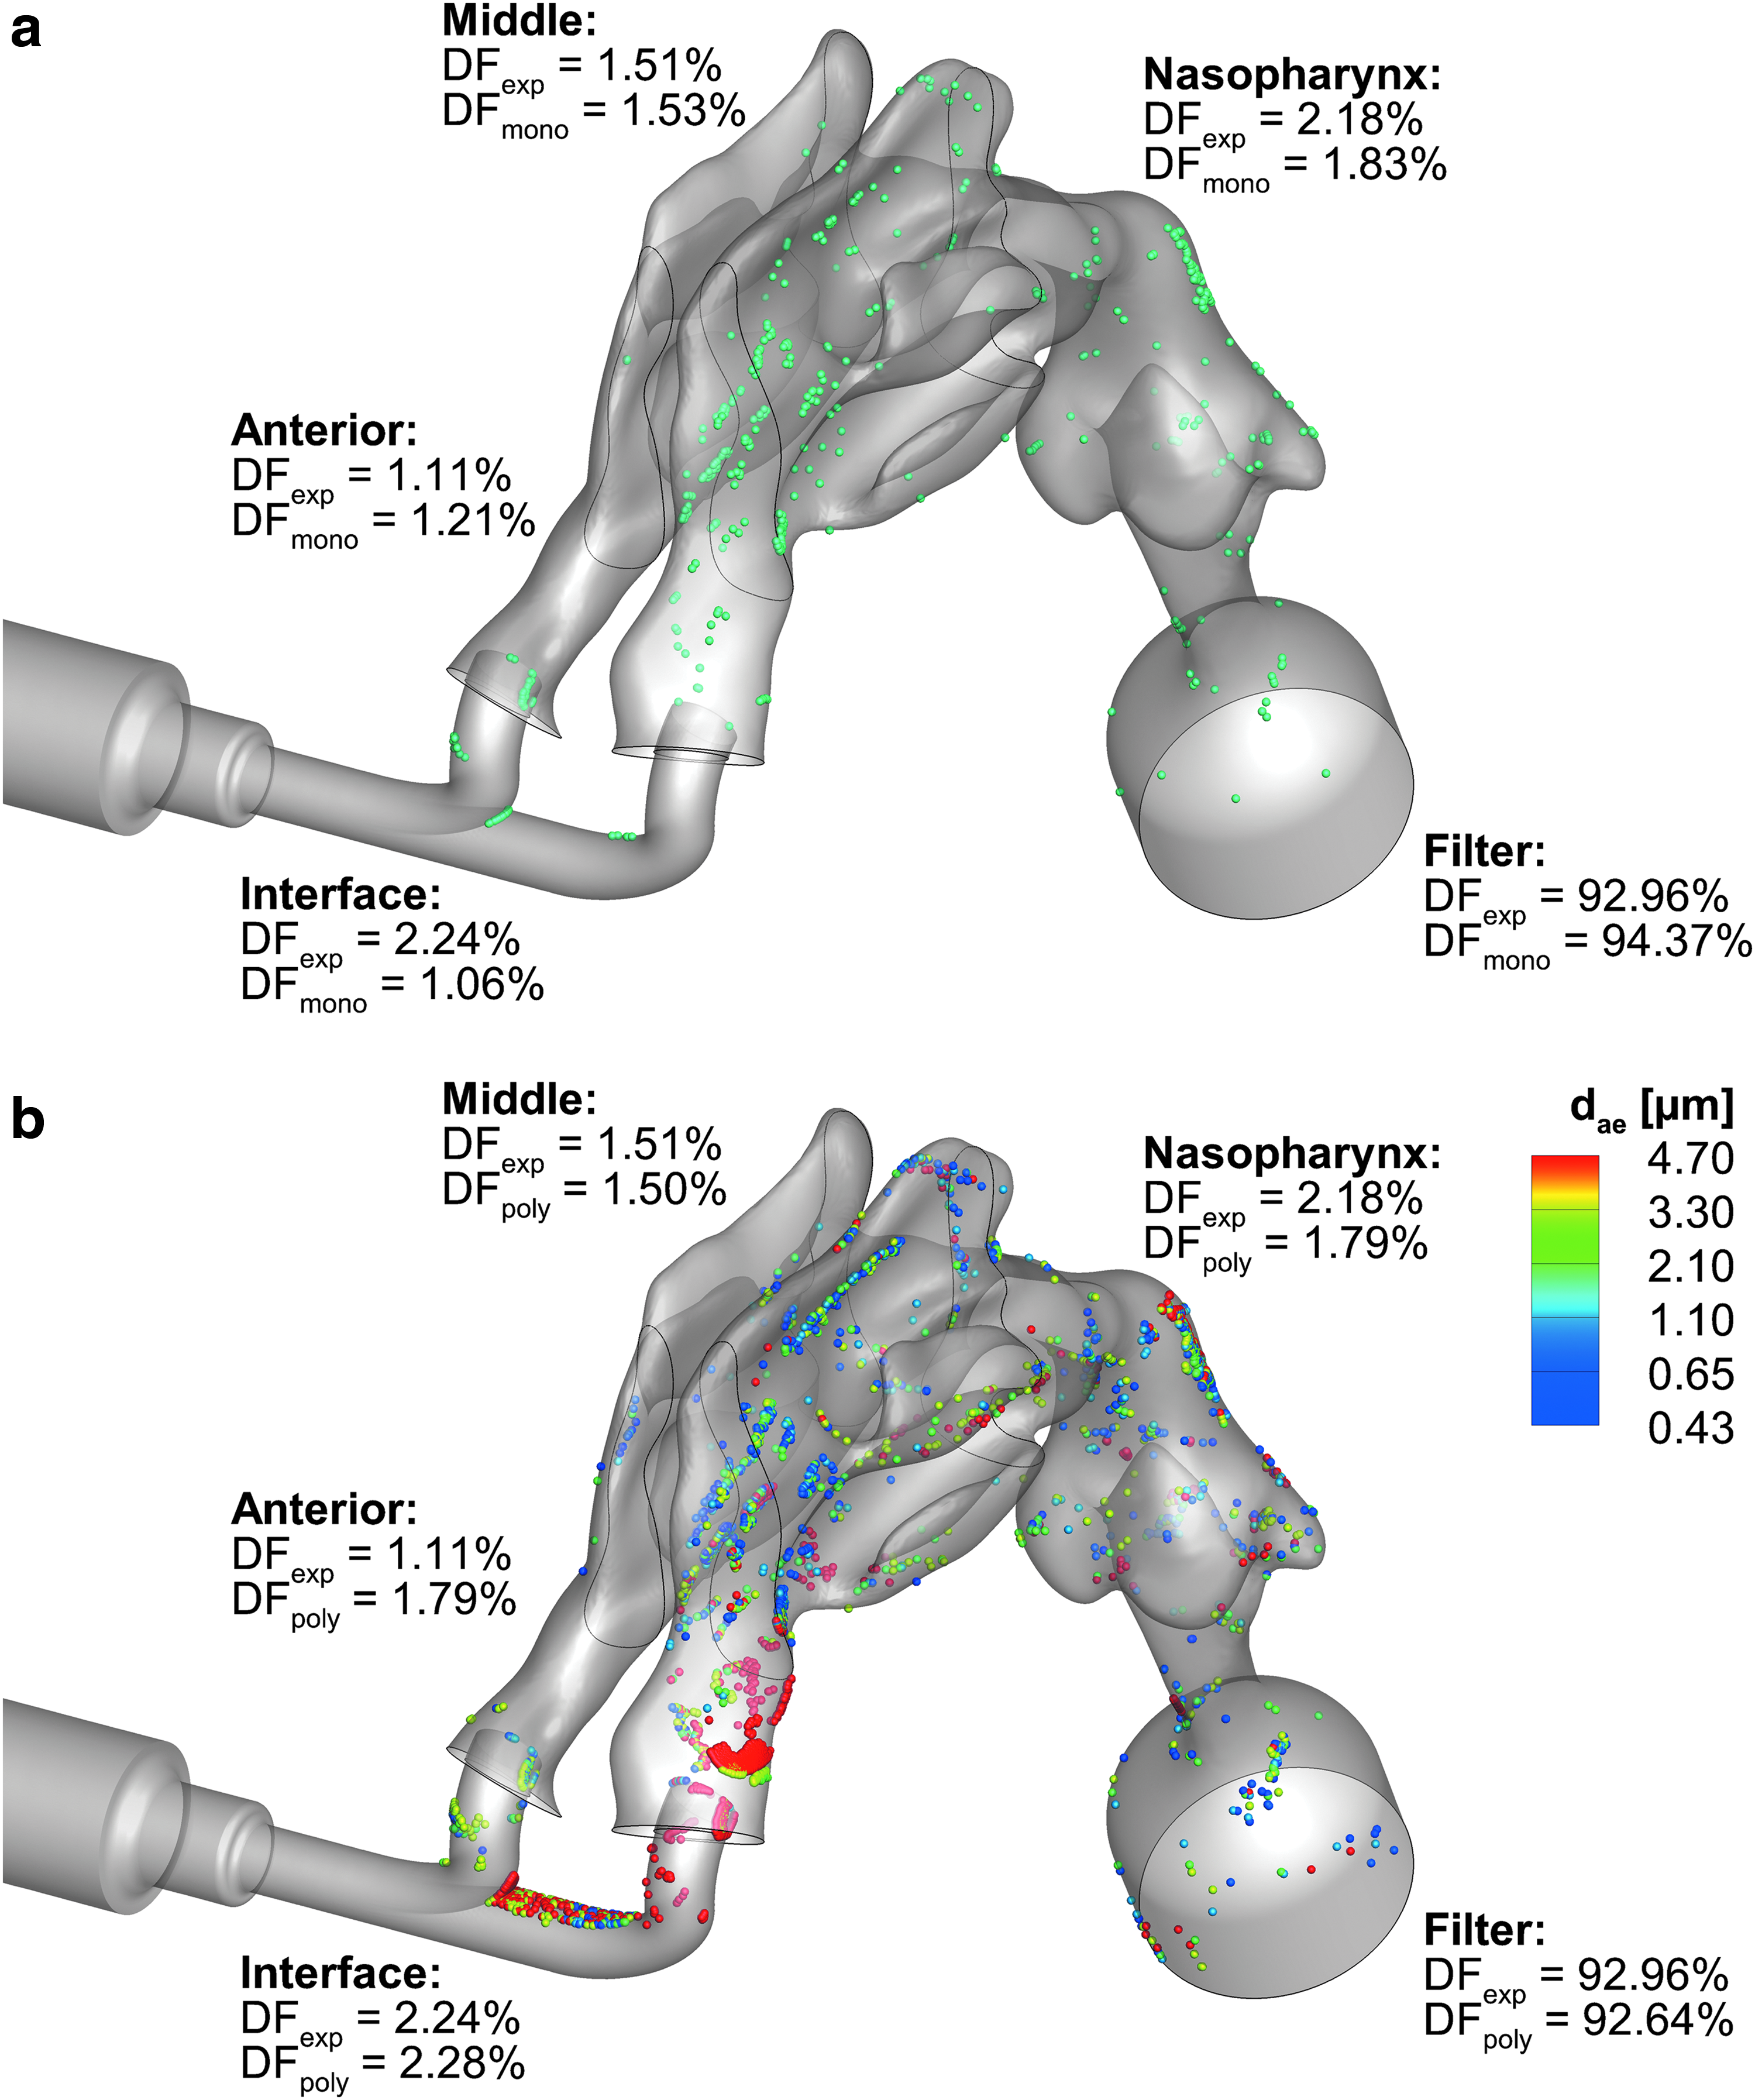
Three-dimensional particle deposition sites, with comparisons to experimental (exp) data, for laminar flow with
Therefore, the polydisperse aerosol provides better physical insight, but the monodisperse aerosol provides good regional deposition results, and reduces computational expense. As such, there are benefits and drawbacks to both approaches that make them desirable for either high-fidelity or high-efficiency models.
Figure 9 compares the deposition in the turbulent flow field between the standard dispersion model (Fig. 9a) and with NW correction UDFs (Fig. 9b). Figure 9b shows that applying the NW correction UDFs, with a NW limit value of 2 μm, provides a better overall match to the experimental DFs, and validates the CFD mesh and solution parameters for infant N2L aerosol administration. The standard dispersion model in Figure 9a tends to overpredict deposition in regions where there is the most change in flow direction, specifically the patient interface and nasopharynx.
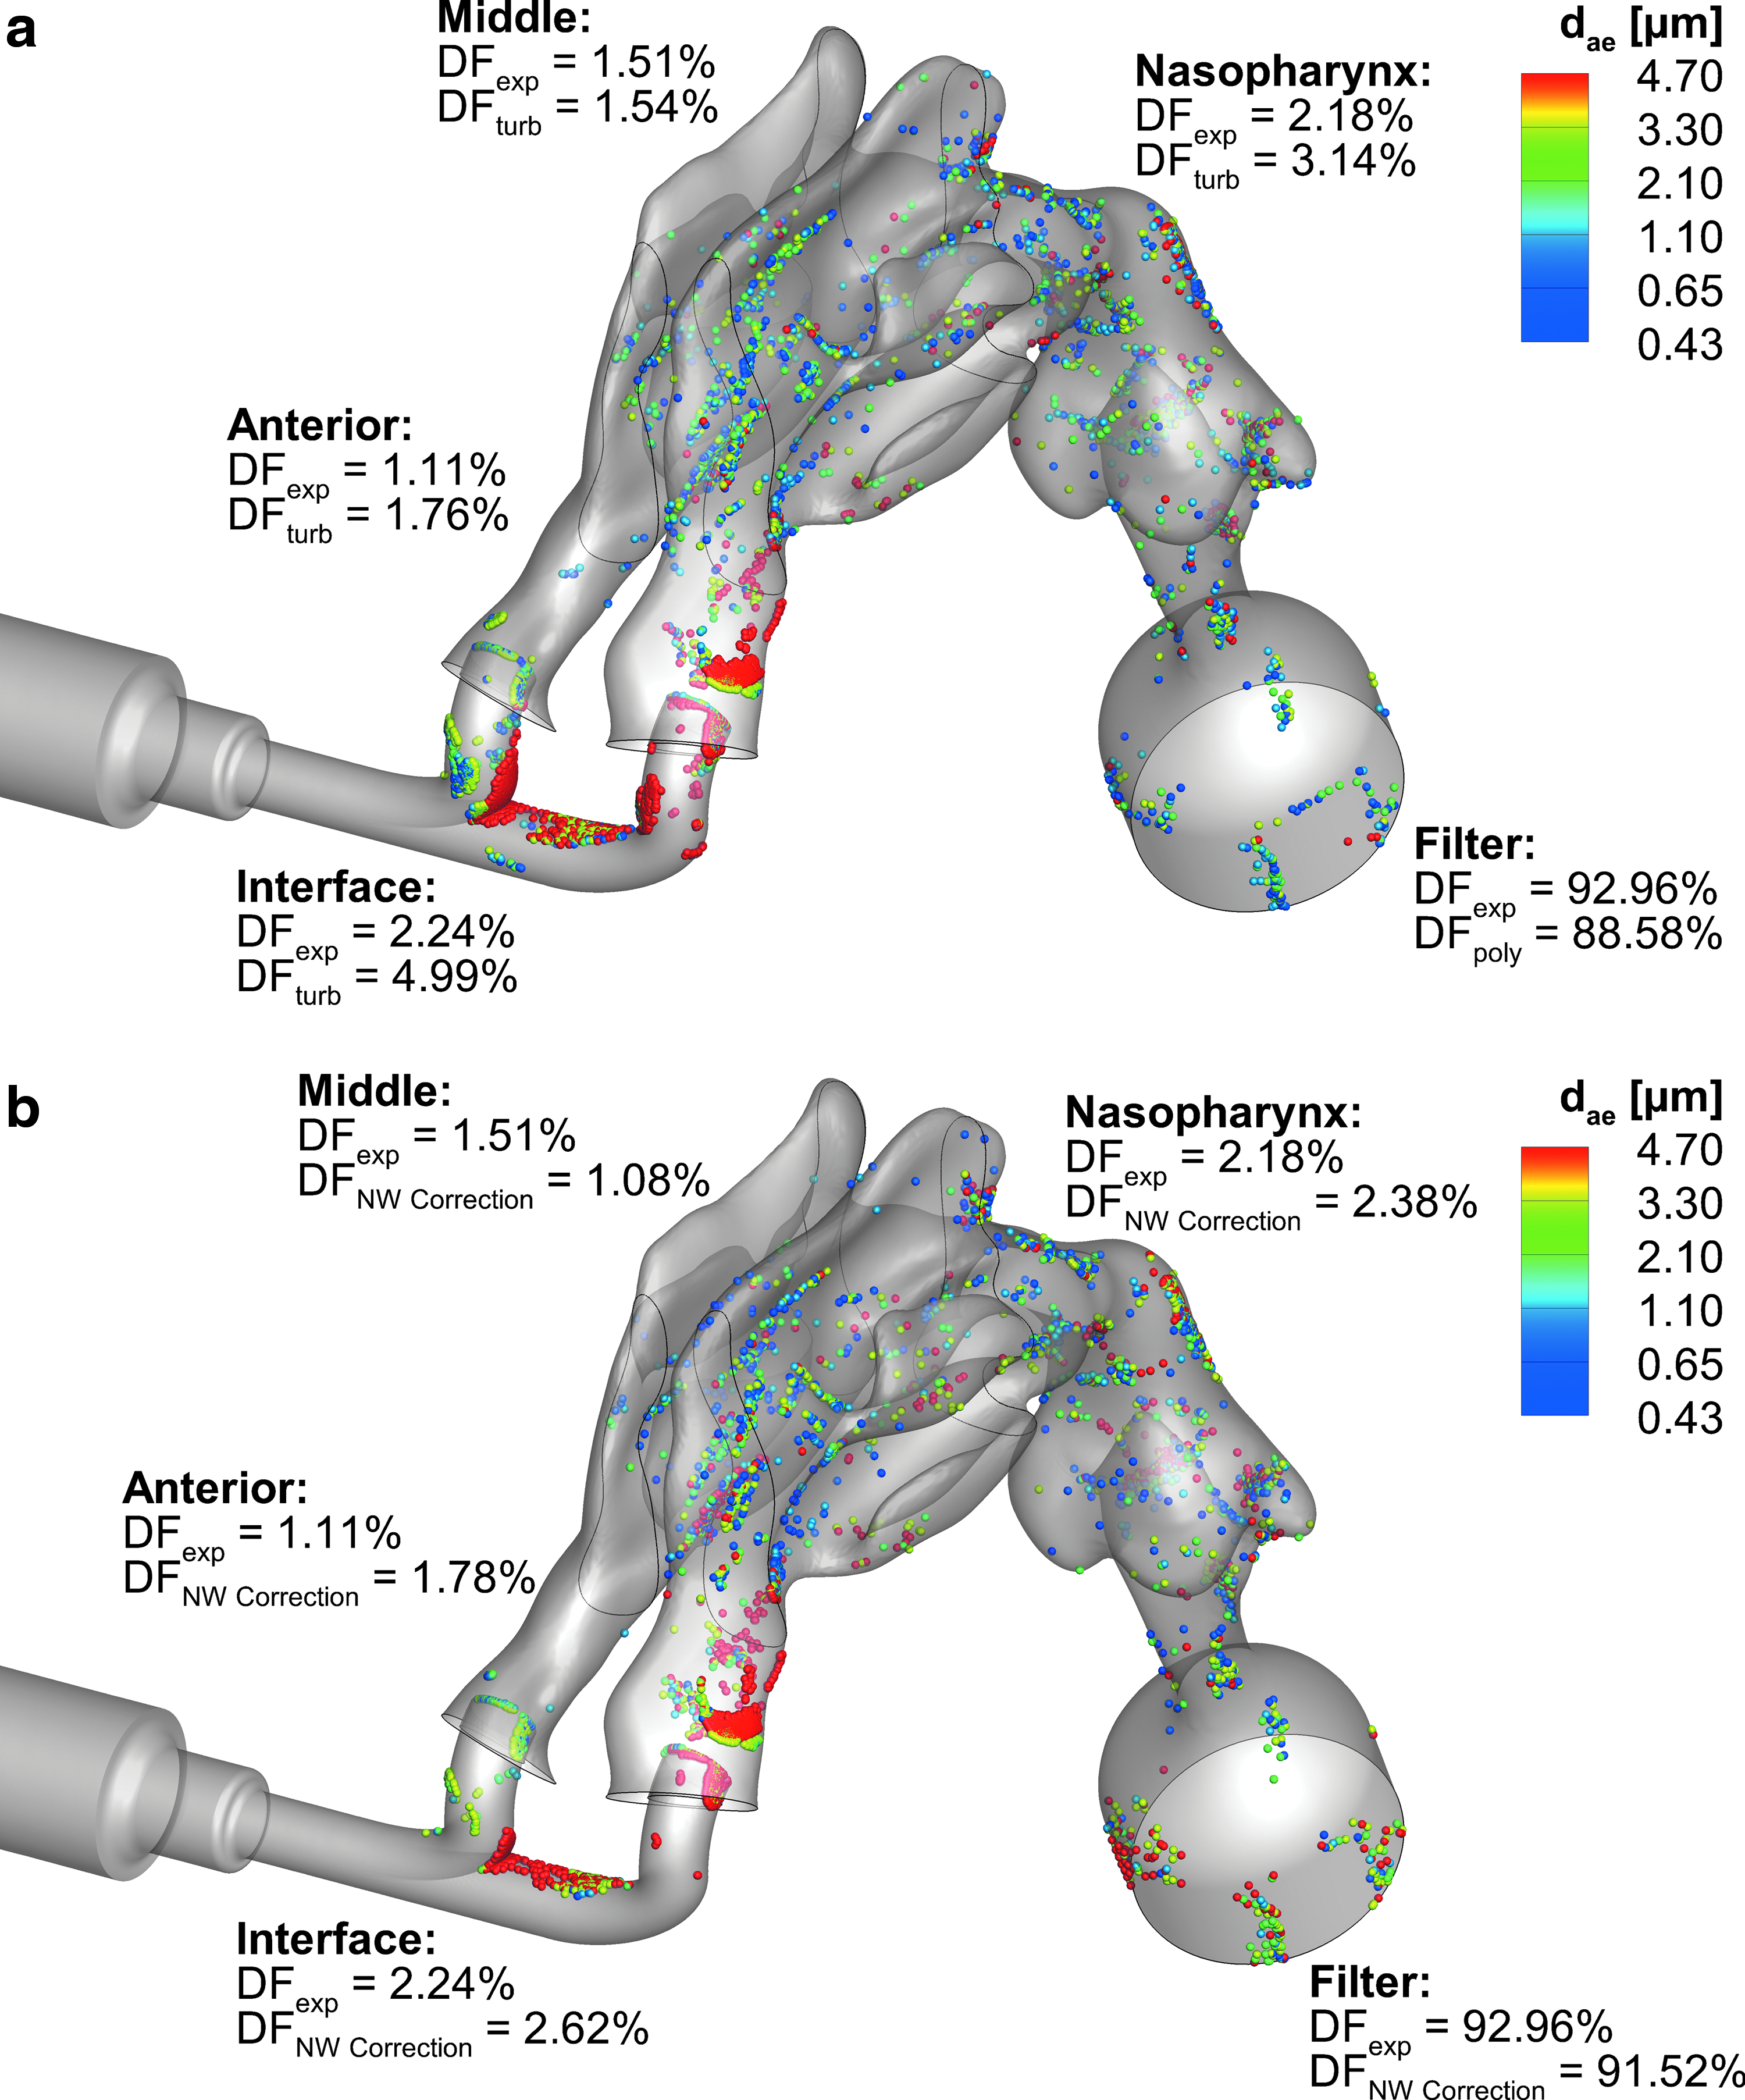
Three-dimensional particle deposition sites, with comparisons to experimental data, for the polydisperse aerosol with
Both of these figures also show a large amount of deposition on the filter connection, which may suggest higher deposition in the in vitro nasopharynx than would occur in vivo. Based on this observation, future in vitro studies should consider a smaller diameter filter size to avoid unnecessary deposition in the filter connection and housing that would not occur in vivo. This region also showed a large amount of flow recirculation, which is not desirable for either a CFD or in vitro model.
Discussion
This study demonstrates that the N2L approach is a viable method for aerosol delivery to infant lungs. The small aerodynamic diameter and low inertia allows a large amount of the aerosol to penetrate the nasal cavity, which results in a lung delivery efficiency of over 90%. The previously developed CFD mesh and solution guidelines from Bass and Longest(20) were found to be appropriate for simulating microparticle deposition in the infant nasal airway based on good matches to experimental DFs. The recommended CFD conditions, which include the LRN k-ω turbulence model with NW corrections and follow the other parameters in Table 1, resulted in an average absolute difference of 0.63% across all regions considered, compared with the experimental results.
The physical insight provided by the CFD model highlights deposition hot spots, specifically at the cannula bifurcation and close to the prong outlets, which can be optimized in future studies to further reduce drug delivery losses in the patient interface and nasal cavity. The particle deposition patterns also show inadequacies in the in vitro model, where deposition on the filter connection suggests higher losses in the nasopharynx than would likely occur without the filter expansion.
A close match between numerical and experimental results is only possible when the numerical model has been appropriately developed and applied. In addition to the fundamental recommendations in Table 1, this nasal cavity simulation required additional key aspects to be considered. The transient nature of the flow recirculation in the filter connection required a time-dependent formulation and solution of the transport equations, despite the experimental model being run under steady-state flow conditions.
While not surprising in hindsight, it is notable that the CFD solution would not converge until the correct physics of the transient oscillatory flow were added to the solution. Correct prediction of particle deposition in the patient interface required an accurate spatial distribution for particle injection into the domain, which matched the outlet diameter of the mixer-heater device. In addition to previous work from our group and others,(37,38) Tables 3–5 show how the NW corrections address the overprediction of microparticle deposition that is present with the standard two-equation turbulent dispersion model, and gives the closest match to experimental data for all turbulent cases considered.
Beyond the meshing and CFD solution parameters, several other approaches to the CFD model set-up were compared and evaluated; specifically, the mesh cell type, whether turbulence is required, and monodisperse and polydisperse particle size distributions. This study evaluated the capabilities of polyhedral cells compared with traditional tetrahedral cells for CFD simulations with complex geometry. The topology of polyhedral cells provides several numerical advantages, and results show that polyhedra provide a converged solution in less iterations with a lower cell count than tetrahedra, while also comparing well to experimental deposition data.
With regard to flow conditions, flow and microparticle deposition in the nasal cavity were evaluated for both the laminar and LRN k-ω models. The laminar flow case provided a good match with experimental DFs, but using the LRN k-ω model gives a more physically realistic flow field and is suitable for a broader range of N2L applications across the relevant microparticle size range. Furthermore, evaluation of TVR showed regions of relatively high turbulence around abrupt changes in cross-section and flow obstructions, which must be accounted for in the CFD model. Viewed another way, running the nasal simulation as a laminar flow would be equivalent to conducting a physical experiment with a gas that had a viscosity two to five times below that of air (which does not exist), and assuming the fluid was air.
The results compared both monodisperse and polydisperse aerosol deposition, where the monodisperse aerosol was represented with a particle size that is 25% larger than the MMAD of the polydisperse aerosol. The CFD model showed that the monodisperse aerosol can be comparable to polydisperse and experimental data for total and regional deposition. However, the polydisperse aerosol highlights deposition hot spots that are not apparent in the monodisperse case. Therefore, monodisperse aerosols are useful in the model development phase, as they required less computation time, but more accurate results require a polydisperse size distribution, which enables additional useful insights.
As a secondary objective, this study demonstrates high-efficiency N2L delivery using an aerosol with a small initial size (MMAD of 1.4 μm). The aerosol was produced with a mixer-heater similar to the study of Longest et al.,(39) but with a lower device volume and using a reduced nebulizer output. The primary advantage of this mixer-heater system is that it employs a commercial mesh nebulizer, but uses heating elements to dry the droplets into smaller particles while maintaining a temperature and RH that are safe for direct inhalation. Using this approach, lung delivery efficiencies greater than 90% of the aerosol that enters the connection tube were demonstrated in a 6-month-old airway model under steady-state flow conditions.
In comparison to other aerosol studies with infant conditions, Lin et al.(40) used a commercially available vibrating mesh nebulizer and humidifier, and evaluated delivery flow rates of 3, 6, and 12 L/min across two different face masks for a nasal model of a 2-year-old subject. They reported MMADs of 2.8–3.3 μm exiting the face mask, and an inhaled mass of 2.8%–6.4% (expressed as a percentage of dose loaded in the nebulizer). El Taoum et al.(5) compared numerous scenarios for a 7-month-old model, including seven different patient interfaces, jet and vibrating mesh nebulizers, and three breathing patterns. In their study, lung doses (as a percent of nominal dose) ranged from <0.001% to 2.97%, but aerosol MMADs were not reported.
Regarding nasal cannula systems, Sunbul et al.(41) evaluated HFNC, Bubble CPAP, and SiPAP systems on a 26-week-old model (∼6 months) with different nebulizer positions, and found optimized lung doses (as a percent of nominal dose) of 0.79%–1.30%. Réminiac et al.(7) studied nasal high-flow nebulization both in vitro and in vivo using the SAINT infant airway model(42) and a nonhuman primate (macaque) for jet and vibrating mesh nebulizers, which were also placed in different locations within the system and with varying flow rates. They reported low aerosol MMADs at the cannula outlet, similar to the present study, from 1.05 to 1.43 μm. However, they also reported low lung doses ranging from 0.03% to 0.85% in vivo and 0.46% to 4.15% in vitro, due to high system losses in the humidifier, tubing, and cannula.
The aerosol size considered in the current study is similar to that recommended by Longest et al.,(12) who demonstrated 45%–60% lung deposition in an infant model of invasive mechanical ventilation. A recent correlation from Tavernini et al.,(9) which built upon work from Storey-Bishoff et al.,(8) estimates that for the monodisperse case presented in the current study, ∼1.23% of particles that enter the nostril will deposit in the nasal cavity and nasopharynx. Furthermore, Clark et al.(43) demonstrated the need for using smaller aerosol sizes to maximize lung aerosol delivery to preterm infants. However, it is noted that only excipient-enhanced growth (EEG) aerosol delivery offers a method to retain small particles or droplets, once they are inhaled and enter the lung airspace.(15,44,45)
One significant challenge in evaluating the agreement between CFD predictions and the experimental results is selecting a basis of comparison. Calculating relative differences, in which the difference between the experimental results and CFD predictions is normalized by the experimental results, is the gold-standard approach and has been used in a number of our previous studies.(13,16,18,19,36,46–48) While technically more stringent, the use of relative differences may present too high a hurdle and mask acceptable model performance in regions of low deposition.
For example, CFD predictions may capture deposited mass to within 1% absolute difference; however, if the experimental result is 1%, then the relative difference is 100%. Similarly, if the experimental result is 2% and the CFD prediction is again within 1% absolute difference, the relative difference is reported as 50%. In both cases, only 1% of drug mass is miscalculated, but relative differences give a potentially misleading and very different characterization of model performance. In contrast, the absolute difference better represents the physical implications of numerical inaccuracies when dealing with drug mass and very low DFs.
For example, a 1% absolute error shows directly that the model only miscalculated the deposition of 1% of the drug mass, and this is true regardless of the experimental value deposited. The intended purpose of the CFD model in this study is to capture the very low depositional losses in the system delivery components and extrathoracic airways. Comparison with experimental results is therefore best accomplished with the use of absolute differences.
A drawback to delivering small particle aerosols intended to reduce depositional losses is that a large fraction of the aerosol is exhaled. For example, Longest et al.(12) showed that 40% or more of an inhaled small particle aerosol was exhaled from an infant lung model. The N2L delivery method developed in this study is intended to be combined with an EEG(15,44,45,49) strategy. Using this approach, small particles are composed of a drug and a hygroscopic excipient. Once in the lung, the hygroscopic excipient absorbs water vapor significantly increasing droplet size and enhancing deposition.
Our group has previously validated CFD predictions of EEG droplet size increase in comparison with in vitro experimental data.(15,50) As reported by Walenga et al.,(11) aerosol size growth for EEG particles only increases nasal deposition loss by ∼0.1% in adults. A similar small increase is expected in infant nasal airways. As a result of small expected change in nasal deposition associated with true EEG particles, the current study has focused solely on deposition. Hence, a hygroscopic excipient was not included in the formulation, and humidified airways were not included in the in vitro experiments and simulations. Furthermore, the CFD simulations held particle size static.
Future studies will assess the hygroscopic growth of EEG particles for medications relevant to infant delivery. The current study provides a basis for these future studies by first establishing best practices for capturing particle deposition. Moreover, based on previous observations, we do not expect particle growth to substantially affect the results of this study.
A potential limitation of the current study is the consideration of only one set of experimental conditions. Recent studies by our group (yet to be published) have demonstrated that clinically relevant changes in cannula flow rate (4 L/min vs. 6 L/min) do not significantly alter nasal deposition for sufficiently small particles (∼1.5 μm). Moreover, intersubject variability in nasal airway deposition is expected to be substantially reduced at low deposition values, as observed in adults.(11) As a result, for the purpose of validating small particle deposition in an infant model, we chose to focus on one set of experimental conditions and evaluate deposition within different regions of the system, providing multiple points for comparison.
In addition to low absolute difference between experimental and model results, the model successfully predicted minimum and maximum deposition across these different regions. Correct predictions of minimum and maximum regional deposition were observed for all CFD cases, where a polydisperse aerosol was used. Therefore, we expect the model predictions are accurate and the CFD model will remain capable of capturing experimental results, provided that the physics of the flow field remain consistent, with laminar and low-level turbulent flow, and small particle aerosols.
A primary limitation of the current study is the use of steady-state inlet and outlet boundary conditions in both the experimental and numerical models. Infants have very short inhalation times. Therefore, efficient aerosol delivery will require synchronizing aerosol generation from the nebulizer with a portion of the inhalation period. The effective synchronization of the aerosol delivered to an infant was recently demonstrated by Dhapare et al.(51) An additional limitation is the absence of a hygroscopic excipient in the test aerosol.
As mentioned previously, the aerosol delivered to the experimental model had similar particle aerodynamic diameter to EEG aerosols, but used 0.5% w/v albuterol sulfate instead of an EEG formulation. Previous studies have shown that particle size increase has an influence on upper airway deposition,(11,52) although we expect this increase to be negligible in the nasal airways.(11) Furthermore, higher flow rates are not considered, as clinicians typically use between 1 and 2 L/(min·kg) (given as flow rate per subject weight). Higher flow rates would potentially lead to increased extrathoracic losses.
This study has expanded recommendations for the accurate simulation of particle deposition during N2L aerosol delivery. Using these recommendations, close agreement between the CFD predictions and in vitro experimental results of regional drug deposition was attained. This study has also further demonstrated how a concurrent CFD and in vitro approach(14,17) can lead to valuable insights regarding drug delivery strategies. Finally, the validated CFD model now provides a useful tool to further understand and improve the N2L approach for administering pharmaceutical aerosols to infants.
Footnotes
Acknowledgments
The research reported in this publication was supported by the Eunice Kennedy Shriver National Institute of Child Health & Human Development under award number R01HD087339, and by the National Heart, Lung, and Blood Institute under award number R01HL139673. The content is solely the responsibility of the authors and does not necessarily represent the official views of the National Institutes of Health.
Author Disclosure Statement
Virginia Commonwealth University is currently pursuing patent protection of excipient-enhanced growth aerosol delivery, aerosol generation devices, and patient interfaces, which if licensed, may provide a future financial interest to the authors.
Andrew Martin
Ira Katz