
Abstract
Abstract
Background:
In this study, we proposed an averaged airway model design based on four healthy subjects and numerically evaluated its effectiveness for predicting the airflow and particle transport through an airway.
Methods:
Direct-averaged models of the conducting airways of four subjects were restored by averaging the three-dimensional (3D) skeletons of four healthy airways, which were calculated using an inverse 3D thinning algorithm. We simulated the airflow and particle transport in the individual and the averaged airway models using computational fluid dynamics.
Results:
The bifurcation geometry differs even among healthy subjects, but the averaged model retains the typical geometrical characteristics of the airways. The Reynolds number of the averaged model varied within the range found in the individual subject models, and the averaged model had similar inspiratory flow characteristics as the individual subject models. The deposition fractions at almost all individual lobes ranged within the variation observed in the subjects, however, the deposition fraction was higher in only one lobe. The deposition distribution at the main bifurcation point differed among the healthy subjects, but the characteristics of the averaged model fell within the variation observed in the individual subject models. On the contrary, the deposition fraction of the averaged model was higher than that of the average of the individual subject models and deviated from the range observed in the subject models.
Conclusion:
These results indicate that the direct-averaged model may be useful for predicting the individual airflow and particle transport on a macroscopic scale.
Introduction
The study of the airflow in airways has become increasingly popular in the recent decades. One medical application of this field of research is maximizing the effects of pharmaceutical aerosols at the intended site. To do this, experimental and numerical studies to predict the airflow and particle deposition patterns are needed.(1) These biomechanical phenomena depend on the complicated anatomical geometry of the airways, which comprise tapered, curved, and branching tubes of varying lengths and diameters.
Recently, a few studies have been conducted by directly reconstructing realistic airway models from computed tomography (CT) images and computational fluid dynamics (CFD) data.(2–11) Such image-based models can provide subject-specific information, but they do not provide any insights into the general population because real airways are very irregular and differ in geometry, even among healthy subjects. The interindividual differences may also make it difficult to interpret and compare the results from different studies. For example, it has been shown that intersubject differences between the nasal cavities and upper airways affect the airway flow and particle deposition patterns.(12,13)
Features of the anatomical airway geometry, such as the diameter and length between progressive airway generations (i.e., division points), were reported stochastically based on ex vivo measurements of lung casts around 1970.(14,15) These measurements have been utilized to create anatomical models, and numerical experiments and simulations have been conducted to investigate the general characteristics of airflow(16–21) and particle deposition.(22–26) Nowak et al. simulated the airflow and particle deposition in an idealized lung model based on a cast model(27) and a CT image-based model to validate the idealized model. The results showed that the idealized model was inadequate for predicting the particle deposition.(27)
However, in this previous study, the idealized model was symmetric, and the branching and azimuthal angles were assumed to be the same for all bifurcations, which is not the case in the CT image-based model, resulting in different results from the two models. On the contrary, more realistic geometries have been modeled based on CT imaging(28–31) and magnetic resonance imaging.(32) The airway geometry has been calculated based on the three-dimensional (3D) skeleton of such segmented airway images.(28,33,34) For example, Sauret et al.(28) derived not only the diameter and length of the airways but also the 3D branching angle from the CT images.
However, because the complicated bifurcation geometry, such as the curvature, is not yet fully understood, the airway models reconstructed from these data comprise tube-like geometries and, thus, do not fully capture the true airway geometry.(34) Because the bifurcation geometry strongly influences the airway and particle deposition, the simulation results obtained using a model with tube-like geometry may differ from what actually occurs.
The direct creation of an averaged airway model based on several subjects is expected to be more useful than the existing models because not only the airway length and diameter but also the curvature can be averaged and the bifurcation is not a tube-like geometry. It is also necessary to evaluate how well the averaged airway model can represent the airway of an individual. In this study, we directly reconstruct an averaged model from four CT image-based models and investigate whether this averaged model can be used to predict the pulmonary function, specifically the airflow and particle transport, of each subject. To create the model, the 3D skeleton of the model of each individual was calculated using a 3D thinning algorithm. Then, the averaged model was reconstructed from these skeletons using a reverse 3D thinning algorithm.
Materials and Methods
Airway model
In this study, the CT images of the thoraxes of four healthy Japanese male subjects, A1, A2, A3, and A4, with ages 51, 41, 45, and 54, respectively, were obtained at total lung capacity (TLC). Their heights ranged from 166 to 169 cm. The resolutions of the CT images were 0.49 × 0.49 × 0.5 mm (A2 and A3) and 0.96 × 0.96 × 1.0 mm (A1 and A4). The study protocol was approved by the Research Ethics Third Committee of RIKEN Wako Branch (Approval No. Wako3:25–28). The airway regions were segmented by the 3D region growing method using Amira Software (Visage Imaging, Berlin, Germany). The generation of the segmented airway was 6 based on a function of Weibel generation, and the generation of trachea was 0 and increased by one when the airway branched according to “generations down.”(14)
After segmentation, the airway skeleton and branching points were calculated using a 3D thinning algorithm(35) (Amira Software; Visage Imaging) without changing the topology. A distance map was first created from the segmented image using an algorithm that calculates the value of each voxel as the distance between that voxel and the nearest boundary voxel. Then, the algorithm removed voxels one by one from the segmented regions until only a string of connected voxels (i.e., a skeleton) remained.
Hence, the Euclidean distance to the nearest boundary was determined for each skeleton voxel; this value can be interpreted as the local diameter (i.e., the diameter of a sphere superimposed onto the airway at that position). Due to the use of the 3D thinning algorithm, the presence of complicated geometrical features, such as the bifurcation, sometimes resulted in fake skeletons that were unrelated to the airway bronchi; these fake skeletons were deleted manually.
Next, the averaged skeleton (B-) was calculated based on the airway skeletons of the four subjects. Each of the four airway models comprised 45 airway segments. Thus, to create the averaged model, each segment was discretized into equal and uniformly spaced voxels to accurately represent the curvature. The origin was defined as the branching point of the main bronchi, and the voxels of each segment were averaged at their origin. Each segment was then shifted based on the average starting branching point of the segment, and the coordinates and Euclidean distances of all segment voxels were again averaged.
Finally, the averaged airway model (B) was obtained from the averaged skeletons and Euclidean distances using an inverse 3D thinning algorithm (Amira Software; Visage Imaging). Since the Euclidean distances of the skeleton voxels represent the local diameters, the inverse 3D thinning algorithm forms a sphere centered on each voxel of the skeleton with a diameter equal to the corresponding Euclidean distance to reconstruct the 3D geometry (Fig. 1(1)).
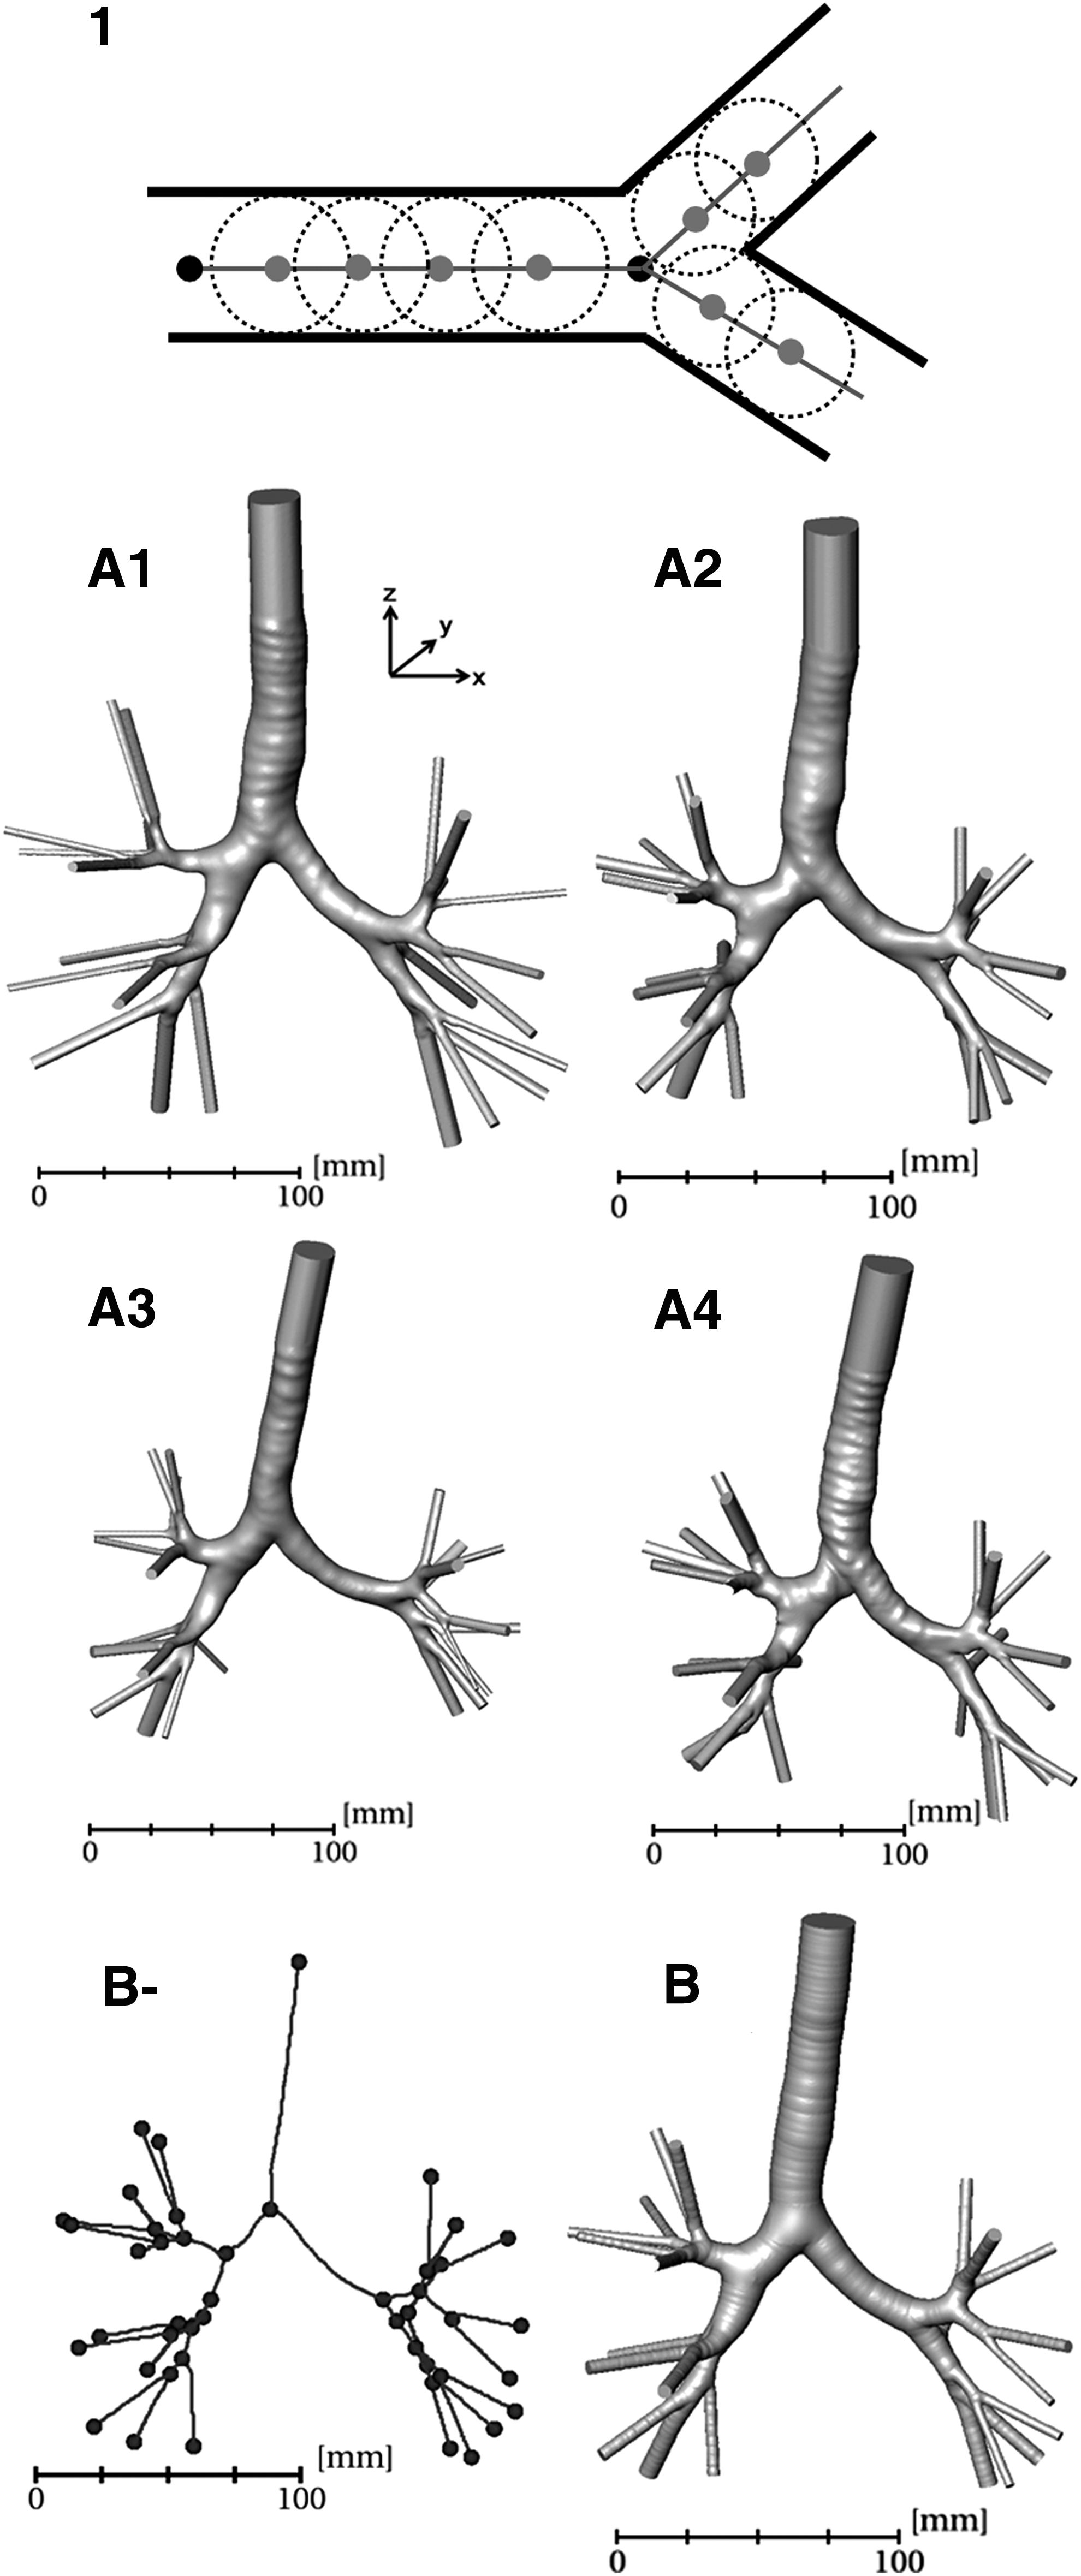
The individual models
Figure 1 shows the individual airway models (A1–A4) and the averaged model (B). Figure 2 shows the generalized schematic of the airway geometry, and Table 1 shows the parameters of this representative airway geometry. There were small variations among the healthy subjects (Table 1). Model A1 had a slightly larger airway than the others and the largest trachea. Model A3 had relatively a small airway and the narrowest and shortest trachea; however, the left main bronchus of this model was longer than that in the others. The airway geometry has been reported based on the measurements of casts,(14,15) high-resolution CT,(28–31,33,34) and magnetic resonance imaging.(32)
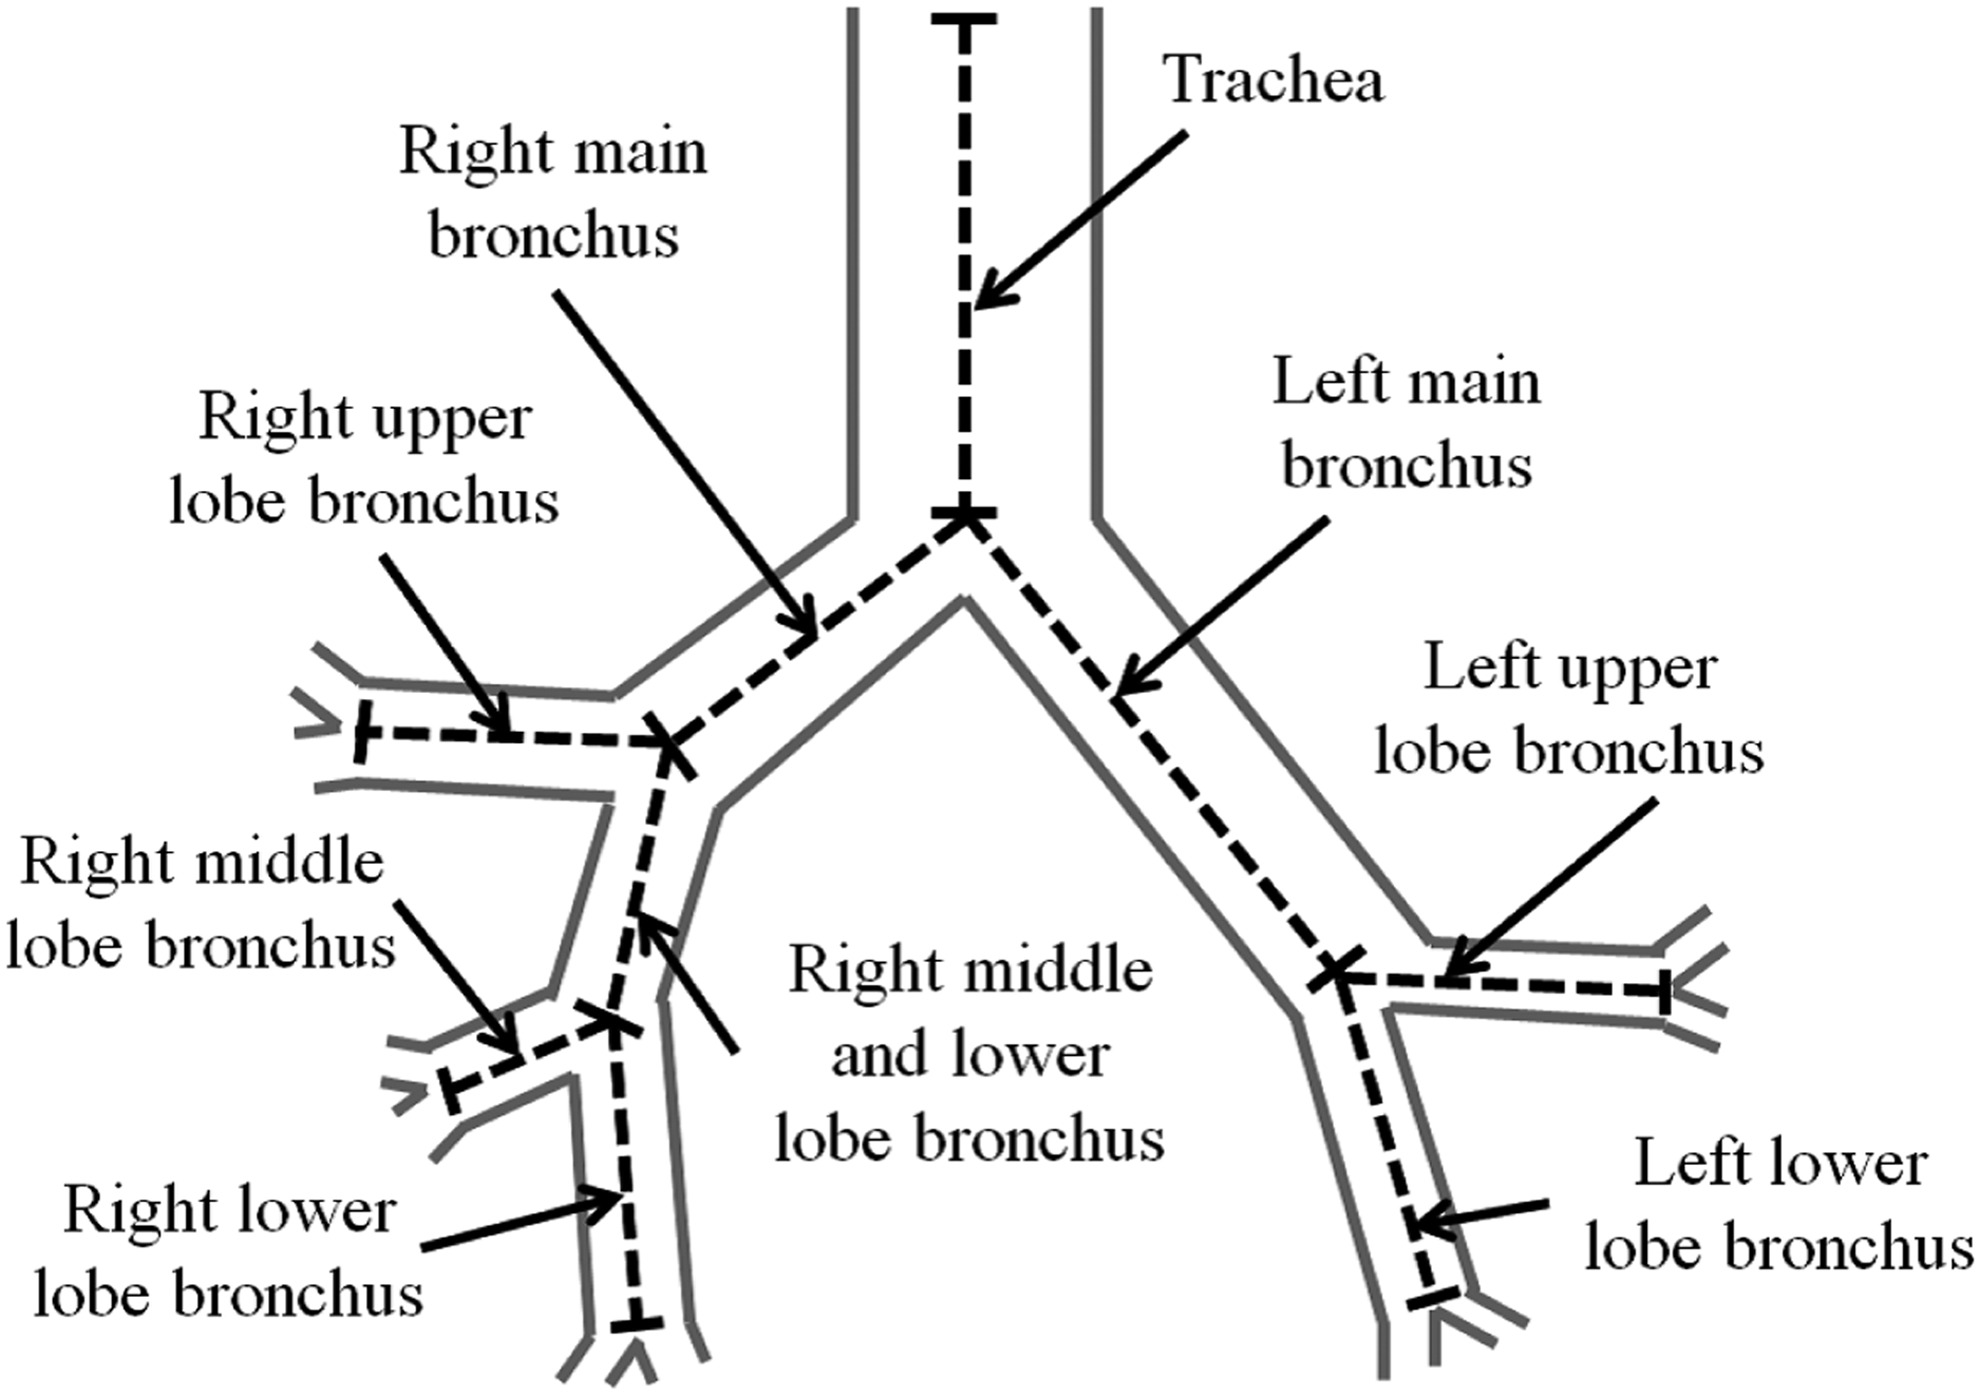
A schematic of the airway, including the names of the bronchi used in Table 2.
Lengths, Diameters, and Volume of the Representative Airway Geometries of the Individual Models (A1–A4) and the Averaged Model (B)
The bronchi names are shown in Figure 2.
The transverse and anterior–posterior diameters of the trachea and main bronchi have also been measured,(29,31) and in this case, the diameter was defined as their averaged values. Based on these references, the diameters of the trachea and left and right main bronchi ranged from 14.05 to 20.1, 9.8 to 12.6, and 10.3 to 15.8 mm, respectively. Their lengths ranged from 77.8 to 137, 44 to 60.5, and 16 to 29 mm, respectively. With respect to the right bronchi, the diameters of the upper, middle and lower, middle, and lower bronchi were 6.24–12.68, 12.65 ± 1.3, 3.77–6.49, and 4.4–6.37 mm, respectively. Their lengths were 8.99–15.6, 30.1 ± 2.9, 19.2–21, and 6.67–13.1 mm, respectively.
With respect to the left bronchi, the diameters of the upper and lower bronchi ranged from 5.39 to 10.14 and 4.49 to 9.52 mm, respectively. Furthermore, their lengths ranged from 11.63 to 16 and 8.78 to 13 mm, respectively. Compared with that observed in our measurements, there is a big difference between the right middle and lower lobe bronchi. Furthermore, the anatomical data related to the right middle and lower lobe bronchi were reported in only one literature(33) that was based on young male subjects who were taller (173–187 cm) than the subjects considered here. Moreover, it is reasonable to consider the interindividual differences such as race and sex and measurement techniques as additional sources of variation.
Regarding the averaged model, the most important geometric characteristics, including the branching topology and smooth bifurcation surface, of the conducting airway were preserved in the averaged model. The length and the diameter of the averaged model were within the ranges of those of the individual models (Table 1). Figure 3 shows the geometry of the main bifurcation. Models A1 and A3 had relatively smooth carinas and relatively narrow right bronchi at the main bifurcation compared with A2 and A4; the averaged model had smooth carinas. The usage of a reverse thinning algorithm that is proposed in this study results in a curvature of bifurcation, which makes it adequate for CFD.
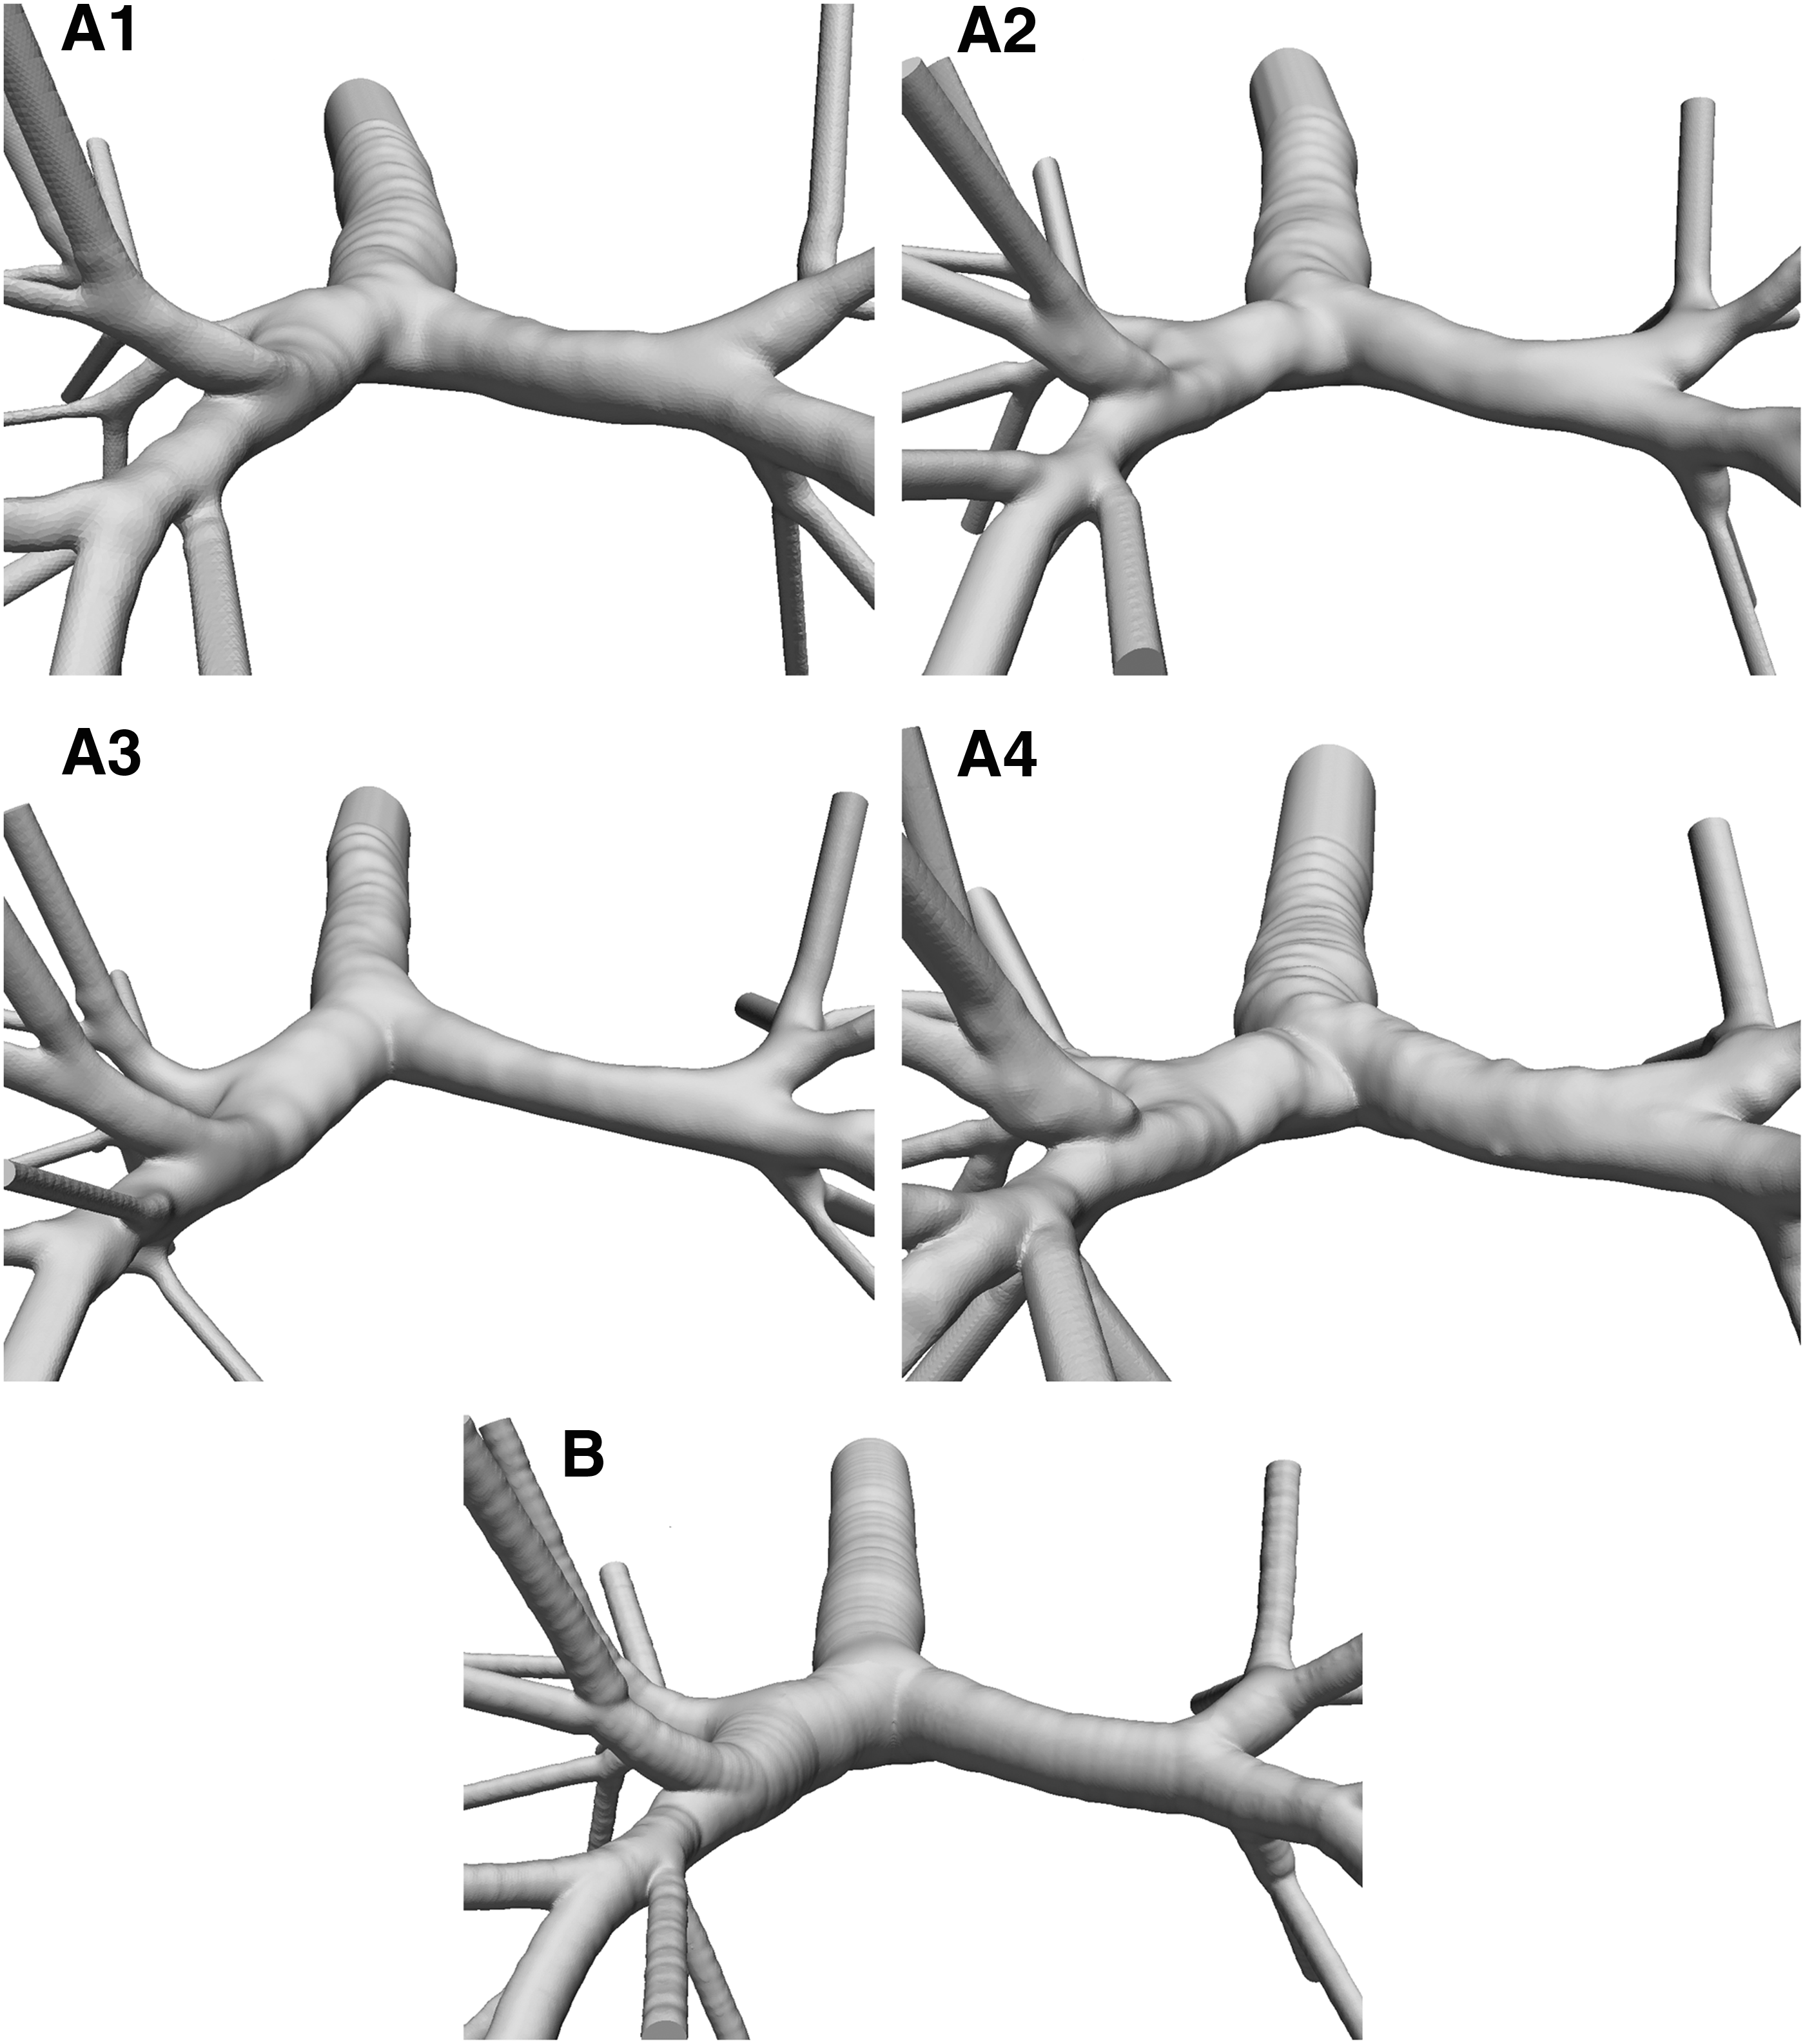
The geometry of the main left- and right-bronchi bifurcations of the individual models (A1–A4) and the averaged model (B).
However, when an average model was reconstructed based on the references, the model exhibited a tube-like geometry because the curvature data were not available yet, which may be inadequate for CFD. While the length and the diameter of the averaged model fell within the range of the individual subjects, the volume of the averaged model differed from the average of the volumes of the individual models by ∼6.0%. This difference may be caused by the exclusion of the fake segments before the averaging process.
Theoretically, the 3D geometry can be accurately reproduced from the skeleton using a reverse thinning algorithm. However, the irregularity of the surface and the complicated bifurcation geometry can result in the formation of fake segments, which are individually specific. Therefore, the volume may be decreased because of the reduction of the fake segments, and the bifurcation geometry may become smoother in the averaged model (Fig. 3).
CFD simulation
In this study, we simulated the airflow and particle transport during quiet breathing between the functional residual capacity (FRC) and after tidal volume (TV) (FRC+TV). Assuming laminar and incompressible airflow, the governing equations can be expressed as follows:
where
To define the boundary conditions, CT images were obtained at FRC and FRC+TV. Five lobes were segmented in both the FRC and FRC+TV images, and the change in the volume of each lobe was calculated (Table 2). This study focuses on the influence of the airway geometry on the airflow and particle deposition rather than heterogeneous ventilation so that TV and the volume change of each lobe were measured for only one subject (A1). TV for the other subjects (A2–A4) were assumed to be proportional to TLC and that for the averaged model (B) were the mean value of the four subjects (A1–A4), and the distribution ratio of each lobe in A2–A4 and B was the same as that in A1 (Table 2).
Total Lung Capacity, Tidal Volume, and Flow Rate of Each Individual Models (A1–A4) and Averaged Model (B)
In this study, the lung volume was calculated based on the segmented CT images and was defined as: [number of voxels] × [volume of a single voxel]. It was assumed that the inspiration time was 2.0 seconds and that the volume change occurred evenly during the inspiration period. Thus, the total flow rate was defined as TV/2 mL/s (Table 2). When there were several bronchi in a lobe, the flow volume was assumed to be proportional to the total cross-sectional area of the bronchi, and the uniform steady flow rate was applied to all of the most distal bronchi as the outlet boundary condition. Constant pressure was set within the trachea as the inlet boundary condition. Previous studies demonstrated the importance of the inlet conditions in evaluation of the particle deposition of the respiratory tract.(36–38)
In addition, the deposition pattern in posterior wall was induced by the inlet velocity biased toward the posterior wall due to the laryngeal jet.(7) However, as we mentioned above, the main objective is to evaluate the effectiveness of an averaged airway model in predicting the airflow and particle transport through the airway. To achieve this objective, it is necessary that the flow distribution ratio of each lobe was same among individual models and the averaged model. To mitigate the influence of the boundary conditions, the trachea and all of the most distal bronchi were artificially lengthened into straight tubes along the direction of the skeleton that was calculated by the 3D thinning algorithm (Fig. 1).
We then considered the effects of the drag force and gravity on the particle deposition. The Brownian force was considered negligible compared to the other intrinsic forces because the minimum particle size was assumed to be 1 μm in this study(9) [Brownian motion is the dominant deposition mechanism for particle diameters <0.5 μm, while sedimentation and inertial impaction dominate for particles in the micrometer range(39–41)]. Moreover, the Magnus and Saffman forces were also neglected because the particles were not spinning rapidly and because the shear fields are weaker for laminar flow than that for turbulent flow.(4,40,42,43) Thus, the governing equations are expressed as follows:
where u is the air velocity, up the particle velocity, ρp the particle density, Dp the particle diameter, CD the drag coefficient, and Rep the particle Reynolds number.(44) The gravity acted in the z-axis minus direction in the 3D Cartesian coordinate system (Fig. 1). Furthermore, the numerical simulations were one-way coupled (i.e., it was assumed that the flow was not influenced by the particles). Particle collision was also neglected. The particles were assumed to be spherical and inert with the same density as water (ρp = 1.0 g/cm3). Three different aerodynamic particle diameters, Dp = 1.0, 5.0, and 10 μm, were used for the simulation.
In the initial condition, the particles were distributed uniformly between the trachea and the artificially extended straight tube mentioned above. The particles were introduced into the flow field with initial velocities equal to the air velocities at the corresponding grid points.(45,46) The perpendicular and parallel restitution coefficients of the particles located at the boundaries were set to zero (i.e., when a particle struck the wall, it was assumed to remain stuck there).
Furthermore, particles that escaped the computational model were not reintroduced. The time step was adjusted such that the maximum Courant number was <1.0 in the flow simulation; in this case, the time step was ∼2 × 10⁻⁵ seconds. The deposition fraction was evaluated for the whole model and for each individual lobe. The deposition fraction for the whole lung was evaluated as the total number particles divided by the total number of particles entering the trachea. In this study, the lobes were not included in the numerical model, so the deposition fraction for each lobe was also evaluated as the number of particles deposited in each bronchi of a lobe divided by the total number of particles entering the trachea.
In this simulation, the flow conditions represented steady inspiratory flow; therefore, the particles were deposited on the wall or exited the model to the most distal bronchi, but did not return to the model; the escape fraction was evaluated as the number of particles exiting the model divided by the total number of particles entering the trachea.
In this study, an unstructured tetrahedral volume mesh core and five prismatic elements were modeled across the boundary layers. Care was taken to insure that the maximum velocities and the particle transport fractions (deposition fraction + escape fraction) for each lobe were independent on the particle and mesh numbers. The inlet particle number was 58,680 for each particle size based on the previous study.(7) Final mesh number were 4.9, 5.1, 5.0, 5.3, and 5.4 million for A1, A2, A3, A4, and B, respectively. The mesh and particle numbers could provide a balance between desired solution accuracy and reasonable computational time.
Results
Airflow characteristics
The Reynolds numbers at the inlets of the tracheas in individual models A1–A4 were 1025, 981, 796, and 939, respectively. Figures 4 and 5 show the streamline and velocity contours of inspiratory flow for each model, respectively. As demonstrated by the velocity magnitudes and secondary flow structures, there were small variations in the airflow characteristics of the individual subjects. The airflow in trachea was mainly unidirectional in all subjects, even though the velocity in model A1 was smaller slightly due to the larger diameter (Fig. 5). The velocity increased around the outside wall of the left main bronchus; this phenomenon was particularly remarkable at S4 in model A3 in Figure 4.
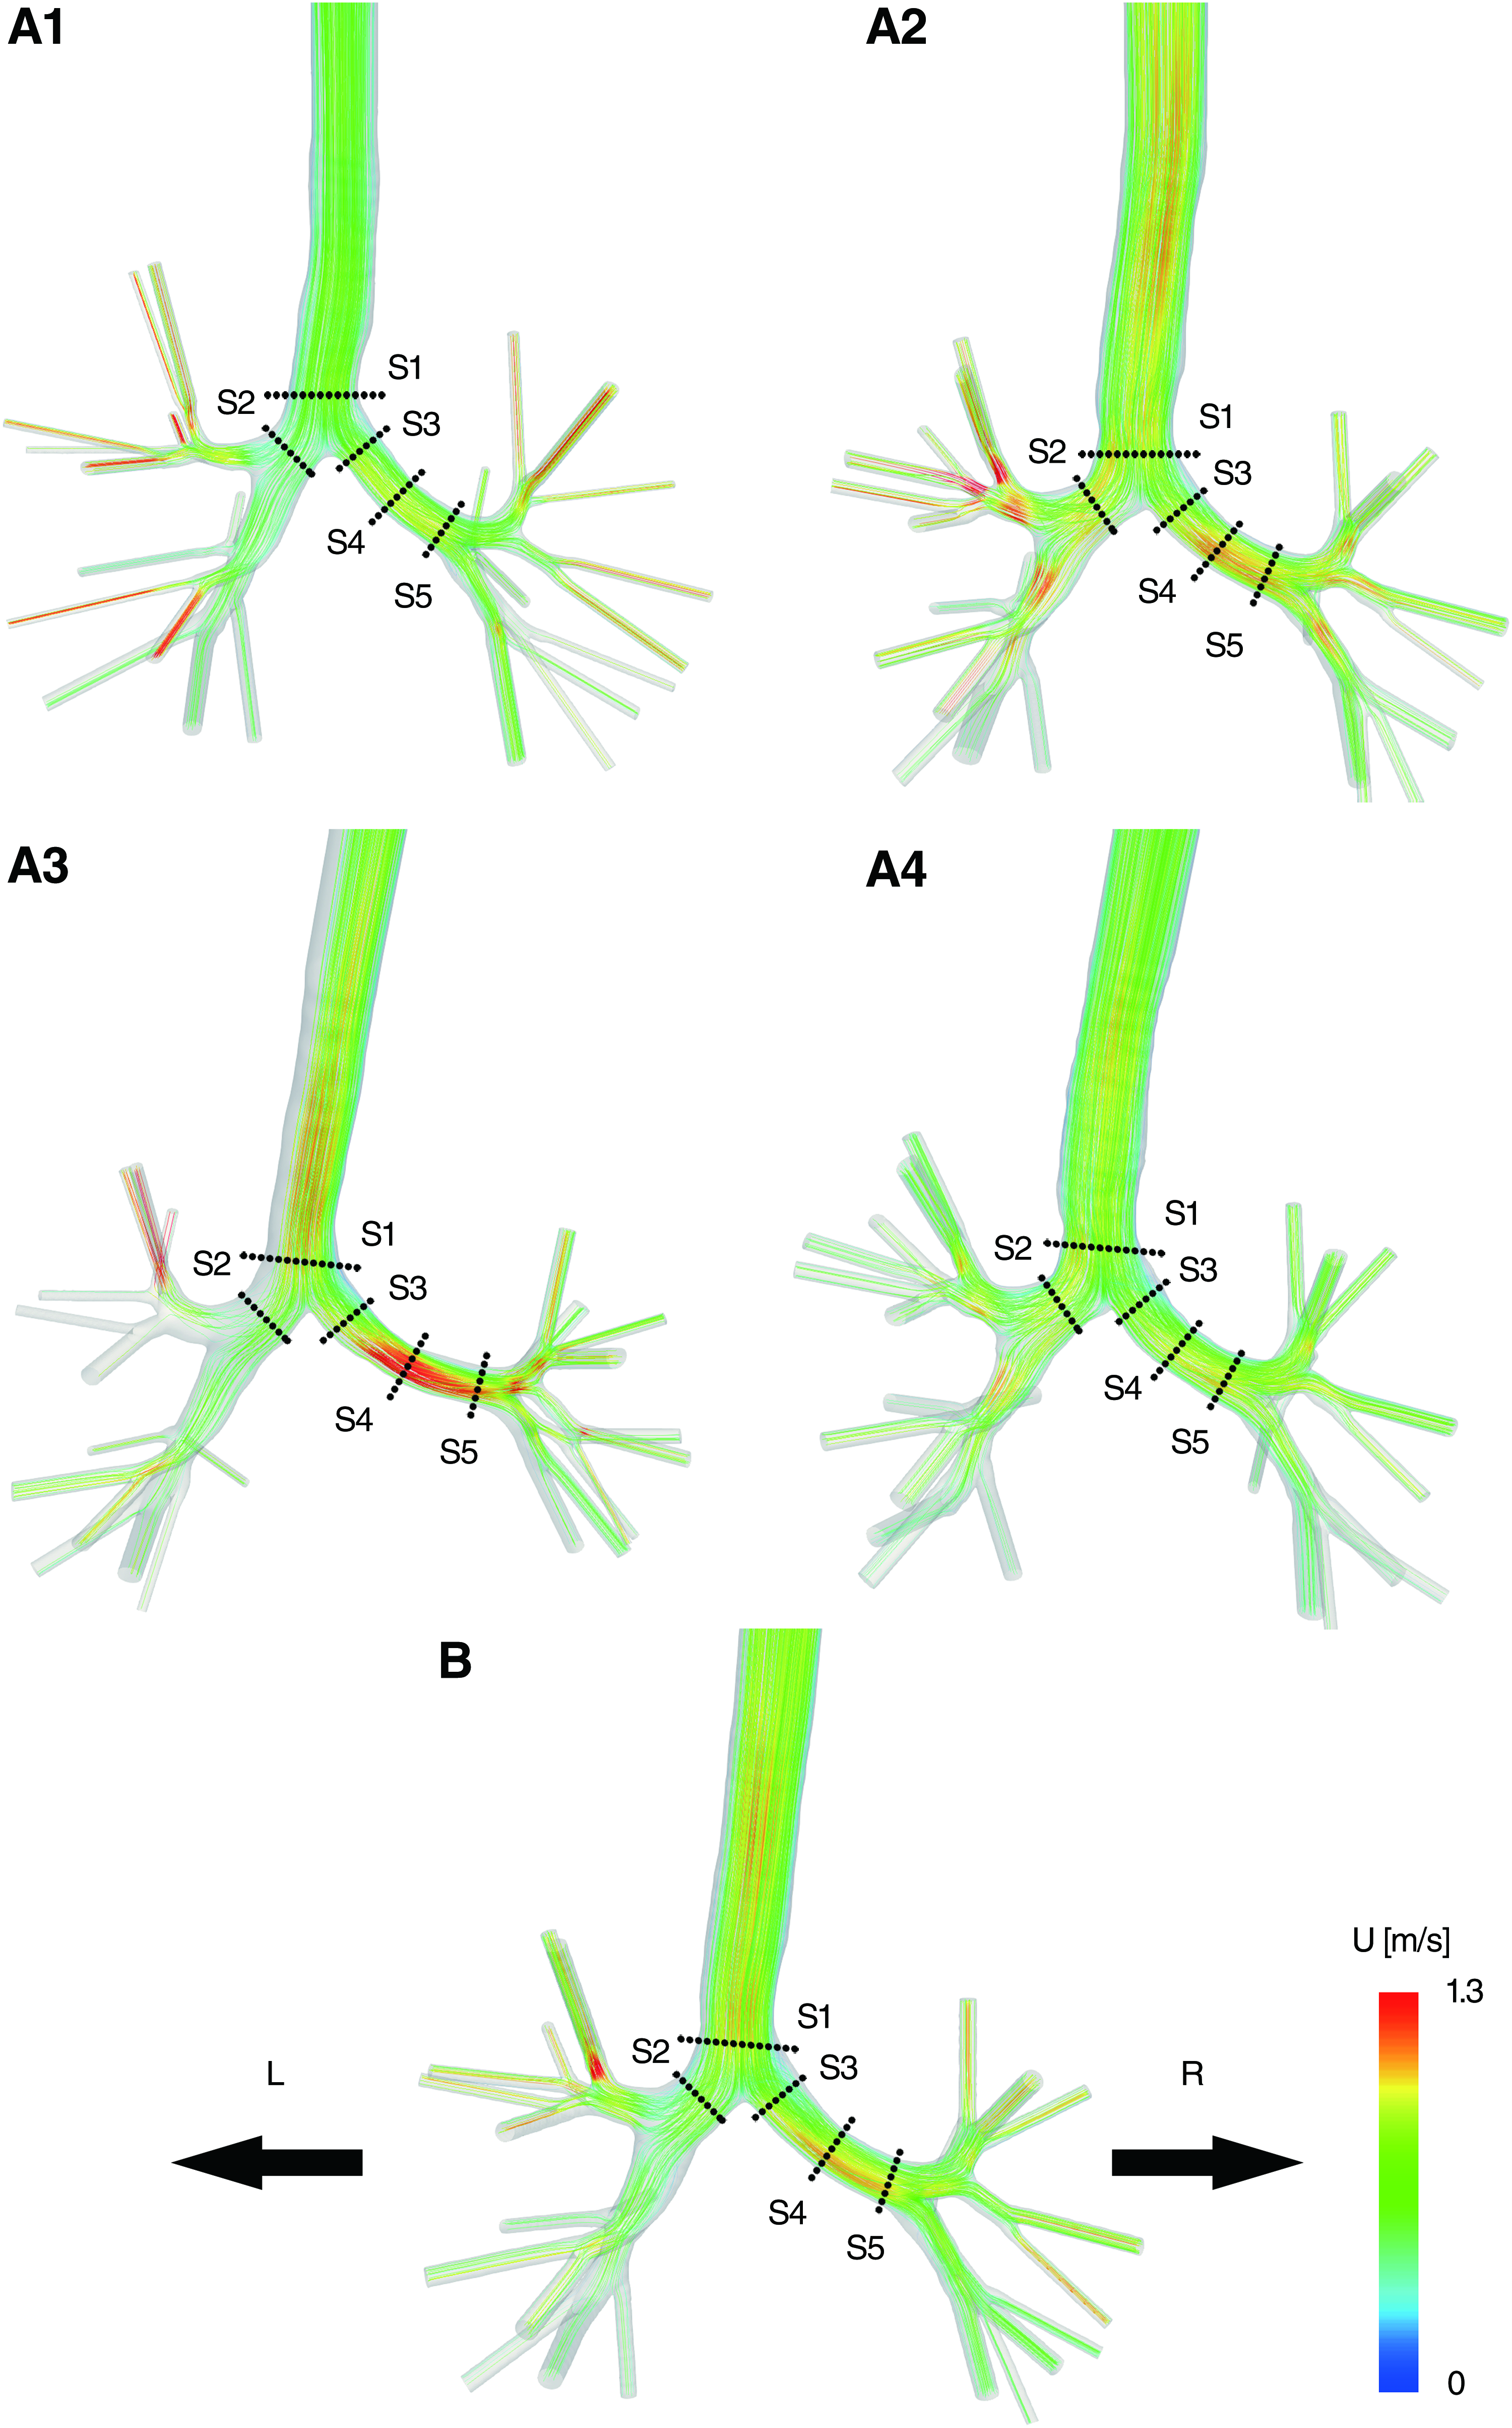
Streamlines depicting the inspiratory flow for the individual models

Velocity of the inspiratory flow for the individual models
However, a double secondary vortex was produced at S3 and S4 in all subjects (Fig. 5). The velocity in the right main bronchus was higher in models A2 and A4 than in models A1 and A3; this was likely because the right main bronchus at the main bifurcation point was narrow in models A2 and A4 (Fig. 3). Similar to the left main bronchus, a double secondary vortex was produced at S2 in the right main bronchus at in all subjects.
In the averaged model, the Reynolds number at the trachea was 998, which was within the range of the values found in the individual models. The airflow in trachea was mainly unidirectional. The velocity increased around the outside wall of the left main bronchus (Fig. 4), and the maximum velocities in left and right main bronchi were within the ranges of those of the individual models (Figs. 4 and 5). Furthermore, a double secondary vortex was produced at S3 and S4 in left main bronchus and at S2 in right main bronchus (Fig. 5). These results suggested that there were some differences between the streamlines and contours of the individual subjects and the averaged model, but the averaged model remained within the range of variation of the individual subjects.
Particle deposition
Figure 6 shows the deposition fraction for each model and the averaged model. The results show that the fraction was higher for the larger particles than that for the smaller particles. The deposition fraction for model A3 was the highest, while that for model A1 was the lowest for all particles; the deposition of 10-μm particles in these two models differed by 6.9%. This observation suggests that the deposition fraction differs between healthy subjects.
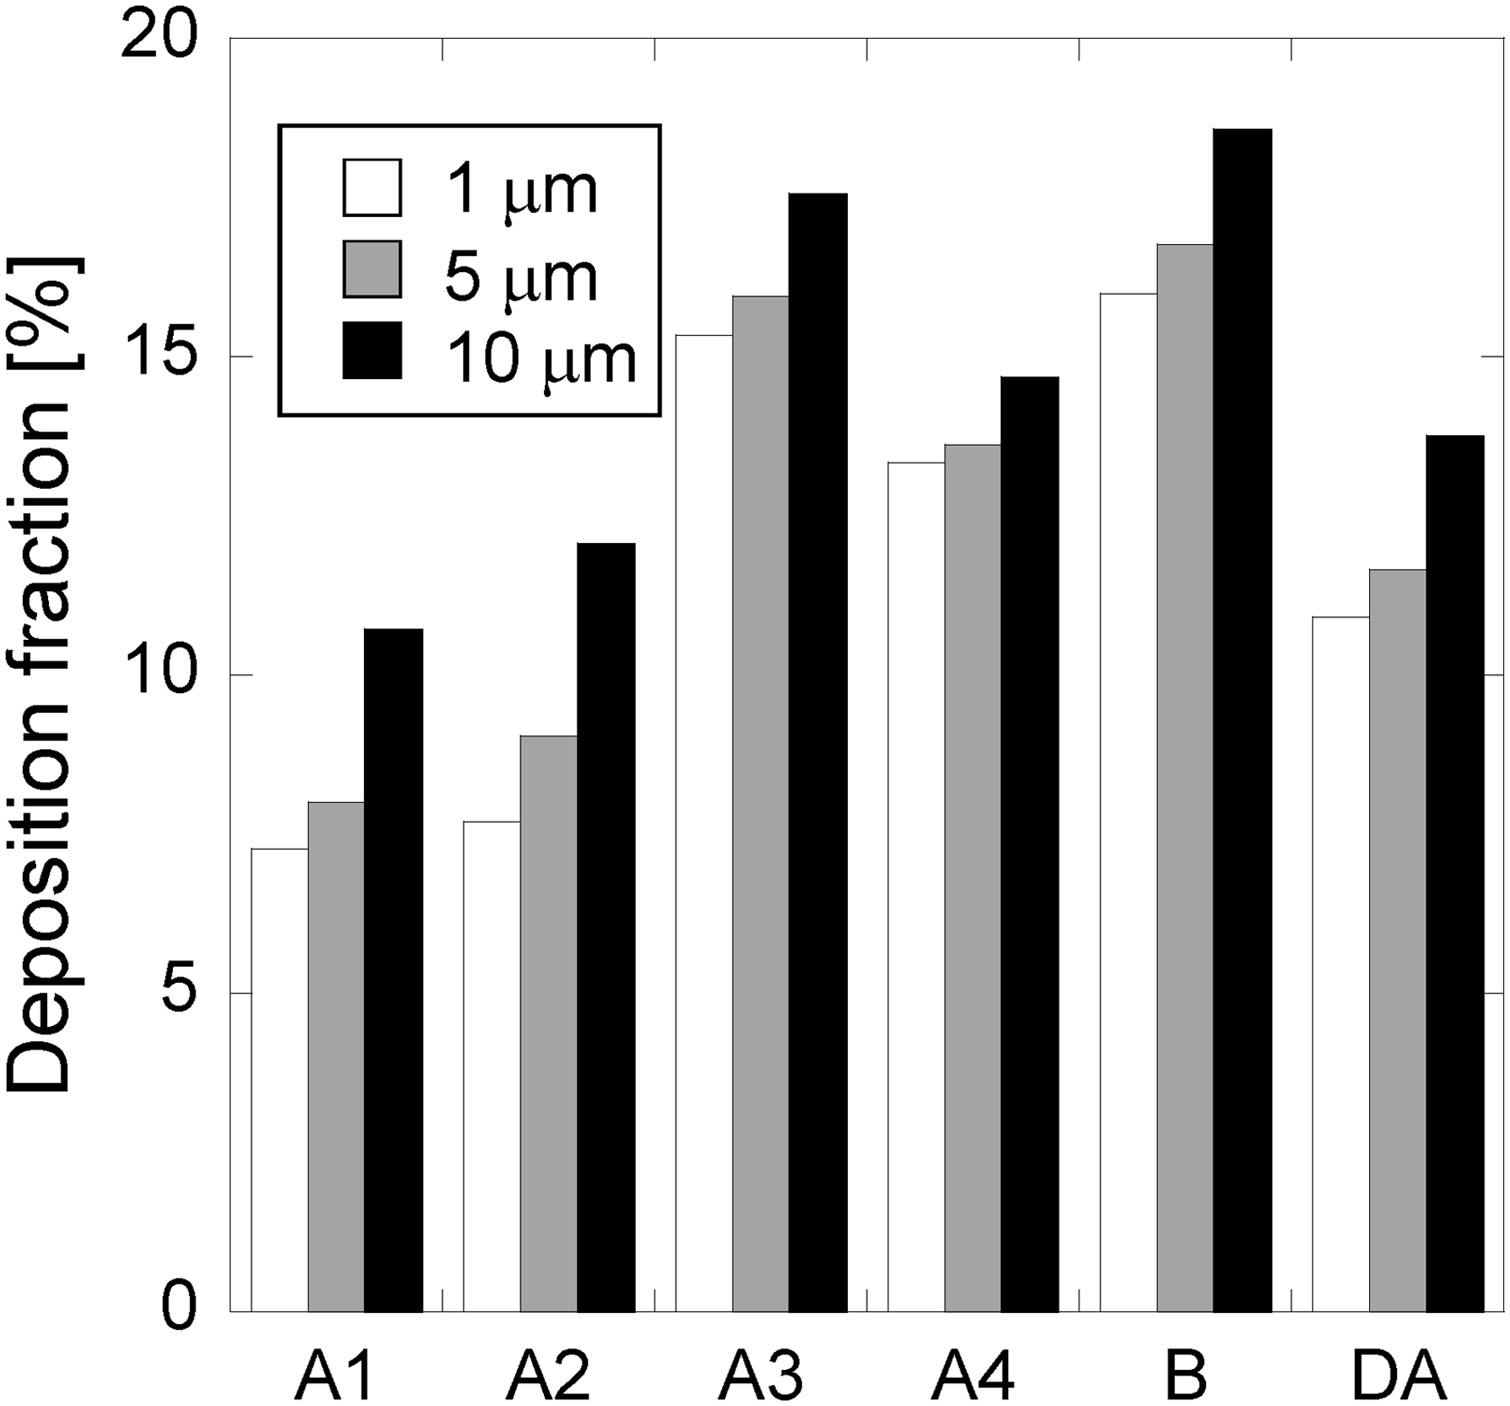
The deposition fractions for the 1-, 5-, and 10-μm particles in the individual models
In addition, it should be noted that the deposition fraction in the averaged model was higher than that in A3 and the direct average of the values in the individual models; it was almost twice as high as that in models A1 and A2 for 1.0 and 5.0 μm particles, respectively. To investigate these result furthermore, a dot plot of the deposition fraction of 10 μm particles in each lobe (defined as the number of particles deposited in the bronchi of that lobe) and in each lung (the sum of the particles deposited in the lobes of that lung) is shown in Figure 7. Here, the particles deposited in the artificially extended straight tubes attached to the most distal bronchi were not considered.
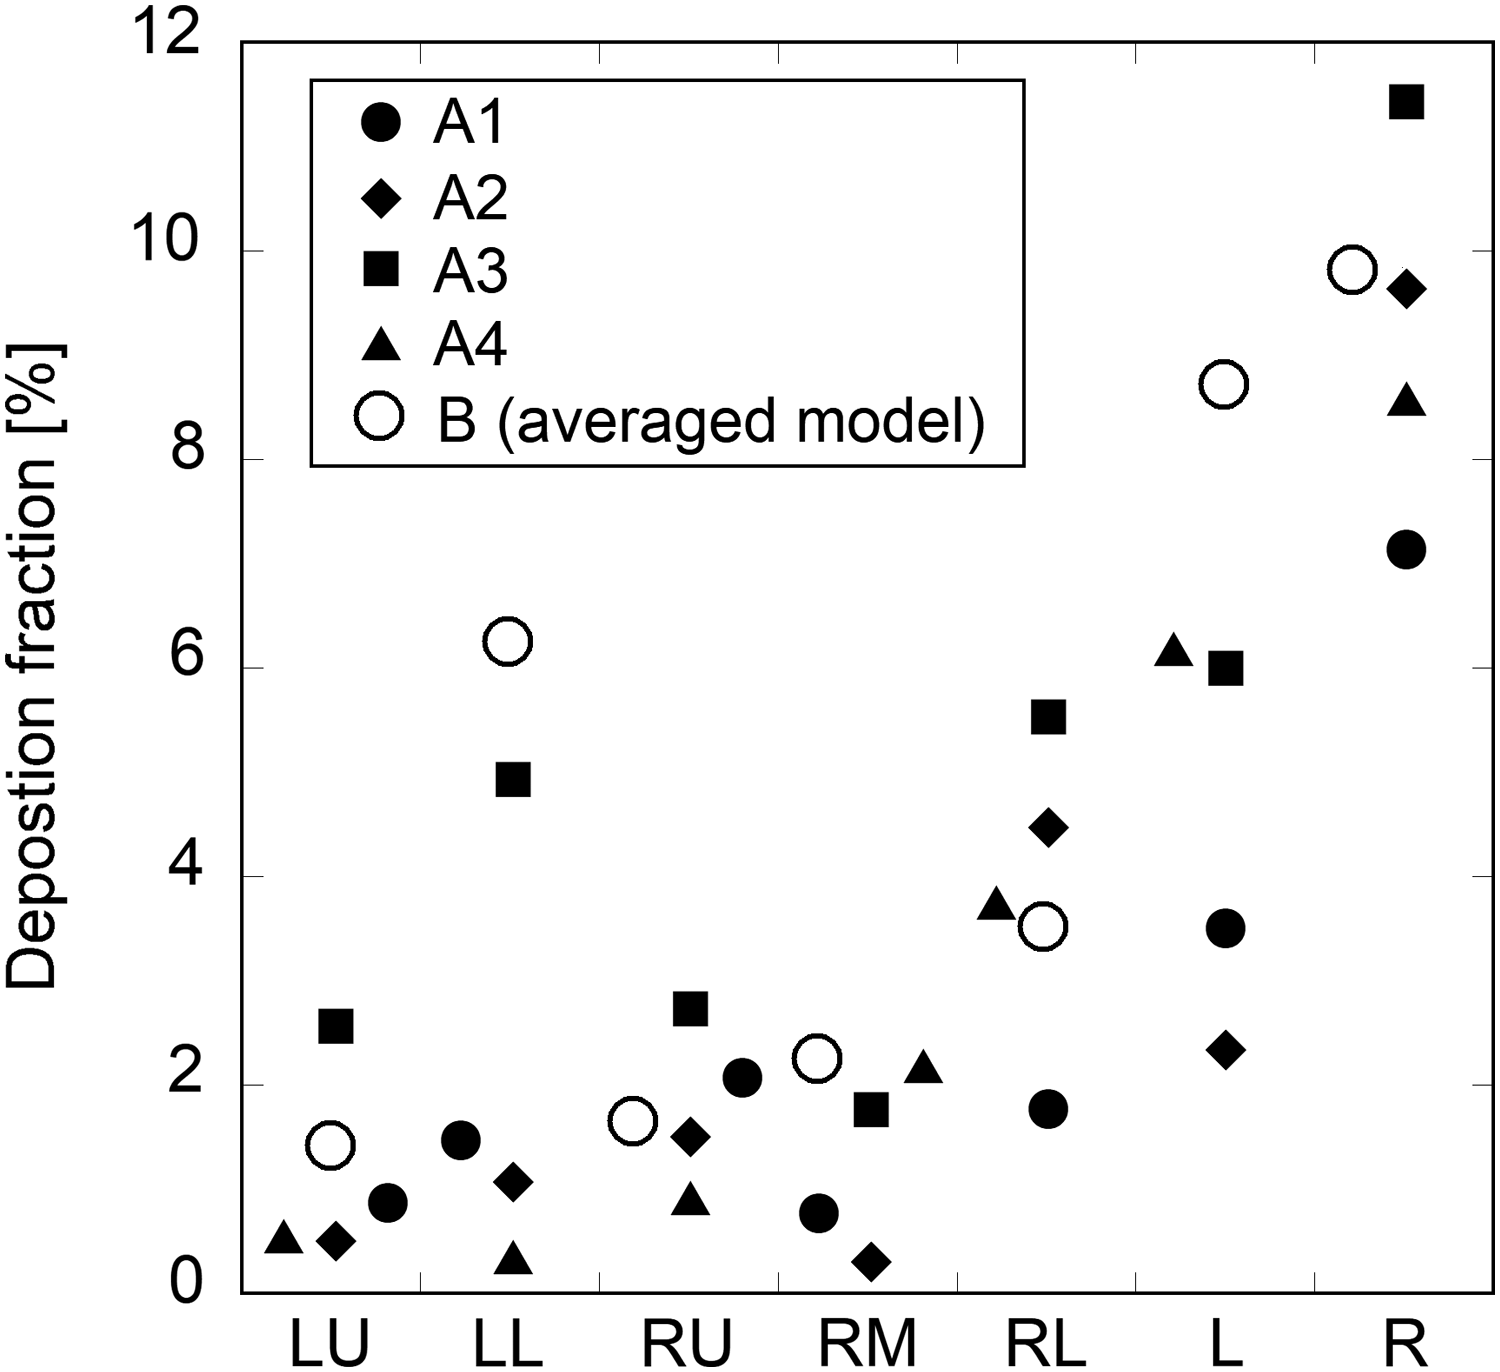
Dot plot showing the deposition fractions of the 10-μm particles at the bronchi in each lobe (LU, LL, RU, RM, and RL). The deposition in the left lung (L) is the sum of the depositions in the left main bronchus, LU, and LL and the deposition in the right lung (R) is the sum of the depositions at the right main bronchus, RU, RM, and RL. The black circles, diamonds, squares, and triangles correspond to the individual models
Interestingly, the deposition fraction in the averaged model was higher than those in all of the individual models, particularly in the left lower lobe. Although the depositions were highest in the right lower lobes in the individual models, the averaged model shows that the greatest deposition occurred in the left lower lobe. In addition, although the deposition fraction was much higher in the right lungs in the individual models, the difference between the right and left lungs was small in the averaged model. In the individual models, the average deposition fraction in each lobe was <5% (Fig. 7), indicating that almost all particles escaped into the connected lobe.
Figure 8 shows a dot plot of the escape fractions of 10 μm particles, representing the fractions of particles that were not deposited at the airway, but rather escaped the model in each lobe. As the particles were transported to the lower lobes due to gravity, the escape fraction of the right lower lobe reached ∼30%. The escape fraction of the averaged model was lower than those of the individual models, particularly in the right upper lobe.
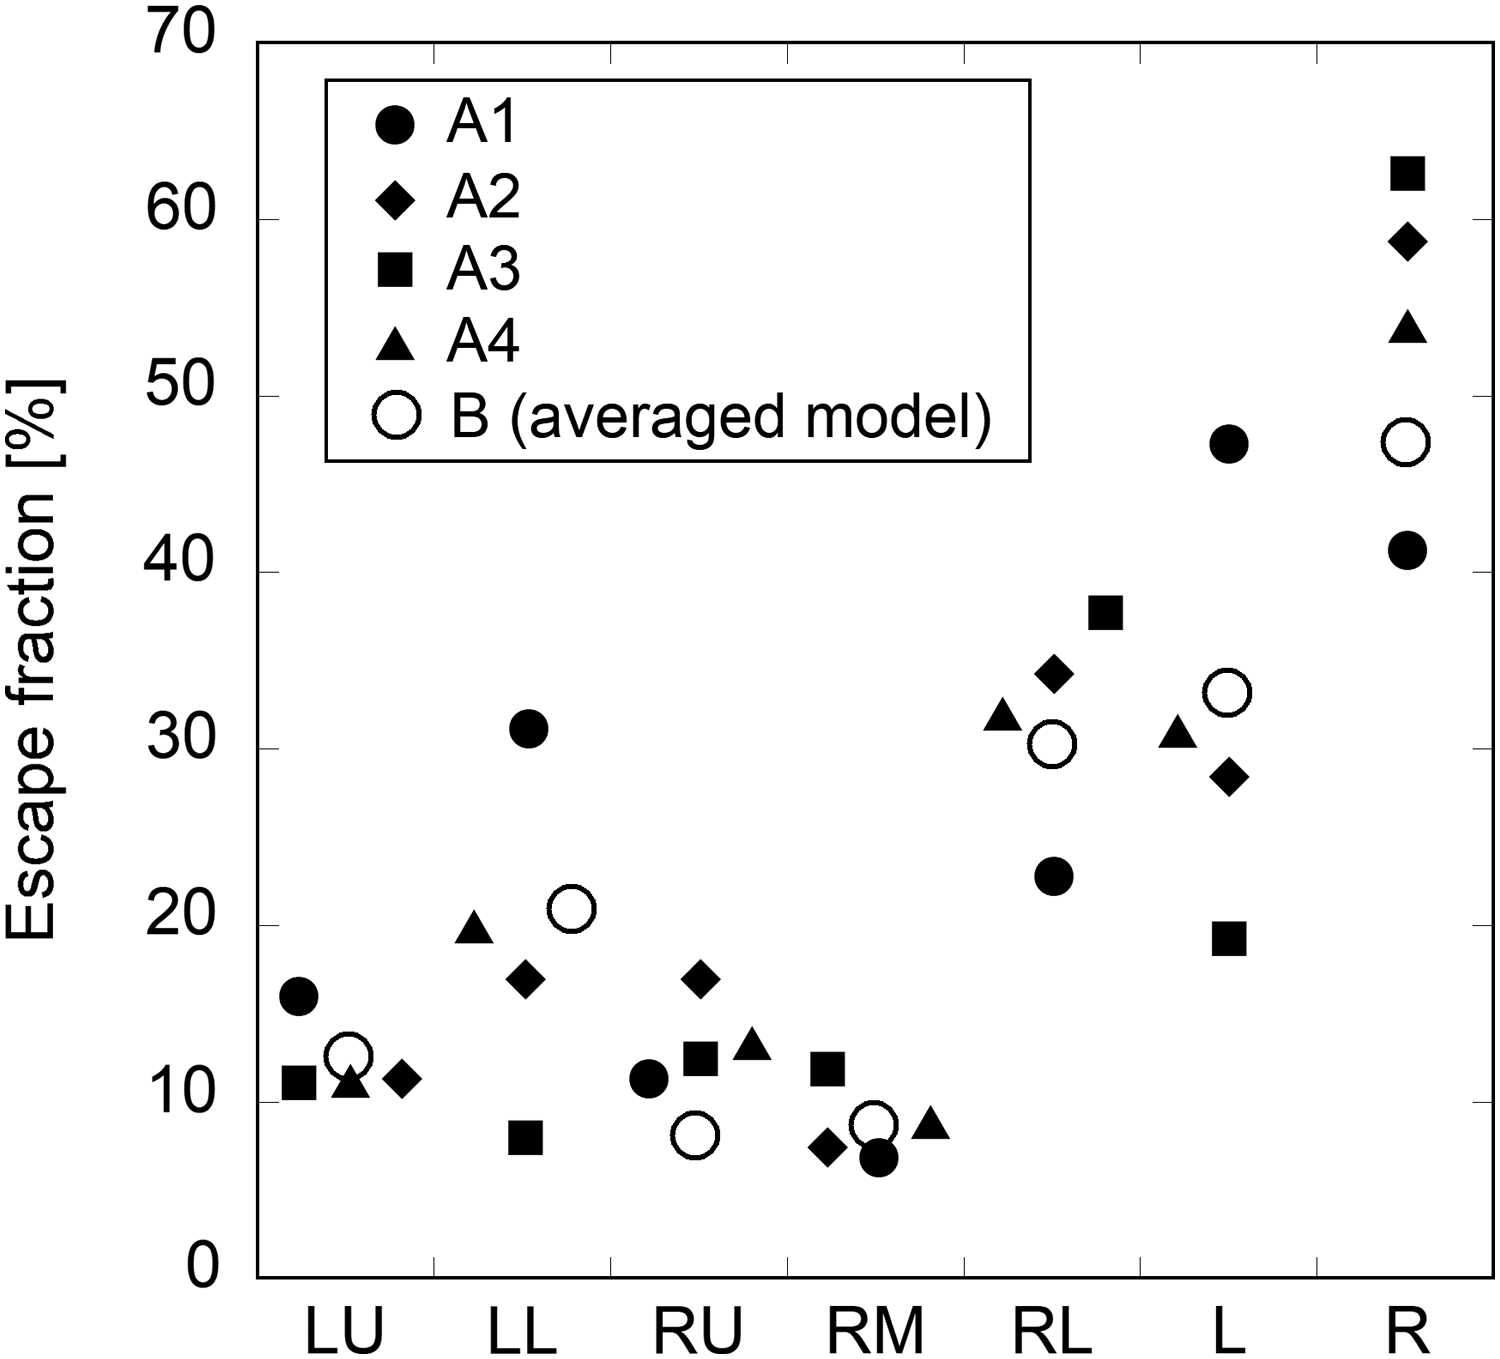
Dot plot showing the escape fractions of the 10-μm particles into each lobe (LU, LL, RU, RM, and RL). The escape fraction from the left lung (L) is the sum of those from LU and LL and the escape from the right lung (R) is the sum of those from RU, RM, and RL. The black circles, diamonds, squares, and triangles correspond to the individual models
Figures 9 and 10 show the deposition distributions of 10 μm particles on the anterior and posterior sides of the airways, respectively. In a previous study, it was reported that more particles are deposited on the anterior surface than on the posterior surface.(7) The anterior surface is wavy because of the C-shaped cartilage rings, while the posterior surface was smooth because of the smooth muscle fibers. This characteristic was particularly prominent in the main bronchi in models A3 and A4. In this study, particles were deposited at the carina and the bronchi rather than in the trachea. However, a previous study reported that the particle deposition extended over a larger area, including the trachea.(7)
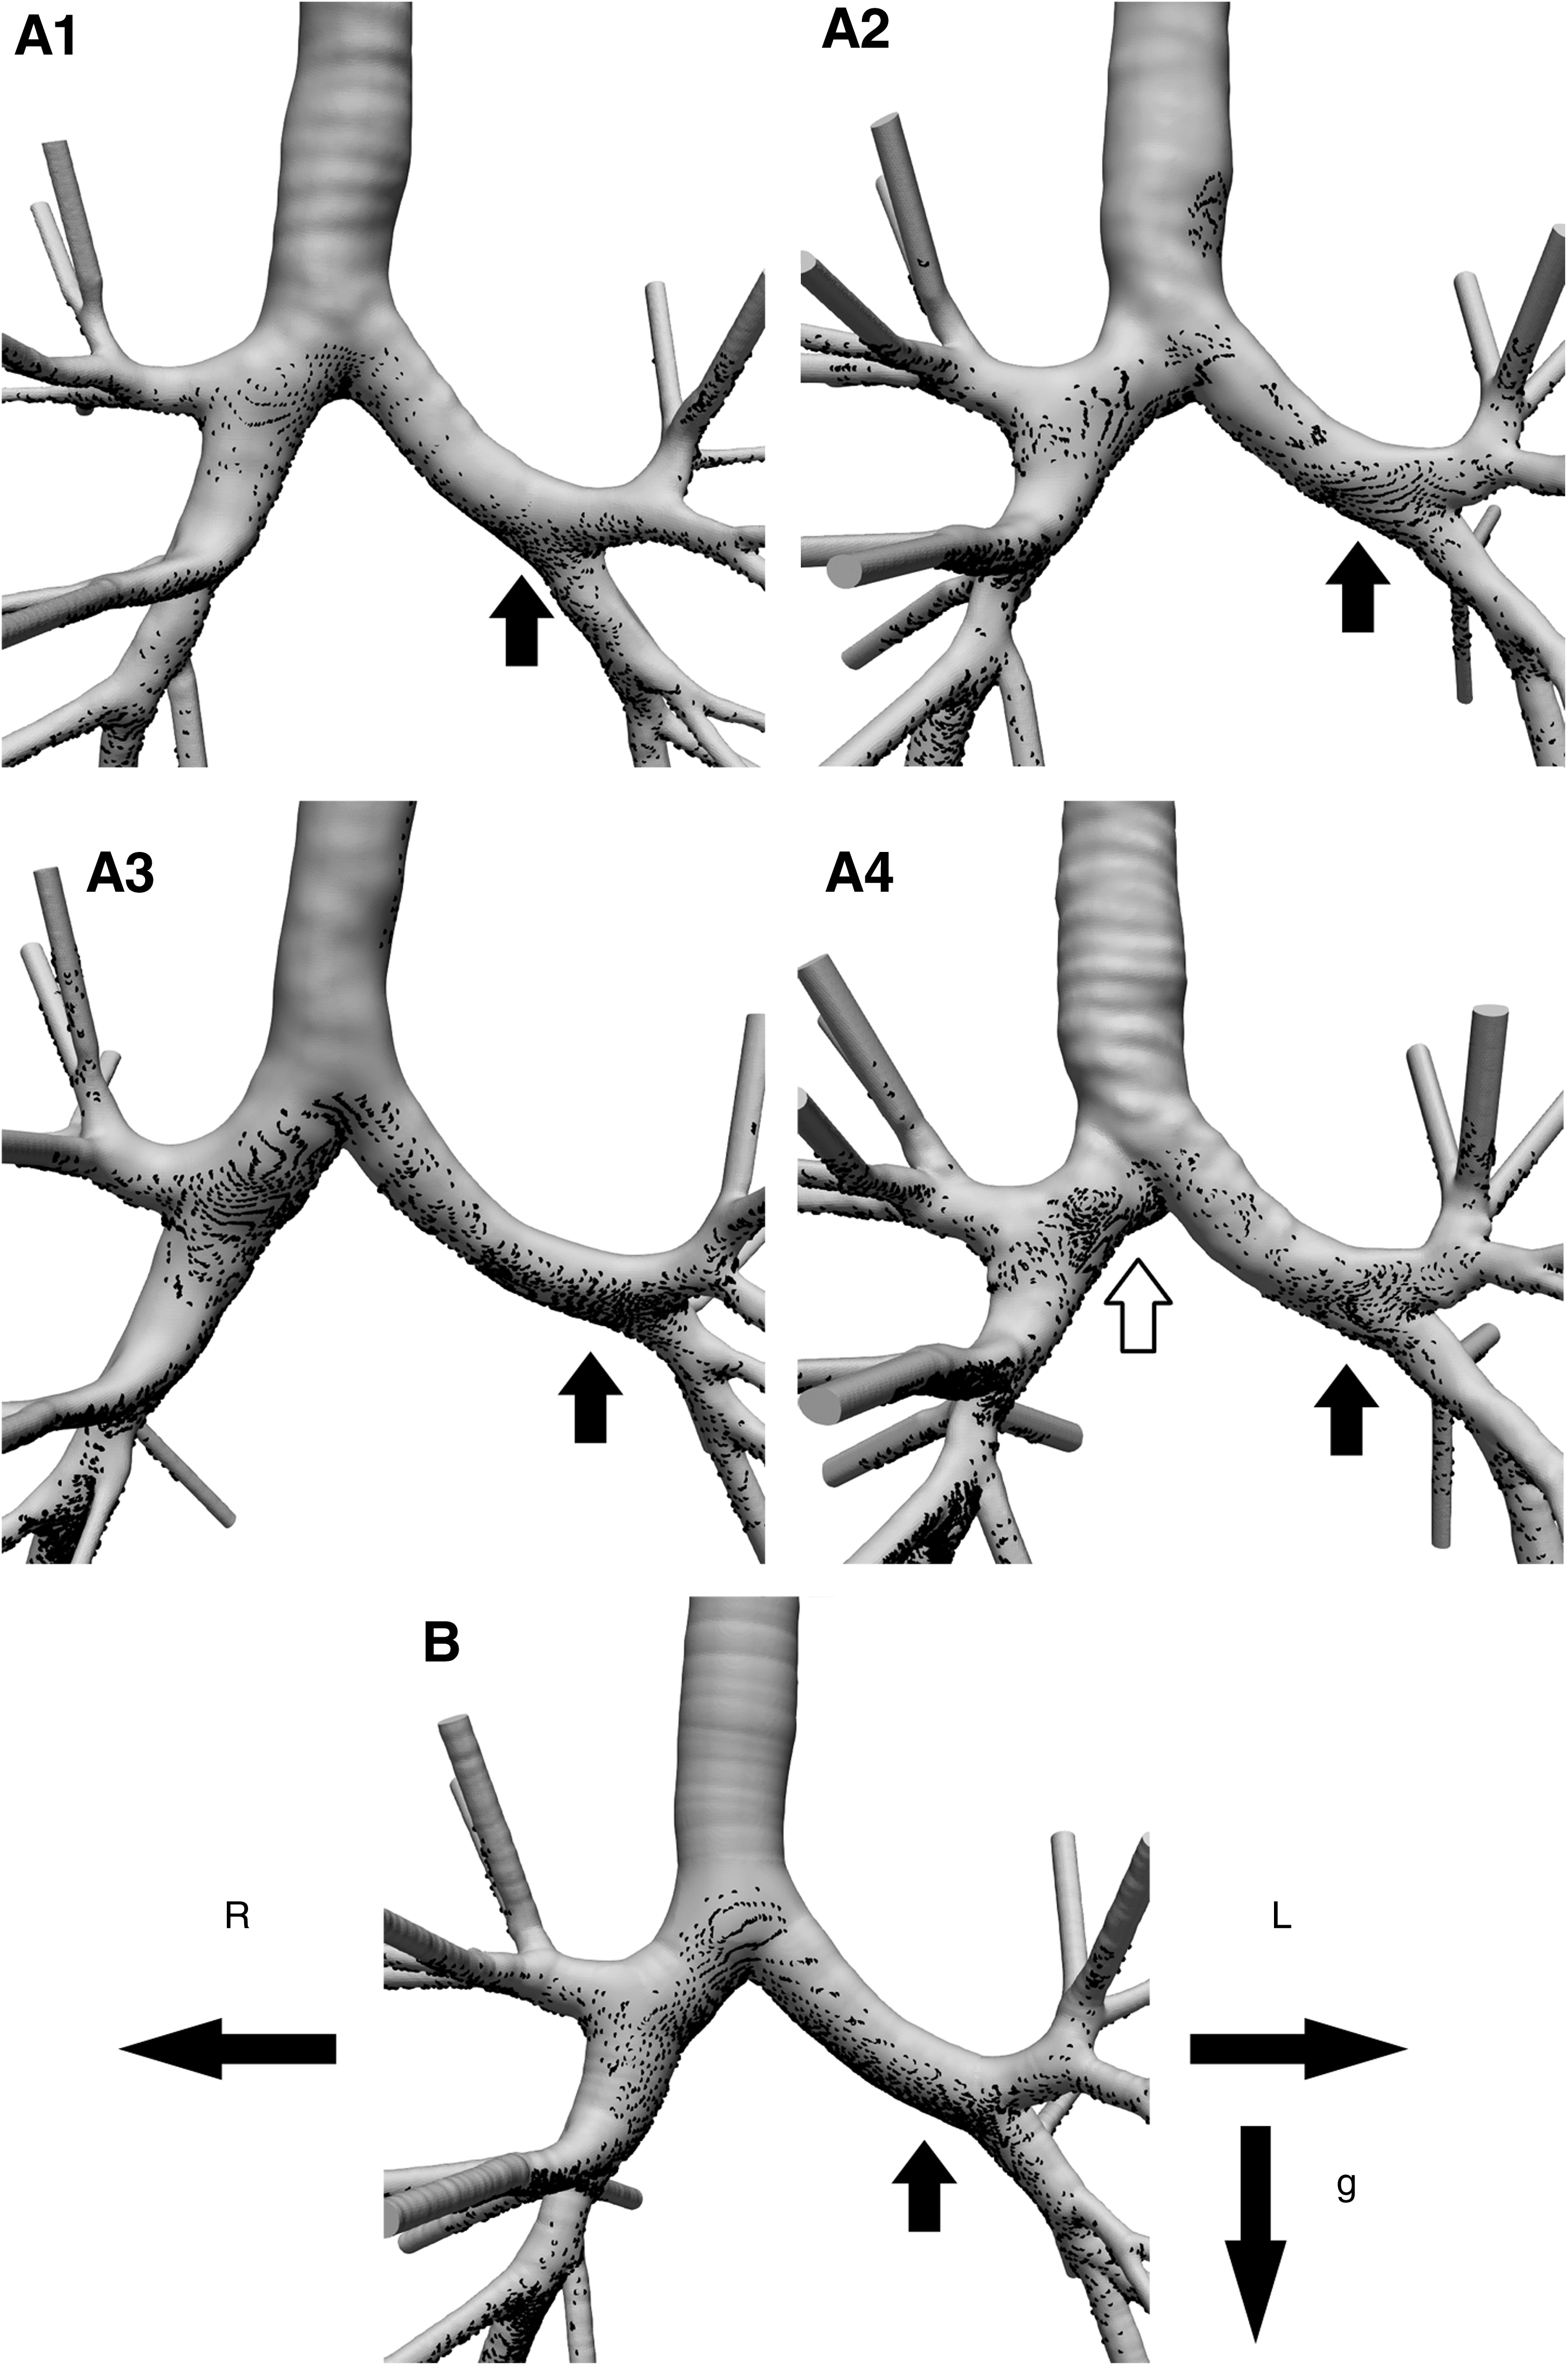
Deposition distributions of the 10 μm particles at the anterior side for the individual models (A1–A4) and the averaged model (B). The particle deposition was relatively high in the left main bronchus (black arrows) in models
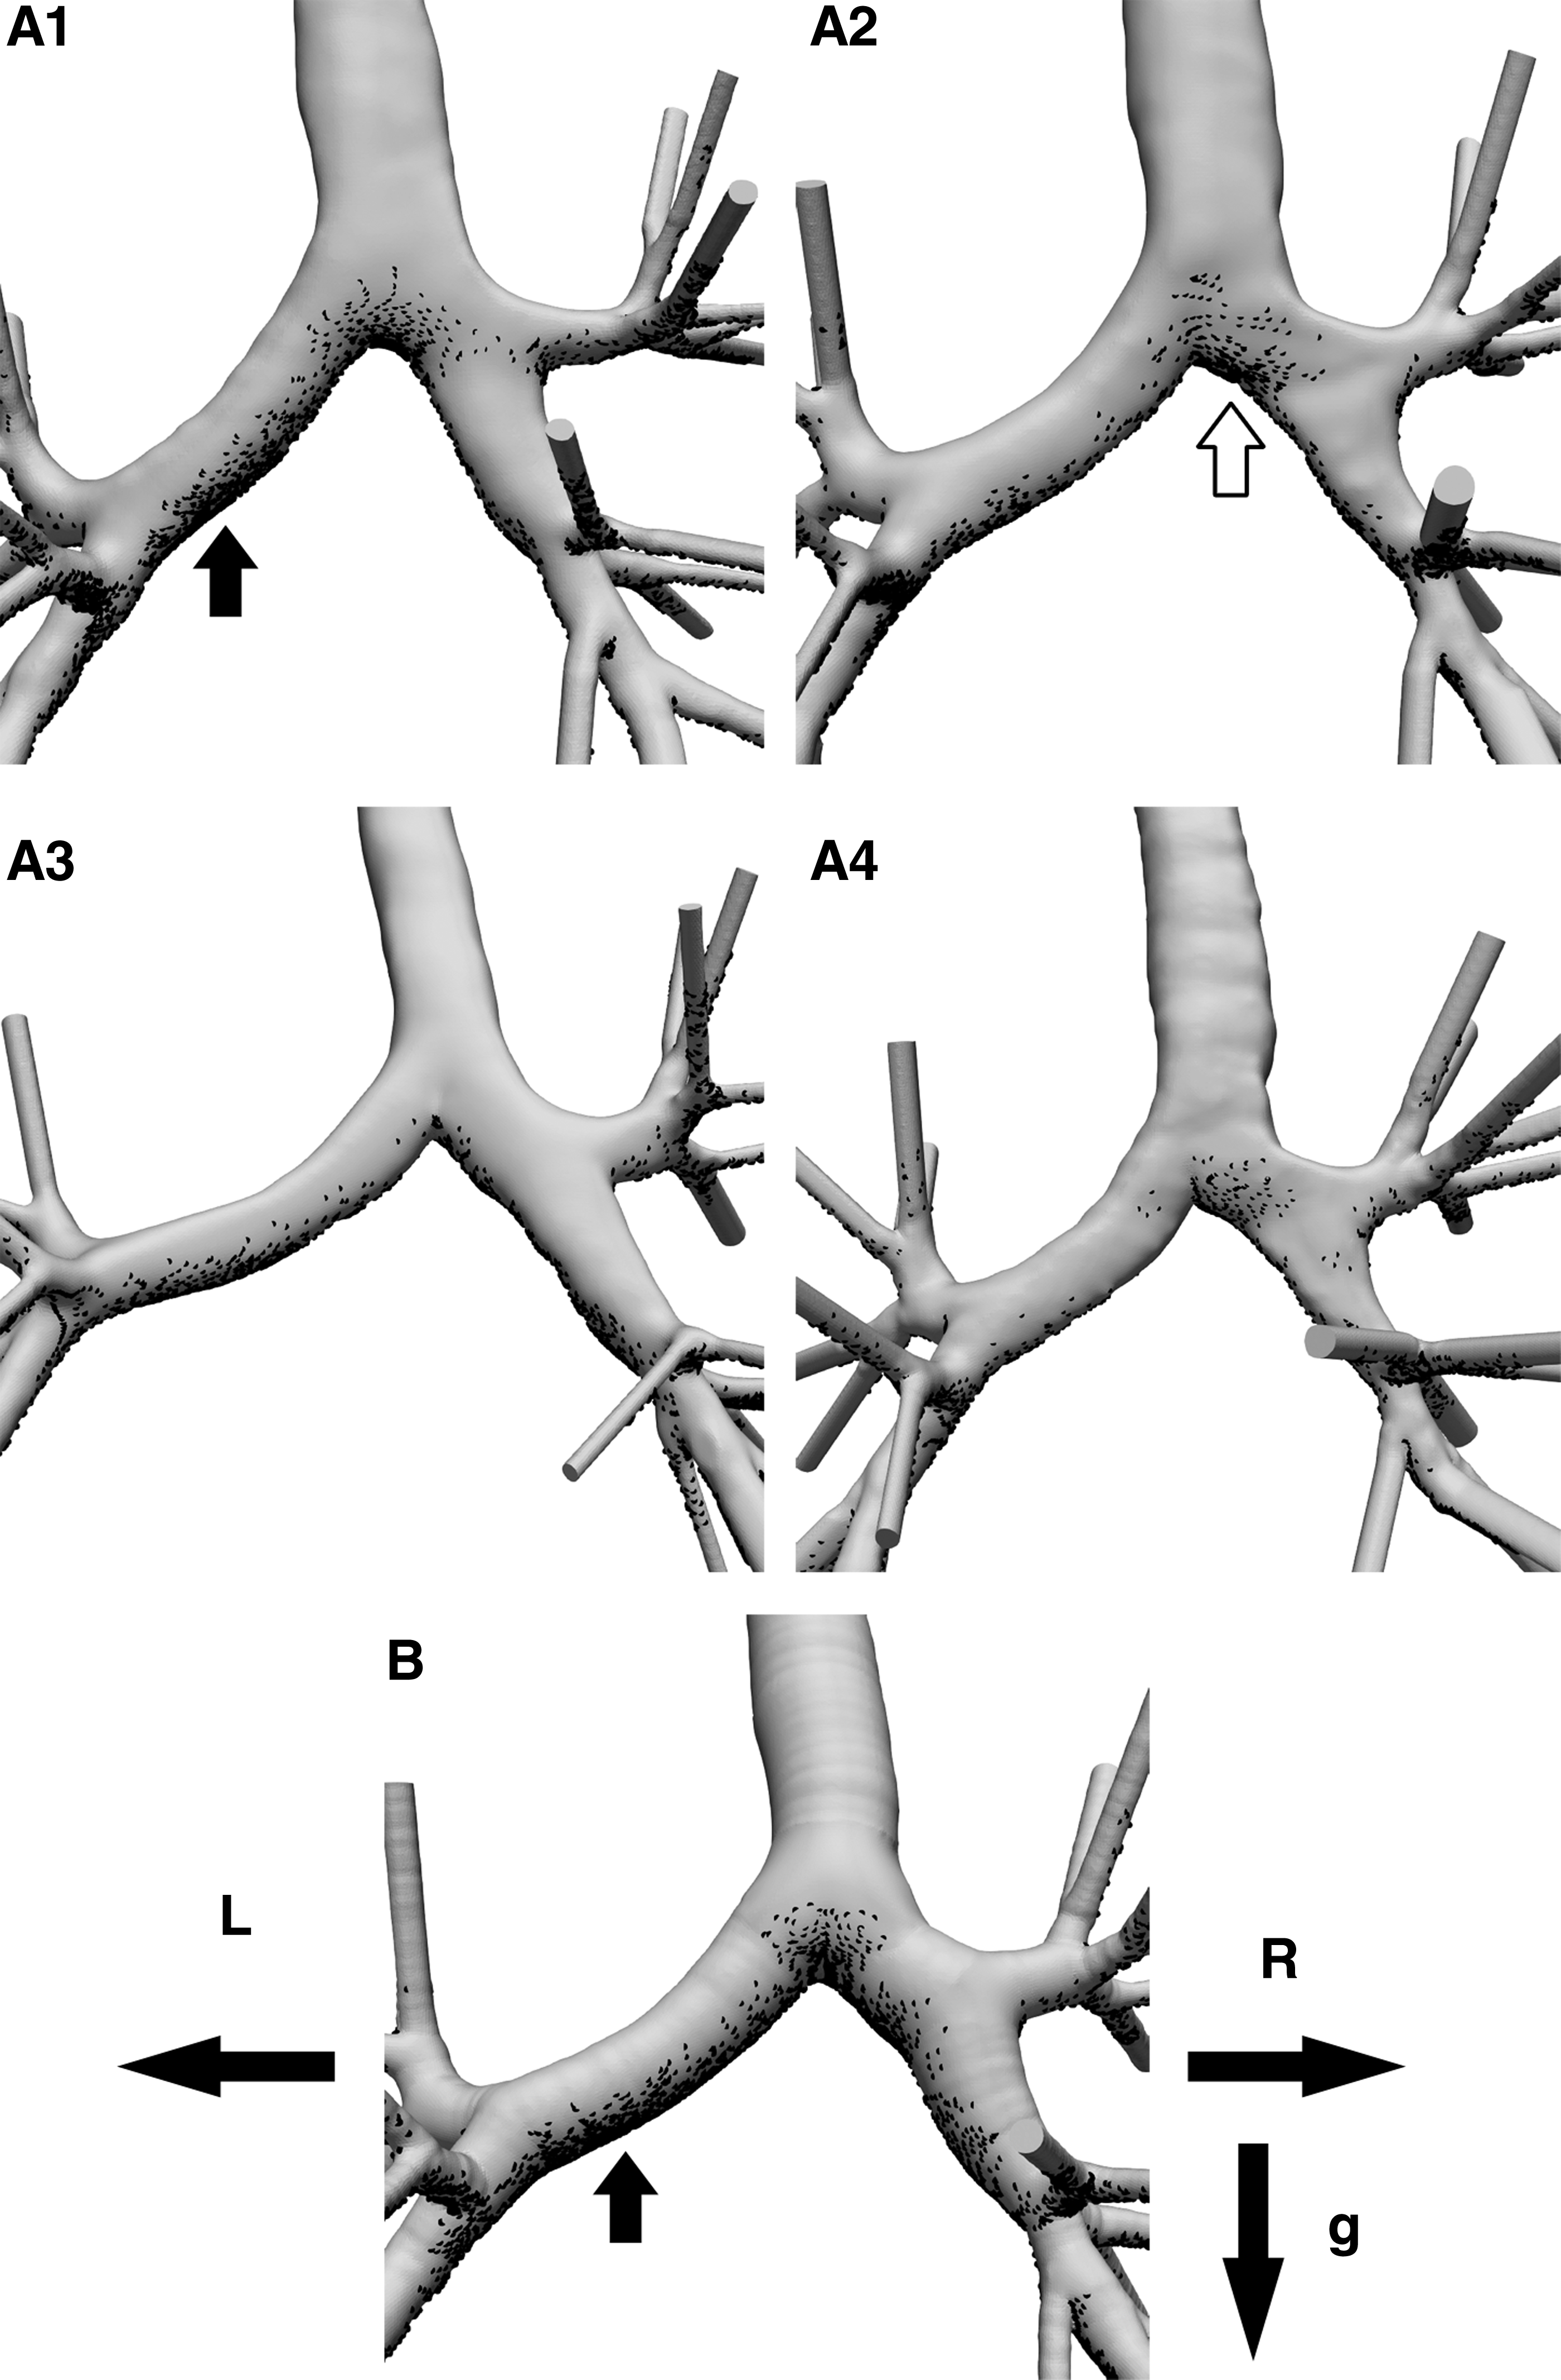
Deposition distributions of the 10 μm particles at the posterior side for the individual models (A1–A4) and the averaged model (B). The particle deposition was relatively high in the left main bronchus (black arrows) in models
Given that similar Reynolds numbers were used for these studies, this difference was likely caused by inlet condition. In the previous study, the flow is biased to the rear (posterior) wall to simulate the influence of larynx, therefore a lot of particles are brought to the posterior wall as well as the anterior wall.(7) In addition, the deposition of particles in the micrometer range is known to be influenced by the gravitational effect.(39,40) The particles deposit due to both inertial and gravitational effects even in generation 3–4 of Weibel's lung model.(40)
It was reported that impaction is the dominant mechanism in the particle deposition on the carinal ridge, while sedimentation occurs along the airway walls that are not parallel to the direction of gravity.(40) The reference Froude number (Frdref)(40) was proposed to represent the relative importance of inertial to gravitational forces on particle motion,
where U and D are the mean inlet velocity and the hydraulic diameter of the trachea, respectively. At large Frdref (>>1), inertial impaction dominates. At small Frdref (<<1), sedimentation becomes the main deposition mechanics. In this study, Frdref was 3.6. The difference between deposition for the “inertial and gravitational” effect and the “inertial-only” effect is likely to be small; however, both impaction and sedimentation may contribute to the particle deposition in the bronchi.
In the individual models in this study, the velocity tended to be higher in the main left bronchus than in the main right bronchus (Figs. 4 and 5), resulting in relatively high particle deposition on the anterior and/or posterior sides of the airways due to inertial impaction and sedimentation in the regions indicated by black arrows in Figures 9 and 10. As a result, the particle deposition occurred primarily at the carinal ridges in the left upper and lower lobes due to inertial impaction. In addition, the curvature of the left main bronchus in model A3 was higher than that in the other individual models (Fig. 1), so secondary flow may increase the deposition at this bronchus (Fig. 9A3).
Similarly, because peak velocity at the main bifurcation was skewed slightly to the right in models A2 and A4, the deposition was higher in the right main bronchus than that in the left main bronchus because of inertial impaction in the regions indicated by white arrows in Figures 9 and 10. The high velocity at the main bifurcation was directed toward the center of the main bronchi in models A1 and A3 (Fig. 5). Thus, the particles were deposited homogeneously especially on the posterior side in model A1 and on the anterior side in model A3 (Figs. 9 and 10). At the right upper lobe, the particle deposition was influenced by the strong secondary motion.(7)
However, in the present work, the particles were deposited at the carina and along the airway walls that were not parallel to the direction of gravity due to impaction and sedimentation; this effect was also observed at other lobes.
In the averaged model, the particles were also deposited at the carina of the bifurcation and the bronchi rather than at the trachea. The particle deposition was higher at the main left bronchus as indicated by the black arrows in Figures 9 and 10 due to the inertia impaction and sedimentation. In addition, at each lobe, particles were deposited at the carina and along the airway walls that were not parallel to the direction of gravity. These results are consistent with those observed in the individual models. Furthermore, high air velocity was predicted near the center of the main bifurcation (Fig. 5), and the particles were deposited homogeneously as seen in models A1 and A3 (Fig. 5).
Discussion
In this study, we numerically investigated the ability of a direct-averaged model of an airway to accurately model those of the individual subjects and facilitate prediction of the airflow and particle deposition in the central conducting airways of the individuals. There were some differences between the airway geometries, including the bifurcation, even among the healthy subjects, which may lead to the observed intersubject variations in not only the flow structure but also the particle transport and deposition.
The averaged model was derived directly from the models constructed from 3D skeletons of four healthy airways. It was found that this averaged model preserves the typical geometrical characteristics of the individual airways: the characteristics of inspiratory flow in the averaged model did not differ significantly from those in the individual models. In addition, the deposition and escape fractions at each of the individual lobes, except for one, were within the ranges of values observed for the models for the individual subjects. Moreover, the particle deposition distribution at the main bifurcation point differed among the healthy subjects, but the characteristics of the averaged model fell within the ranges of variation of the individual subject models.
These findings imply that the averaged model may be useful for predicting the airflow and particle transport of an individual subject on a macroscopic scale. However, our results also indicate that the averaged model does not completely mimic the particle deposition observed in the individual models. The deposition fraction of the averaged model was higher than the average of the values in the individual models and did not fall within the range of variation of the individual. However, the difference in the deposition fraction between individual subjects and averaged model was small in comparison with the interindividual differences.
In addition, the simulation result provided subject-specific information only because of the interindividual differences. Therefore, an averaged geometry should be useful in capturing the flow characteristics as the fabrication of an individual replica is cost prohibitive, but care must be taken such that the predicted characteristics are not strongly biased by averaging.
Geometric variations were observed among the healthy subjects considered here, particularly in the main left- and right-bronchi bifurcations (Fig. 3). These differences resulted in different flow streamlines around the main bifurcation. The boundary conditions for the numerical simulation, including the flow ratio of each bronchus, were basically the same for each subject as the focus of this study was on the effects of the geometric differences on the steady inspiratory flow.
As a result, the velocity was high around the outside wall of the left main bronchus in all subject models (Fig. 4). In the averaged model, however, the streamlines did not fully mimic those in the individual models due to the difference in the bifurcation geometry (Fig. 3B). However, the Reynolds number of the averaged model was within the range of those for the individual subjects and the velocity increased around the same region as in the individual models. Thus, it can be concluded that the streamlines of the models were consistent on a macroscopic scale.
In the tracheobronchial airway, particles are deposited on the carinal ridge by inertial impaction and settle along the airway walls due to the gravitational effect.(40) The particle deposition in the bronchi is influenced by both impaction and sedimentation.(40) In this study, variations in the particle deposition were again observed among the healthy subjects (Fig. 6), but particles were still deposited according to the same mechanisms. For example, the curvature of the left main bronchus of model A3 was higher than that in the other subjects (Fig. 1); the results of secondary flow may have contributed to the relatively high particle deposition at this bronchus (Figs. 5A2 and 9A3).
In addition, the particle deposition at the right main bronchi in models A2 and A4 were higher because of the inertial impaction due to the skewed velocity at the main bifurcation (as indicated by the white arrows in Figs. 9A4 and 10A2). It should be noted that the deposition fraction in the averaged model was larger than the average of those in the individual models and A3 which was the highest among the healthy subjects (Fig. 6). The averaged airway model was obtained from the averaged skeletons and Euclidean distances using an inverse 3D thinning algorithm, which forms a sphere centered on each voxel of the skeleton with a diameter equal to the corresponding Euclidean distance to reconstruct the 3D geometry (Fig. 1(1)).
Therefore, basically, the averaged model does not exhibit any irregularities and constriction in the averaged model. Indeed, the cross sections of main left and right bronchi in the averaged model were round (Fig. 5B). In the averaged model, particles were deposited at the carina by inertial impaction and along the airway walls that were parallel to the direction of gravity in the main bronchi and each lobe; this deposition pattern was consistent with those observed in the individual subjects. In the individual models, the particles were deposited preferentially on the posterior in some models (A1 and A2) but on the anterior side in others (A3 and A4) as shown in Figures 9 and 10.
These results indicate that the particles were deposited dominantly at either the posterior or the anterior side in the individual subjects. However, in the averaged model, the particles were deposited approximately equally on both sides, and exhibited both characteristics of the particle deposition; this was likely because the particle deposition in the averaged model was greater than those in individual model.
In addition, the deposition fraction in the averaged model was higher than those in all of the individual models, particularly in the left lower lobe (Fig. 7). The particles deposition occurred primarily at carina in individual and averaged models, but the particles were also deposited highly at airway surface in averaged model (Fig. 11). The particle deposition was strongly influenced by the airway geometry, and particularly the airway bifurcations are complicated in lobe. Furthermore, the flow and particle distribution as the initial condition of each lobe might be different among the models. However, the difference in the deposition fraction at the left lower lobe between individual subjects and averaged model was small in comparison with the interindividual differences.
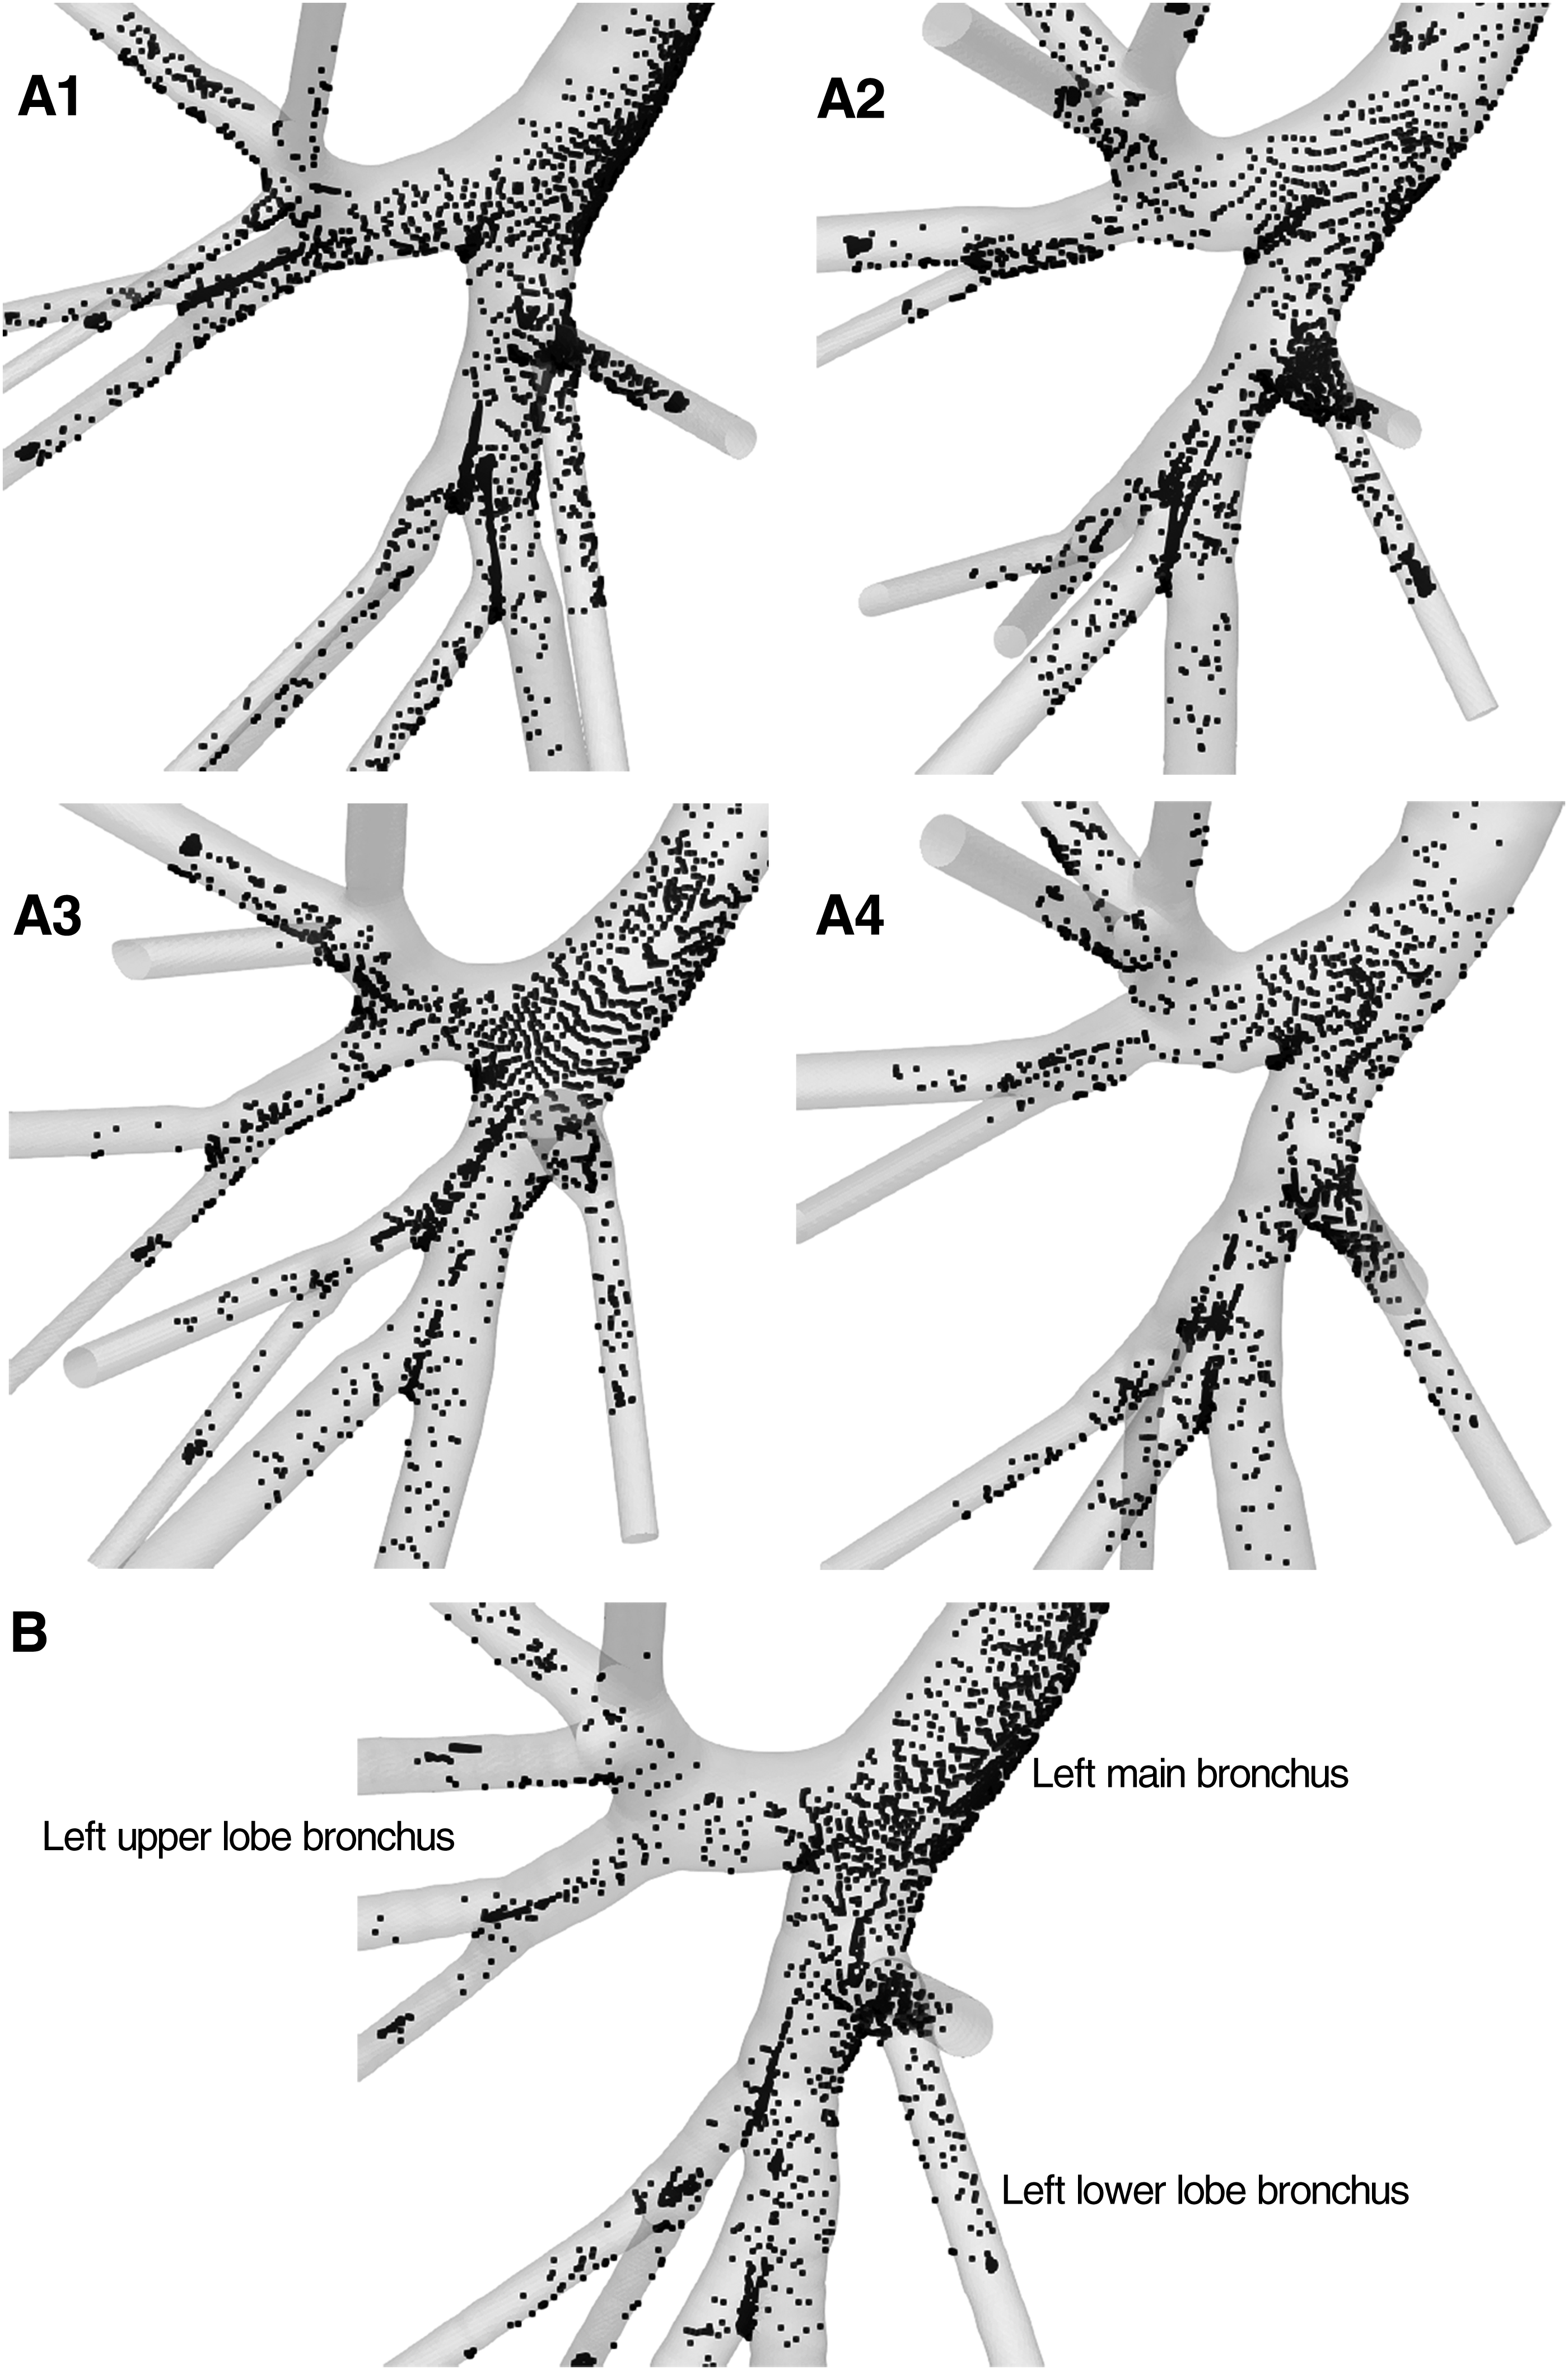
Deposition distributions of the 10 μm particles at the left low lobe for the individual models (A1–A4) and the averaged models (B).
In one previous study, it was reported that the nasal-flow characteristics of an averaged nasal model based on three subjects were within the ranges of those in the original subjects; however, the wall-shear stresses and pressure drops in the averaged model were different.(47) The authors suggested that the flow in an averaged geometry might not represent the median of the flow in the individual subjects. In another study, an idealized airway model, developed based on statistical data,(14) showed no particle deposition on the airway wall until the third airway generation, but the realistic CT image-based model indicated significant deposition even in the trachea and through the third generation.(27) The absence of the airway curvature and surface irregularities in the idealized model resulted in very different flow fields from those in the image-based model.
In this context, the proposed averaged model may be more useful for predicting the individual airflow and particle transport on a macroscopic scale. The deposition and escape fractions at each of the individual lobes were within the ranges of values observed for the models for the individual subjects with the exception of one lobe. The focus of this study was the utility of the direct-averaged model for predicting the particle transport. However, in future work, there is potential for standardization of the airway geometry by developing a direct-averaged model from a larger sample size. Data from a larger range of subjects and a sensitivity assessment are also required in future studies.
Footnotes
Acknowledgments
The work was partially supported by JSPS KAKENHI Grant number JP26350505 and Hosokawa Powder Technology Foundation.
Author Disclosure Statement
The authors declare that no competing financial interests exist.
Reviewed by:
Hadrien Calmer
Chantal Darquenne