
Abstract
Background:
Cancer incidence (CI) and mortality vary significantly among countries and are impacted by numerous factors including the country’s income and human development index (HDI). Cancer mortality (CM) in the adolescent and young adult (AYA) population, the age group of 15 − 39 years, has seen minimal improvement over the past few decades. Our study aims to identify disparities in this group and analyze the influence of income and HDI on these outcomes.
Methods:
We utilized the GLOBOCAN database estimates of incidence and mortality for year 2022 in 185 countries or territories for 36 cancer types to analyze the trends in crude rate of CI and crude rate of CM.
Results:
Globally, in 2022, an estimated 1.32 million new cases of cancer and 379,273 deaths were reported among individuals aged 15–39 years. The CM-to-CI ratios for countries with very high, high, medium, and low HDI were 16.6, 1:4.4, 1: 2.2, and 1:1.9, respectively. Similarly, based on the income level of countries, the CM-to-CI ratios were observed to be 1:8.6 for high-income, 1:4.8 for upper-middle-income, 1:2.3 for lower-middle-income, and 1:1.7 for low-income nations.
Conclusion:
Countries with a higher HDI and income levels experienced a notably higher incidence of cancer. However, the mortality rates were inversely related to the income and HDI. Mortality-to-incidence (CM:CI) ratios were alarmingly higher in countries with lower income and lower HDI. Introducing age-specific reforms and programs for the understudied AYA population in low to middle-income countries can have a significant impact on reducing CM globally.
Introduction
Cancer is a global disease, and the incidence and mortality of this disease vary significantly depending on the geographic region of the world. Analyzing these variations in geography-based differences in cancer burden can help to provide solutions that can improve outcomes globally.
In 2022, it was reported that approximately 20 million individuals were diagnosed with cancer all over the world, and there were about 9.7 million deaths attributed to the disease. 1 It was also estimated that 53.5 million people were living following a cancer diagnosis in the previous five years. Statistically, cancer affects one in every five individuals at some point in their lives, with mortality rates being higher among men, where one in nine individuals lose their life to the disease, compared to one in 12 women who lose their lives to cancer. 1 Of these 20 million, 1.3 million were in the age group of 15–39 years. This particular age group has been of interest lately as the adolescents and young adults (AYAs) fall neither into pediatric age group nor the usual adult cancer age group. Relative to both younger and older demographics, the population aged 15 − 39 years has experienced little progress in reducing cancer mortality (CM) rates in recent decades. 2 For this reason, the U.S. Department of Health and Human Services, the National Cancer Institute, the National Institutes of Health, and the LIVESTRONG Adult Alliance Group have formed the Adolescents and Young Adult Oncology Progress Review Group with the goal of studying and improving cancer-related outcomes in this age group.3–5
Cancer epidemiology is influenced by diverse factors such as geographic location, age, and gender.6,7 In some parts of the world, viral infections are a known etiological factor for several cancers. Among the other variables affecting the incidence and mortality of cancers, the level of income can play a major role and potentially a modifiable risk factor for influencing cancer-related outcomes. 8 In addition, countries with a high human development index (HDI) and high income (HI) tend to have more cancer awareness programs and likely also better access to health care leading to earlier detection of cancer and treatment with possibly advanced care compared to low HDI and low-income (LI) countries. 9
The aim of this study is to analyze the trends and disparities in global cancer incidence (CI) and mortality (CM) for the AYA population and to explore the impact of income and HDI on these outcomes.
Methods
In this cross-sectional study, we utilized the GLOBOCAN 2022 database to obtain the CI and CM data in different types of cancers for patients in the 15–39 years (AYA) age group. 1 This database estimates CI rates using varying methods based on available data in each country. For 55 nations, previously observed national or subnational rates (with coverage greater than 50%) are projected to 2022. In 22 nations, the most recent rates from a single cancer registry are applied to their 2022 population, while 17 countries leverage a weighted or simple average of the most recent subnational rates. In eight countries, national mortality data is transformed into incidence rates using their own cancer registry-derived mortality-to-incidence ratios. Neighboring countries’ registry ratios are employed for nine nations, while 35 nations estimate incidence rates using mortality-to-incidence ratios derived from survival estimates. Additionally, one nation directly utilizes specific “all sites” cancer frequency data from neighboring countries. Notably, for 38 countries lacking data, incidence rates are estimated by averaging those of neighboring countries or registries in the same area. 1
Similarly, mortality rates were obtained from these same 185 countries. Of these, 90 countries utilized the previously observed national mortality rates projected for the year 2022. The mortality rates of three countries were based on the most recently observed national mortality rates, applied to their 2022 population. In 91 countries, mortality rates were estimated from the corresponding national incidence estimates by using mortality-to-incidence ratios derived from survival estimation. Finally, the mortality rates of one country were estimated using incidence-to-mortality ratios derived from neighboring countries’ cancer registry data.1,10
The gathered data from GLOBOCAN 2022 was then analyzed based on the HDI as well as income status and divided into four categories based on each variable. HDI is a static composite index that is calculated based on life expectancy, education, and per capita income indicators. The countries were ranked into the four HDI tiers: very high human development index (VHHDI), high human development index (HHDI), medium human development index (MHDI), and low human development index (LHDI) based on the United Nations Development programme 2019 human development reports. 11 The study used ICD-10 codes to identify the specific cancer types included in this study, ensuring consistency and accuracy in the classification of cancer diagnoses. Only the top 10 cancers in each group were mentioned in this study to perform meaningful analysis and avoid the rare cancers with a low burden influencing the results of the study. The data was also analyzed based on the income status. For this, the study utilized the classification proposed by the World Bank which divides the world into four groups based on income (HI), upper middle income (UMI), low middle income (LMI), and low income (LI). 12
The incidence and mortality data gathered from GLOBOCAN 2022 is expressed in crude rates. CI and CM are calculated by dividing the number of new cancer cases or cancer deaths during a given time period by the number of individuals in a population at risk. For cancer, this is usually expressed for every 100,000 people. The reason to utilize CI and CM is to minimize the chances of false elevation (in high populated countries) or undervaluation (low-populated countries) in a country irrespective of the population size. For example, a highly populated country will have high incidence and high mortality for any kind of cancer. Expressing the incidence and mortality in crude rates will minimize such misinterpretation of numbers in both high- and low-population countries.
To assess cancer burden in the AYA population, we used the mortality-to-incidence ratio (CM:CI) as a key metric. This ratio offers insight into cancer management and outcomes, as it reflects the relative rate of individuals who eventually die from the disease compared to individuals diagnosed with cancer.13,14 A higher CM:CI ratio indicates a relatively higher mortality rate in relation to the incidence rate, suggesting poorer outcomes., suggesting poorer survival outcomes or more advanced disease at diagnosis, while a lower CM:CI ratio reflects better survival rates or effective cancer management. By analyzing this metric across HDI and income tiers, we aimed to highlight disparities in cancer outcomes for AYA populations across different global regions, illustrating the relationship between development, health care access, and cancer survival rate.
Results
For the year 2022, there were an estimated 1.32 million new cancer cases and 379,273 deaths for patients in the age group 15–39 years of age. The top 10 cancers by incidence and mortality in men, women, and combined populations for the AYA group are tabulated in Supplementary Table S1 and Supplementary Table S2, respectively. CI was significantly higher in women when compared to men in the AYA group with a 1.9:1 ratio. However, CM was found to be comparable for women and men with a ratio of 1.2:1 We now compared the CM-to-CI ratio for both genders. The CM:CI ratio was more favorable for women (1:4) versus (1:2.6) for men, demonstrating better rates of overall cancer survival in the female population. Figure 1 represents the heat map for cancer incidence in the AYA population, while Figure 2 represents the heat map for cancer mortality in the AYA population.
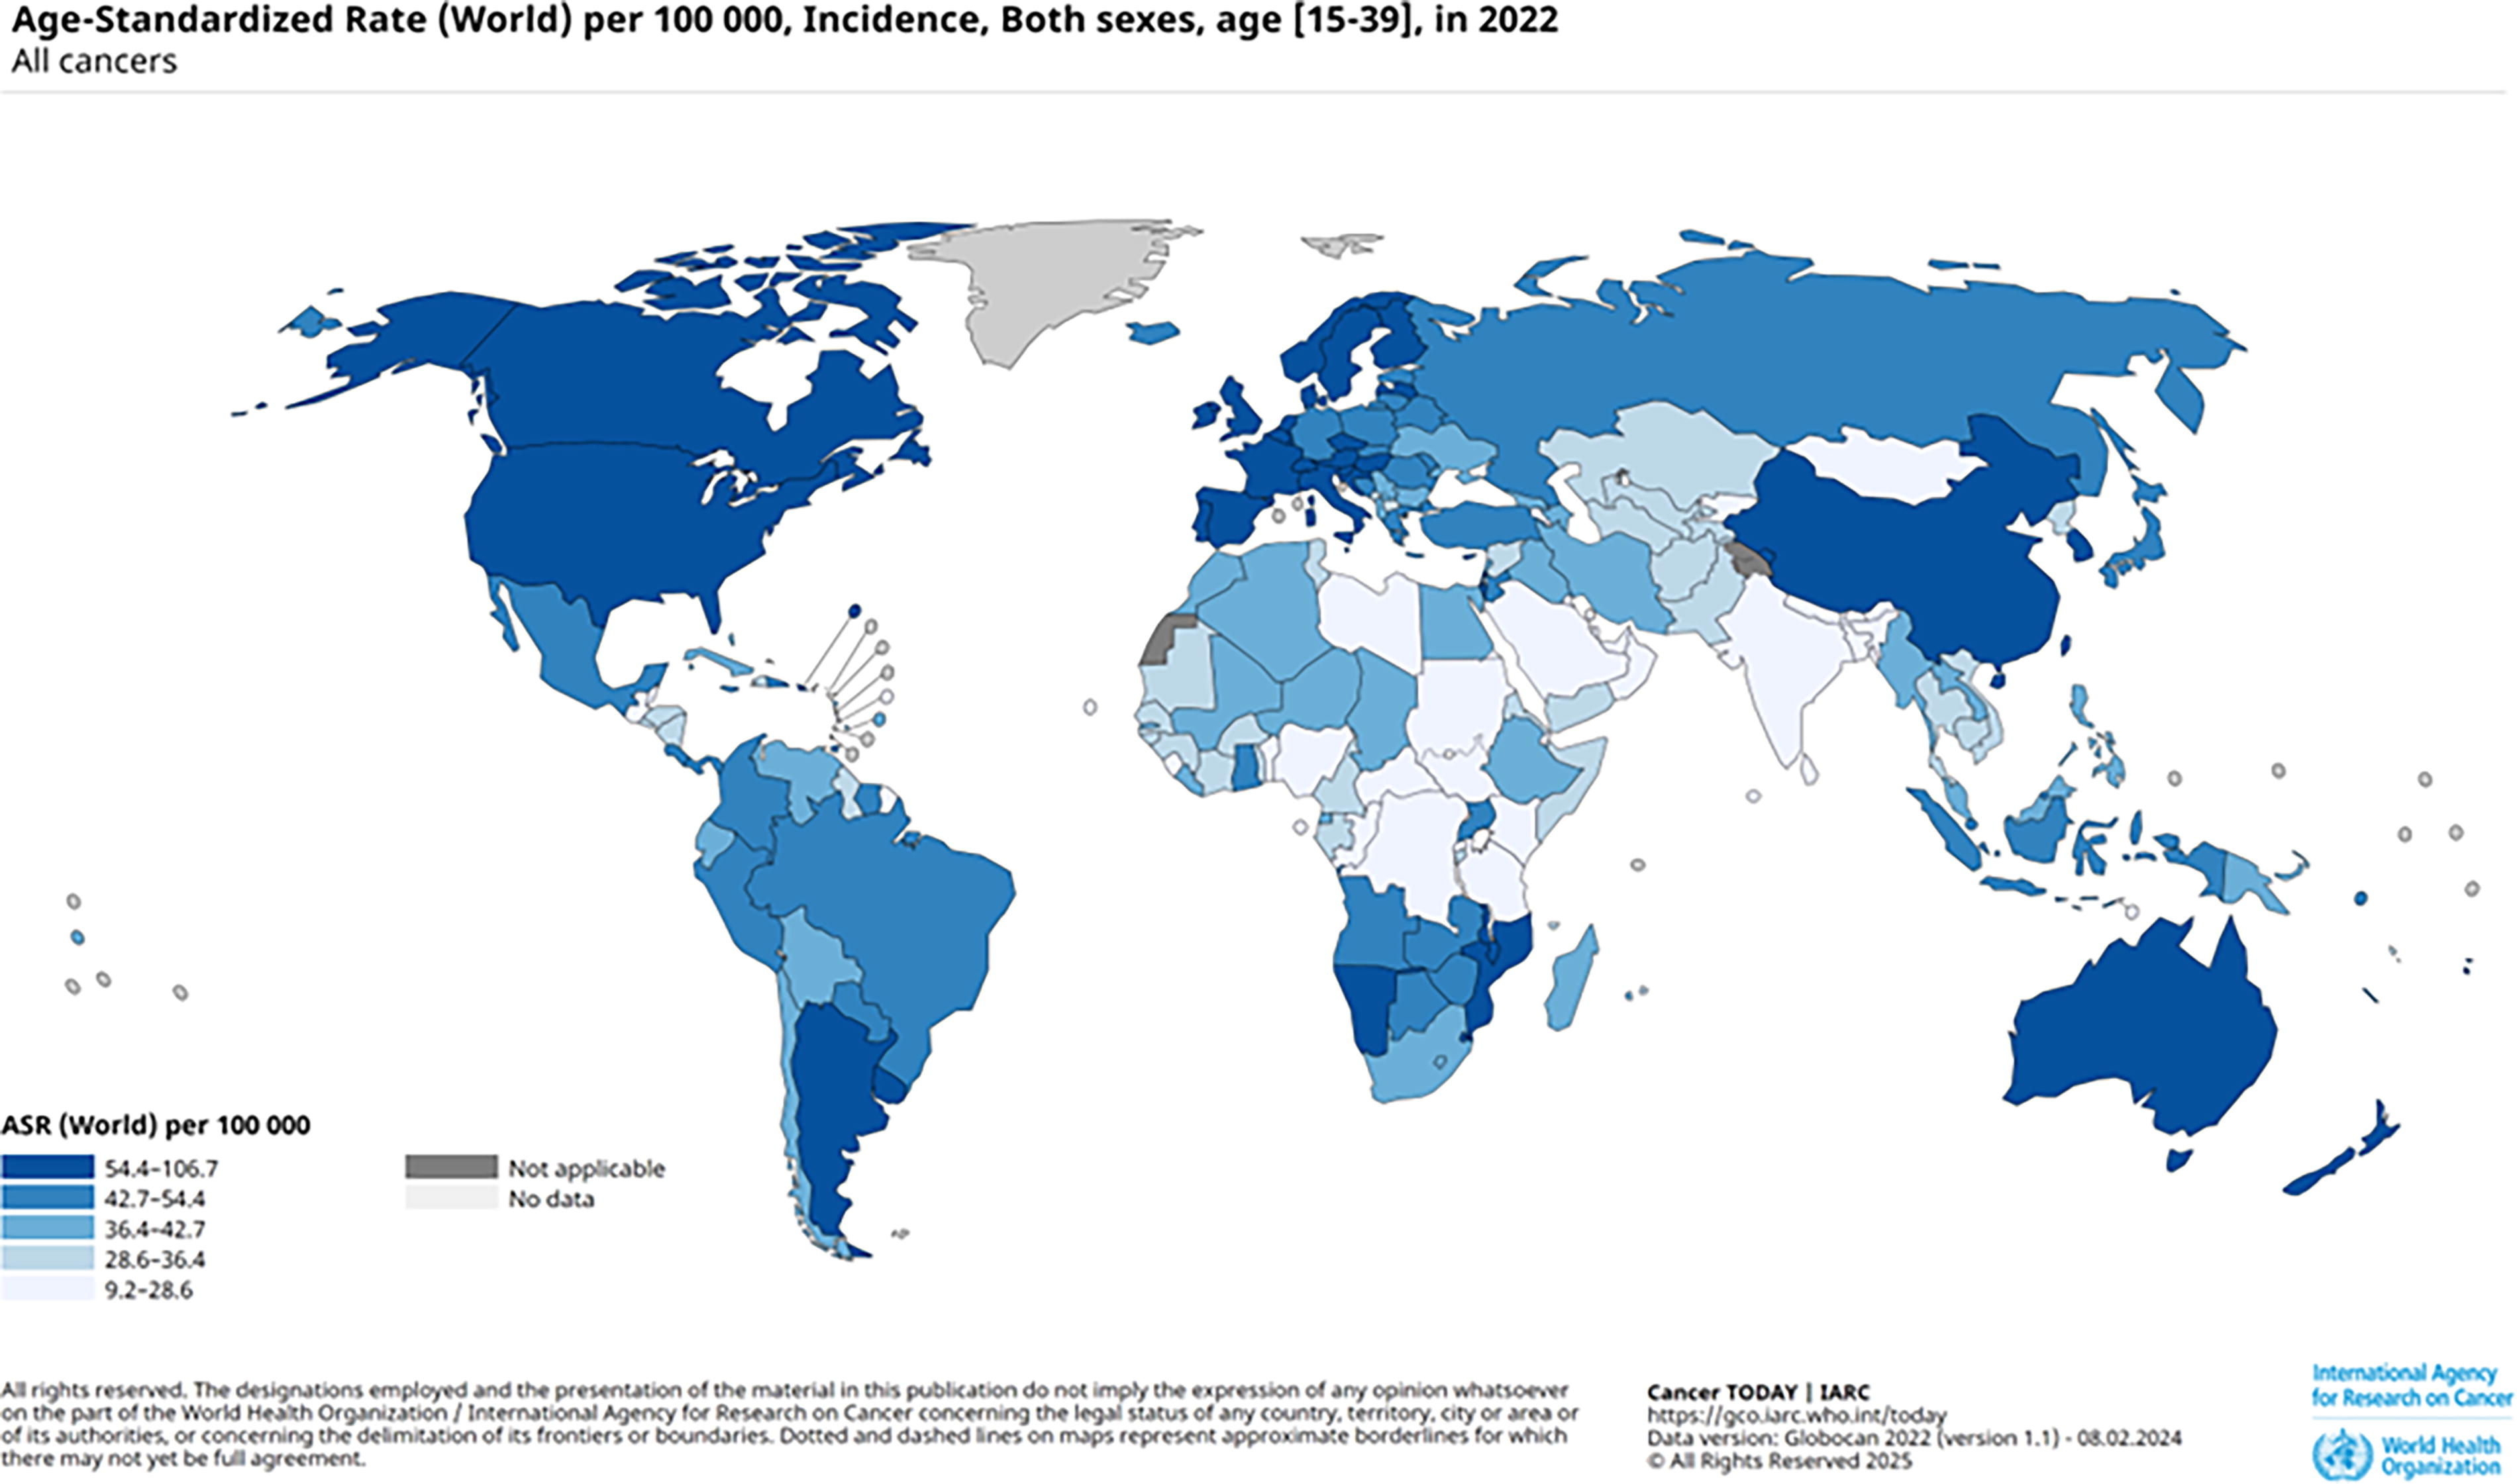
Heat map for age standardized incidence across the world in AYA population. AYA, adolescent and young adult population.
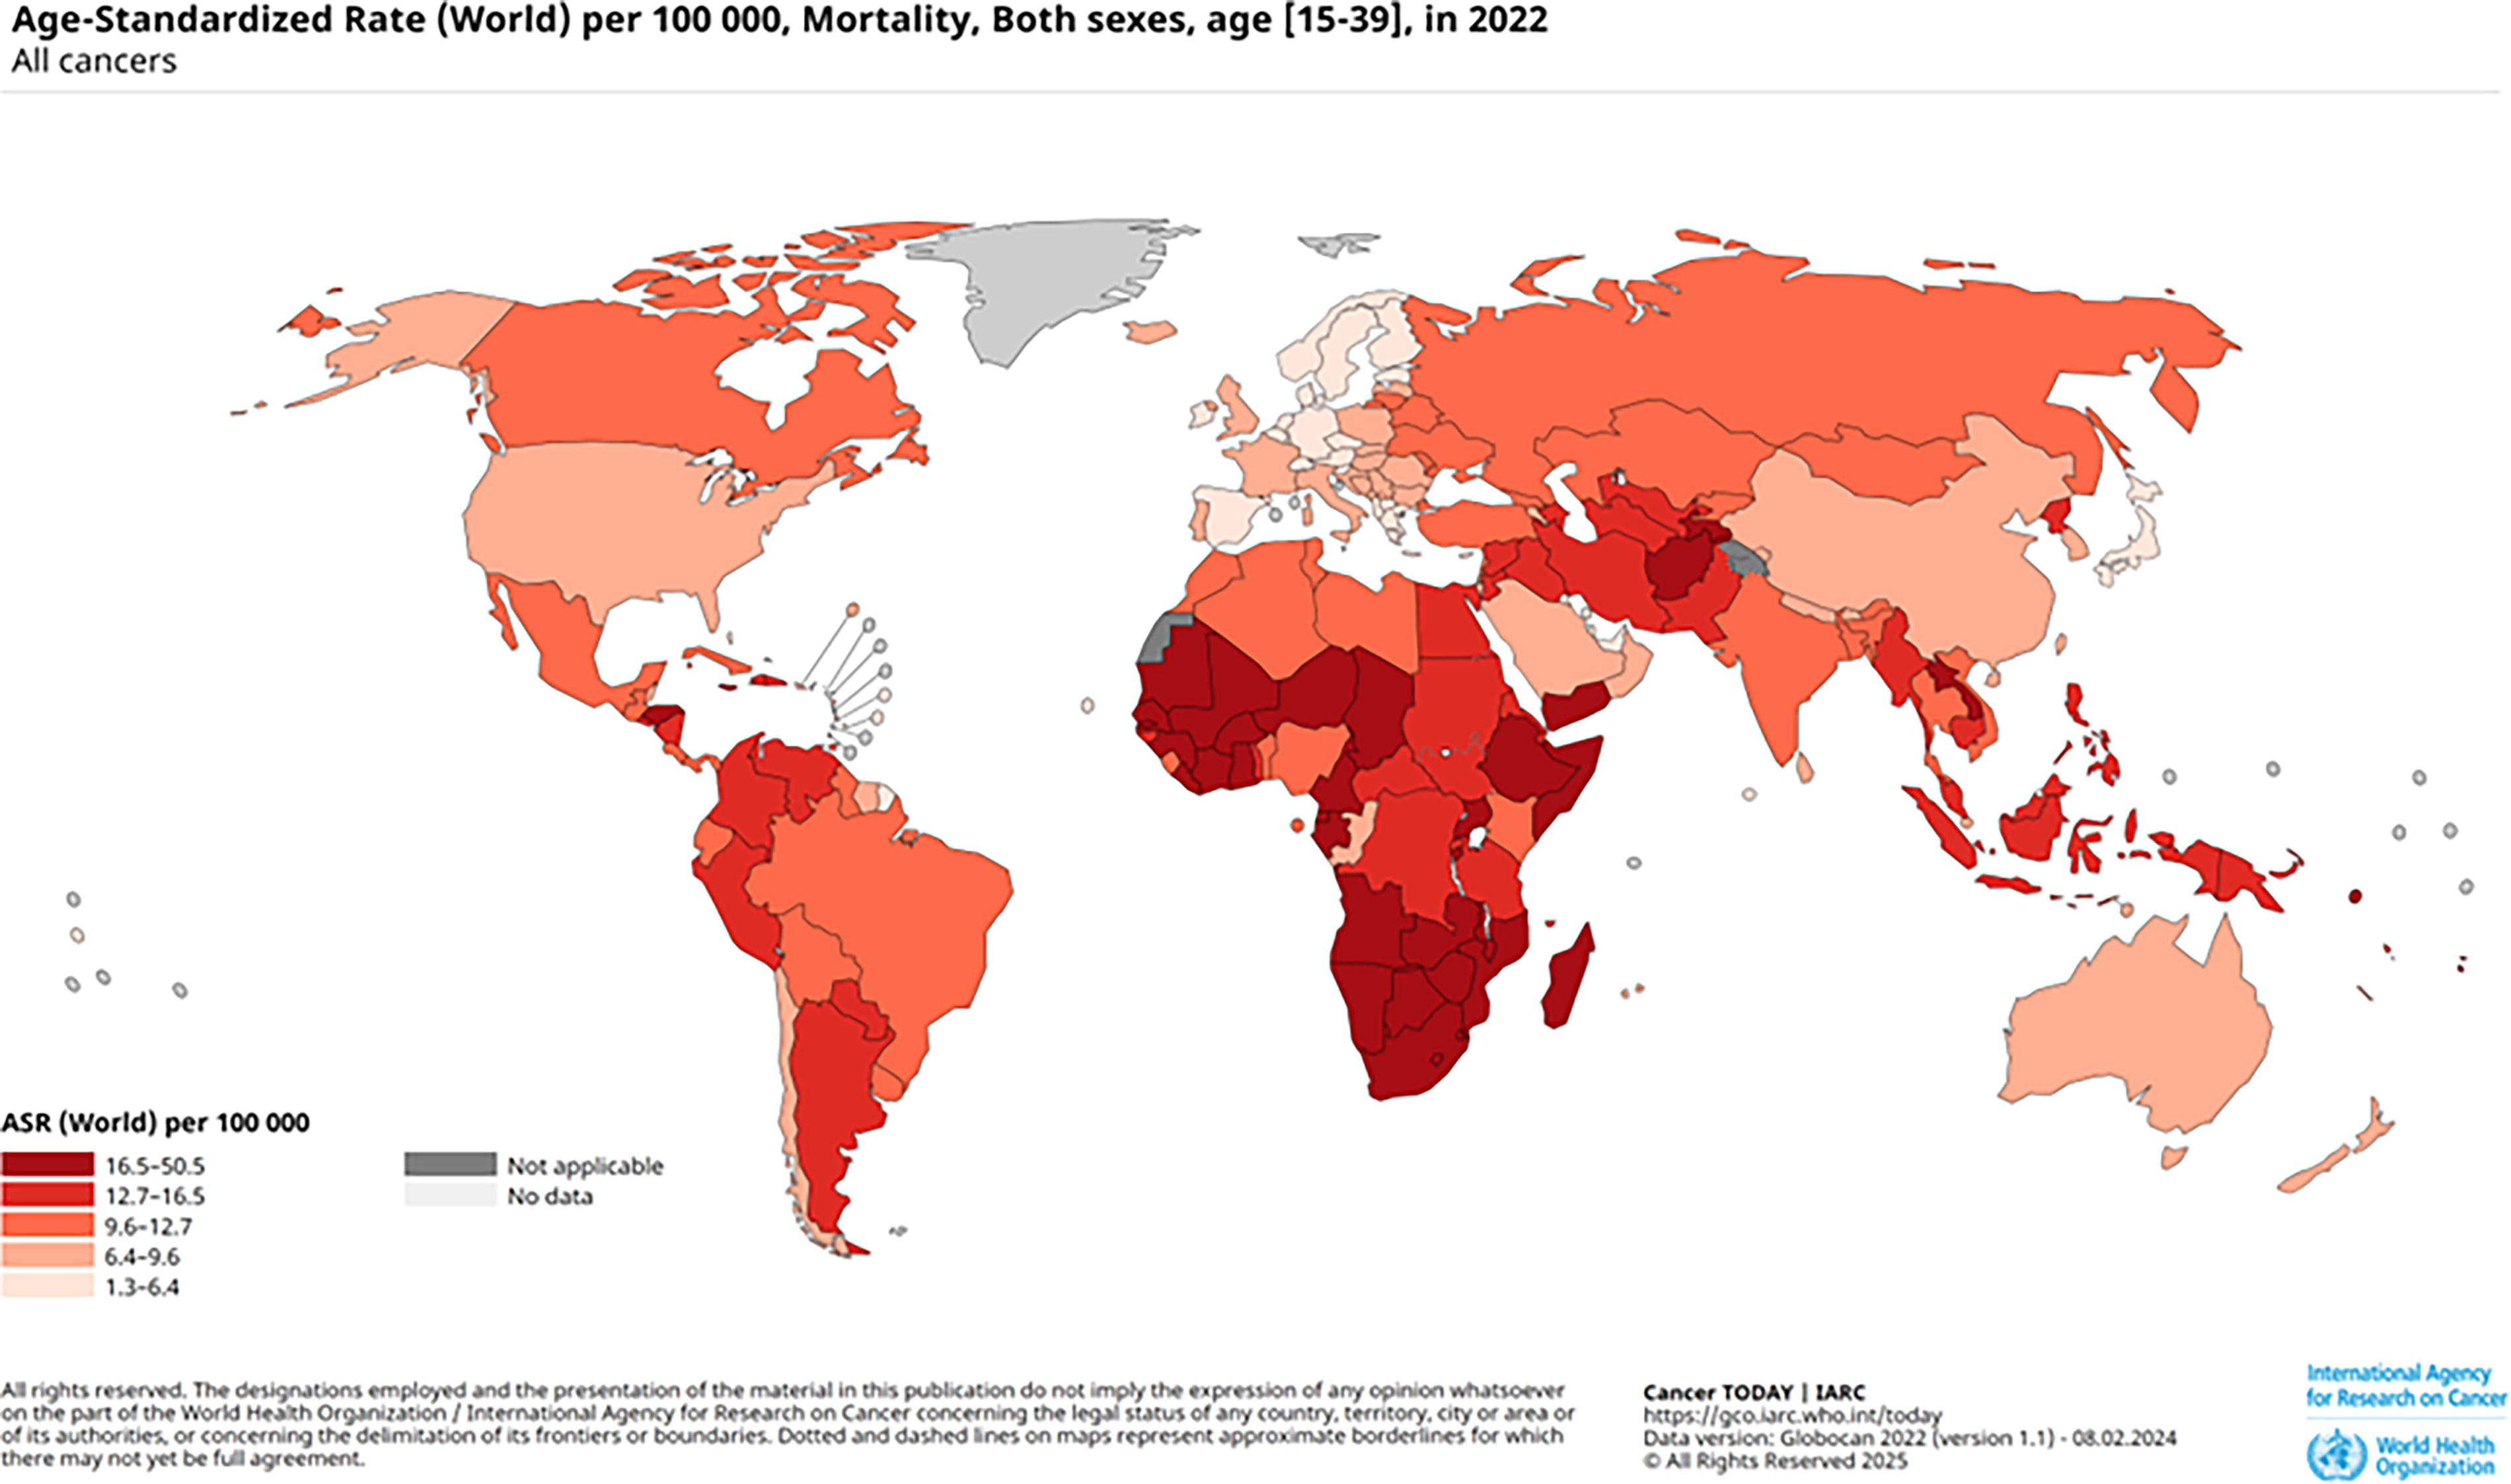
Heat map for age standardized mortality across the world in AYA population.
Findings based on HDI
In the GLOBOCAN 2022 database, the entire world population is divided into four tiers of HDI excluding India and China, which were reported separately and not included in any of the tiers.
VHHDI tier
The current burden of CI and CM in the VHHDI tier is depicted in detail in Supplementary Figure S1. For the year 2022, there were 342,827 new cancer cases with 51,924 cancer-related deaths. This translates to crude rates of 64.9 for CI and 9.8 for CM, respectively. The CI crude rate of 64.9 is the highest and the CM rate of 9.8 is the lowest across all four tiers of HDI. The overall CM:CI ratio for the VHHDI tier is 1:6.6 with a more favorable ratio for women (1:7.9) when compared to men (1:5.2). This implies that although the VHHDI tier has the highest number of new cancer cases by incidence, it also has the lowest rate of cancer-related mortality. The overall CM-to-CI ratio is observed at 1:7 with 1:5.2 in men and 1:8.6 in women.
HHDI tier
The current burden of CI and CM in the HHDI tier is depicted in detail in Supplementary Figure S2. For the year 2022, there were 551,560 new cancer cases with 124,322 cancer-related deaths. The crude rate of CI and CM in HHDI stands at 56.5 and 12.7, respectively. The overall CM:CI ratio for the HHDI tier is 1:4.4, with women (1:5.5) demonstrating a better survival pattern when compared to men (1:2.3).
MHDI tier
The current burden of CI and CM in the MHDI tier is depicted in detail in Supplementary Figure S3. For the year 2022, there were 274,258 new cancer cases with 122,843 cancer-related deaths. The crude rate of CI and CM in MHDI stands at 28.9 and 13.0, respectively. The overall CM:CI ratio for the MHDI tier is 1:2.2, with women (1:2.5) demonstrating a marginally improved survival when compared to men (1:1.8).
LHDI tier
The current burden of CI and CM in the LHDI tier is depicted in detail in Supplementary Figure S4. For the year 2022, there were 152,829 new cancer cases with 80,086 cancer-related deaths. The crude rate of CI and CM in LHDI stands at 31.3 and 16.4, respectively. The overall CM:CI ratio for this tier is 1:1.9, with a marginally better survival for women (1:2) when compared to men (1:1.5). It is important to notice that the crude rate of CM for the LHDI tier is the highest across all four tiers of HDI. In addition, the CM:CI ratio is also the highest in this tier when compared to all the other HDI tiers. Figure 3 illustrates the variations in CI and CM in the AYA population based on the Human HDI and income levels.
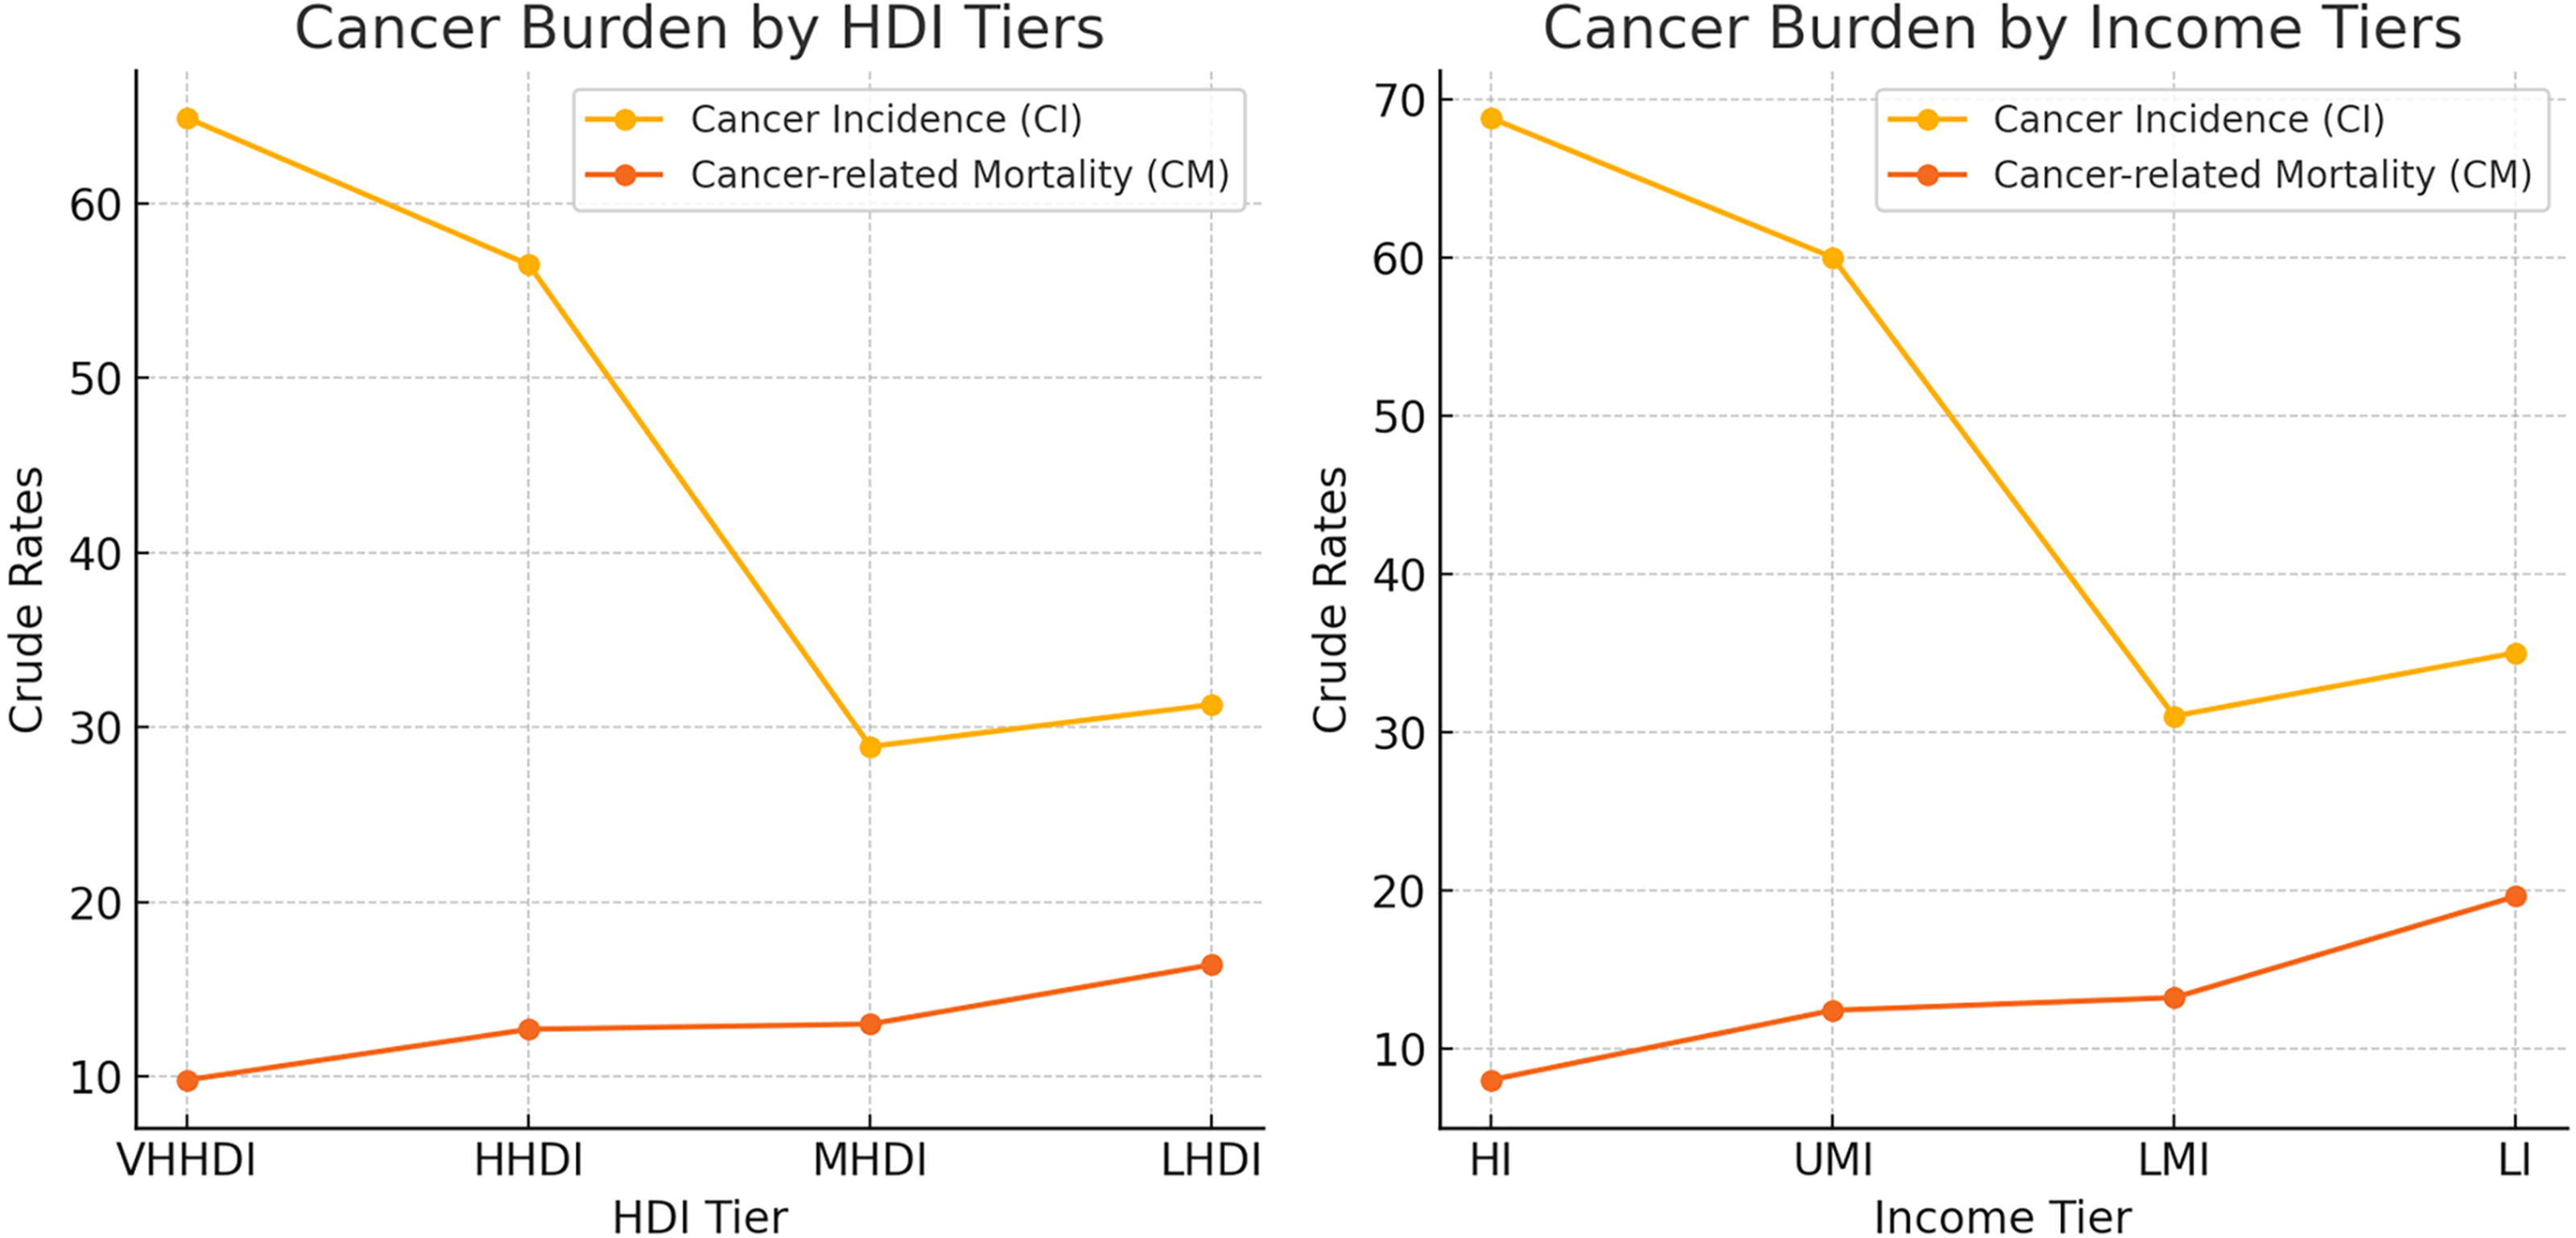
Line diagram representing variations in CI and CM in AYA population based on human development index (HDI) and income. CI, cancer incidence; CM, cancer mortality.
Findings based on income
The CI, CM, and crude rates along with CM:CI ratios when grouped as per their income largely mimic their counterparts on HDI barring some findings.
HI tier
The current burden of CI and CM in HI tier is depicted in detail in Supplementary Figure S5. For the year 2022, there were 255,718 new cancer cases with 29,818 cancer-related deaths. The crude rates of CI and CM in HI group stand at 68.8 and 8.0, respectively. It is important to note that HI tier has the highest crude rate of CI and the lowest crude rate of CM across all four income-based tiers. The overall CM-to-CI ratio for this tier is 1:8.6 with women again demonstrating a favorable survival pattern (1:6.5) when compared to men (1:10.3). The CM:CI ratio for women in this tier is lower than all the other income tiers by a significant margin.
UMI tier
The current burden of CI and CM in UMI tier is depicted in detail in Supplementary Figure S6. For the year 2022, there were 528,491 new cancer cases with 109,007 cancer-related deaths. The crude rates of CI and CM in the UMI group stand at 60.0 and 12.4, respectively. The overall CM:CI ratio for this tier is 1:4.8, with women (1:3.4) demonstrating better survival when compared to men (1:6.2).
LMI tier
The current burden of CI and CM in LMI tier is depicted in detail in Supplementary Figure S7. For the year 2022, there were 433,049 new cancer cases with 183,452 cancer-related deaths. The crude rates of CI and CM in the LMI group stand at 31.0 and 13.2, respectively. The overall CM-to-CI ratio for this tier is 1:2.3, with women (1:1.9) demonstrating better survival when compared to men (1:2.6).
LI tier
The current burden of CI and CM in LI tier is depicted in detail in Supplementary Figure S8. For the year 2022, there were 99,001 new cancer cases with 55,264 cancer-related deaths. The crude rates of CI and CM in the LI group stand at 35.0 and 19.6, respectively. The overall CM-to-CI ratio for this tier is 1:1.7, with women (1:1.5) demonstrating better survival when compared to men (1:1.9). It is important to notice that the LI group has the highest crude rate for CM despite having the second lowest crude rate of CI.
Discussion
The mortality and morbidity associated with cancer has been consistently improving. Yet, for AYAs aged 15–39 years, the progress has not matched that seen in younger or older age groups.2,5 Several factors including socioeconomic conditions, cancer biology, treatment plans, compliance with treatments, side effects of therapies, and limited access to care for survivors, can account for the differences in outcomes. 15
Our study primarily focused on CM and CI in AYA population based on HDI and income. We have observed several striking findings when the CI and CM were studied based on HDI (Table 1). The crude rate of CI is directly proportional to HDI with higher rates noticed in VHHDI countries. On the contrary, as the HDI goes down, it is found that the CM gradually increases with the worse crude rate seen in LHDI group. CM-to-CI ratio is similarly highest among the LHDI tier population with one death seen for every 1.9 newly diagnosed patients with cancer. The ratio is lowest for VHHDI tier population with one death occurring for every 6.6 newly diagnosed patients with cancer.
Current Global Cancer Burden Variations Basing on Human Development Index and Income
AYA, adolescent and young adult population; CI, cancer incidence; CM, cancer mortality; HDI, human development index; HHDI, high human development index; HI, high income; LHDI, low human development index; LI, low income; LMI, low middle income; MHDI, medium human development index; UMI, upper middle income; VHHDI, very high human development index.
The higher CI in countries with VHHDI compared to those with LHDI can be attributed to differences in screening and detection practices, genetic predispositions, and varying levels of exposure to other risk factors. 16 These variations help explain the more frequent identification of cancers in VHHDI countries, where advanced health care systems often lead to earlier and more frequent cancer diagnoses. This phenomenon could have potentially led to a shift away from natural selection, with an accumulation of CI over generations in countries with VHHDI. Furthermore, countries with higher HDI tend to have lower death and birth rates, which might also play a role in the heightened accumulation of genetic predispositions to cancer. 15
HDI is a composite index taking life expectancy, education, and per capita income into account. 17 These variables are interrelated and usually directly proportional to income. It is realistic to imagine the population with HI able to obtain higher education and access to superior health care, thus increasing life expectancy. However, many countries with LI tend to provide their citizens with free education and free access to public hospitals. While access to health care is theoretically universal, practical barriers such as long waiting times, limited availability of specialized services, and regional disparities can still lead to delays in diagnosis and treatment. These challenges can contribute to higher morbidity and mortality rates, as even with free health care, timely and adequate access to diagnostic and therapeutic services may not be guaranteed for all patients. 18 Grouping the population basing on income and studying them as income-based groups would identify the areas of potential improvement where education and life expectancy are not taken into account. This prompted us to further observe the CI, CM, and CM:CI ratios based on their income. Our grouped data revealed some striking findings. LI countries had high mortality yet low incidence, while HI countries had low mortality yet high incidence. The differences in CM:CI ratios between the HI and LI countries are remarkable with one death for every 8.6 newly diagnosed cancers in HI countries versus one death for every 1.7 new cases diagnosed in LI countries. The ratio increases significantly between HI and UMI countries as well to one death for every 4.8 newly diagnosed cancers in UMI group. These findings are depicted in Table 1. The observed differences in cancer burden and mortality between HI and LI countries can be partially explained by health care access, policies, and resource allocation. In LI countries, patients often face significant barriers to early diagnosis and treatment, such as limited health care infrastructure and lack of specialized services, which may lead to higher mortality rates despite lower CI. In contrast, HI countries, with more robust health care systems, have better access to early detection and treatment, resulting in higher CI but lower mortality. Additionally, AYA patients from deprived backgrounds may face challenges in accessing timely care, often presenting at more advanced stages of cancer, which increases their risk of mortality. These differences highlight the critical role that health care policies and resource allocation play in shaping cancer outcomes across various income levels. 19 Moreover, the improved CM rates in HI countries are indicative of their substantial investment in oncology care. On average, HI areas allocate 5–10 times more per person toward cancer control compared to low- and middle-income countries 20 Several studies from HI countries have reported increased survival rates in the AYA group within the past decade.2,21 Health care policies specific to AYA age group that address their unique needs in terms of cancer biology, access to treatment, survivorship care, and promotion of clinical trial participation are fundamental in improving the mortality rates.15,22 Successful implementation of these policies in nations with lower income and HDI, albeit a complex task, can alter the trajectory of mortality rates.
This comprehensive study among AYA based on HDI and income elucidates critical insights into the disparities in CI and CM across varying socioeconomic strata. The findings underscore a discernible pattern: a direct correlation between HDI and CI, with higher rates observed in VHHDI countries, and a converse relationship with CM, indicating poorer outcomes in LHDI nations. Of particular note is the striking CM-to-CI ratio, which peaks among LHDI populations, signaling a heightened risk of mortality relative to incidence, while VHHDI populations exhibit a lower ratio, suggestive of better survival prospects. Notably, income-based analysis further accentuates these disparities, revealing pronounced differences in cancer outcomes between HI and LI countries. HI countries, characterized by lower CM yet higher CI, emphasizes the pivotal role of robust health care policies and substantial investment in oncology care. Conversely, LI countries grapple with higher CM and lower CI, highlighting the urgent need for targeted interventions and resource allocation to bridge the gap in cancer care.
Summary and Conclusion
This study reveals that CM rates are notably higher in countries with lower HDI and in LI nations, highlighting significant disparities in cancer outcomes correlated with socioeconomic development. In contrast, higher-income and higher-HDI countries have benefited from health care policies and research initiatives tailored to the AYA population, leading to improved survival rates. To reduce CM and improve mortality-to-incidence ratios in lower-income and lower-HDI countries, we recommend the following targeted strategies: implement cancer screening and early detection programs to improve survival rates through timely diagnosis, particularly in resource-limited settings. Expand access to essential treatments, such as chemotherapy, radiotherapy, and surgery, by investing in health care infrastructure in low- and middle-income regions. Promote cancer awareness campaigns tailored to the AYA population to encourage early detection and preventive behaviors. Last, prioritize health care system reforms that focus on equitable access to cancer care for young adults in these countries. However, it’s important to note that the CM:CI ratio does not fully capture the complexities influencing cancer outcomes. Factors like underdiagnosis in LI countries and the impact of awareness policies are not entirely explained by incidence and mortality rates alone. Although our findings provide valuable insights, they represent part of a larger, multifaceted issue. Further research is needed to address additional factors—such as health care access, cultural influences, and genetic predispositions—to better understand and address cancer outcomes in AYAs globally.
Footnotes
Acknowledgments
The authors would like to express their sincere gratitude to the Miami Cancer Institute for their support and resources that significantly contributed to the completion of this study. They also extend appreciation to the team at GLOBOCAN for providing access to their comprehensive database, which served as the foundation for analysis. Additionally, the authors would also like to thank all colleagues and collaborators whose insights and feedback enriched the quality of this research.
Authors’ Contributions
M.A.G.: Conceptualization, methodology, formal analysis, writing—original draft, and visualization. M.A.: Data curation, formal analysis, validation, and writing—review and editing. R.D.: Methodology, validation, supervision, and writing—review and editing. A.C.: Data curation, resources, writing—review and editing. M.P.: Formal analysis, visualization, writing—review and editing. A.A.K. and A.P.A.: Data curation, validation, writing—review and editing. R.G.: Conceptualization, supervision, project administration, funding acquisition, writing—review and editing. All authors have read and approved the final article and agree to be accountable for all aspects of the work.
Author Disclosure Statement
No competing financial interests exist.
Funding Information
This research received no specific grant from any funding agency in the public, commercial, or not-for-profit sectors.
References
Supplementary Material
Please find the following supplemental material available below.
For Open Access articles published under a Creative Commons License, all supplemental material carries the same license as the article it is associated with.
For non-Open Access articles published, all supplemental material carries a non-exclusive license, and permission requests for re-use of supplemental material or any part of supplemental material shall be sent directly to the copyright owner as specified in the copyright notice associated with the article.