
Abstract
The study aimed to determine effect of extremely low frequency (50 Hz) electromagnetic fields (ELF-EMFs) exposure on serum levels of interleukin-17 (IL-17) and transforming growth factor-β (TGF-β) as signature cytokines of Th17 and regulatory T (Treg) cells, respectively. Retinoid-related orphan receptor γT and transcription factor forkhead box P3 (Foxp3) expression levels as lineage defining of Th17 and Treg cells were also assessed in the spleen and thymus. Eighty male rats were separated into 4 exposed groups (1, 100, 500, and 2,000 μT magnetic flux intensities) and a control. All rats were immunized by human serum albumin after 1 month of the exposure and the experiment was continued in the same manner for 1 month more. The results demonstrated that the weight of thymuses was significantly declined at intensity of 2,000 μT. At the preimmunization phase, the serum levels of IL-17 and TGF-β were significantly decreased at intensities of 1 and 100 μT. The expression of Foxp3 was also downregulated at intensities of 1 and 100 μT. In conclusion, low intensities of ELF-EMF may reduce the serum levels of IL-17 and TGF-β and downregulate the expression of Foxp3 in spleen.
Introduction
I
The immune system is a tightly regulated network, and one of the important aspects of this regulation is the balance between Th (T-helper) cells subsets and their cytokine production patterns. At the initiation of an immune system response, naive CD4+ T cells are activated, expanded, and differentiated into functionally different effectors Th1, Th2, Th17, and regulatory T (Treg) cells. This differentiation depends on the cytokine signals that they receive in the tissue microenvironment and expression of genes. Several studies have shown that if this critical balance is deviated, it will cause several diseases such as inflammation, autoimmunity, and cancers (Littman and Rudensky 2010; Niu and others 2012; Yang and Zheng 2017).
Although there are some investigations about the effects of ELF-EMFs on the immune system function and its cytokine network (Selmaoui and others 2011; Salehi and others 2013), there is still scarce information about these effects on the expression of Th cells subsets determining genes and their specific cytokine release during activation/resting of the immune system. According to the literature, Luo and others investigated the levels of IFN-γ and IL-4 that are, respectively, signature cytokines of Th1 and Th2 subsets in spleen tissue fluid and their associated genes, T-box transcription factor (T-bet), and GATA binding protein 3 (GATA-3), in the spleen. In their study, mice were exposed to ELF-EMF with magnetic flux intensity of 500 μT for 60 days. They could not find any change in the measured factors (Luo and others 2016). In addition, they did not consider Th17 and Treg cells and their signature cytokines in their study.
Th17 cells have 2 distinct population of pathogenic Th17 (Teff17) and beneficial or protective Th17 (Treg17). Teff17 cells require IL-23 to develop and cause of inflammatory diseases and autoimmunity. In contrast, development of the Treg17 cells needs transforming growth factor-β (TGF-β) to differentiation, suppresses Teff17 cells, and inhibits the inflammation. In addition, Th17 cells differentiation needs expression of retinoid-related orphan receptor γ T (RORγT). The main characteristic of Th17 cells are IL-17A and IL-17F production (Hoe and others 2017; Kuwabara and others 2017; Qian and others 2017).
Treg cells are also 2 distinct subtype natural Treg (nTreg) cells and peripheral induced Treg (iTreg) cells. Treg cells secret immune suppressor cytokines such as TGF-β and IL-10 and require TGF-β and the transcription factor forkhead box P3 (Foxp3) for their differentiation. TGF-β does not affect nTreg cells but induce production of iTreg cells. TGF-β consists of 3 isoforms TGF-β1, TGF-β2, and TGF-β3. TGF-β1 is the most predominant and produced by T regulatory, activated macrophages, effector T cells, and tumor cells (Littman and Rudensky 2010; Niu and others 2012).
As the results of the published articles show, adverse effects of ELF-EMF exposure depend also on different magnetic flux intensities. Therefore, the present study aimed to determine whether different intensities of 1, 100, 500, and 2,000 μT of ELF-EMFs could change the serum level of IL-17, TGF-β cytokines at pre and poststimulation of rats with human serum albumin (HSA), and expression of Foxp3 and RORγT genes in the spleen and thymus of rats at poststimulation phase.
Materials and Methods
Experimental animals
Eighty Wistar 8-week-old male rats with average weight of 202.5 ± 8 g were purchased from the animal facilities of Hamadan University of Medical Sciences. Ethical Committee of Hamadan University of Medical Sciences approved the study (Code:
Electromagnetic exposure systems
Exposure systems of ELF-EMF were solenoid coils with lengths of 2 m and internal diameter of 40 cm of polyvinyl chloride cylinders. Solenoids consisted of different turns of copper wire with 2 mm diameter (Fig. 1). Solenoids were connected by adaptors to 220 V of 50 Hz sinusoidal alternating current electricity (city's power supply). Combination of different turns of wires with the different voltage in each solenoid by adaptors generated ELF-EMF with magnetic flux intensities of 1, 100, 500, and 2,000 μT. The intensity of the EMFs was measured in the middle of solenoids by a Survey Meter (HI-3604; Holaday Ind). The background ELF-EMF intensity in the animal laboratory was around 0.07 ± 0.03 μT (Salehi and others 2013).
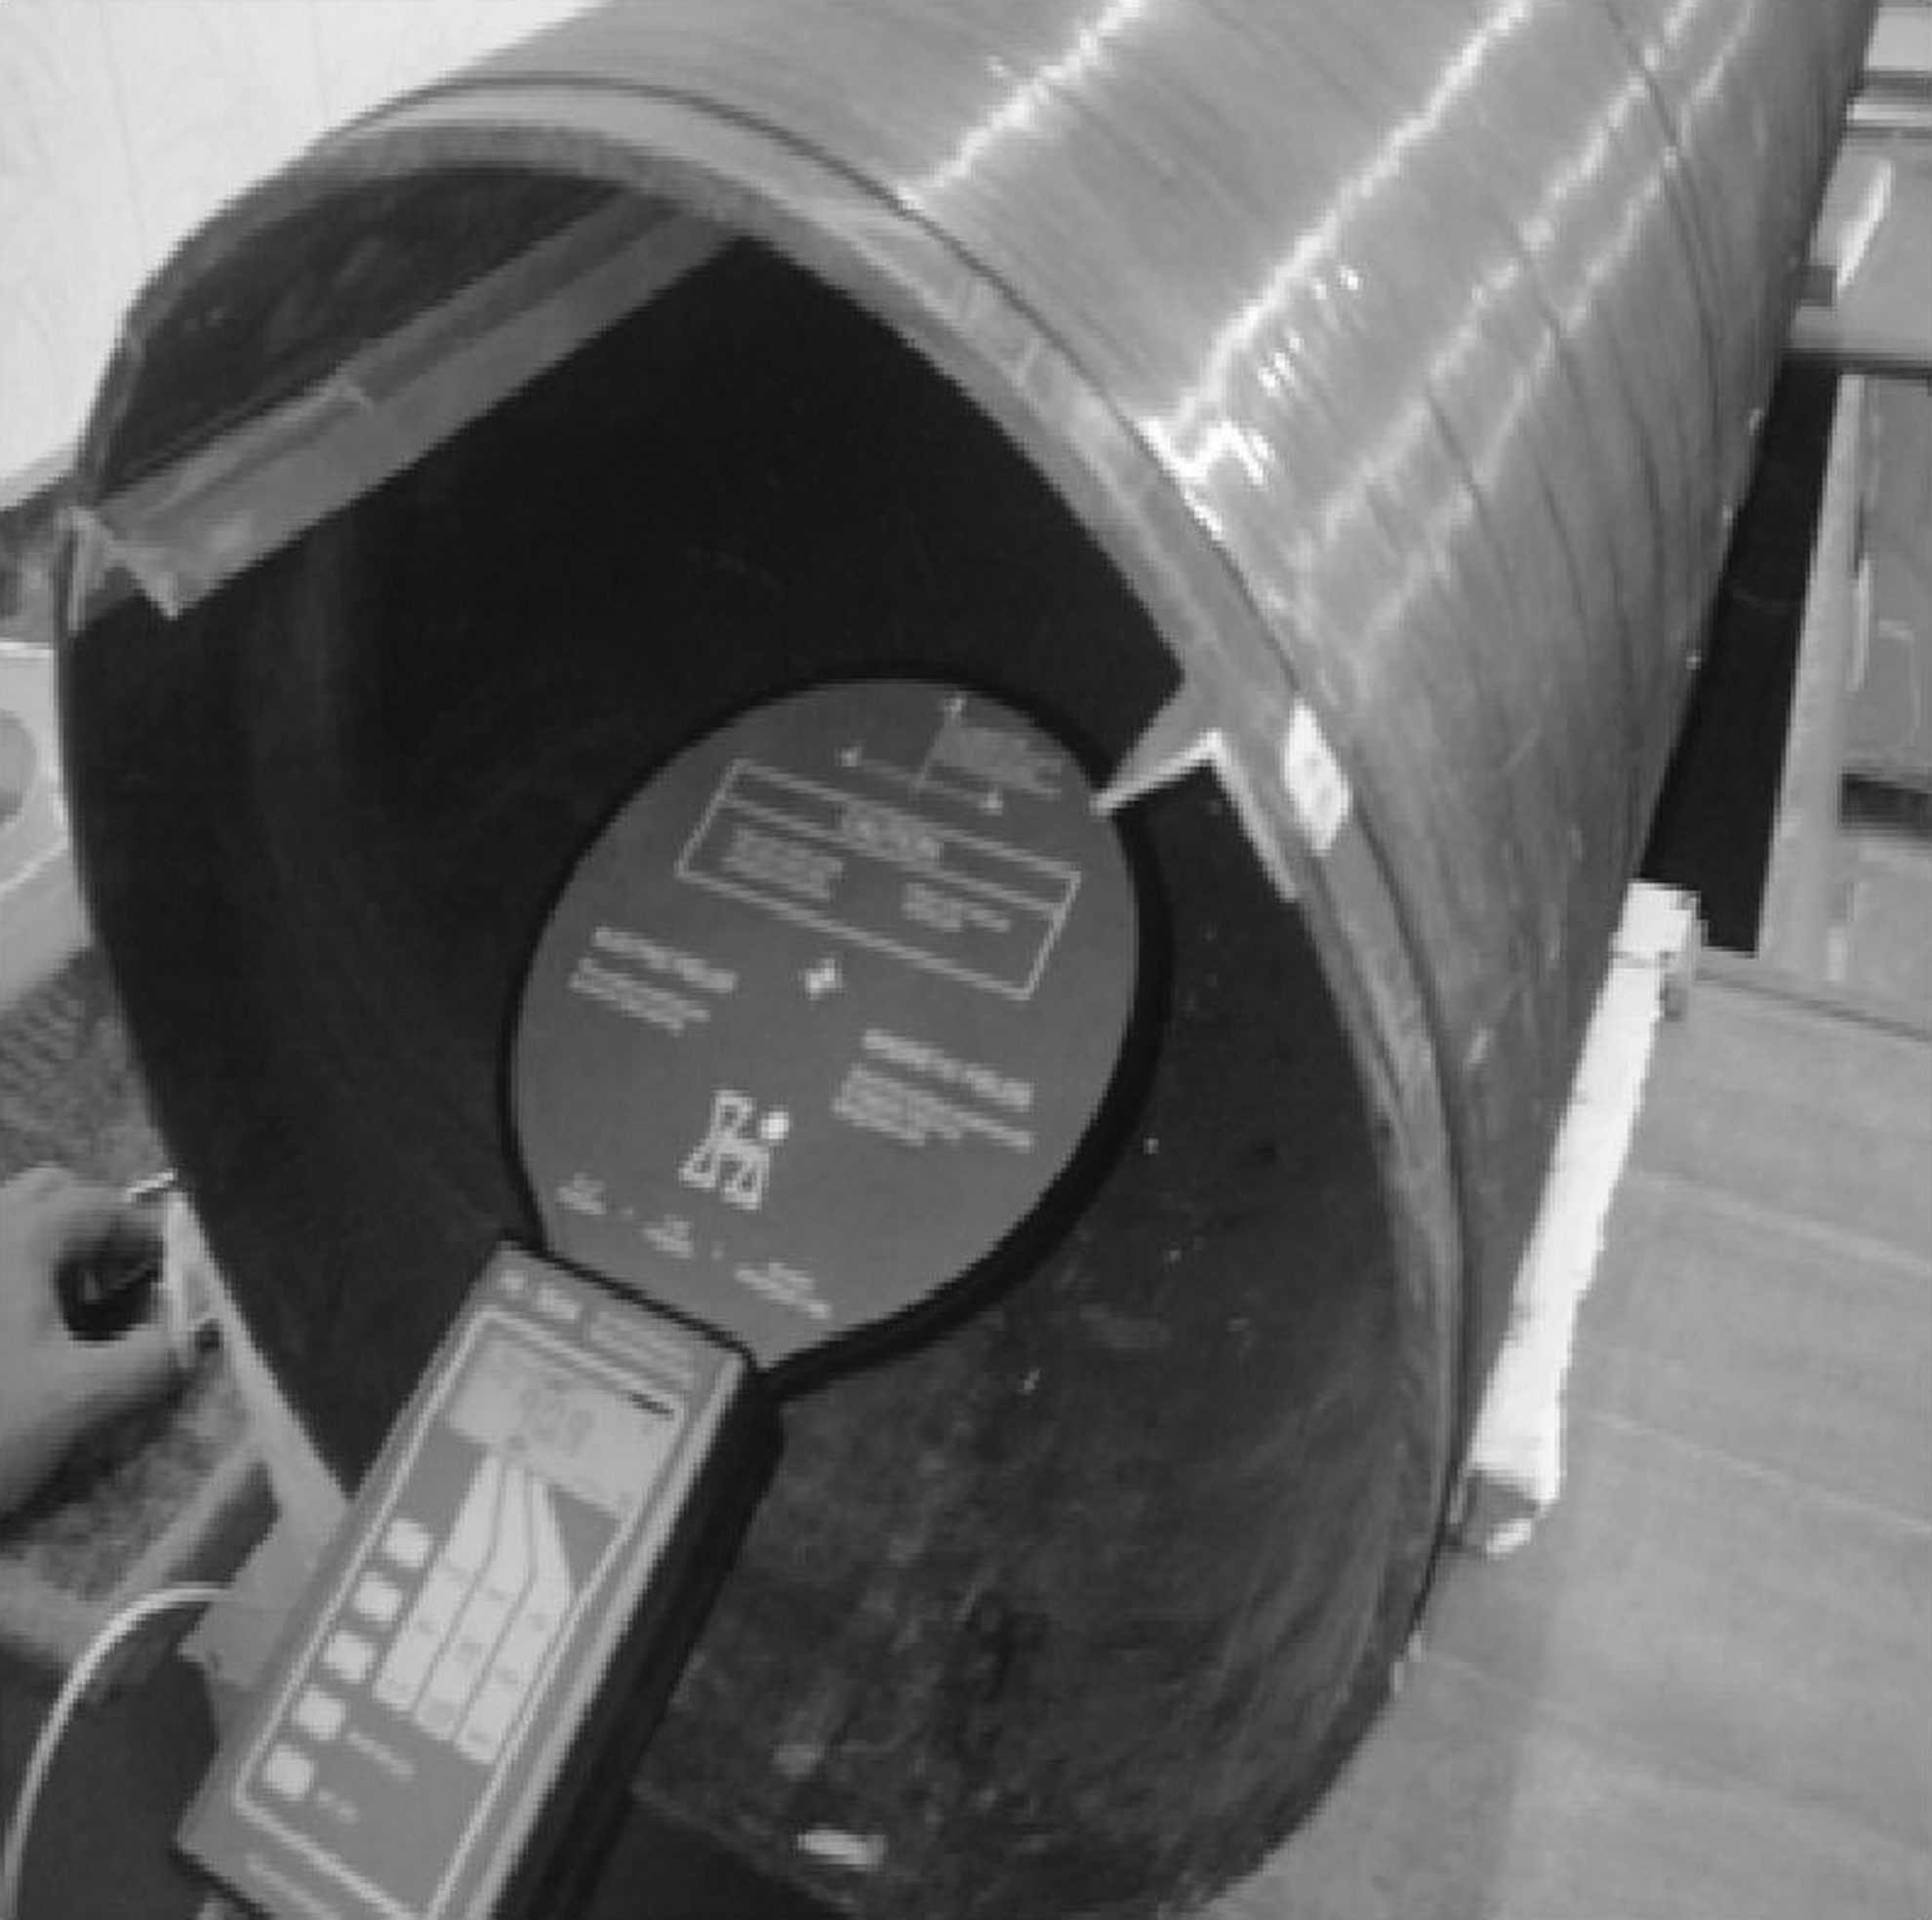
An extremely low frequency electromagnetic field exposure system. Four exposure groups of rats were placed in the centers of solenoids at magnetic flux intensities of 1, 100, 500, and 2,000 μT. The sham-exposed group was placed in the solenoid when it was unplugged. The background ELF-EMF intensity in the animal laboratory was around 0.07 ± 0.03 μT. ELF-EMFs, extremely low frequency electromagnetic fields.
Cytokines detection by ELISA
The serum levels of TGF-β1 and IL-17F in pre- and postimmunization serum samples of rats that were exposed to ELF-EMF with different magnetic flux intensities of 1, 100, 500, and 2,000 μT and controls were measured by ELISA kits using TGF-β1 and IL-17F standard curves according to the manufacturer's instructions (EastBiopharm, China). All tests were run in duplicate. The sensitivity of the kits for TGF-β1 assay was 2.51 pg/mL, and that for IL-17F was 2.52 pg/mL (Shahriari and others 2011; Zamani and others 2017).
Total RNA extraction and single strand complementary DNA synthesis
Total RNAs were extracted from spleens and thymuses of rats. Five and 10 mg of spleen and thymus tissues of each rat, respectively, were chopped and mixed with reaction (RNX) plus reagent (CinnaGen, Tehran, Iran). Then, the procedure was followed according to the manufacturer's instruction. The quantities and qualities of RNAs were assessed through measuring the absorbance at 260/280 nm by a Nanodrop spectrophotometer. Subsequently, 5 μg of each total RNA was used for reverse transcription into complementary DNA (cDNA), in a reaction mixture with volume of 20 μL, containing oligonucleotides (dT), Moloney Murine Leukemia Virus (M-MuLV) reverse transcriptase enzyme, dNTPs, and nuclease-free water according to the manufacturer's instruction (CinnaGen, Tehran, Iran). The thermal program for cDNA amplification was 65°C for 5 min, 42°C for 60 min, and finally terminate at 85°C for 5 min (Zamani and others 2006).
Reverse transcription quantitative polymerase chain reaction (RT-qPCR or real-time PCR)
Transcripts of cDNAs were amplified for RORγt and Foxp3 genes by RT-qPCR in a LightCycler® 96 System instrument (Roche Diagnostics GmbH, Germany) with SYBR green master mix (Takara, Osaka Japan). Amplification of rat β-actin gene was also used as reference gene to normalize expression of RORγT and Foxp3 genes using the quantification cycle (Cq) method. In brief, 2 mL of diluted cDNA (1:10) was used for each PCR reaction according to the manufacturer's instructions. The primers that were used to amplify the genes fragments were designed by AlleleID 7.6 software and described in Table 1. The procedure of RT-qPCR amplification started at 95°C for 30 s and followed 40 cycles as denaturation at 95°C for 5 s, annealing time at 58°C for β-actin, 65°C for Foxp3, 66°C for RORγT genes for 30 s, and extension at 72°C for 30 s. At the end of the reactions, the purity of PCR products was confirmed using melting curve analysis. The efficiencies of RORγT, Foxp3, and β-actin amplifications were calculated. The expression of RORγT and Foxp3 genes was normalized with β-actin gene expression by the formula 2−ΔCq (RORγt or Foxp3–Cq β-actin). Relative alterations in RORγT and Foxp3 genes expression due to ELF-EMF exposure at different intensities were calculated by the formula 2−ΔCq of exposed/2−ΔCq of controls (Luo and others 2016).
Statistical analysis
One-way analysis of variance (ANOVA) and complementary Tukey's post hoc tests were used to analyze the data. P < 0.05 was considered as the minimum level of statistically significant differences. Data are expressed as a mean ± standard deviation and were statistically analyzed by SPSS 16.
Results
Two rats died and we eliminated their data from the experiment during the exposure to ELF-EMF. At the beginning and at the end of exposure, the rats were weighed. The results demonstrated that there was no statistically significant difference in the body weight of rats. The weights of spleens were also not different after the exposure to ELF-EMF in the exposure groups compared with those in sham-exposed group. Whereas the weights of thymuses were significantly different among the groups (Table 2). The data given in Table 2 indicate that the different intensities of ELF-EMFs affected the thymus weight of rats (P = 0.047). The results showed that the weight of thymuses was decreased to 0.27 ± 0.08 g (P = 0.035) at intensity of 2,000 μT of ELF-EMF compared with the weight of controls (0.35 ± 0.06 g).
Data are presented as a mean ± standard deviation.
ANOVA test was performed to compare the means of body, spleen, and thymus weights among the groups. P values indicate that there were no statistically significant differences among the weights of groups at pre- (P = 0.975), postexposure (P = 0.661) and spleens (P = 0.436) of rats. Whereas thymus weights were different (P = 0.047). † P = 0.035 compared with control.
Further analysis of the thymus weights data by complementary Tukey's post hoc test showed that at intensity of 2,000 μT, the weight was decreased compared with that of the control.
ANOVA, analysis of variance.
The data of serum levels of IL-17 and TGF-β in pre- and postimmunization phases were analyzed by ANOVA and complementary Tukey's post hoc tests. The results given in Table 3 showed that levels of IL-17 and TGF-β in preimmunization phase under exposure to ELF-EMF in different intensities were significantly changed (P < 0.001). The serum level of IL- 17 was declined to 143.7 ± 29 and 120.8 ± 24 pg at intensities of 1 and 100 μT from 192.2 ± 44 pg in the controls (P < 0.001). The level of TGF-β in controls was 276.2 ± 49 pg and reduced to 202.8 ± 40 pg (P = 0.006) at 1 μT and 152.3 ± 38.3 pg (P < 0.001) at 100 μT intensities, respectively. The results showed that there was no significant variation in the serum levels of IL-17 and TGF-β in the postimmunization phase under exposure to different intensities of ELF-EMFs (Table 3).
Data are presented as mean ± standard deviation.
The serum levels of IL-17 and TGF-β in preimmunization phase were further analyzed by complementary Tukey's post hoc test. The results showed that the serum levels of IL-17 and TGF-β at intensities of 1 and 100 μT of ELF-EMFs were significantly decreased compared with those of control. † P < 0.001; †† P = 0.006 compared with control.
ANOVA test was performed to compare the means of TGF-β and IL-17 in pre and postimmunization among the groups. The TGF-β and IL-17 levels were different in preimmunization phase (P < 0.001).
ELF-EMFs, extremely low frequency electromagnetic fields; IL, interleukin-17; TGF-β, transforming growth factor-β.
Relative RT-qPCR was performed to evaluate the expression of RORγT and Foxp3 genes in the spleen and thymus of rats. Data were analyzed by ANOVA and complementary Tukey's post hoc tests. The results showed that the expression levels of RORγT, Foxp3 genes in thymus, and RORγT in spleen were not significantly changed due to exposure to different intensities of ELF-EMFs compared with those in control group. Whereas the expression of Foxp3 in the spleens was significantly (P = 0.026) different among the groups (Table 4). In Table 4, the normalized expression levels of Foxp3 in the spleen were declined to 1.56 ± 0.39 (P = 0.028) and 1.45 ± 0.61 (P = 0.049) under exposure with intensities of 1 and 100 μT, respectively, from 3.20 ± 1.03 in the controls.
Data are presented as mean ± standard deviation.
Further analysis of normalized expression of Foxp3 in the spleen by complementary Tukey's post hoc test revealed that it was declined at intensities of 1 and 100 μT compared with that of controls. † P = 0.028; †† P = 0.049 compared with control.
ANOVA test was performed to compare the normalized expression (2−ΔCq) of RORγT and Foxp3 genes in the spleens and thymuses among the groups. P values that are noted for each gene indicate that statistically significant difference was in Foxp3 expression in spleen among the groups. Whereas 2−ΔCq of RORγT and Foxp3 in thymus and 2−ΔCq of RORγT in spleen were not changed among the groups.
Discussion
This study showed that the body and spleen weights of rats were not changed under exposure to different intensities of ELF-EMFs. These results are in consistence with our previous study that there was no statistically significant difference in the body weight of rats after exposure to 100 μT of ELF-EMF for 3 months (Salehi and others 2013). Lai and others (2016a, 2016b) have also explained the exposure of rats to ELF-EMF with intensity of 100 μT and they did not find any alteration in body weight of rats. In this study, weights of thymuses were significantly decreased due to exposure of ELF-EMF at intensity of 2,000 μT. Meanwhile a study showed that exposure to ELF-EMF at frequency of 50 Hz with intensities of 1 and 100 μT significantly decreased the weights of thymuses (Quaglino and others 2004). In another study, Quaglino and others investigated the effects of 50 Hz EMF at 5 and 100 μT intensities for 8 months on male Sprague-Dawley rats. They found signs of gradual atrophy and involution mainly due to collagen deposition and fat substitution in the thymus. They suggested that exposure to ELF-EMFs might induce stress condition in the rats and accelerate massive death of thymocytes in the thymus (Quaglino and others 2004).
ELISA data of preimmunization phase indicated that there was significant reduction in the serum levels of IL-17 and TGF-β under exposure to 1 and 100 μT intensities of ELF-EMFs compared with those of the controls. According to our knowledge, serum levels of IL-17 and TGF-β are investigated for the first time in this study. The results of some researches show that iTreg and Treg17 cells functions are reciprocally interconnected. This means that iTreg cells produce TGF-β that is necessary for development of Treg17 cells(Hoe and others 2017; Yang and Zheng 2017).
In postimmunization phase, the serum levels of IL-17 and TGF-β were not different among the groups. It can be described that after immunization of rats with HSA, the macrophages and T cells activated and produced TGF-β. Therefore, TGF-β and IL-17 levels came back to the normal levels. It can be described that after immunization of rats with HSA, the macrophages and T cells activated and produced high levels of IL-17 and TGF-β. Therefore, by this, there could be high levels of these cytokines and any subtle effects from ELF-EMFs could be masked in the postimmunization phase.
As we know, functional pattern of Th cell subsets (Th1/Th2/Th17/Treg) occurs during activation of the immune system. Therefore, the rats were immunized by HSA. The standard protocol for activation was injections on days 31, 44, and 58 of exposure. The expression levels of Foxp3 gene in the spleen after exposure to ELF-EMF with densities of 1 and 100 μT were decreased compared with those of control group. Whereas the expression of RORγT in spleen and thymus and expression of Foxp3 in thymus were not changed among the groups. In our view, this is the first study that investigated the expression of RORγT and Foxp3 after exposure to different intensities of ELF-EMFs. Along with this study, an in vitro research has showed that the expression of Foxp3 was decreased in the mouse H22 hepatocellular cell line under exposure to ELF-EMF with intensity of 400,000 μT (Nie and others 2013). Spleen contains iTreg cells that along with TGF-β may be decreased in the spleen due to ELF-EMF but thymus has nTreg cells that supposed to be not affected by ELF-EMF.
According to the results of this study, it seems that the correlation of the ELF-EMF intensity with ELF-EMF effects is not linear, that is, with increase of intensity, the production of the selected cytokines and the genes was reduced. Although these results are curious, however, some studies support this inverse relationship between the intensity and effects of ELF-EMFs, such as the study by Okudan and others. They exposed 120 Swiss albino mice to 50 Hz ELF-EMF with magnetic flux intensities of 1, 2, 3, 4, and 5 μT for 40 days. They found that nucleus size of peripheral blood lymphocytes decreased sharply at 1 μT and thereafter increased with the higher intensities (Okudan and others 2010).
Another study that supports the inverse correlation of the magnetic flux intensity and the effect of ELF-EMF has been performed on human breast cancer cell line (BT-20). The cells were cultured with various intensities of ELF-EMFs from 3,000 to 7,000 μT for 72 h. The proliferation of the cells was decreased to 40% during exposure to 5,000 μT, whereas the proliferation of cells was not inhibited at 7,000 μT (Park and others 2015).
Regarding the different effects of the lower intensities of 1 and 100 μT compared with those of the higher intensities of 500 and 2,000 μT of ELF-EMF, it can be proposed that low intensities of ELF-EMF inhibit some normal immunological factors without activation of protective mechanisms. In contrast, higher intensities of 500 and 2,000 μT activated the protective process of cells and the body to neutralize the harmful effects of ELF-EMFs. Therefore, the genes expression and cytokines levels in higher intensity rebound to the normal level of the controls (Eroz and others 2016; Saritas and others 2016).
In conclusion, low intensities (1 and 100 μT) of ELF-EMFs could reduce the serum levels of IL- 17 and TGF- β and downregulate the expression of Foxp3 in the spleen. Therefore, it seems that functions of both Treg17 and iTreg cells could be suppressed by ELF-EMF.
Footnotes
Acknowledgment
This study was financially supported by Hamadan University of Medical Sciences (grant no. 9210173429).
Author Disclosure Statement
No competing financial interests exist.