
Abstract
Legumes are considered to be a very good source of polyphenolic compounds that may act as chemopreventive agents, especially by their antioxidant properties. However, many of the chemopreventive properties may depend on the concentrations of the phytochemical compounds because potent antioxidant polyphenolic compounds may have pro-oxidant properties and negatively affect cell growth and viability. Thus, the aim of the present study was to assess the possible effect of two potent antioxidant Greek Leguminosae family plant extracts on the growth of a specific cancer cell line and its antioxidant defense cell system. Aqueous extracts of aerial parts of Lathyrus laxiflorus and Phaseolus vulgaris plants were initially examined for their cytotoxicity on the Hep2 cancer cell line at concentrations that possess potent antioxidant properties (100, 400, and 800 μg/mL). After a 24-hour incubation with the extracts, only L. laxiflorus plant extract exhibited the ability to inhibit the cell growth at 400 and 800 μg/mL by 57% and 74%, respectively, whereas P. vulgaris extract had no effect on cell growth at any of the tested concentrations. Noncytotoxic concentrations, 100 μg/mL L. laxiflorus and 800 μg/mL P. vulgaris extract, were used for 2-, 12-, and 24-hour incubation of the cells. The influence of the extracts on the antioxidant defense system of the cells was assessed by measuring the total antioxidant capacity (TAC) of the cells, the catalase (CAT) activity, and the concentrations of reduced glutathione, the oxidized form of glutathione, and thiobarbituric-reactive substances (TBARS) in all times of incubation with the cells. From the results obtained, it seems that only L. laxiflorus extract induces oxidative stress in the cells by reducing TAC and CAT activity and by inducing TBARS, especially with 2 and 12 hours of incubation. P. vulgaris extract reduced only TAC at 2 hours of incubation, indicating also a mild induction of oxidative stress. These results imply that potent antioxidant extracts, beyond a critical concentration, may induce oxidative stress even with no apparent cytotoxicity in cells.
Introduction
L
In previous reports, various Greek Leguminosae family plants along with some pure polyphenols and fractions rich in polyphenolic compounds isolated from them showed potent antioxidant and chemopreventive properties. 8,9 The aim of the present study was to assess the possible effect of two potent antioxidant legume plant extracts on a cancer cell line (Hep2) growth and to examine whether there are concentrations of these plant extracts that possess antioxidant properties, yet affect the antioxidant defense cell system and modulate the cellular redox state. Aqueous aerial plant parts extracts of Lathyrus laxiflorus subsp. laxiflorus and Phaseolus vulgaris were initially examined for their cytotoxicity properties on Hep2 cancer cell line at concentrations possessing potent antioxidant properties. Noncytotoxic extract concentrations were then used for short- and long-term incubation with the cells. The influence of the extracts on the antioxidant defense system of the cells was assessed by measuring oxidative stress biomarkers.
Materials and Methods
Cell culture material
Minimum essential medium with Earle's salts supplemented with
Oxidative stress biomarker material
Bradford reagent, 5,5′-dithiobis(2-nitrobenzoic acid), 1,1-diphenyl-2-picrylhydrazyl (DPPH), 2-thiobarbituric acid, NADPH, glutathione reductase, the oxidized form of glutathione (GSSG), and 2-vinyl pyridine were purchased by Sigma-Aldrich, and trichloracetic acid and hydrogen peroxide (H2O2) were obtained from Merck (Darmstadt, Germany). All other chemicals and solvents used in this study were of the highest purity commercially available.
Plant material
The air-dried aerial parts of the tested plants were pulverized and extracted with water (2:1 vol/vol) at room temperature. Each solvent extraction was repeated three times for 48 hours per extraction. The solvent was evaporated under reduced pressure, and the residues were diluted in water. 8 The edible P. vulgaris (Family Leguminosae) plants were cultivated in the village of Vrondou in Serres (Greece), whereas the L. laxiflorus subsp. laxiflorus (Family Leguminosae) plants were cultivated in a parcel near to the village of Zaros on the island of Crete (Greece).
Cell culture
Hep2 (human laryngeal epithelial carcinoma Hep-2) cells were normally grown in 25-cm2 culture flasks in MEM supplemented with 1% antibiotic/antimycotic solution, 0.01 M HEPES, and FBS at 37°C. Preliminary experiments were carried out to determine the percentage of FBS required for optimal growth of Hep2 cells. Cells were routinely grown in 2.5% or 5% FBS until they reach confluence.
Influence of the extracts on Hep2 cell growth
The experimental design is presented in Figure 1. Hep2 cells (1 × 10⁶) were seeded in each culture flask. In order to have actively grown cells, they were normally grown in MEM supplemented with 2.5% FBS for 24 hours. Then the medium was changed, the cells were washed twice with serum-free medium, and the extract was added at concentrations of 100, 400, and 800 μg/mL to the flasks. All experiments for testing the effect of the extracts were carried out in serum-free medium. Fetal serum favors growth of most cell lines but might interfere with running of the assays and affect the results. The same medium deprived of serum plus the antibiotic mixture was used in experiments and also added to the control flasks. Also, the extract solution was filtered (pore size, 0.2 μm) before its addition to the medium. The cells were incubated for 24 hours with the extract concentrations. Then the cells were detached by 0.1% trypsin-EDTA diluted in Hanks' balanced salt solution and collected in 5 mL of MEM supplemented with 2.5% FBS. The influence of the extracts on the cell growth was assessed by the difference in the number of viable cells remaining attached to the flasks after the treatments compared with that of control flasks (cells with the same treatment without the extracts). The viable cells were counted with a Neubauer cell cytometer after trypan blue staining (0.1% trypan blue stain in 0.1 M phosphate-buffered saline, pH 7.4). Each extract concentrations were tested in triplicate.
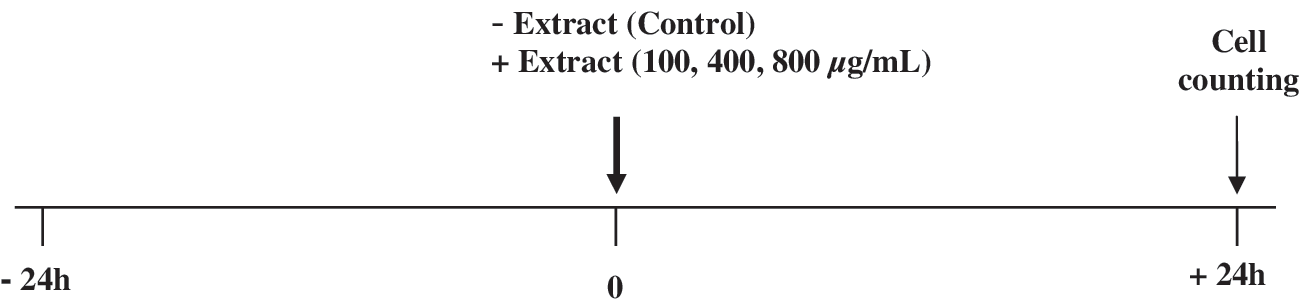
Experimental design for assessment of the influence of the extracts on growth of the Hep2 cancer cell line. The cells were normally grown in MEM supplemented with 2.5% FBS for 24 hours. The medium was changed to serum-free medium at the 0 time point (bold arrow), and the extract concentrations were added to the culture flasks. The cells were incubated with the extracts for 24 hours. Then the viable cells were detached by trypsinization, collected, and counted with a Neubauer cell cytometer after trypan blue staining (end of experiment, thin arrow). Cells with the same treatment without the extracts were considered the control.
Extract treatment and assessment of oxidative stress biomarkers
The experimental design for the assessment of the extracts on the antioxidant defense system of the cells is presented in Figure 2. In order to have a high number of actively grown cells, 1.4 × 10⁶ cells were seeded in each flask, and the cells were normally grown for 48 hours in MEM supplemented with 5% FBS. Then the medium was changed in all culture flasks, and the cells were washed twice with serum-free medium. The extract concentrations (100 or 800 μg/mL) were added in the flasks in that time point. All experiments to test the effect of the extracts were carried out in serum-free medium for 2, 12, and 24 hours of incubation. These time points were chosen for the assessment of the effect after short-term (2 hours) and long-term (12 and 24 hours) extract incubation. Each time point of extract incubation had its own control, and each time of incubation with the extract was tested in triplicate in two separate occasions. After incubation, cells were detached by 0.1% trypsin-EDTA and collected in 3 mL of MEM supplemented with 1% FBS. Cells were then centrifuged at 2,790 g for 5 minutes at 4°C, the supernatants were removed, and the cell pellet was washed twice with prewarmed phosphate-buffered saline (0.01 M, pH 7.4). The pellet was then suspended in phosphate-buffered saline (0.01 M, pH 7.4), and the cells were sonicated for 1 minute, with 10-second intervals, and centrifuged again at 15,000 g for 15 minutes at 4°C. The supernatants were collected and used for protein determination with the Bradford reagent and for the assessment of the total antioxidant capacity (TAC), catalase (CAT) activity, and concentrations of reduced glutathione (GSH) and GSSG. Protein determination was immediately analyzed, whereas for the other measurements the supernatants were frozen at −80°C and stored until analysis.
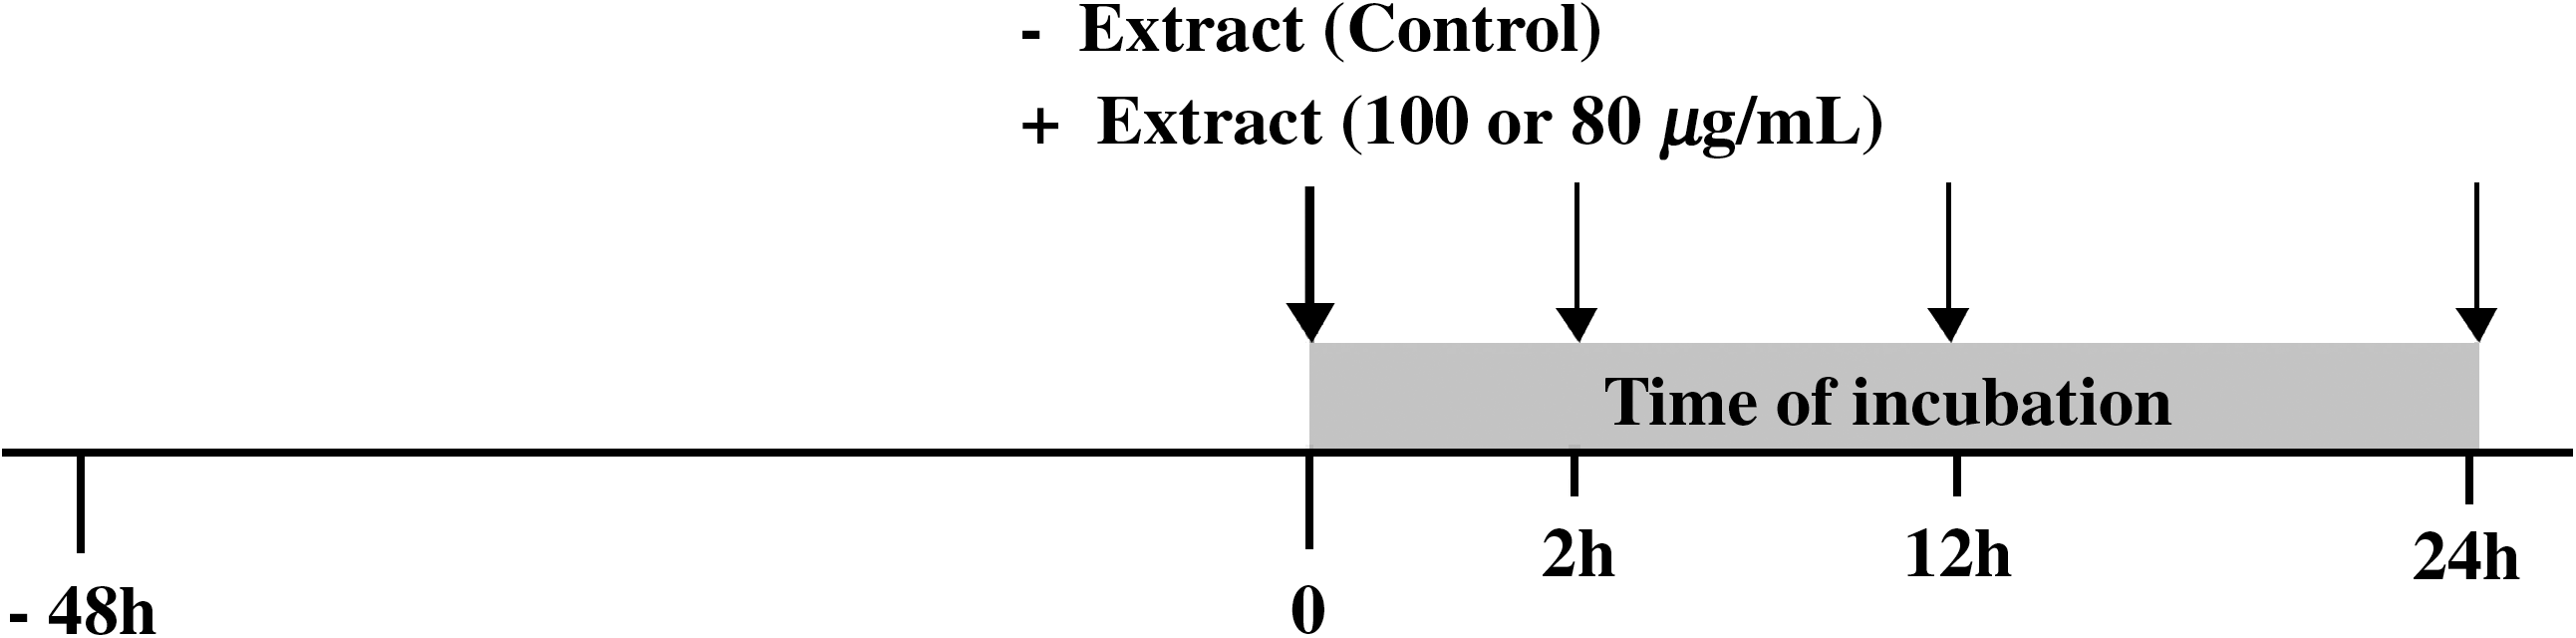
Experimental design for the assessment of extract influence on the antioxidant defense system of the Hep2 cancer cell line. The cells were normally grown in MEM supplemented with 5% FBS for 48 hours. The medium was changed to serum-free medium at the 0 time point (bold arrow), and the extract concentrations (100 or 800 μg/mL) were added to the culture flasks. The cells were incubated for 2, 12, and 24 hours with the extracts. The thin arrows show the time points when the cells were collected and disrupted or suspended for further assessment of oxidative stress biomarkers. Cells with the same treatment without the extracts were considered the control. Each time point has its own control.
For the assessment of the lipid peroxidation, the cell pellets after their suspension in phosphate-buffered saline (0.01 M, pH 7.4) were not sonicated. The cell suspensions were used for protein determination with the Bradford reagent and for the assessment of lipid peroxidation. Protein determination was immediately analyzed, whereas for the other measurements the cell suspensions were frozen at −80°C and stored until analysis.
Assessment of the TAC
The determination of TAC was based on the method of Janaszewska and Bartosz. 10 In brief, 50 μL of cell lysate was added to 450 μL of 10 mM sodium potassium phosphate (pH 7.4) and 500 μL of 0.1 mM DPPH free radical (DPPH•), and the samples were incubated in the dark for 60 minutes at room temperature. The samples were centrifuged for 3 minutes at 20,000 g, and the absorbance was read at 520 nm. TAC is presented as μmoL of DPPH• radical reduced to DPPH:H by the antioxidants of the cell lysate/mg of protein (>10 μg of protein are essential for the assay).
CAT activity assay
CAT activity was determined by following the decomposition of H2O2 measured as a decreased absorbance at 240 nm. 11 In brief, 150 μL of cell lysate was added to 2,845 μL of 67 mM sodium potassium phosphate (pH 7.4), and the samples were incubated at 37°C for 10 minutes. Five microliters of 30% (H2O2) was added to the samples, and the change in absorbance was immediately read at 240 nm for 1.5 minutes. Calculation of CAT activity was based on the molar extinction coefficient of H2O2. The results are presented as units of CAT/mg of protein (>30 μg of protein is essential for the assay).
Determination of GSH and GSSG
GSH and GSSG were measured according to the method of Tietze. 12 For GSH, 150 μL of cell lysate was mixed with 520 μL of 67 mM sodium potassium phosphate (pH 8.0) and 330 μL of 1 mM 5,5′-dithiobis(2-nitrobenzoate). The samples were incubated in the dark at room temperature for 45 minutes, and the absorbance was read at 412 nm. The results are presented as nmoL of GSH/mg of protein (>30 μg of protein is essential for the assay).
GSSG was assayed by treating 50 μL of cell lysate. Five microliters of 1:100 diluted 2-vinyl pyridine solution was added, and the samples were incubated for 2 hours at room temperature. Ten microliters of treated cell lysate was mixed with 600 μL of 143 mM sodium phosphate (6.3 mM EDTA, pH 7.5), 100 μL of 3 mM NADPH, 100 μL of 10 mM 5,5′-dithiobis(2-nitrobenzoic acid), and 189 μL of distilled water. The samples were incubated for 10 minutes at room temperature. After addition of 1 μL of glutathione reductase the change in absorbance at 412 nm was read for 3 minutes. GSH and GSSG concentrations were calculated on the basis of calibration curves made using commercial standards. The results are presented as nmoL of GSSG/mg of protein (>2–4 μg of protein is essential for the assay).
Lipid peroxidation assay
Lipid peroxidation was assessed by measuring the concentration of thiobarbituric acid-reactive substances (TBARS). For TBARS determination, a slightly modified assay of Keles et al. 13 was used. For the assay 400 μL of cell lysate was mixed with 500 μL of 35% trichloracetic acid and 500 μL of Tris-HCl (200 mM, pH 7.4) and incubated for 10 minutes at room temperature. One milliliter of 2 M Na2SO4 and 55 mM thiobarbituric acid solution was added, and the samples were incubated at 95°C for 45 minutes. The samples were cooled on ice for 5 minutes and were vortex-mixed after adding 1 mL of 70% trichloracetic acid. The samples were centrifuged at 15,000 g for 3 minutes, and the absorbance of the supernatant was read at 530 nm. Absorbance was taken into account by running a blank along with all samples during the measurement. Calculation of TBARS concentration was based on the molar extinction coefficient of malondialdehyde. The results are presented as nmol of TBARS/mg of protein (>30 μg of protein is essential for the assay).
Statistics
All results are expressed as mean ± SD values (n = 3). Statistical computations were carried out using SPSS (Chicago, IL, USA) version 13.0 software. For statistical analysis of the cell growth inhibition results, one-way analysis of variance was applied followed by Dunnett's test for multiple pairwise comparisons. Dose–response relationships were examined by Spearman's correlation analysis. For statistical analysis of the oxidative stress marker results, the Mann-Whitney test for independent samples was applied. Differences were considered significant at P < .05.
Results
Influence of the extracts on Hep2 cell growth
In order to examine the influence of these aqueous extracts on Hep2 cancer cell line growth the cells were incubated with potent antioxidant extract concentrations (100, 400, or 800 μg/mL) for 24 hours in serum-free medium according to the experimental design (Fig. 1). From the two tested extracts only that of L. laxiflorus aerial plant part extract showed potent inhibition of Hep2 cell growth. In brief, this extract inhibited by 57% and 74% the cell growth at 400 and 800 μg/mL, respectively (Fig. 3). P. vulgaris aerial plant part extract had no effect on cell growth in any of the concentrations tested (Fig. 3).
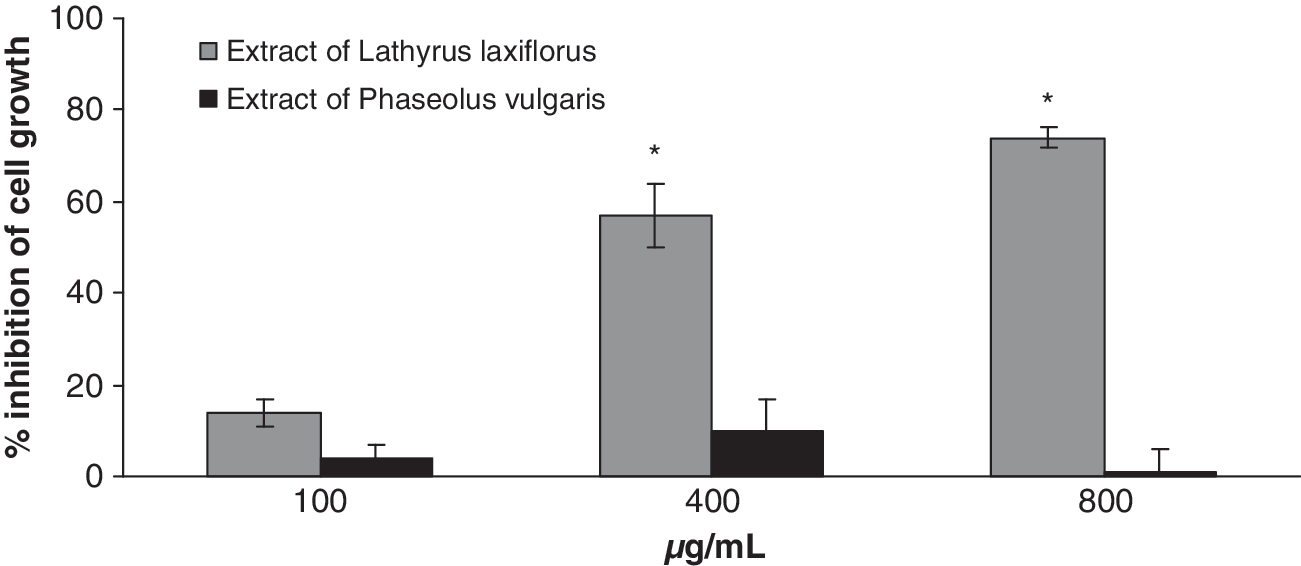
Percentage inhibition of the Hep2 cancer cell line after 24 hours of incubation with L. laxiflorus and P. vulgaris aerial plant part extracts. Data are mean ± SD values of three independent experiments. *P < .05 compared with control.
Influence of the extracts on the antioxidant defense system of Hep2 cells
According to the experimental design (Fig. 2), noncytotoxic concentrations—100 μg/mL L. laxiflorus and 800 μg/mL P. vulgaris extract, respectively—were used for 2-, 12-, and 24-hour incubations with the cells. The results showed that L. laxiflorus aerial plant extract at 100 μg/mL had the ability to decrease TAC of the cells and CAT activity by 24% and 21%, respectively, only after 2 hours of incubation (Fig. 4). In contrast to L. laxiflorus extract, P. vulgaris had no effect in the CAT activity in any of incubation times, although it decreased TAC of the cells by 20% after 2 hours of incubation (Fig. 5). The glutathione status was not affected in any of the incubation times with both extracts (Figs. 4 and 5). Moreover, the concentration of TBARS as a marker of lipid peroxidation was increased only after 12 hours of incubation with L. laxiflorus by 63% compared to the control at this time point (Fig. 6). In contrast, the concentration of TBARS was not affected in any of the incubation times with P. vulgaris extract.
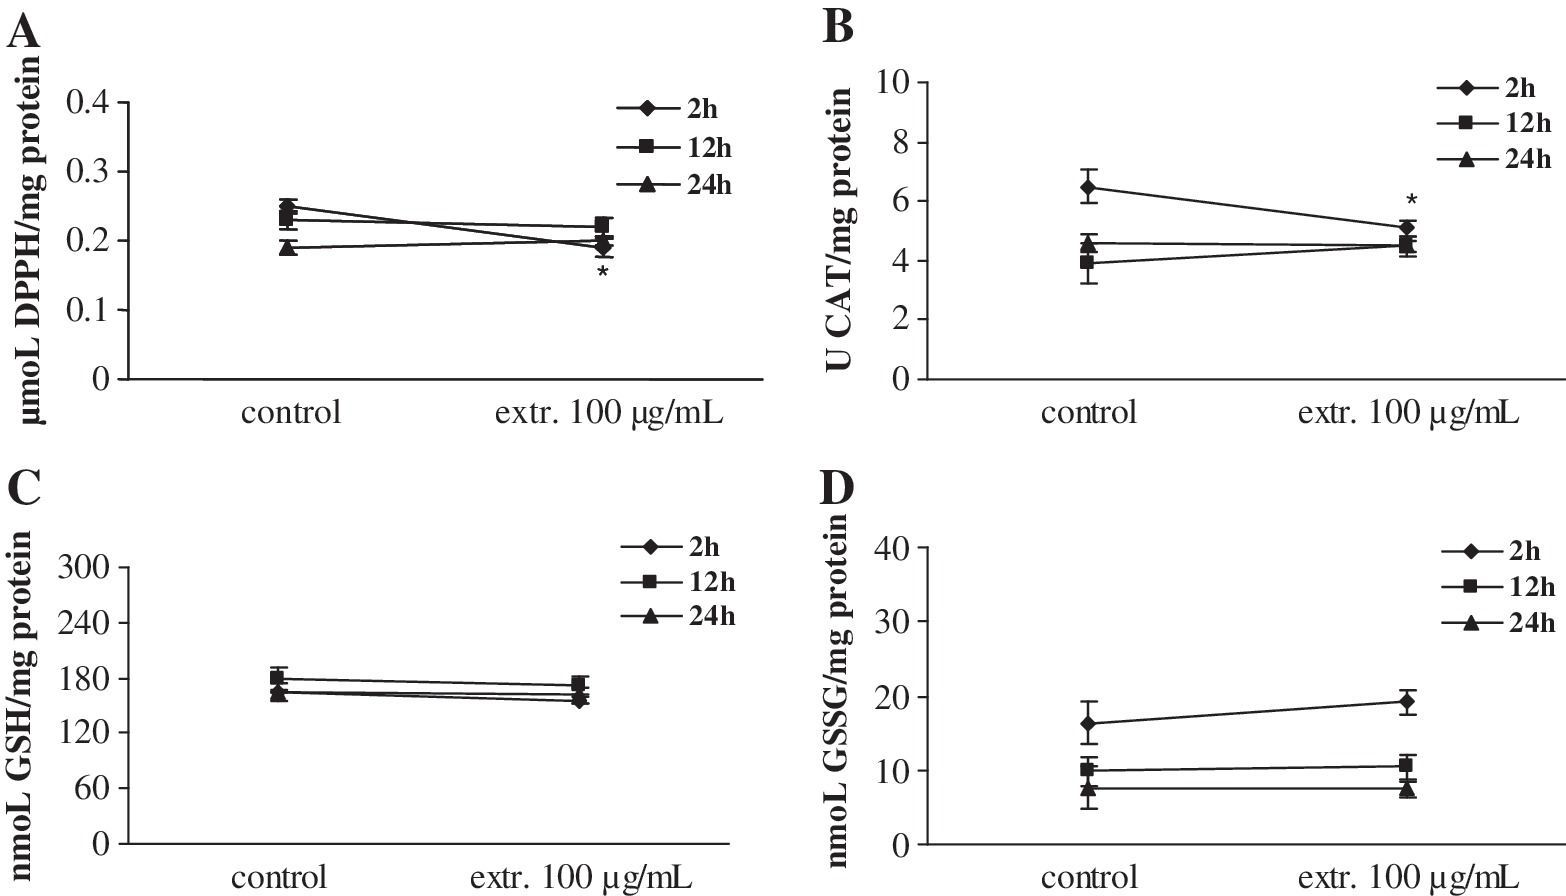
Influence of 100 μg/mL L. laxiflorus extract on oxidative biomarkers after 2, 12, and 24 hours of incubation: influence on (
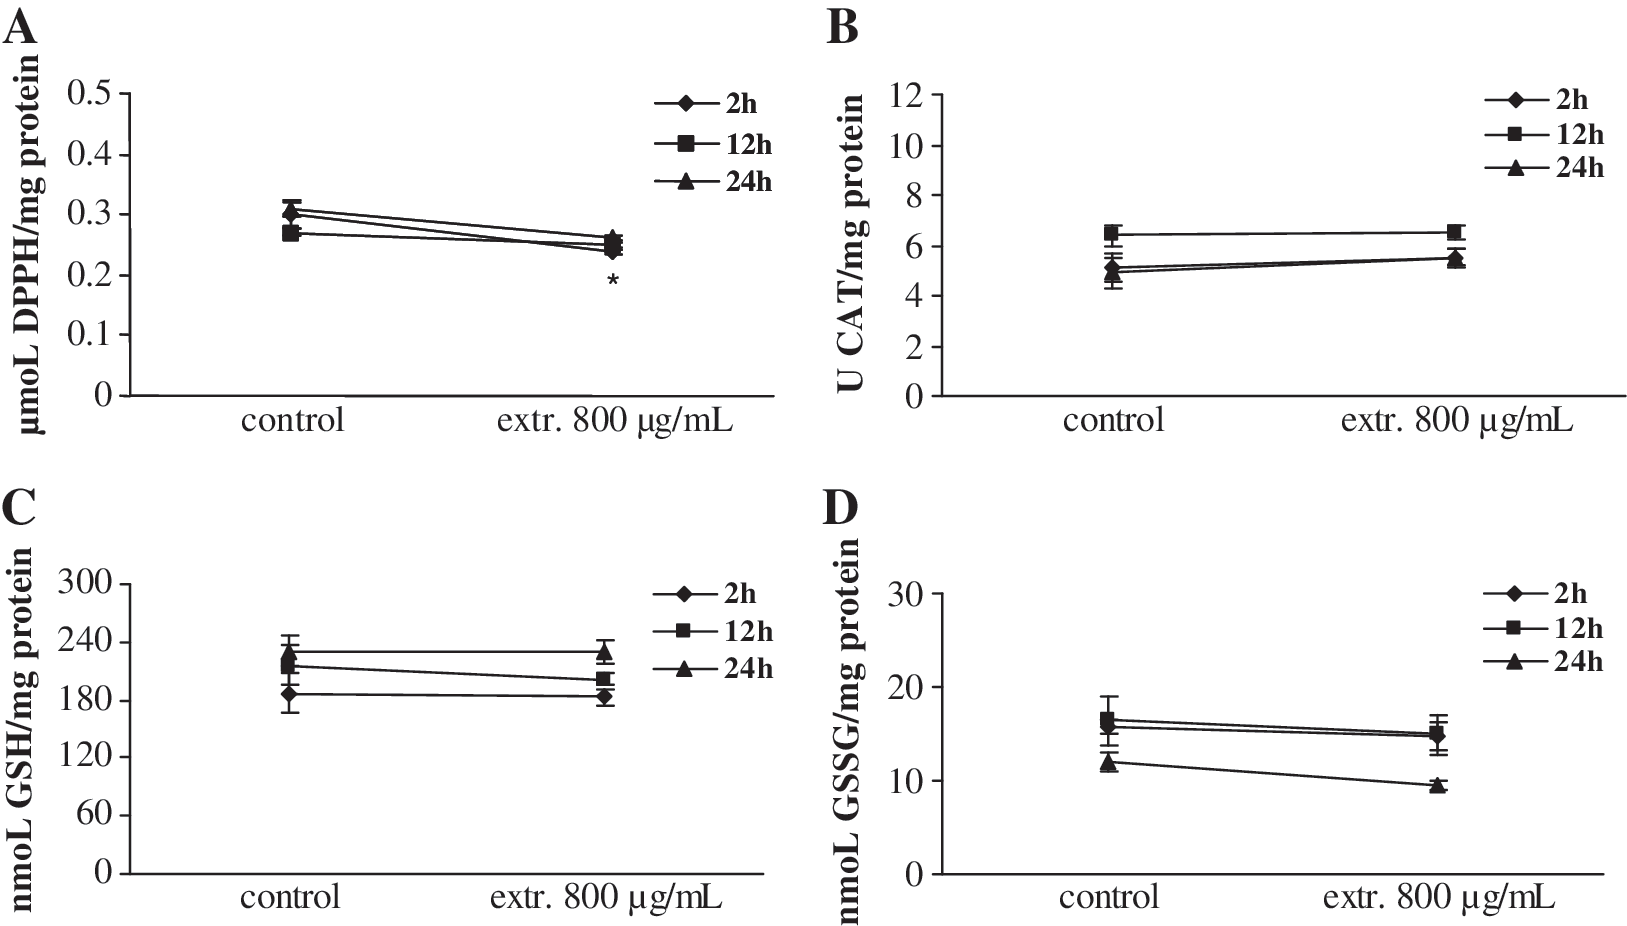
Influence of 800 μg/mL P. vulgaris extract on oxidative biomarkers after 2, 12, and 24 hours of incubation: influence on (
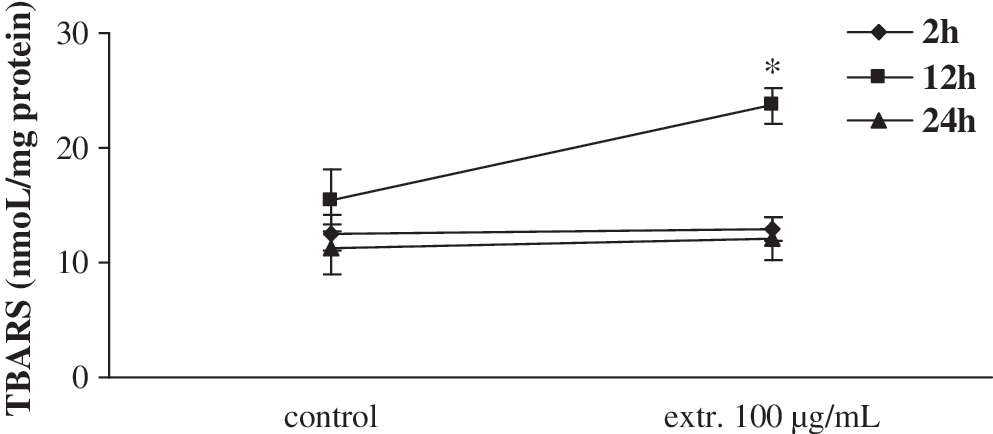
Influence of 100 μg/mL L. laxiflorus aerial plant part extract on concentration of TBARS after 2, 12, and 24 hours of incubation. Incubation for 12 hours with L. laxiflorus resulted in an increase of TBARS concentration compared with the control at this time point. Data are mean ± SE (error bars) values. *P < .05 compared with control.
Discussion
Dietary antioxidant compounds are considered as promising chemopreventive agents. 14 L. laxiflorus and P. vulgaris aerial plant part extracts have previously shown potent antiradical and DNA protective properties against free radical-induced DNA damage, with L. laxiflorus being the most potent extract. 8 In brief, 50% inhibitory concentration values for L. laxiflorus were 390 μg/mL and 4.9 μg/mL against OH• and ROO• radicals, respectively, whereas the 50% inhibitory concentration values for P. vulgaris against the same radicals were >1,600 μg/mL and 17 μg/mL, respectively. 8 In order to examine the influence of these aqueous extracts on Hep2 cancer cell line growth, the cells were incubated with potent antioxidant extract concentrations (100, 400, and 800 μg/mL) for 24 hours in serum-free medium according to the experimental design (Fig. 1). Of the two tested extracts only that of L. laxiflorus aerial plant part extract showed potent inhibition of Hep2 cell growth. It is interesting that the most effective antioxidant L. laxiflorus extract was also the most cytotoxic. This could be due to a complex mechanism that includes at least an antioxidant/pro-oxidant effect of the polyphenolic compounds. Many naturally occurring antioxidants show some mutagenic and genotoxic responses in cells that reflect a pro-oxidant activity. 15 In a previous study, cell growth arrest at low plant extract concentrations has been attributed to induction of apoptotic cell death, whereas at high concentrations it has been attributed to a direct toxic effect, leading to necrotic cell death. 16 However, it should be noted that it is not possible to differentiate between the cell growth inhibition and an increase in cell death only by counting the viable cell number after the incubation. Thus, further research on the mechanisms of the cytotoxic properties of the extract is necessary.
The different effect of the P. vulgaris extract (Fig. 3) could be attributed to the fact that these extracts are derived from two different plants. The polyphenolic composition of this aerial plant part extract could be responsible for the results obtained. The presence of different types of polyphenols in different parts of common beans (P. vulgaris) with antioxidant and antiproliferative properties has been widely reported. 17 –19 In a previous study, methanolic seed coat extract of P. vulgaris showed inhibitory activity on growth of HeLa and HaCaT cancer cells, 20 whereas methanolic seed extract affected the expression of proteins involved in the induction of apoptosis. 21 The results obtained indicate the lower activity of our extract compared to other P. vulgaris extracts.
Also, the observed effect of L. laxiflorus extract on this cancer cell line and its ability to inhibit the DNA strand-breaking activity of eukaryotic topoisomerase I 22 suggest this plant extract is an important source of possible chemopreventive agents. Furthermore, the influence of the whole L. laxiflorus plant extract on growth of this cancer cell line indicates putative anticancer properties. Laryngeal carcinoma has been extensively examined, and the Hep2 cancer cell line has also been previously used for the assessment of cytotoxicity and oxidative stress after incubation with other antioxidant compounds and herb extracts. 23,24
The results show that only elevated concentrations of L. laxiflorus extract affect the number of viable cells after incubation. In order to evaluate whether both of these extracts modulate the redox state of cells, noncytotoxic concentrations of both extracts were then used for short- and long-term incubation with the cells. According to the experimental design (Fig. 2) noncytotoxic concentrations—100 μg/mL L. laxiflorus and 800 μg/mL P. vulgaris extract, respectively—were used for 2-, 12-, and 24-hour incubations with the cells. The influence of the extracts on the antioxidant defense system of the cells was assessed by measuring the TAC of the cells, the CAT activity, and the concentrations of GSH, GSSG, and TBARS in all times of incubation with the cells.
The results showed that L. laxiflorus aerial plant extract at 100 μg/mL had the ability to decrease TAC of the cells and CAT activity after only 2 hours of incubation (Fig. 4). In contrast to L. laxiflorus extract, P. vulgaris had no effect on CAT activity at any of the incubation times, although it decreased TAC of the cells after 2 hours of incubation (Fig. 5). TAC is a general marker that comprises various compounds quenching the DPPH• radical. 25 It appears from our results that in the cell lysates there are compounds that possess this antioxidant property, but it is not possible to specify these compounds (Fig. 4). The results also imply an induction of the intracellular reactive oxygen species that may result in depletion of the intracellular pool of antioxidant compounds and thus result in a decrease of TAC. Experimental evidence has suggested the antioxidant/pro-oxidant properties of the polyphenolic compounds. 26,27 It has been proposed that dietary polyphenolic compounds have been shown to act as pro-oxidants in systems containing redox-active metals. In the presence of O2, transition metals such as copper (Cu) and iron (Fe) catalyze the redox cycling of phenolics, leading to the formation of reactive oxygen species and phenoxyl radicals that can damage DNA, lipids, and other biological molecules. 15,27 The reduction in CAT activity observed after L. laxiflorus extract incubation combined with the decrease in TAC supports the hypothesis that this extract has pro-oxidant properties. Despite the fact that TAC and CAT were affected, the glutathione status was not affected at any of the incubation times with both extracts (Figs. 4 and 5). This could be explained by the fact that glutathione may be the second line of defense, whereas CAT may be the first line of defense and is the one initially affected.
Moreover, TBARS as a marker of lipid peroxidation was increased only after 12 hours of incubation with L. laxiflorus by 63% compared to the control at this time point (Fig. 6). The increase in the TBARS concentration after L. laxiflorus extract incubation also indicates an increase of intracellular reactive oxygen species that could initiate the cascade reactions of lipid peroxidation.
From the results obtained, it seems that only L. laxiflorus extract at a concentration that possesses antioxidant properties and is not cytotoxic induces oxidative stress in the cells by decreasing TAC and CAT activity (Fig. 4). P. vulgaris extract decreased only TAC at 2 hours of incubation, indicating also a mild induction of oxidative stress. These results imply that although both of these extracts exert significant antioxidant properties, beyond a critical concentration they may act as pro-oxidants, inducing oxidative stress in cells. This critical concentration must be of concern in various biological assays. Intracellular generation of oxidative stress has been implicated in the activation of transcription factors and in the triggering of apoptosis. 28 Thus, the pro-oxidant action of these plant extracts rather than their antioxidant action may be an important mechanism for their anticancer properties, as reactive oxygen species can mediate apoptotic DNA fragmentation. 27 The same has also been shown for pure plant-derived phenolics. 27 However, the association between the consumption of a specific type and amount of polyphenol (or food item) and lowered cancer risk needs to be observed consistently in different studies before dietary recommendations can be made.
Footnotes
Author Disclosure Statement
No competing financial interests exist.