
Abstract
The effect of the aqueous extract of Azadirachta indica (AAI) on gentamicin (GEN)-induced kidney injury was investigated. The study involves 20 adult male Wistar rats (housed in four separate plastic cages) such that graded dosages of AAI were administered to the experimental group for 14 days per oral (PO) before exposure to GEN toxicity (100 mg/kg) for 1 week. At the end of the study, comparisons of some markers of renal functions, antioxidant status, and inflammatory and apoptotic markers were made between the control, GEN, and AAI-pretreated groups at P < .05. The result showed that GEN treatment caused a significant increase (P < .05) in body weight, kidney weight, urea, bilirubin, kidney injury molecule 1 (KIM 1), cystatin C, malondialdehyde (MDA), reduced glutathione (GSH), tumor necrotic factor alpha (TNF-α), interleukin-1 (IL-2), caspase-3, and B-cell lymphoma-2 associated X (BAX) as well as a significant decrease (P < .05) in superoxide dismutase (SOD), catalase (CAT), glutathione peroxidase (Gpx), and B-cell lymphoma (BCL)-2 level. Pre-treatment with graded doses of AAI caused a significant increase in urea, CAT, and GPx as well as a significant decrease (P < .05) in kidney weight, bilirubin, KIM 1, cystatin C, MDA, GSH, SOD, TNF-α, IL-2, caspase-3, BAX, and BCL-2. There was an appreciable difference in the kidney histology of the AAI pre-treated groups compared with the GEN. Hence, the extract has prophylactic potential in managing GEN-induced nephrotoxicity by decreasing the markers of renal function and inflammation and downregulating the markers of apoptosis.
INTRODUCTION
The kidney is essential for the body’s clearance and medication excretion. 1 Gentamicin (GEN) has been the most effective therapeutic against bacterial strains resistant to other antibiotics in various circumstances; its usage is restricted because of adverse effects such as nephrotoxicity and hepatotoxicity. 2 GEN can also change mitochondrial membrane potential, decrease oxidative phosphorylation, and switch mitochondrial permeability, all of which can harm and malfunction cells. 3 Neem (Azadirachta indica) has been used conventionally for a long period. Native to the Indian subcontinent, Neem is now grown all over the world. Azadirachta indica has antiviral, antibacterial, antifungal, and anti-inflammatory properties. It has bioactive substances, including nimbin, azadirachtin, and gedunin, that support its therapeutic effects. 4 Neem is helpful in the treatment of fever, infections, skin conditions, and digestive issues. Its leaves, bark, seeds, and oil are all utilized medicinally in different ways. Neem has also been used for dental health, wound healing, immune system regulation, and insect-repellent characteristics. 5 Despite its usefulness, there is a gap in the literature on the use of Azadirachta indica on GEN-induced nephrotoxicity; hence this study.
MATERIALS AND METHODS
Equipment
The equipment included sensitive measuring scale, beaker, centrifuge, syringe, EDTA bottle, universal bottle, and cages.
Chemicals and drugs
The chemicals and drugs included normal saline, phosphate buffer, formalin, distilled water (gotten from Redeemer’s University Biochemistry Laboratory), and 10 packs of GEN injection 80 mg/2 mL (manufactured by Shanxi Shuguang Pharmaceutical Co. Ltd.) marketed as antibiotic drugs active against a wide variety of pathogenic gram-negative and positive bacteria.
Plant extracts sensitivity test
Collection and identification of plants
The leaves of the plants (Azadirachta indica) were sourced from their farms across South West, Nigeria, with the help of traditional herb sellers. Dr. Nidrea George, a botanist at the Department of Botany, University of Lagos, identified Azadirachta indica.
Preparation of plant materials
The leaves were washed thoroughly under tap water and shade-dried at room temperature (24–26°C). An electric grinder pulverized the dried leaves. The powder was passed through a 40 mesh sieve and stored in an air-tight container before use.
Plants extraction method
The aqueous extract was prepared using the cold maceration soxhlet extraction techniques. 6 Five grams of each plant extract were weighed into 100 mL of extraction solvents and left on a mechanical shaker overnight at room temperature. The extract solutions were filtered aseptically into another 100 mL reagent bottle using a Wattman No 1 filter paper and evaporated under reduced pressure using a rotary evaporator.
Gas chromatography–mass spectroscopy (GC-MS) analysis of aqueous extract of Azadirachta indica
The aqueous extract of Azadirachta indica revealed the presence of over 10 major bioactive components of which at greater than 90% similarity index only three bioactive compounds were observed. These are cycloheptasiloxane tetradecamethyl-, dibutyl phthalate, and cyclohexadecane at 91%, 91%, and 93% similarity index, respectively.
Phytochemical analysis of plant extracts
Leaf extracts were evaluated by a qualitative phytochemical analysis to determine their major constituents. The presence of phytochemicals was analyzed by following standard procedures. The test for tannins
The test for tannins was carried out by subjecting 3 g of each plant extract in 6 mL of distilled war filtered and ferric chloride reagents will be added to the filtrate. Test for basic alkaloids (Mayer’s Test)
7
Five millimeters of extract were concentrated to yield a residue. The residue will be dissolved in 3 mL of 2% (v/v) HCl. Three drops of Mayer’s reagent will be added. The appearance of the dull white precipitate will indicate the presence of basic alkaloids. Test for Coumarin
7
Four millimeter extract solution will be measured and 2 drops of hot water will be added to a test tube. NH4OH will be added to another half volume (for strong fluorescence). The presence of green fluorescence will indicate the presence of coumarin. Test for Saponins
7
Two millimeter extracts were shaken vigorously for 30 sec in a test tube. Persistence of thick froth, even after 30 min of shaking, indicate the presence of saponins. Test for Terpenoids
7
One millimeter of the extract was mixed with 2 mL of chloroform. Three millimeters of concentrated H2SO4 will be added to form a layer. Reddish brown precipitate coloration at the interface will indicate the presence of terpenoids.
Animal care and management
Twenty adult male Wistar rats weighing 100–120 g were used in this study; they were obtained from the Animal House of Redeemers University, Ede, and were housed in plastic cages. The animals were kept under normal environmental conditions with a 12-h light/dark cycle and had free access to a standard rodent pellet diet (Top Feeds P.L.C. Osogbo, Nigeria) and water. They were allowed to acclimatize in the laboratory for 2 weeks before the commencement of the study. The Faculty of Basic Medical Sciences Ethical Review Committee at Redeemers University in Ede, Osun State, granted ethical clearance (RUN/REC/2023/062).
Experimental design
The rats were divided into four groups: Group 1 (the control), consisting of five rats, received distilled water daily orally for 3 weeks. Group 2 through 4 received different treatments. Five rats from Group 2 (the toxic control) were given 100 mg/kg/day of GEN intraperitoneally (IP) for a week. Twenty-four hours following the last GEN injection, five of the rats were slaughtered and treated similarly to the Group 1 animals. There are five rats in each of groups 3 and 4. They got GEN after receiving pretreatments of 100 and 200 mg/kg/day per oral (PO) of Azadirachta indica, respectively, for 14 days. Five rats from each group were sacrificed by cervical dislocation 24 h after injection. These rats’ blood was drawn from their hearts and placed in individual EDTA bottles. A cold centrifuge was used to separate the plasma, which was then tested for renal function markers, antioxidant markers, and inflammatory and apoptotic markers. For histological research, the livers of each of these rats were removed, weighed, and preserved in 10% formalin. The body weights of the rats were assessed once a week during the study period.
Descriptive and inferential statistics were used to analyze the collected data.
Measurement of body weight
A digital weighing scale (Camry weighing balance; China) was used to measure the body weight of the rats once a week during the study period to track weight changes in each group.
Biochemical assay
The cold centrifuge (Centurium Scientific, Model 8881, UK) was used to centrifuge 5 mL of whole blood that had been collected into a heparinized tube for 30 min at 5000 rpm. The indicators of renal function, such as creatinine, urea, cystatin C, and kidney injury molecule 1 (KIM 1) were examined in the plasma after it had been separated.
Assessment of antioxidant status
The left kidney was carefully excised, weighed, and homogenized with 10 mL of sucrose solution (0.25 M) using an Electric Homogenizer (SI601001). The homogenate was centrifuged at 3000 rpm for 20 min, and the supernatant was collected for the assessment of glutathione peroxidase (GPx), reduced glutathione (GSH), superoxide dismutase (SOD), as well as malondialdehyde (MDA) levels.
Assessment of markers of inflammations and apoptosis
The supernatant collected from the kidney homogenate was assessed for interleukin-1 (IL-1), caspase-3, tumor necrotic factor alpha (TNF-α), B-cell lymphoma-2 associated X (BAX), and B-cell lymphoma 2 (BCL-2).
Histopathological examination
The kidney was carefully excised, weighed, and fixed in a 10% formo-saline solution. Afterward, the tissues were embedded in paraffin wax, sectioned, and stained using hematoxylin and eosin.
Statistical analysis
GraphPad Prism 5 was the statistical package used for data analysis. One-way analysis of variance was used to analyze data, followed by the Students Newman–Keuls test for multiple comparisons. Results were expressed as mean ± standard error of mean, and P < .05 was taken as the accepted level of significant difference.
RESULTS
Body weight of rats at the initial
There was a significant difference in body weight of group 2 and 4 (137.0 ± 1.38 and 98.20 ± 0.80) compared with the control (113.6 ± 1.40) (F = 39.28; P < 0.0001), while a decrease in groups 3 and 4 (105.0 ± 2.83 and 98.20 ± 0.80) compared with group 2 (137.0 ± 1.38) (Table 3).
GC-MS Analysis of Azadirachta indica at 90% Similarity Index
GC-MS, gas chromatography–mass spectroscopy.
Study Design
Group 1, control; Group 2, GEN; Group 3, 100 mg/kg AAI + GEN; Group 4, 200 mg/kg AAI + GEN.
AAI, aqueous extract of Azadirachta indica; DW, distilled water; GEN, gentamicin.
Effects of Aqueous Extract of Azadirachta indica on Body Weight (g) of Rats with Gentamicin-Induced Nephrotoxicity
Values are expressed in mean ± SEM (n = 5).
P < .05.
P < .05 versus control.
P < .05 versus GEN.
P < .05 versus 100 + GEN.
SEM, standard error of mean.
Body weight of rats at week 1
There was a significant difference in body weight of group 2, 3, and 4 (160.2 ± 2.99, 119.0 ± 2.05, and 123.40 ± 1.29) compared with the control (134.6 ± 1.29) (F = 38.12; P < 0.0001), while a decrease in groups 3 and 4 (119.0 ± 2.05 and 123.40 ± 1.29) compared with group 2 (160.2 ± 2.99) (Table 3).
Body weight of rats at week 2
A significant decrease was observed in group 3 and 4 (146.8 ± 4.77 and 152.00 ± 2.12) compared with group 2 (169.3 ± 6.17) (F = 8.452; P = 0.0001) (Table 3).
Body weight of rats at week 3
There was a significant decrease in body weight of group 2 and 3 (160.0 ± 2.39 and 174.6 ± 4.85) compared with the control (185.6 ± 3.87) (F = 33.81; P < 0.0001), while an increase in groups 3 and 4 (174.6 ± 4.85 and 186.80 ± 2.73) compare with group 2 (160.0 ± 2.39) and also in group 4 (186.80 ± 2.73) compared with group 3 (174.6 ± 4.85) (Table 3).
The left kidney weight of group 2 and 3 rats (0.93 ± 0.09 and 0.82 ± 0.03) was significantly higher (P = 0.0066, F = 4.491) when compared with group 1 (0.59 ± 0.05) (Fig. 2).
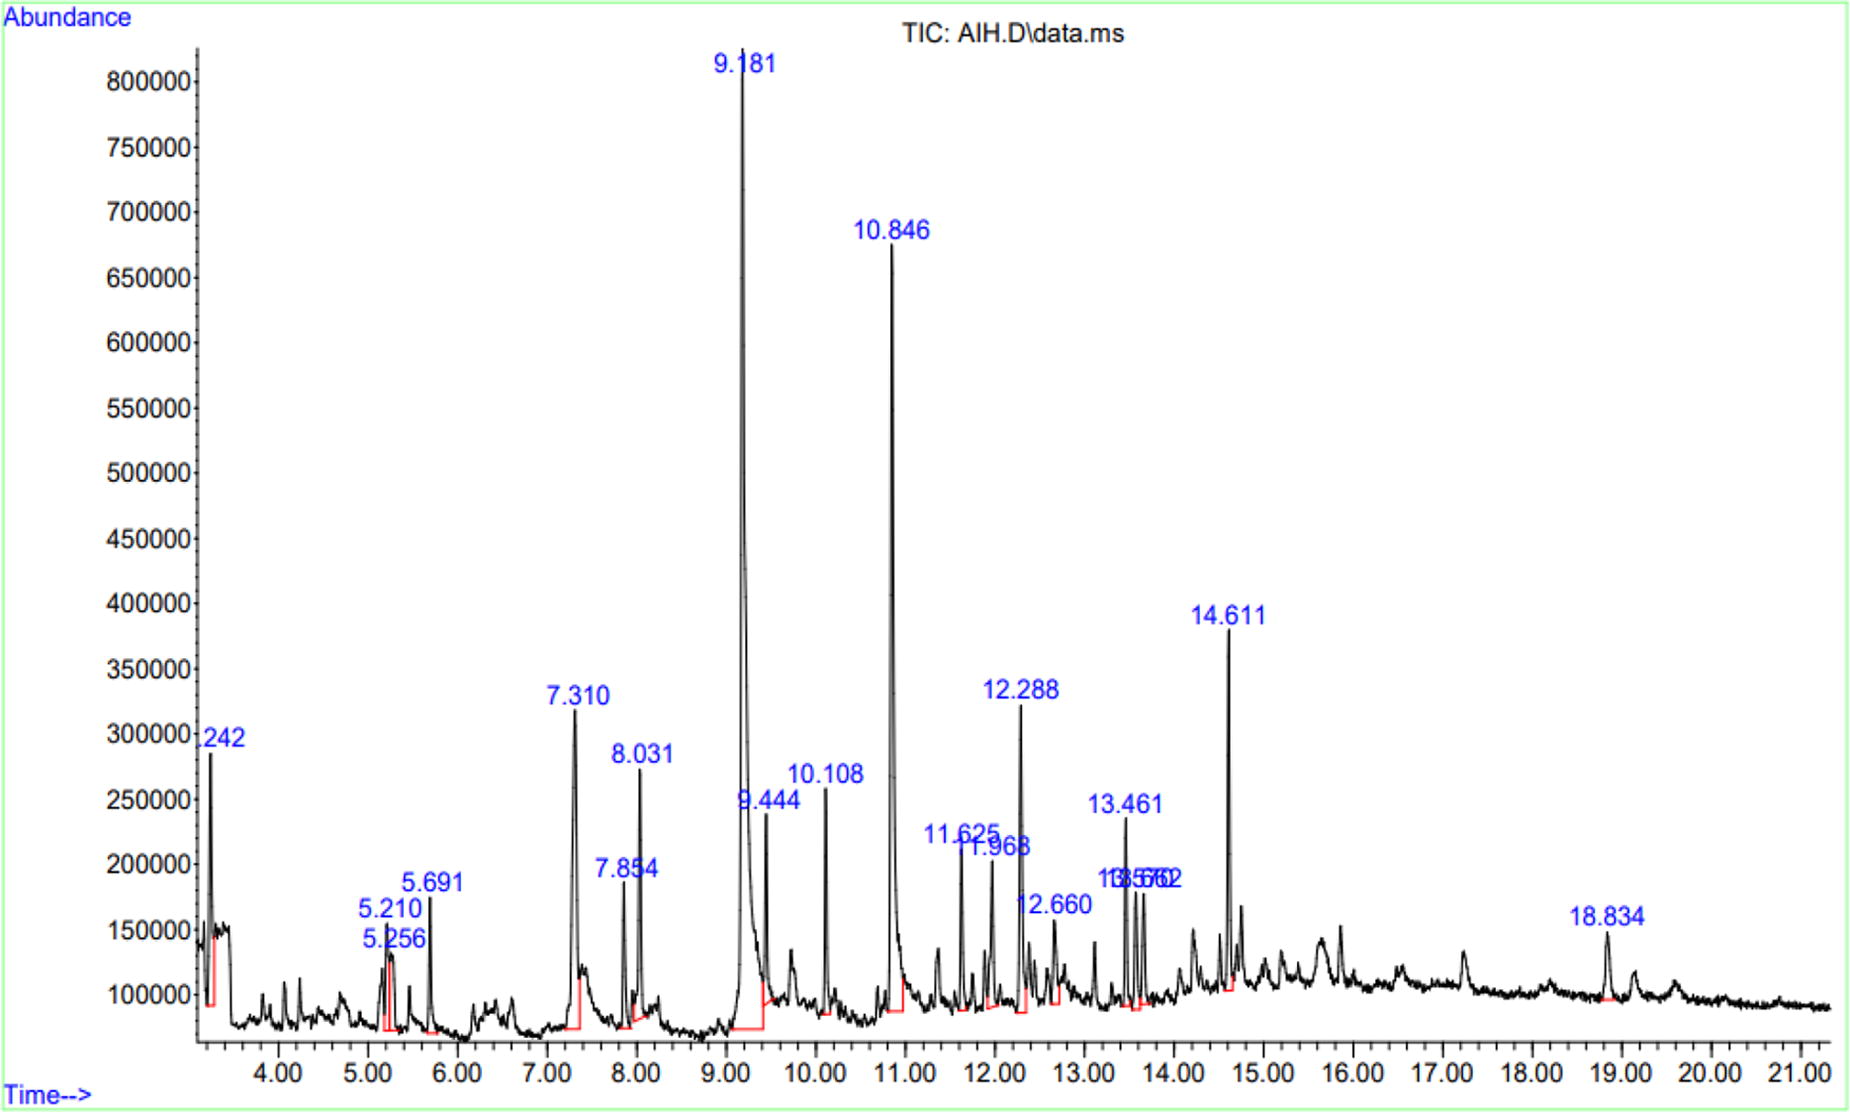
Gas chromatography spectra of Azadirachta indica aqueous leave extracts.
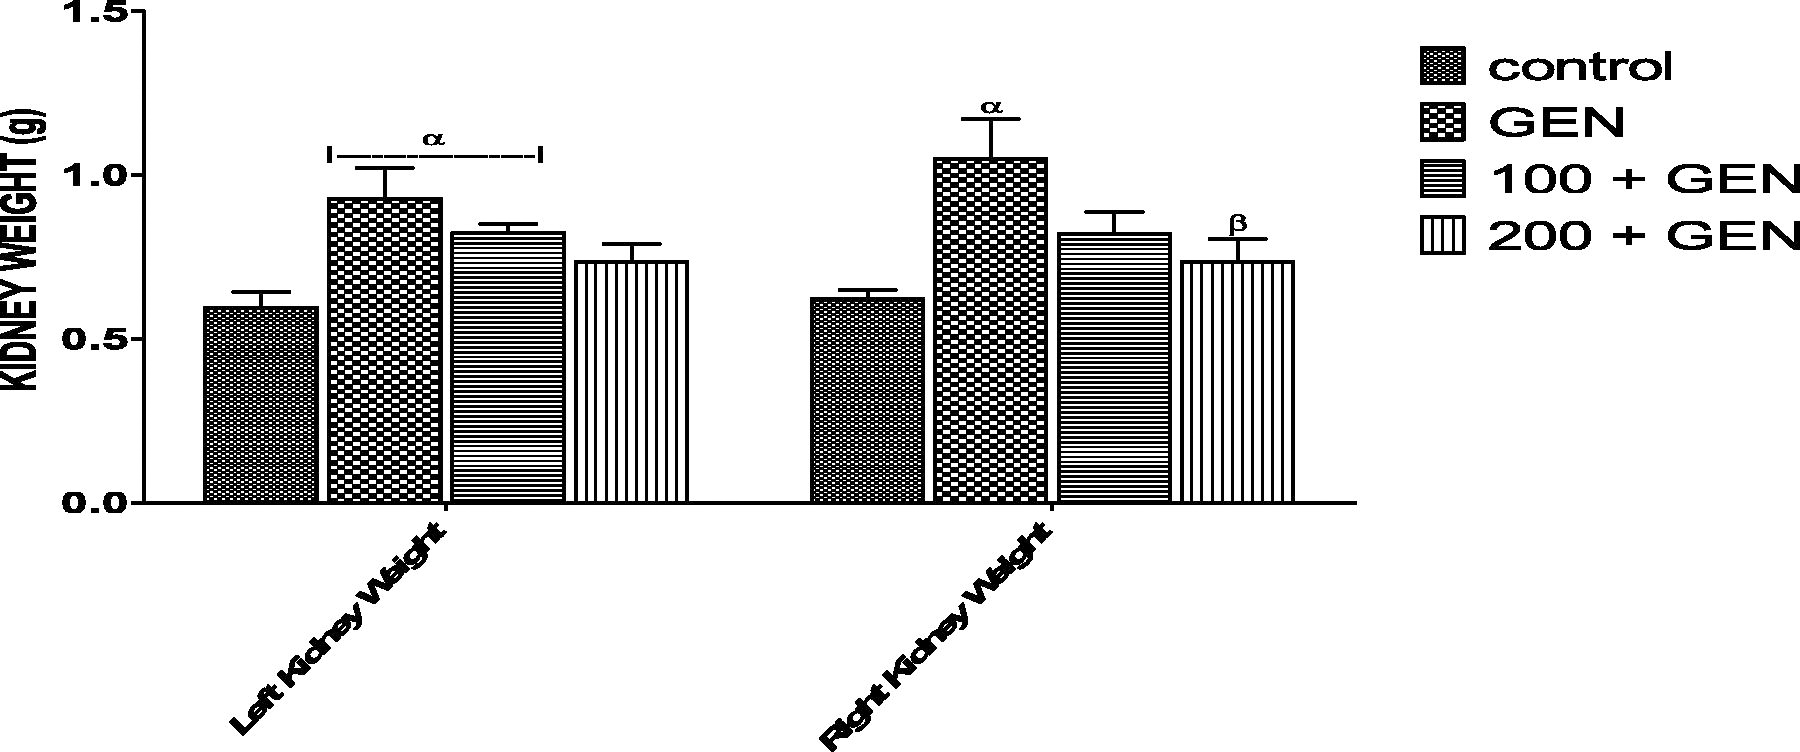
Effect of aqueous extract of Azadirachta indica on kidney weight of rats with gentamicin-induced nephrotoxicity. Values are expressed in mean ± SEM (n = 5) P < .05, α = significant difference to group 1 and β = significant difference to group 2. SEM, standard error of mean.
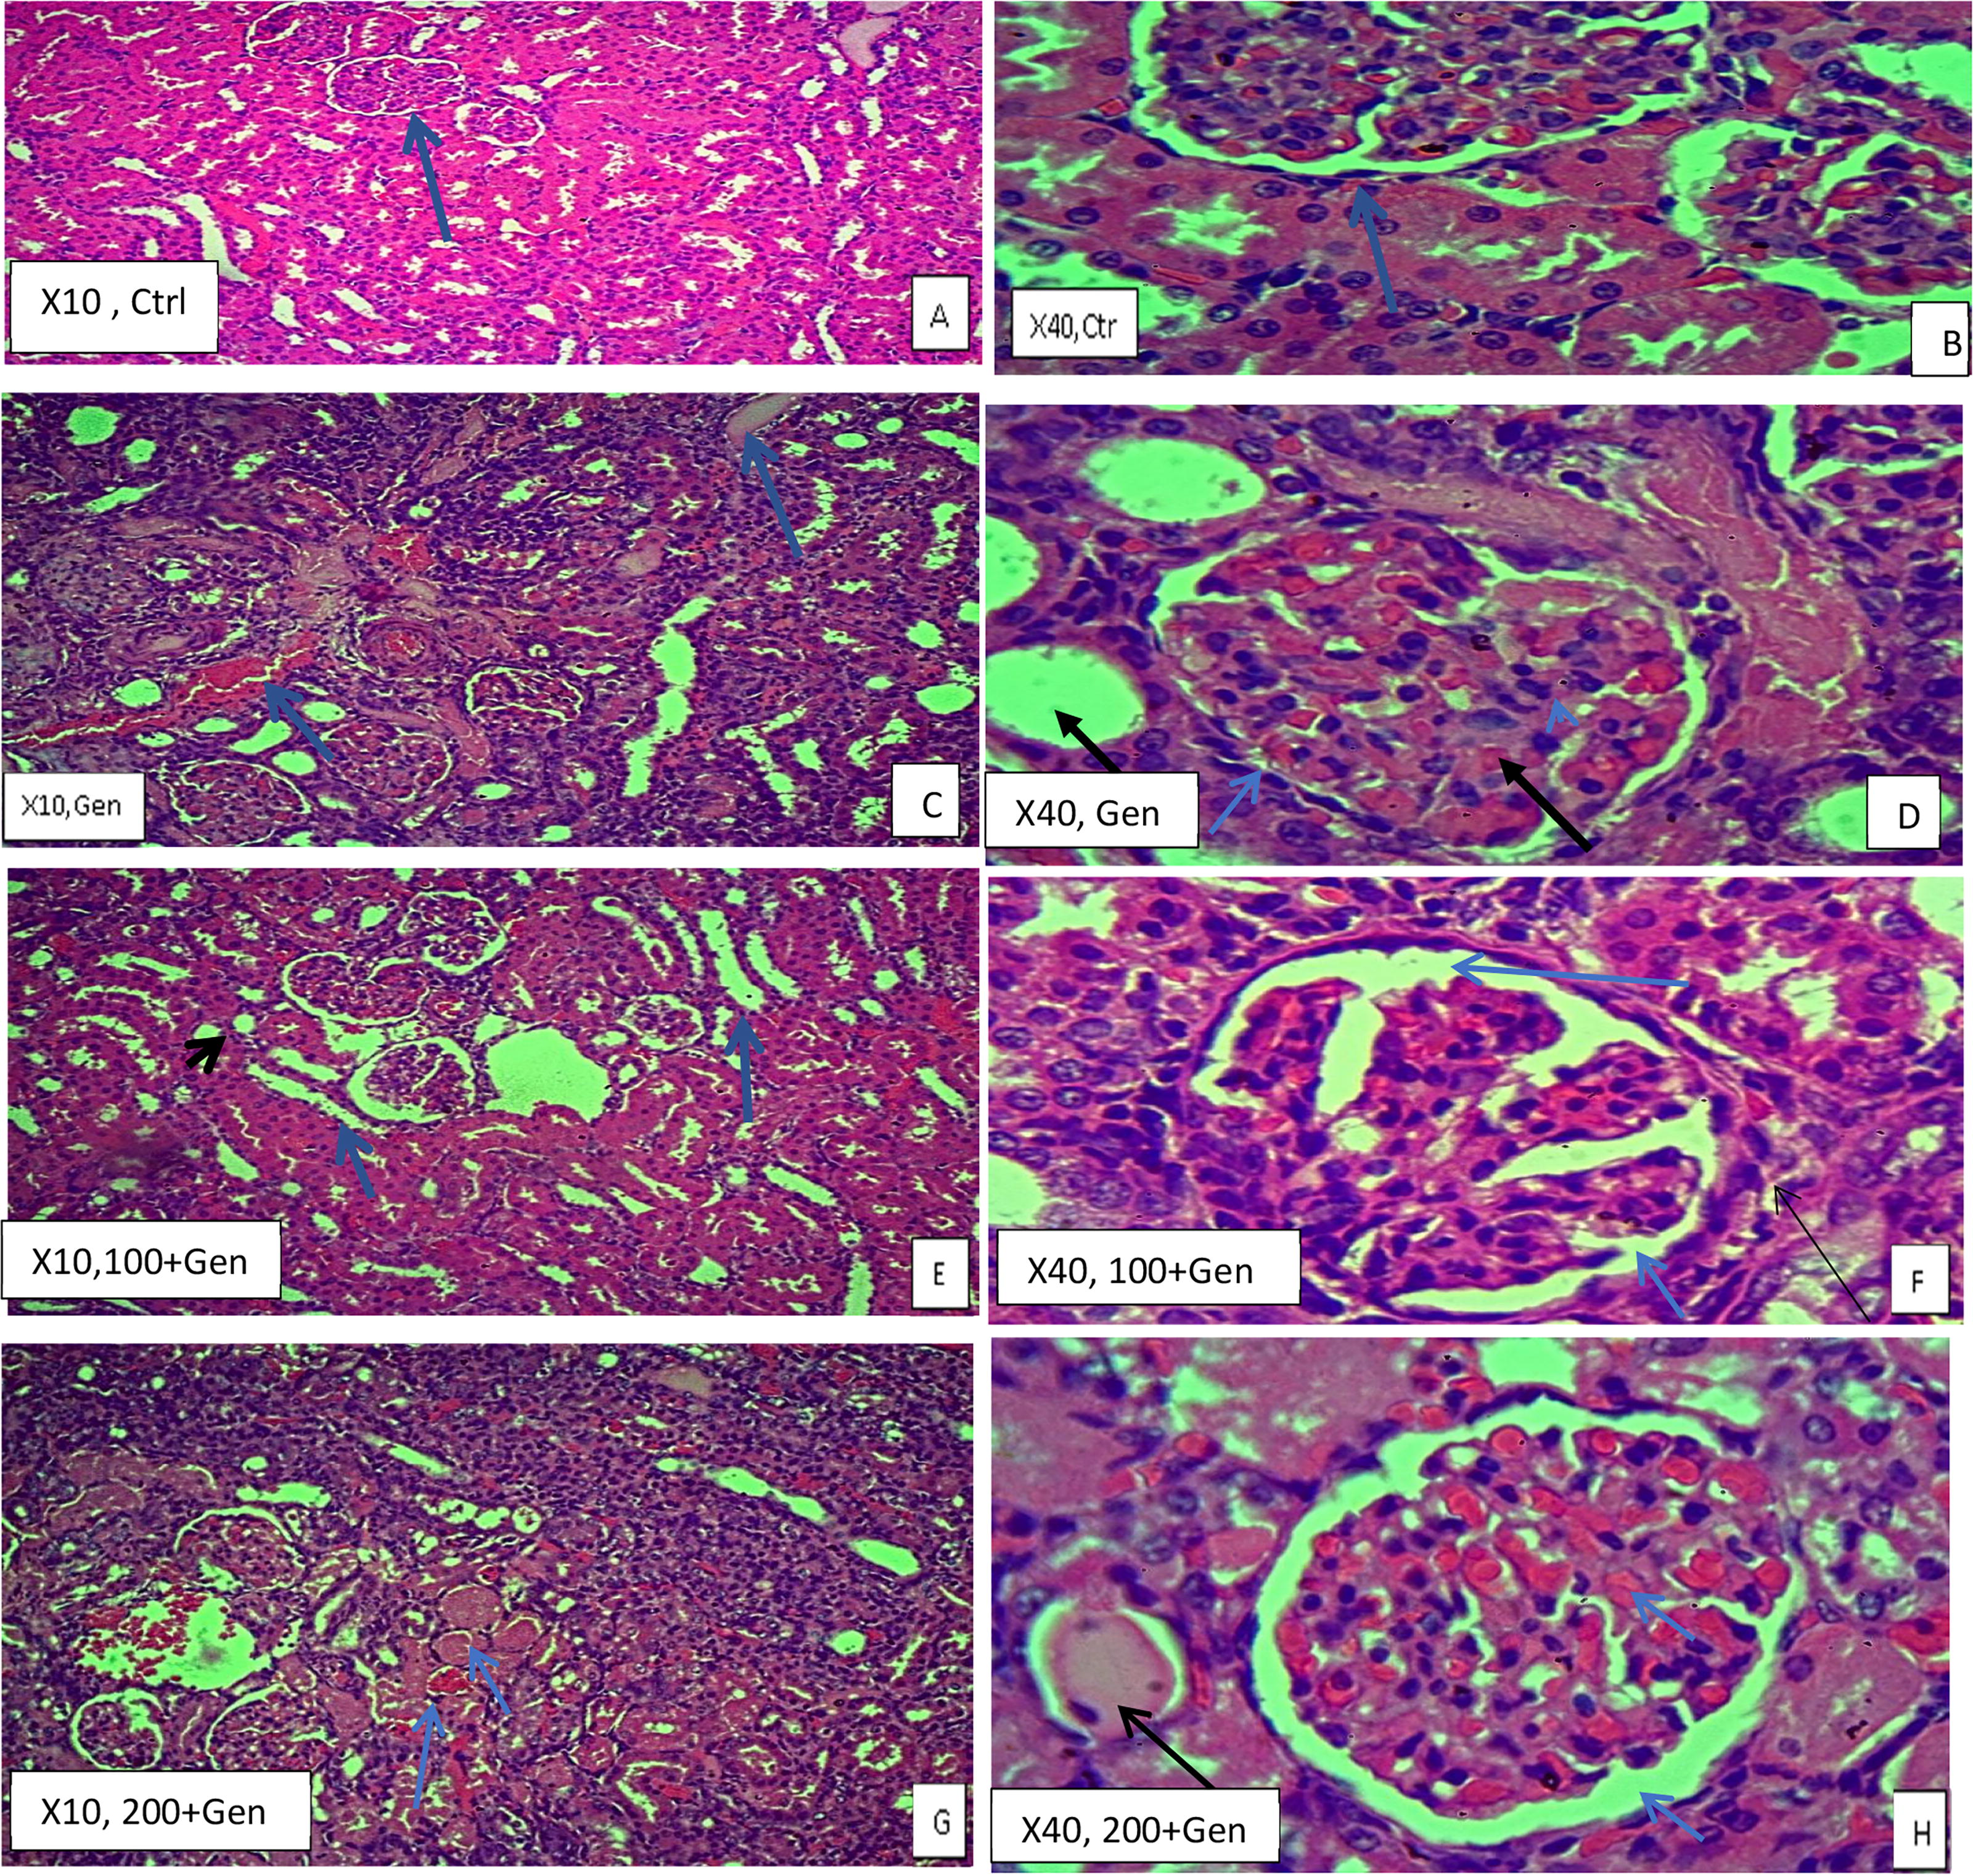
A photomicrograph of a kidney.
The right kidney weight of group 2 rats (1.05 ± 0.12) was significantly higher (P = 0.0037, F = 5.066) when compared with group 1 (0.62 ± 0.03). Also, there was a significant decrease in group 4 (0.73 ± 0.07) compared with group 2 rats (1.05 ± 0.12) (Fig 2).
The plasma urea concentration in group 2, 3, and 4 (89.38 ± 6.234, 103.5 ± 5.703, and 96.37 ± 5.115) was significantly higher (P = < 0.0001, F = 56.03) when compared with group 1 (22.38 ± 1.610) (Table 4).
Effects of Aqueous Extract of Azadirachta indica on Markers of Renal Function of Rats with Gentamicin-Induced Nephrotoxicity
Values are expressed in mean ± SEM (n = 5).
P < .05.
P < .05 versus control.
P < .05 versus GEN.
P < .05 versus 100 + GEN.
There was no significant difference in the plasma creatinine concentration of group 2, 3, and 4 (0.77 ± 0.183, 0.76 ± 0.084, and 0.96 ± 0.191) when compared with group 1 (0.63 ± 0.176) (P = 0.5827, F = 0.6770) (Table 4).
There was a significant difference in the plasma concentration of bilirubin of groups 2, 3, and 4 (1.69 ± 0.10, 1.02 ± 0.03, and 1.02 ± 0.04) when compared with group 1 (1.38 ± 0.04) and also in groups 3 and 4 (1.02 ± 0.03 and 1.02 ± 0.04) when compared with group 2 (1.69 ± 0.10) (P = < 0.0001, F = 29.15) (Table 4).
The plasma KIM 1 concentration of group 2 and 3 (173.90 ± 3.749 and 167.70 ± 4.302) was significantly higher (P = < 0.0001, F = 125.4) when compared with group 1 (82.05 ± 3.724) and group 4 (70.00 ± 7.071) (Table 4).
The plasma cystatin C concentration of group 2 (50.65 ± 0.794) was significantly higher (P = < 0.002, F = 8.988) when compared with group 1 (40.78 ± 0.994), and group 4 (36.15 ± 3.726) was significantly lower to groups 2 and 3 (50.65 ± 0.794 and 46.60 ± 1.619) (Table 4).
There was a significant increase in MDA concentration of groups 2 and 4 (7.43 ± 0.723 and 6.75 ± 0.215) when compared with group 1 (4.68 ± 0.308) (P = 0.0013, F = 10.09) and also an increase in group 4 (6.75 ± 0.215) compared with group 3 (5.02 ± 0.190) as well as a decrease in group 3 (5.02 ± 0.190) compared with group 2 (7.43 ± 0.723) (Table 5).
Effects of Aqueous Extract of Azadirachta indica on Antioxidant Parameters of Rats with Gentamicin-Induced Nephrotoxicity
Values are expressed in mean ± SEM (n = 5).
P < .05.
P < .05 versus control.
P < .05 versus GEN.
P < .05 versus 100 + GEN.
CAT, catalase; GPx, glutathione peroxidase; MDA, malondialdehyde; SOD, superoxide dismutase.
There was a significant difference in the GSH concentration of groups 2, 3, and 4 (0.07 ± 0.005, 0.03 ± 0.002, and 0.07 ± 0.006) when compared with group 1 (0.05 ± 0.004) (P = < 0.0001, F = 22.70) and also an increase in group 4 (0.07 ± 0.006) compared with group 3 (0.03 ± 0.002) as well as a decrease in group 3 (0.03 ± 0.002) compared with group 2 (0.07 ± 0.005) (Table 5).
The SOD concentration in groups 2, 3, and 4 rats (2.13 ± 0.125, 3.00 ± 0.289, and 1.25 ± 0.144) was significantly lower (P = < 0.0001, F = 62.35) when compared with group 1 (5.13 ± 0.239) and also in group 4 (1.25 ± 0.144) when compared with group 3 (3.00 ± 0.289), while there was a significant increase in group 3 (3.00 ± 0.289) compared with group 2 (2.13 ± 0.125) (Table 5).
There was a significant difference in catalase (CAT) concentration of groups 2, 3 and 4 (1.27 ± 0.254, 6.84 ± 0.492, and 2.53 ± 0.295) when compared with group 1 (4.31 ± 0.277) (P = < 0.0001, F = 49.60) and also an increase in groups 3 and 4 (6.84 ± 0.492 and 2.53 ± 0.295) compared with group 2 (1.27 ± 0.254) while a decrease in group 4 (2.53 ± 0.295) compared with group 3 (6.84 ± 0.492) (Table 5).
The GPx concentration in groups 2 and 3 rats (1.46 ± 0.386 and 6.63 ± 0.862) was significantly lower (P = < 0.0001, F = 66.07) when compared with group 1 (12.38 ± 0.659), while in groups 3 and 4 (6.63 ± 0.862 and 10.64 ± 0.314), it was higher when compared with group 2 (1.46 ± 0.386). Also there was a significant increase in group 4 (10.64 ± 0.314) compared with group 3 (6.63 ± 0.862) (Table 5).
There was a significant difference in IL-1 concentration of groups 2, 3, and 4 (56.60 ± 2.725, 19.20 ± 0.314, and 101.90 ± 2.040) when compared with group 1 (42.90 ± 0.332) (P = < 0.0001, F = 410.2) and also in groups 3 and 4 (19.20 ± 0.314 and 101.90 ± 2.040) compared with group 2 (56.60 ± 2.725) while an increase in group 4 (101.90 ± 2.040) compared with group 3 (19.20 ± 0.314) (Table 6).
Effect of Aqueous Extract of Azadirachta indica on the Inflammatory Markers of Rats with Gentamicin-induced Nephrotoxicity
Values are expressed in mean ± SEM (n = 5).
P < .05.
P < .05 versus control.
P < .05 versus GEN.
P < .05 versus 100 + GEN.
IL-1, interleukin-1; TNF-α, tumor necrotic factor alpha.
The TNF-α concentration in groups 2, 3, and 4 rats (357.50 ± 1.658, 326.60 ± 12.34, and 302.50 ± 10.57) was significantly higher (P = < 0.0001, F = 38.31) when compared with group 1 (236.10 ± 3.268), while groups 3 and 4 (326.60 ± 12.34 and 302.50 ± 10.57) was lower when compared with group 2 (357.50 ± 1.658) (Table 6).
The caspase-3 concentration in group 2 (2.45 ± 0.263) was significantly higher (P = < 0.0001, F = 20.00) when compared with group 1 (1.15 ± 0.012); while, groups 3 and 4 (1.27 ± 0.085 and 1.14 ± 0.064) were lower when compared to group 2 (2.45 ± 0.263) (Table 6).
The BCL-2 concentration in groups 2, 3, and 4 rats (38.75 ± 0.750, 32.25 ± 0.688, and 36.75 ± 0.750) was significantly lower (P = < 0.0001, F = 366.3) when compared with group 1 (79.75 ± 1.931); likewise, group 3 (32.25 ± 0.688) was lower when compared with group 2 (38.75 ± 0.750), while there was an increase in group 4 (36.75 ± 0.750) compared to group 3 (32.25 ± 0.688) (Table 7).
Effect of Aqueous Extract of Azadirachta indica on the Apoptotic Markers of Rats with Gentamicin-induced Nephrotoxicity
Values are expressed in mean ± SEM (n = 5).
P < .05.
P < .05 versus control.
P < .05 versus GEN.
P < .05 versus 100 + GEN.
BAX, B-cell lymphoma-2 associated X; BCL-2, B-cell lymphoma.
There was a significant difference in BAX concentration of group 2 and 4 (7.32 ± 0.190 and 0.79 ± 0.024) when compared with group 1 (2.10 ± 0.058) (P = < 0.0001, F = 235.7), while there was a decrease in groups 3 and 4 (2.67 ± 0.312 and 0.79 ± 0.024) compared with group 2 (7.32 ± 0.190) as well as a decrease in group 4 (0.79 ± 0.024) compared with group 3 (2.67 ± 0.3) (Table 7).
Histopathological examination
A photomicrograph of a kidney shows normal renal tissue with a normal glomerulus and Bowman space (urinary space); in slides A and B, there is a slight distortion of podocyte (short blue arrow), presence of fibrotic tissue on the glomerulus (black arrow), a fibrotic lesion within the distal convoluted tubule (thick blue arrows), and enlargement of the proximal convoluted tubule (black thick arrow) and Bowman space collapse (Slender Blue Arrow) in Gen (slides C and D), while E and F show normal convoluted tubules (thick black and blue arrows), fibrotic lesions are less visible (slender black arrow), Bowman space is normal (long blue arrow), and podocyte is normal and seen clearly (short blue arrow). G and H shows a prominent fibrotic lesion (blue slender arrow) and occluded convoluted tubules (black arrow), but Bowman space is intact (thick blue arrow) (Figure 3).
DISCUSSION
This study investigated the prophylactic effect of Aqueous extract of Azadirachta indica on some markers of renal functions, antioxidant, inflammatory, and apoptotic markers of rats with GEN-induced nephrotoxicity.
At week three of the experiment, a decrease in the body weight of GEN-treated groups indicates that GEN has a negative impact on body weight. This agrees with the studies of Erdem et al. 7 and El-Zawahry and Abu El Kheir, 8 who demonstrated that GEN therapy reduced the food intake and body weight of rats. This is one of the known effects of GEN on body weight but contradicts Ogundipe et al., 9 who reported an increase in food consumption and body weight that was associated with GEN administration. The nephrotoxic ability of the drug is thought to be the primary cause of this weight loss. 10 Due to food malabsorption and decreased appetite brought on by renal impairment following GEN use, more weight loss may occur. 11
It was demonstrated that administering the aqueous extract of Azadirachta indica to rats enhanced body weight gain compared with the GEN group. In a previous study, rats given an aqueous extract of Azadirachta indica saw significant histological changes in their intestines, showing the presence of more villi and larger goblet cells. The number of villi in the gut promotes nutritional absorption because the intestine’s surface area rises, according to Roy et al. 12 This might be a factor in the rats’ enhanced food absorption, which results in weight gain. Also, the anti-inflammatory and antioxidant properties of Azadirachta indica that probably prevent the toxic effect of GEN may be responsible for body weight gain. 13
The increase in kidney weight of GEN rats was in contrast to the results of Hassan et al. 14 and Saeed et al., 15 who found that GEN may cause a drop in kidney weight, which may be a symptom of kidney injury and cell death. None of the experimental treated groups demonstrated a significant increase in kidney weight over the control group. The increase in the kidney weight may be as a result of inflammations.
The rise in the plasma concentration of KIM 1 in GEN-treated rats was supported by Luo et al.’s 16 findings. This is a strong indication of kidney injury. Aqueous extract of Azadirachta indica prevents kidney injury, as observed in this study. This finding was in agreement with Abdel Moneim et al., 17 who reported that Neem leaf extract in methanol has demonstrated strong anti-cisplatin-induced nephrotoxicity protective benefits due to its antioxidant, anti-inflammatory, and other free radical-scavenging properties.
Also, an increase in cystatin C concentration in the plasma of GEN-treated rats was consistent with the findings of Udupa and Prakash. 18 The rise in cystatin C was prevented with the intervention of an Aqueous extract of Azadirachta indica, as observed in this study.
The insignificant difference in the creatinine concentration in the kidney experimental groups compared with the control group was in accordance with the report of Hayward et al. 19 that there is no significant increase in creatinine after a single dose of GEN, and the adverse events are relatively uncommon. The rise in urea plasma level of the GEN-treated rats was supported by the finding of Sandy et al. 20 The rise in urea level was unable to be prevented with the intervention of an Aqueous extract of Azadirachta indica, as observed in this study.
MDA concentration is a biological marker for lipid peroxidation. From this study, it was observed that there was lipid peroxidation in the kidney, but Azadirachta indica at 100 mg/kg per body weight can reduce it back to normal. However, Azadirachta indica at 200 mg/kg cannot reduce it back to normal, which could directly cause myoglobin autoxidation and myofibrillar protein carbonylation.
Glutathione peroxide is an enzyme that converts lipid peroxides to oxygen, water, and lipid alcohols, respectively, and then oxidizes glutathione to glutathione disulfide. 21 From this study, it was observed that there was a significant decrease in the group given GEN, which indicates that there will be an accumulation of hydrogen peroxide, which can cause hematemesis and foaming at the mouth, leading to obstruction in the respiratory tract and irritation of the gastrointestinal tract with nausea and vomiting. 21 Therefore, Azadirachta indica at 200 mg/kg body weight can prevent the effect of GEN on glutathione peroxide.
SOD is natural antioxidant protection for the body’s oxidative stress. 22 From this study, it was observed that the group given 200 mg/kg body weight of Azadirachta indica plus GEN had a detrimental effect on SOD and can cause several diseases such as Familial Amyotrophic Lateral Sclerosis, Down’s syndrome, cataract, Parkinson’s disease, and other several neurological disorders. 23 Therefore, Azadirachta indica at 100 mg/kg body weight can alleviate the effect of GEN on SOD.
CAT is an antioxidant enzyme that catalyzes the conversion of hydrogen peroxide to water and molecular oxygen. From the study, we observed that GEN reduced the level of CAT due to oxidative stress. Azadirachta indica at 100 mg/kg per body weight increased CAT even beyond the normal value to prevent oxidative stress, but Azadirachta indica at 200 mg/kg per body weight reduced CAT. CAT is responsible for neutralization through the decomposition of hydrogen peroxide and maintaining the cellular redox homeostasis and can cause several diseases such as Alzheimer’s disease, diabetes, Parkinson’s disease, and so on. 24
The increase in IL-1 concentration in the plasma of GEN-treated rats was consistent with the findings. 25 GEN usage has been connected to kidney impairment, which can lead to inflammation and the production of pro-inflammatory cytokines such as IL-1. Aqueous extract Azadirachta indica was able to mitigate this inflammatory effect at low dosage. To buttress the inflammatory effect of GEN on the kidney is the increased concentration of TNF, which was supported by the finding of Zager et al. 26 who found that streptomycin also suppressed LPS-driven TNF-alpha increases, indicating an aminoglycoside drug class effect. Due to the antioxidant, anti-inflammatory, and other free radical-scavenging properties of neem leaf aqueous extract, substantial protective benefits against GEN-induced nephrotoxicity have been observed.
Caspase-3 is a crucial mediator of programmed cell death (apoptosis). It helps in the activation of proteolytic roles in the execution of apoptosis in cells. From the study, we observed that GEN administration induces apoptosis in the kidney, but Azadirachta at both 100 mg/kg and 200 mg/kg body weight was able to prevent an increased level of caspase 3.
BAX is a protein that functions as an apoptotic activator. It was observed that there was an increase in the group that was administered only GEN, which is also a confirmation of apoptosis. This was supported by the findings of Mohamed et al. 27 Therefore, Azardirachta indica prevented apoptosis caused by Gentamicin in the kidney.
BCL-2 is also a marker of apoptosis. It was observed that there was a decrease in BCL-2 level in the Gentamicin group due to apoptosis. This was supported by the report of Kamel et al. 28 As BAX increases, BCL-2 decreases, which is also confirming apoptosis in the kidney.
In conclusion, the extract has prophylactic potential in managing GEN-induced nephrotoxicity by decreasing the markers of renal function and inflammation and downregulating the markers of apoptosis. This great potential may be due to the bioactive ingredients as reviewed from the GC-MS screening and the presence of antioxidants such as flavonoids, alkaloids, glycosides, and so forth.