
Abstract
Abstract
Purpose:
To investigate the effect of differently preserved ophthalmic solutions on the viability and barrier function of human corneal epithelial cells (HCEC) using fluorescent dyes.
Methods:
HCEC monolayers were exposed to the ophthalmic solutions containing benzalkonium chloride (BAK), edetate disodium, polyquad, stabilized oxychloro complex (Purite), sodium perborate, or sorbic acid for 5 min, 15 min, and 1 h. At 24 h after exposure, the cultures were assessed for metabolic activity using alamarBlue. The enzyme activity, membrane integrity, and apoptosis were evaluated using confocal microscopy. Barrier function was assessed using sodium fluorescein.
Results:
The metabolic assay showed that the BAK-preserved ophthalmic solutions significantly reduced cell viability after a 5-min exposure compared to the phosphate buffered saline treated control (P<0.05). Using confocal microscopy, the micrographs showed that BAK caused a reduction in the enzyme activity, increased membrane permeability, and decreased the number of viable cells. Ophthalmic solutions with new preservatives had varying time-dependent adverse effects on cell viability, and the preservative-free solution had the least effect on HCEC. Sodium fluorescein permeability showed that HCEC monolayers treated with BAK-preserved solutions were more permeable to sodium fluorescein than those treated by the other ophthalmic solutions (P<0.05).
Conclusions:
BAK-preserved solutions had greater adverse effects on metabolic activity, enzyme activity, membrane integrity, cell viability, and barrier function than the solutions that were not preserved with BAK. Our study suggests that BAK-free especially, preservative-free ophthalmic solutions are safer alternatives to BAK-preserved ones.
Introduction
Due to the toxicity of BAK, considerable effort has been made to discover and develop new preservatives that have less toxicity, but have similar capabilities of inhibiting microorganism growth in multiple-dose containers. Some new preservatives are commercially available, such as the stabilized oxychloro complex (Purite), polyquad, sodium perborate, and sorbic acid. Single-dose preservative-free ophthalmic solutions are also now available.
Several in vivo studies have compared the newer preservatives (Purite, polyquad, and sodium perborate) with BAK. Studies that investigated the effects of glaucoma medications on the cornea demonstrated that Purite-preserved eye drops were significantly more comfortable and showed less damage to the cornea than the BAK-preserved products.3,14,15 Bernal and Ubels found that BAK-containing eye drops caused rabbit corneas to become significantly more permeable to carboxyfluorescein than corneas treated with polyquad-preserved eye drops. 16 Labbe et al. also showed that polyquad 0.5% did not cause significant changes in the ocular surface of rats compared to saline. 17 Garcia-Valenzuela et al. studied the use of corneal lubricants during the course of vitrectomy surgery and determined that the sodium perborate maintained corneal clarity and epithelial integrity better than the lubricant that contained BAK. 18
To assess the potential damaging effects of the ophthalmic solutions on the cornea, an in vitro test battery using fluorescent dyes can be used. The validity of the test battery can be shown by its ability to predict toxicity as demonstrated from in vivo toxicology studies and clinical investigations. Due to the extensive data available on the harmful effects of BAK on the cornea in animal studies and in humans, the concentrations of 0.01%, 0.005%, and 0.001% were used as the positive controls in our investigation. In addition, newer preservatives that have been shown to be less toxic from in vivo studies were used within our study as comparative controls due to the fact that they should show less toxicity to human corneal epithelial cells (HCEC) than BAK. The aim of this study was to compare the relative toxicity of commonly used eye drops and eye washes, and to demonstrate the utility of this in vitro battery for assessing the toxicity of ophthalmic products.
Methods
Chemicals and solutions
Nine ophthalmic solutions, including 6 dry eye drops and 3 eye washes were evaluated in this study. The solutions were purchased from commercial sources and were used within their labeled expiration dates. One solution (Visine) is preservative-free; 5 solutions (Systane, Refresh, GenTeal, ReNu, and Rite Aid) contain new preservatives; and 3 solutions (Akwa, Collyrium, and Optrex) contain BAK. Table 1 shows all the test solutions and their preservatives. Phosphate-buffered saline (PBS) (Lonza, Walkersville, MD) was used as a negative control, and BAK 0.01%, BAK 0.005%, and BAK 0.001% (CAS No. 63449-41-2; Sigma-Aldrich St. Louis, MO) were used as positive controls.
BAK, benzalkonium chloride.
Cell culture
HCEC were obtained from RIKEN BioResource Center, Tsukuba, Japan (#RCB 2280). It is a SV40-transformed human corneal epithelial cell line. The present study was performed with this cell line because it has good growth characteristics, shows a cobblestone-like appearance, develops good tight junctions, and it is free of infectious virus particles.19–21 The monolayers of the HCEC were prepared, with cultures that were less than 30 passages.
The HCEC were cultured in the DMEM/F-12 Ham Medium (Gibco Invitrogen), with 10% fetal bovine serum (Gibco Invitrogen) and penicillin/streptomycin (Gibco Invitrogen) in a humidified environment at 37°C with 5% CO2. These cultures were maintained with weekly subculture using Tryple Express (stable trypsin replacement; Gibco Invitrogen) and fed every 2 to 3 days.
Assessment of metabolic activity
A cell suspension (1 mL) containing 105 cells was seeded in 24-well plates (BD Falcon) and grown to approximately 75% to 80% confluency at 37°C with 5% CO2. The cells were then exposed to a test solution for 5 min, 15 min, and 1 h. After exposure, the test solutions were removed and the cultures were rinsed with 1 mL PBS. The cultures were then incubated for another 24 h in a new culture medium at 37°C with 5% CO2. Following incubation, the medium was removed, and the well was rinsed with 1 mL PBS again. One mL of 10% alamarBlue (Invitrogen) prepared in a medium without serum and phenol red was then added to each well and the cultures were incubated at 37°C for 4 h. After incubation, the change in the fluorescence of the alamarBlue reagent (resazurin to resorufin) was measured using a SpectraMax fluorescence multiwell plate reader (Molecular Devices) with the excitation/emission wavelengths set at 530/590 nm. The few cells that detached from the plate surface after exposure to the test solution and PBS rinses were collected and assessed for viability using Trypan blue. All experiments were done in triplicate.
Confocal microscopy study with fluorescent viability dyes
Confocal microscopy (Carl Zeiss LSM) with fluorescent viability dyes (calcein AM, ethidium homodimer-1 (EthD-1), and annexin V-Alexa Fluor 647 conjugate (annexin V); Invitrogen) were used to visualize live, dead, and apoptotic cells after exposure. Calcein changes to a fluorescent green molecule after reaction with intracellular enzymes in live cells; EthD-1 penetrates the compromised membranes and stains the nuclei of dead or dying cells; annexin V binds to phosphatidylserine (PS) on the outer surface of the cell membrane in apoptotic cells, and can stain PS in the interior of the cell membrane in dead cells.
HCEC, 4×10⁵ cells in 1 mL of culture medium, were transferred into collagen-coated glass-bottom culture Petri dishes (MatTek Corp.), and grown to confluence at 37°C with 5% CO2 for 2 days. The cultures were then exposed to the test solution for 5 min, 15 min, and 1 h. After exposure, the test solutions were removed, and the cultures were rinsed with 1 mL of PBS. New medium was then added into the dishes and the cultures were then incubated for another 24 h at 37°C with 5% CO2. After incubation, the medium was removed from each Petri dish, and the dish was rinsed with 1 mL PBS again. The cells were then stained with annexin V (10 μL in a 500 μL buffer), calcein AM (2 μM), and EthD-1 (4 μM) for 20 min at 37°C. After staining, the fluorescence of the 3 dyes was then visualized with an Axiovert 100 microscope with a Zeiss confocal laser scanning microscope (CLSM) 510 system. The excitation/emission wavelengths for calcein AM, EthD-1, and annexin V, were 495/515, 528/617, and 650/665 nm, respectively. The natural color of annexin V fluorescence was red. However, in order not to confuse with the color of EthD-1 (which was also red), we set the confocal software to present annexin V as yellow. We distinguished the cells according to the colors and biding sites of the 3 dyes. Live cells stain with calcein (green), and exclude annexin V (yellow) and EthD-1(red); dead cells stain with EthD-1 (red) in the nuclei and can stain with annexin V (yellow) in the interior of the cell membrane; apoptotic cells stain with annexin V (yellow) on the outer surface of the membrane and exclude EthD-1 (red).The percentage of live, dead, and apoptotic cells in the confocal micrographs was calculated and compared. All experiments were done in triplicate.
Assessment of barrier function
A cell suspension (0.5 mL) containing 105cells was seeded in Millicell HA 13-mm inserts (Millipore). The inserts were then transferred into 24-well plates containing 0.5 mL of growth medium per well and incubated at 37°C with 5% CO2 for 7 days. The medium was changed every day during that period. On day 7, each insert was gently rinsed 3 times with 1 mL of PBS using a 5-mL syringe without a needle and placed in a fresh 24-well plate. Then, the cells were exposed to test solutions for 5 min, 15 min, and 1 h. After exposure, the test solutions were removed and the inserts were rinsed with 3 mL PBS and placed in a fresh 24-well plate containing 0.5 mL of growth medium per well and fresh medium (0.5 mL) was also added to each cell insert. The cultures were incubated for another 24 h at 37°C with 5% CO2. After incubation, each insert was individually rinsed 3 times with 1 mL of PBS and placed in fresh 24-well plates containing 0.5 mL of PBS in each well. Sodium fluorescein (Sigma-Aldrich; 0.5 mL; 3 mg/100 mL in PBS) was added to each insert. After a 20-min incubation period, the inserts were removed from the wells and the amount of sodium fluorescein that penetrated through the cell monolayer was measured with a SpectraMax fluorescence multiwell plate reader (Molecular Devices) at 485 nm excitation and 530 nm emission. All experiments were done in triplicate. Each series of triplicate samples was handled sequentially to allow the exact timing of the treatment and subsequent steps.
Statistical analysis
One-way ANOVA was used in the data analysis of this study. Pairwise multiple comparison procedures were performed using the Bonferroni post hoc test for the results of confocal microscopy study and the assessment of barrier function. The Games-Howell post hoc test was used for the results of metabolic activity tests because of the unequal variance of the data. The criterion of statistical significance was set to be P<0.05.
Results
Measurement time points
The toxicity of the test solutions was measured both immediately after exposure and at 24 h after exposure. However, the data at 24 h after exposure were chosen because the toxicity increased with increasing concentrations of BAK and exposure time, which correlated well with in vivo data. Some other in vitro studies also used 24-h postexposure time for ocular toxicity and irritation tests, and showed good correlations to in vivo studies.22–24 Therefore, this article only shows the data at 24 h after exposure.
Assessment of metabolic activity
The effect of the test solutions on the cell viability of HCEC was measured using alamarBlue. The metabolic activity of the cells at 24 h after exposure is shown in Fig. 1. The BAK-preserved ophthalmic solutions reduced cell viability to no more than 3% (compared to PBS) after 5-min and 15-min exposures, which was significantly lower than all the other tested solutions without BAK (P<0.05), and similar to BAK 0.01% and BAK 0.005%. The BAK-free solutions had varying time-dependent adverse effects on cell viability after 5-min, 15-min, and 1-h exposures. The preservative-free eye drops reduced cell viability significantly less than all the other products after 15-min and 1-h exposures (P<0.05). No significant differences were observed in the cell viability between Visine and the PBS control (P=0.77) after a 5-min exposure. Trypan blue exclusion test with manual cell count showed that less than 10% of the cells being washed away were live cells (Data not shown).
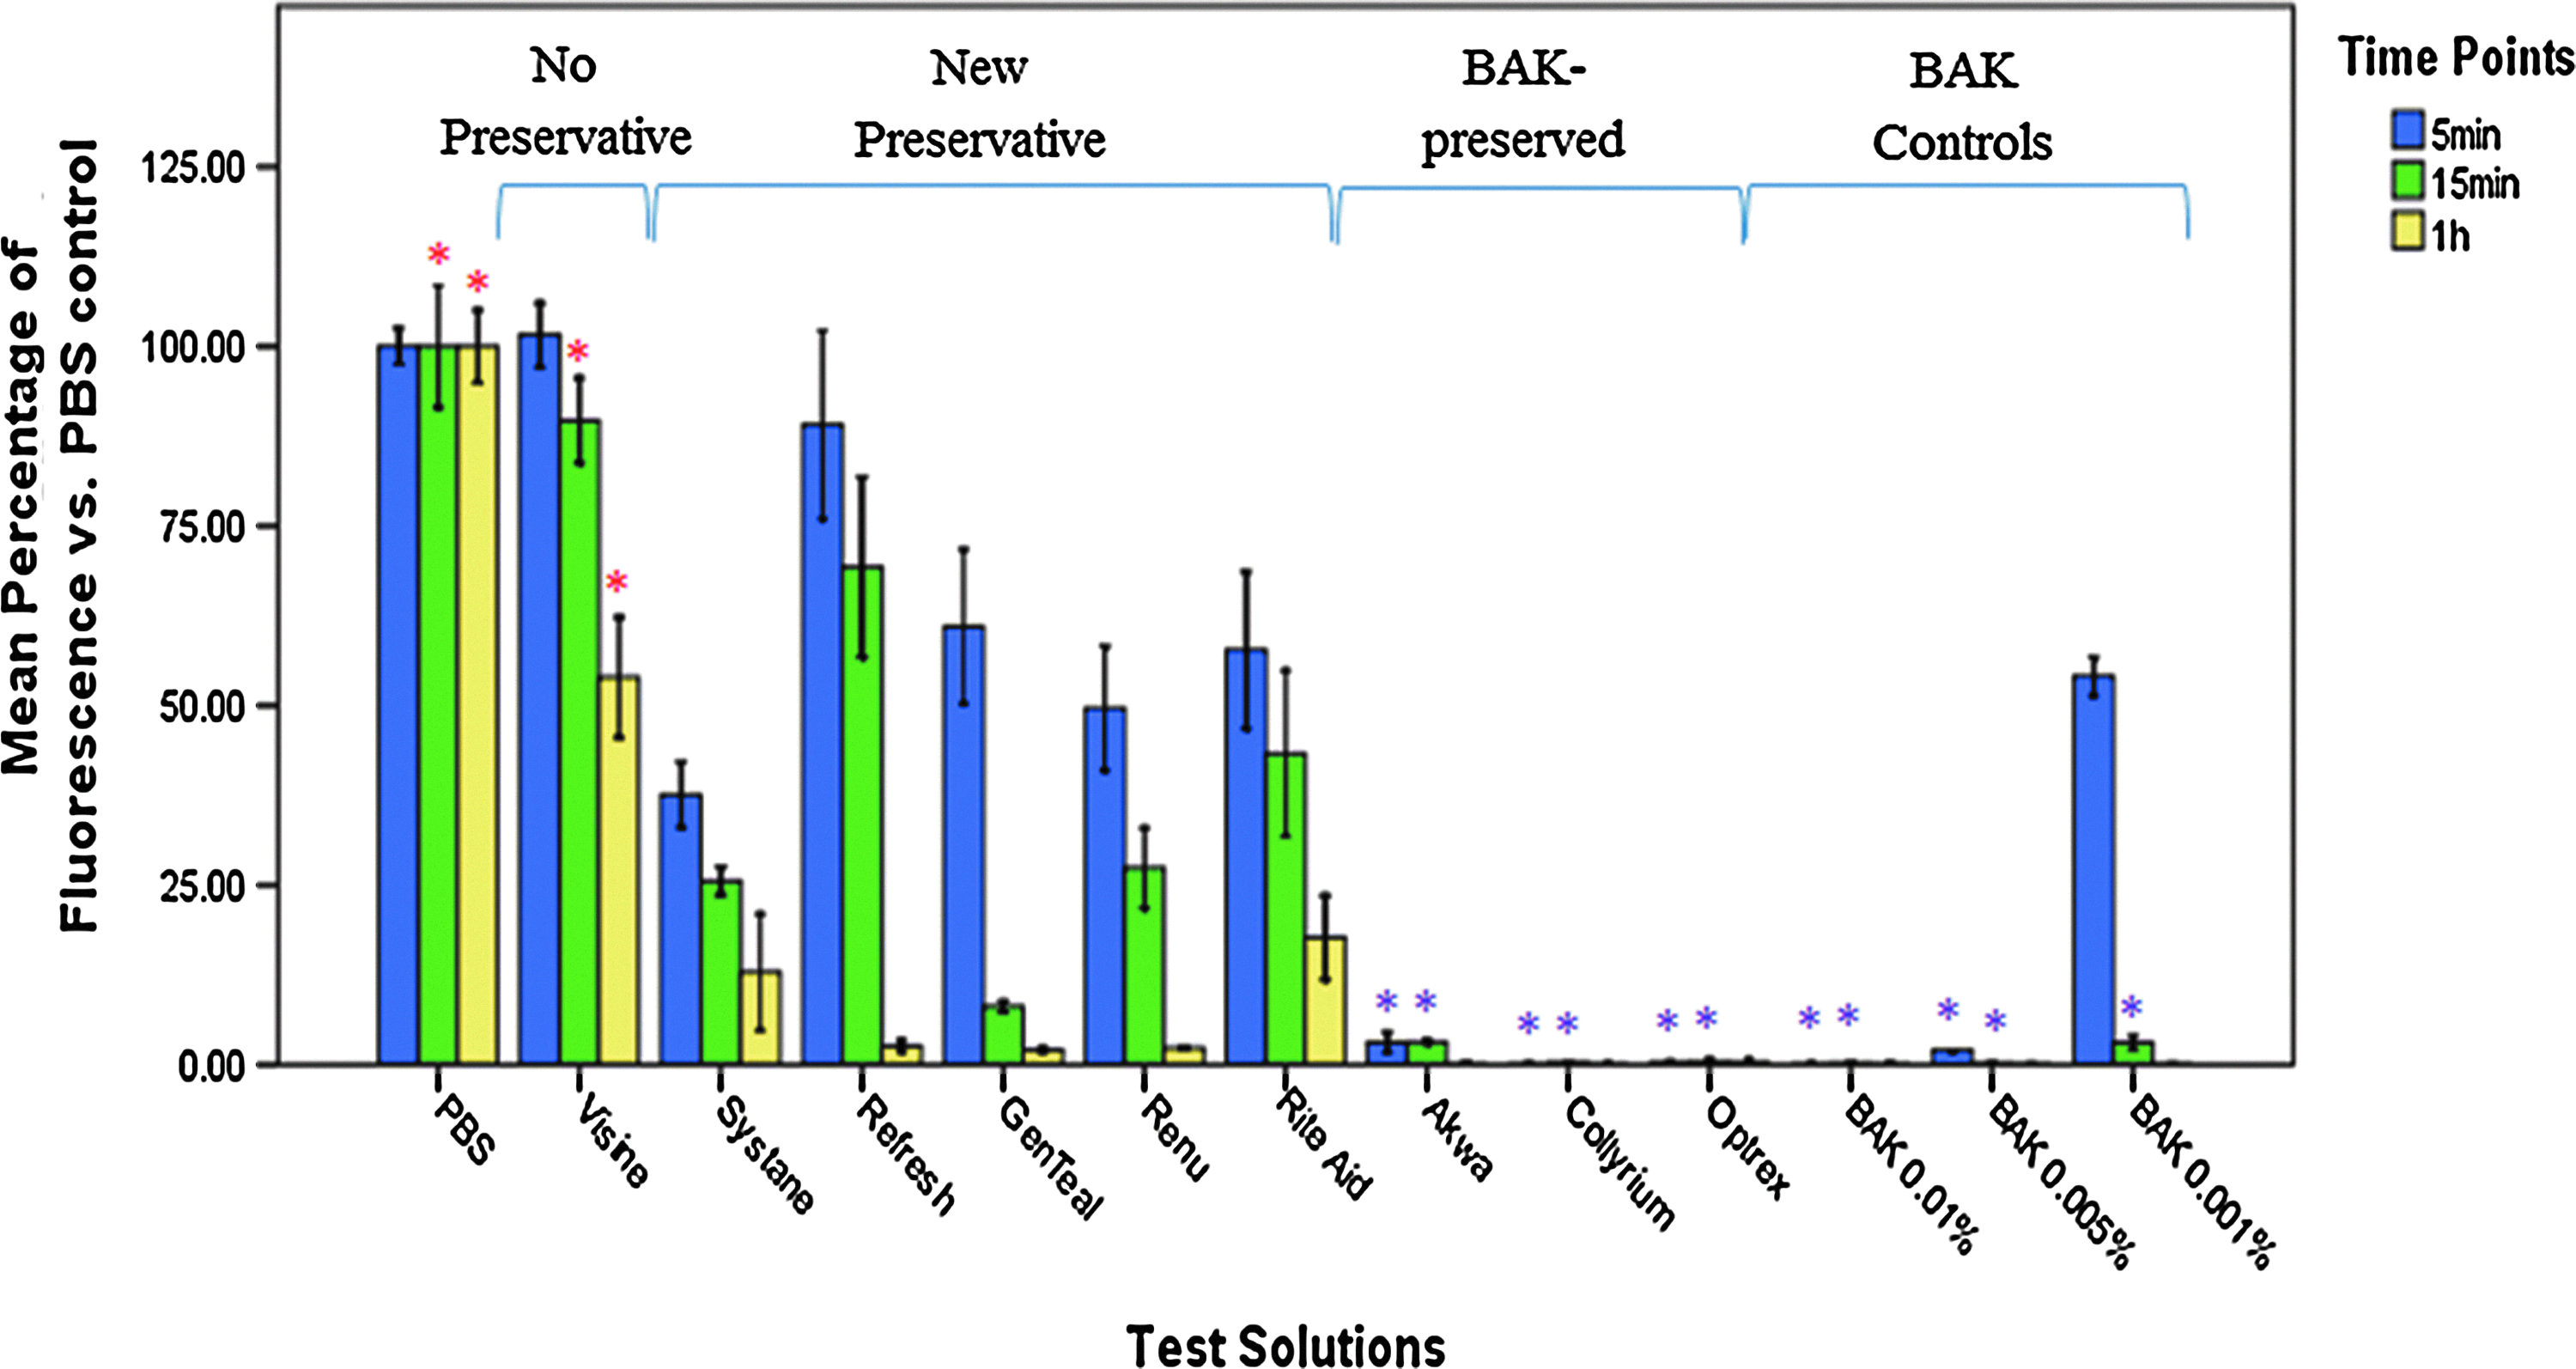
Viability of human corneal epithelial cells (HCEC) using alamarBlue. Cell viability at 24 h after exposure to the test solutions was measured using alamarBlue. Significantly different from all the preserved ophthalmic solutions (P<0.05) is indicated by a red asterisk (*). Significantly different from all benzalkonium chloride (BAK)-free ophthalmic solutions after 5- and 15-min exposures (P<0.05) is indicated by a purple asterisk (*). Error bars:±SD. Color images available online at www.liebertpub.com/jop
Confocal microscopy study with fluorescent viability dyes
The confocal microscopy with fluorescent viability dyes showed the cell viability of the cultures at 24 h after exposure to the test solutions. Figures 2–4 are representative confocal laser scanning micrographs. The cell size may vary depending on whether the cells adhered to the culture dish or not. The counts of live, dead, and apoptotic cells in confocal laser scanning micrographs are shown in Fig. 5. Mean counts were made using 3 separate cultures that are treated with each solution. In all the time points, BAK-preserved solutions showed significantly more cell death compared to the BAK-free solutions and the PBS control (Figs. 2–5, P<0.05). After a 5-min exposure, Akwa had the least cell toxicity among the solutions with BAK (Figs. 2 and 5, P<0.05). After a 1-h exposure, the preservative-free solution caused the least amount of cell death among all the test solutions (P<0.05); Refresh reduced the cell viability the most among all the solutions with new preservatives (P<0.05); and the BAK-preserved solutions caused 100% cell death (Figs. 4 and 5).
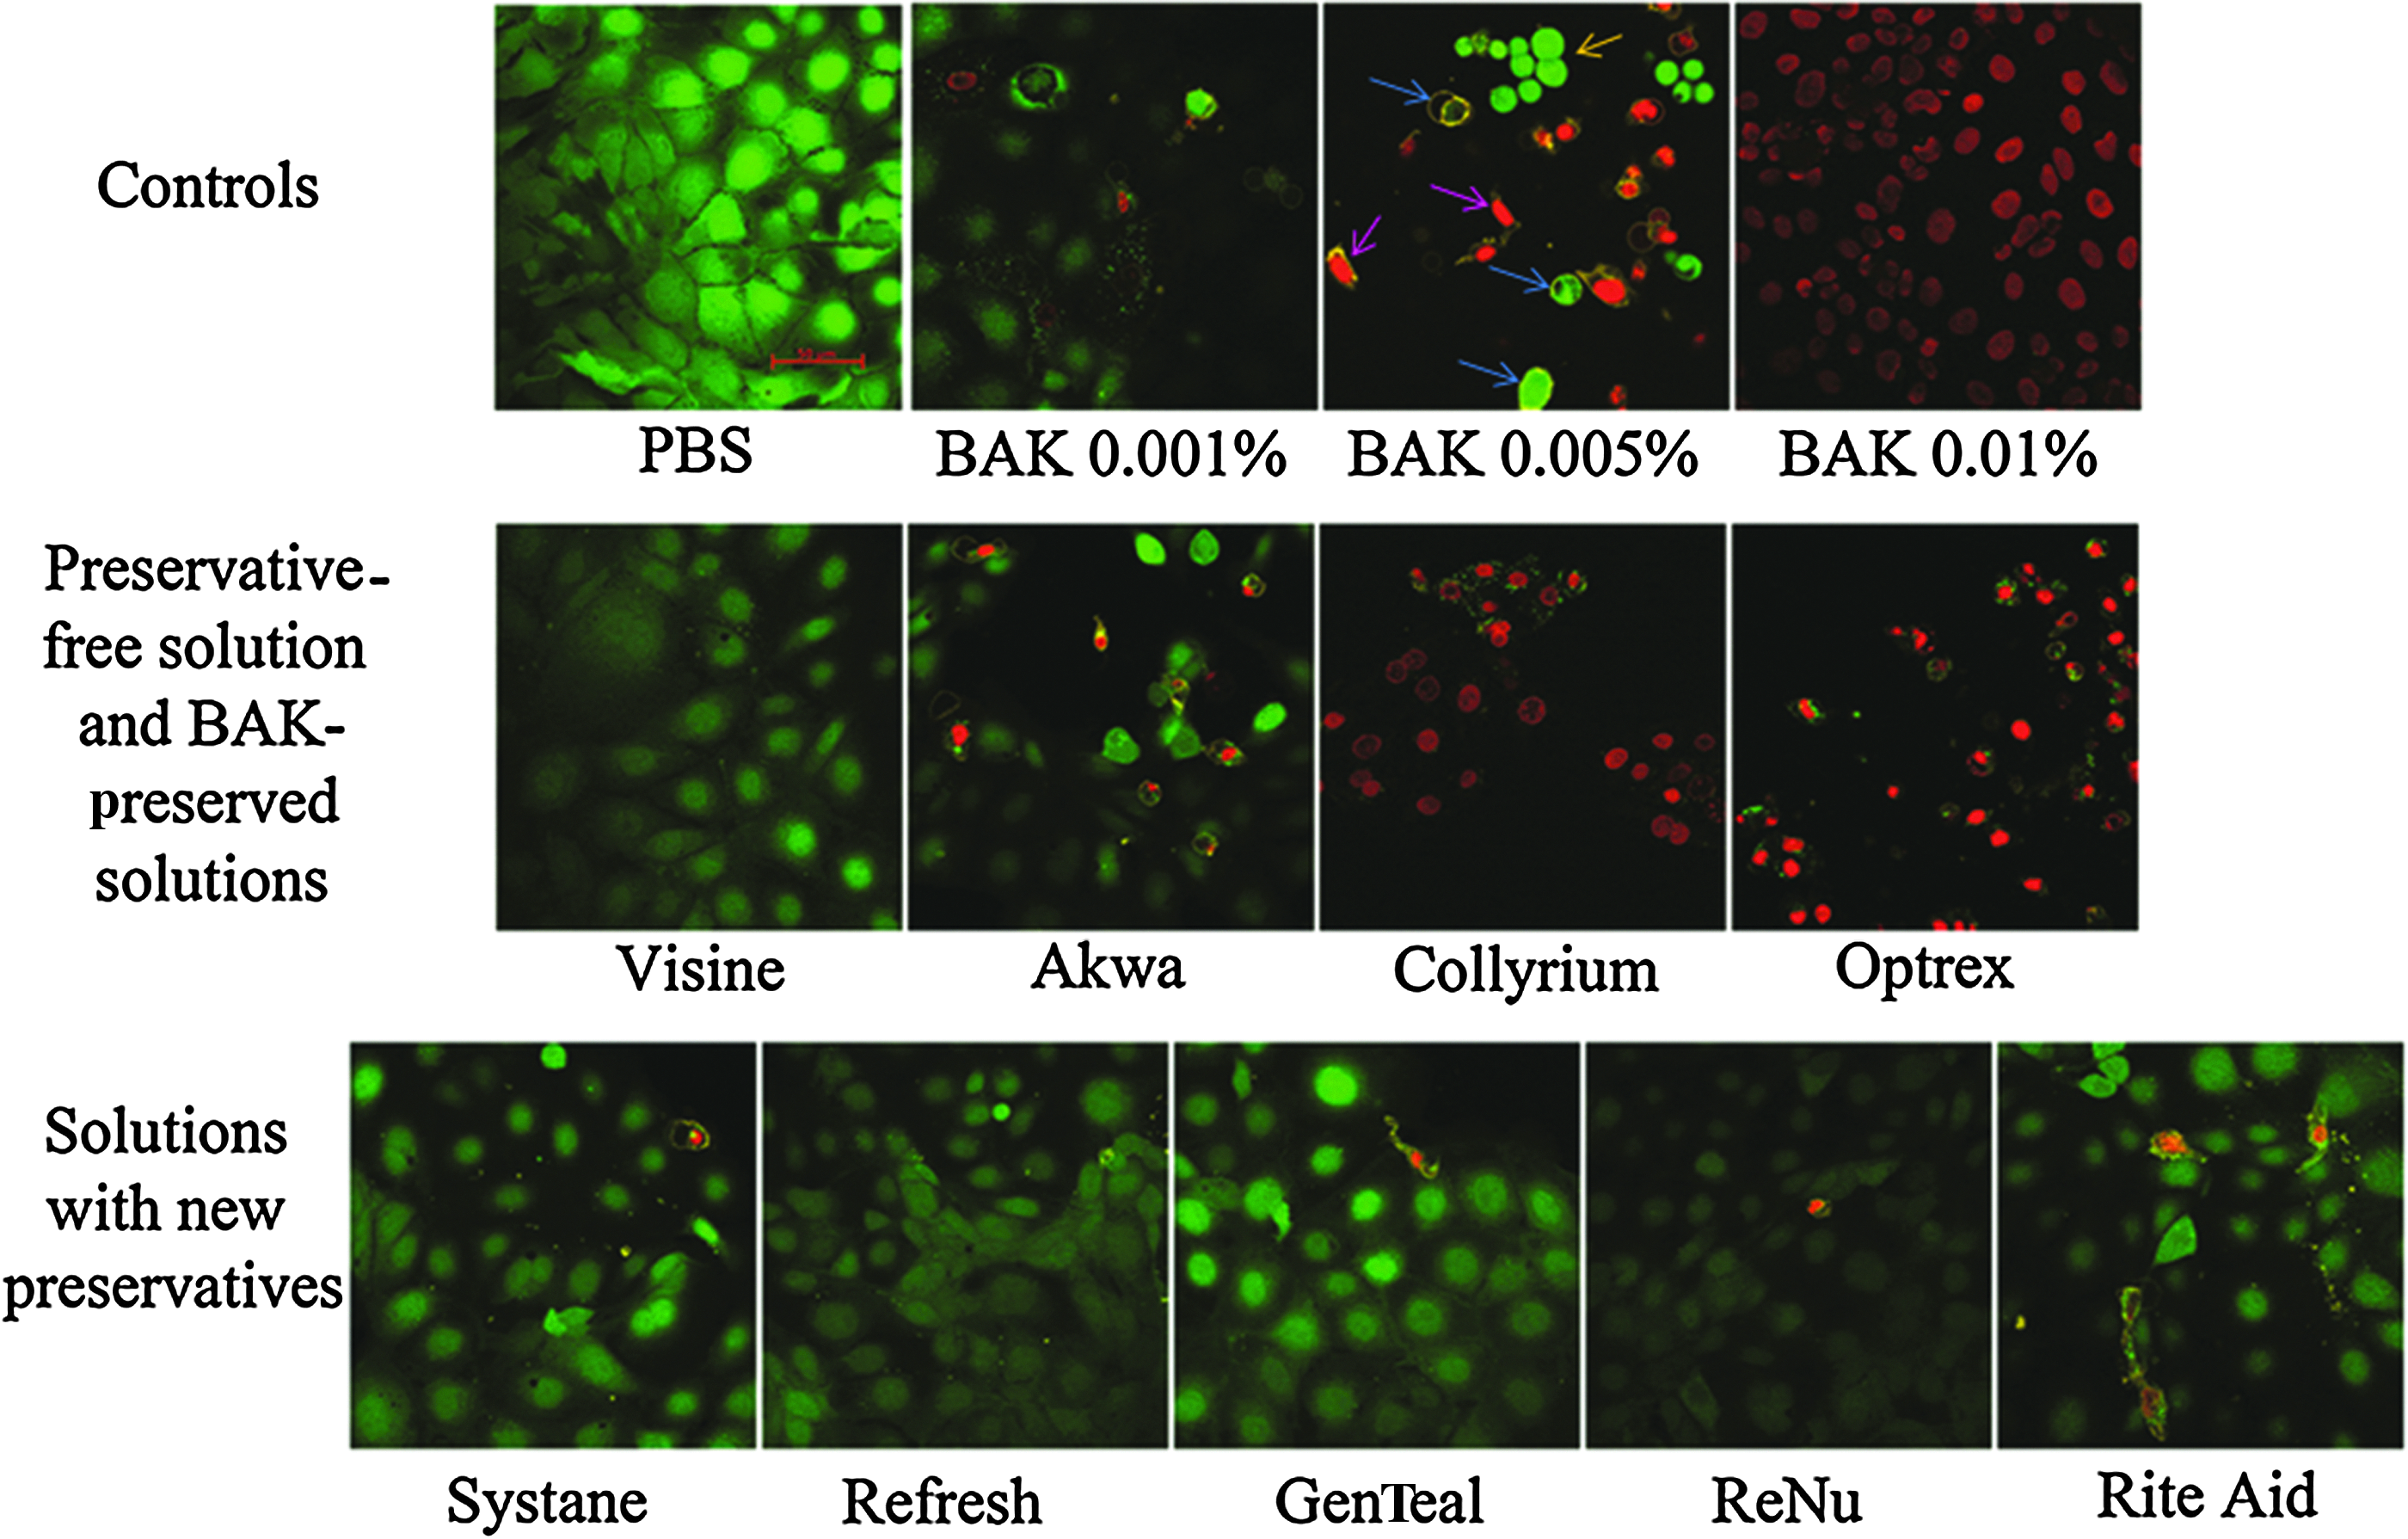
Representative confocal laser scanning micrographs of HCEC at 24 h after a 5-min exposure. The effect of the test solutions is shown on the distributions of live, dead, and apoptotic cells in the culture. Live cells are calcein (green)-positive, annexin V (yellow)-negative, and EthD-1(red)-negative; dead cells are EthD-1 (red)-positive; apoptotic cells are annexin V (yellow)-positive and EthD-1 (red)-negative. In the first row are the controls; in the second row are the preservative-free solutions (Visine) and the BAK-preserved solutions; and in the third row are the solutions that contain new preservatives. The yellow arrow indicates live cells; the blue arrows show cells in apoptosis; the purple arrows indicate dead cells. Bar=50 μm. All the micrographs use the same magnification. Color images available online at www.liebertpub.com/jop
Representative confocal laser scanning micrographs of HCEC at 24 h after a 15-min exposure. The effect of the test solutions is shown on the distributions of live, dead, and apoptotic cells in the culture. Live cells are calcein (green)-positive, annexin V (yellow)-negative, and EthD-1(red)-negative; dead cells are EthD-1 (red)-positive; apoptotic cells are annexin V (yellow)-positive and EthD-1 (red)-negative. In the first row are the controls; in the second row are the preservative-free solutions (Visine) and the BAK-preserved solutions; and in the third row are the solutions that contain new preservatives. Bar=50 μm. All the micrographs use the same magnification. Color images available online at www.liebertpub.com/jop

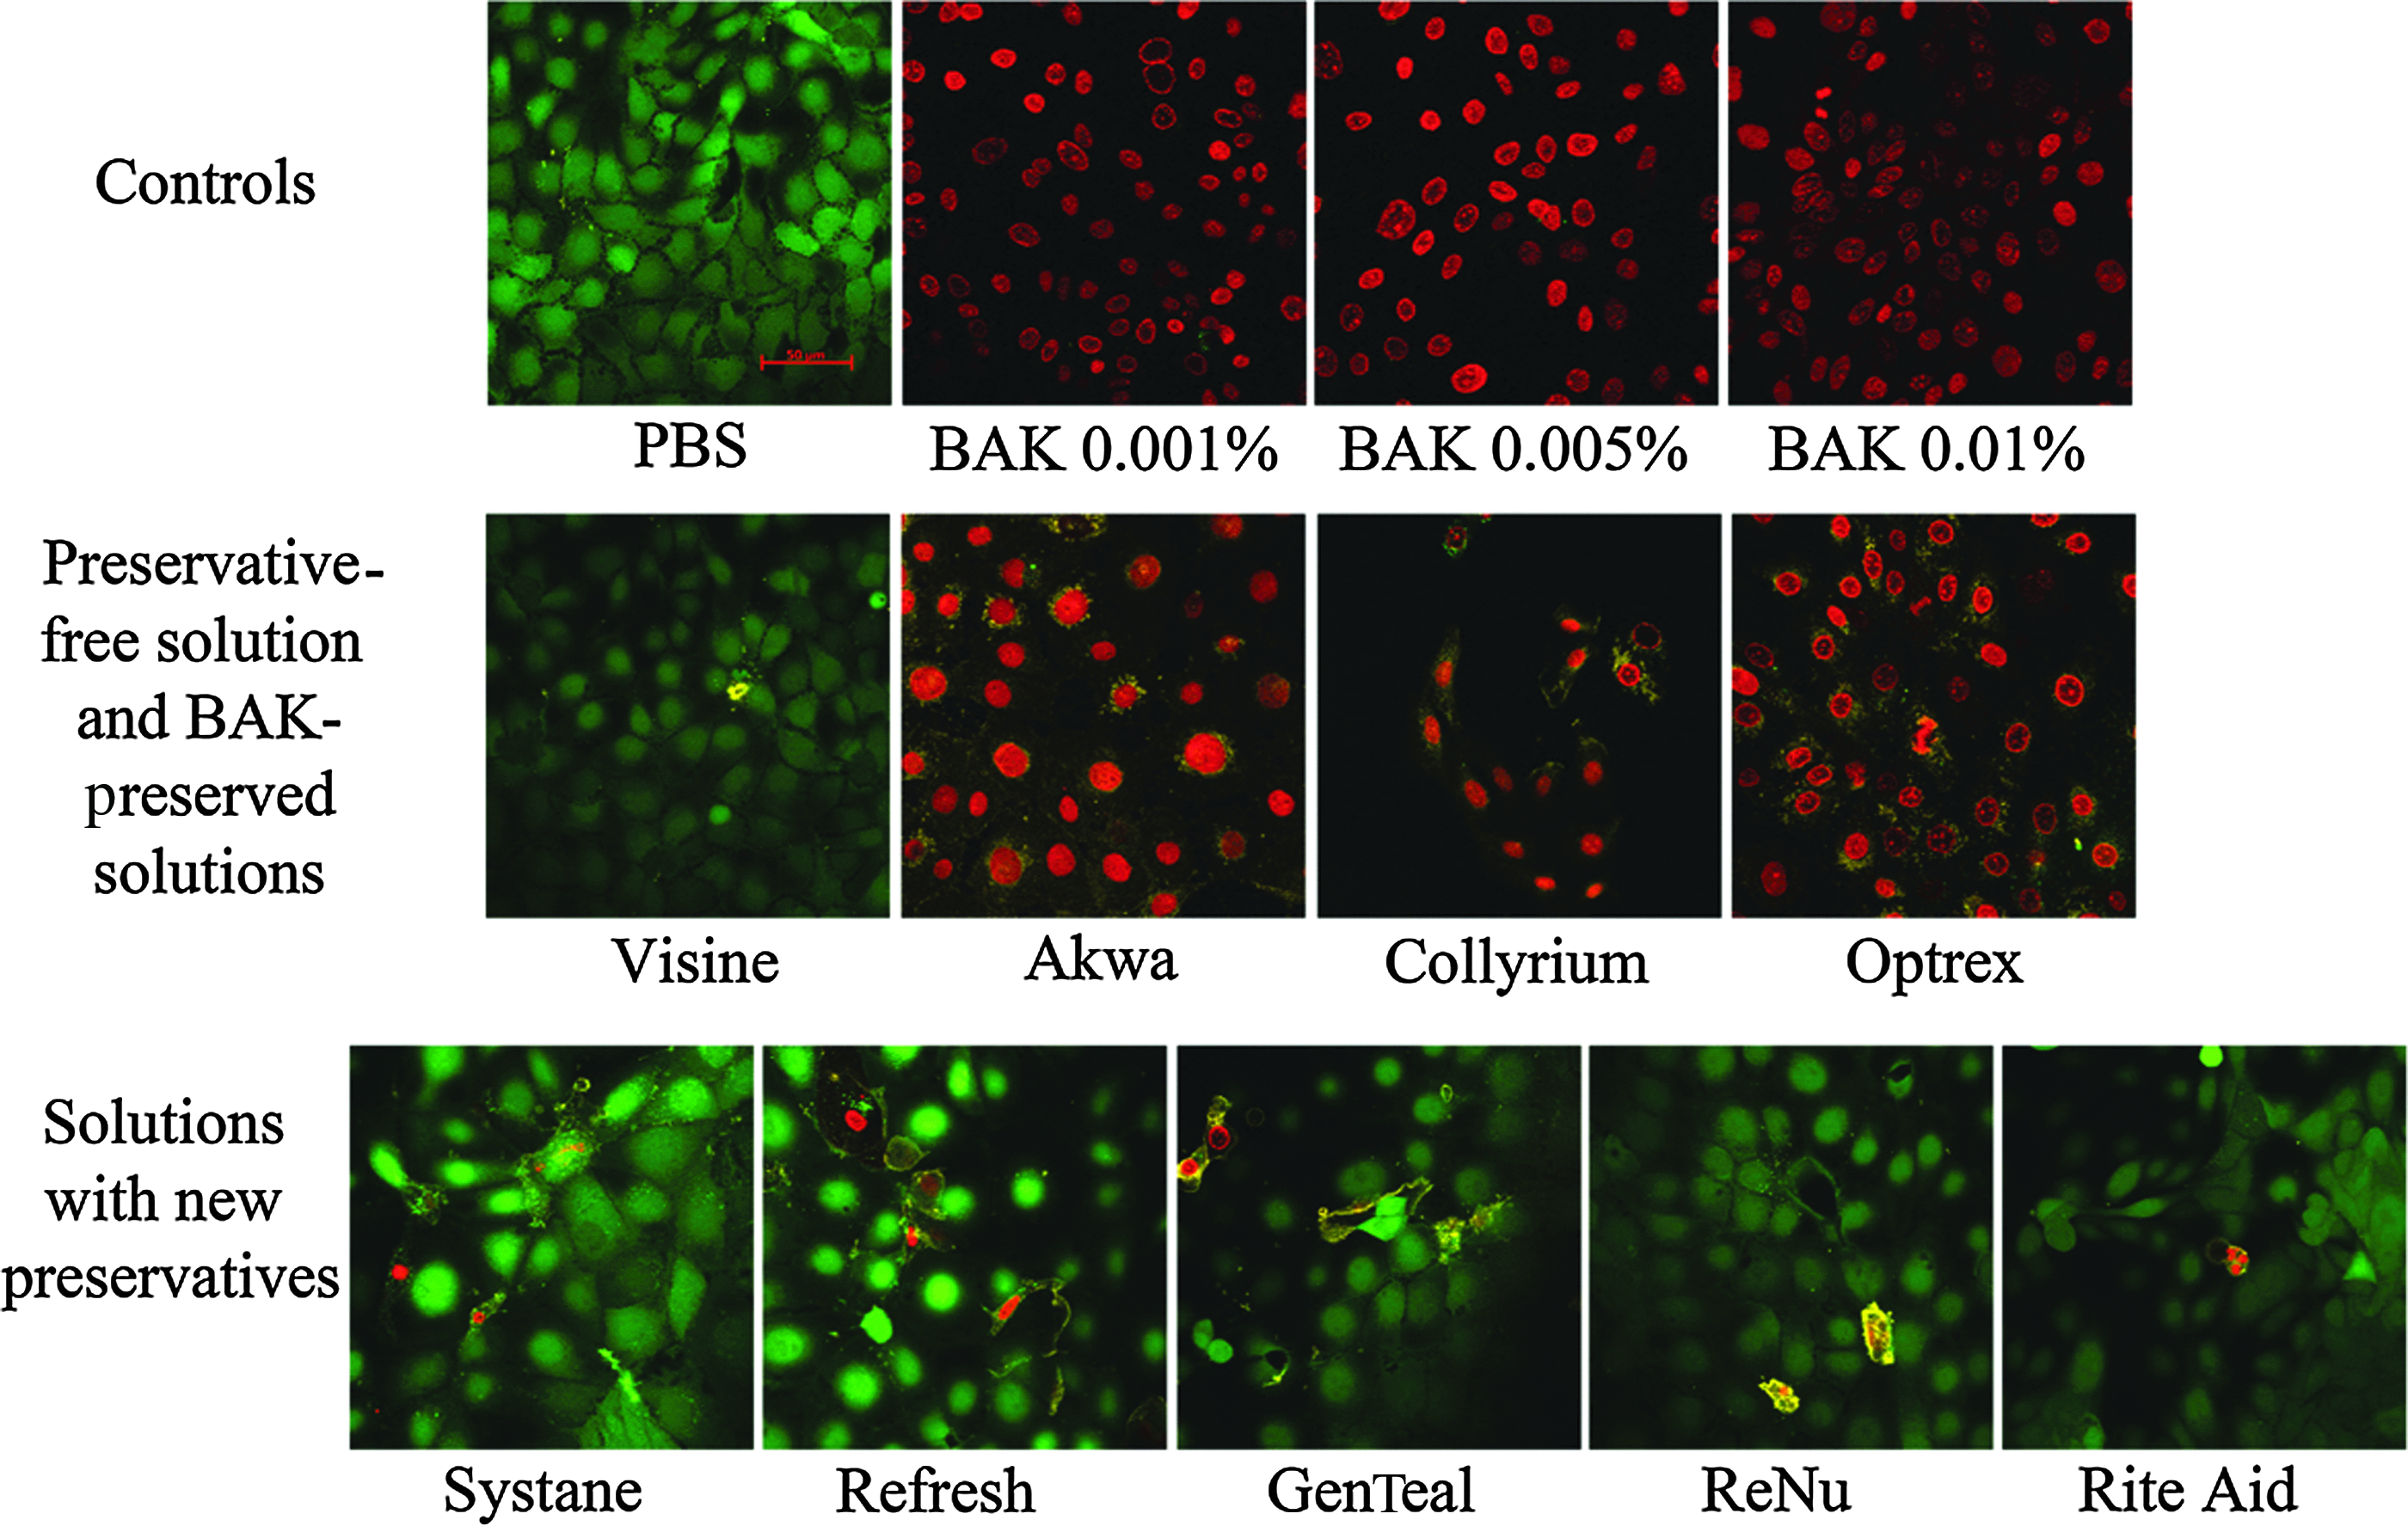
Representative confocal laser scanning micrographs of HCEC at 24 h after a 1-h exposure. The effect of the test solutions is shown on the distributions of live, dead, and apoptotic cells in the culture. Live cells are calcein (green)-positive, annexin V (yellow)-negative, and EthD-1(red)-negative; dead cells are EthD-1 (red)-positive; apoptotic cells are annexin V (yellow)-positive and EthD-1 (red)-negative. In the first row are the controls; in the second row are the preservative-free solutions (Visine) and the BAK-preserved solutions; and in the third row are the solutions that contain new preservatives. Bar=50 μm. All the micrographs use the same magnification. Color images available online at www.liebertpub.com/jop
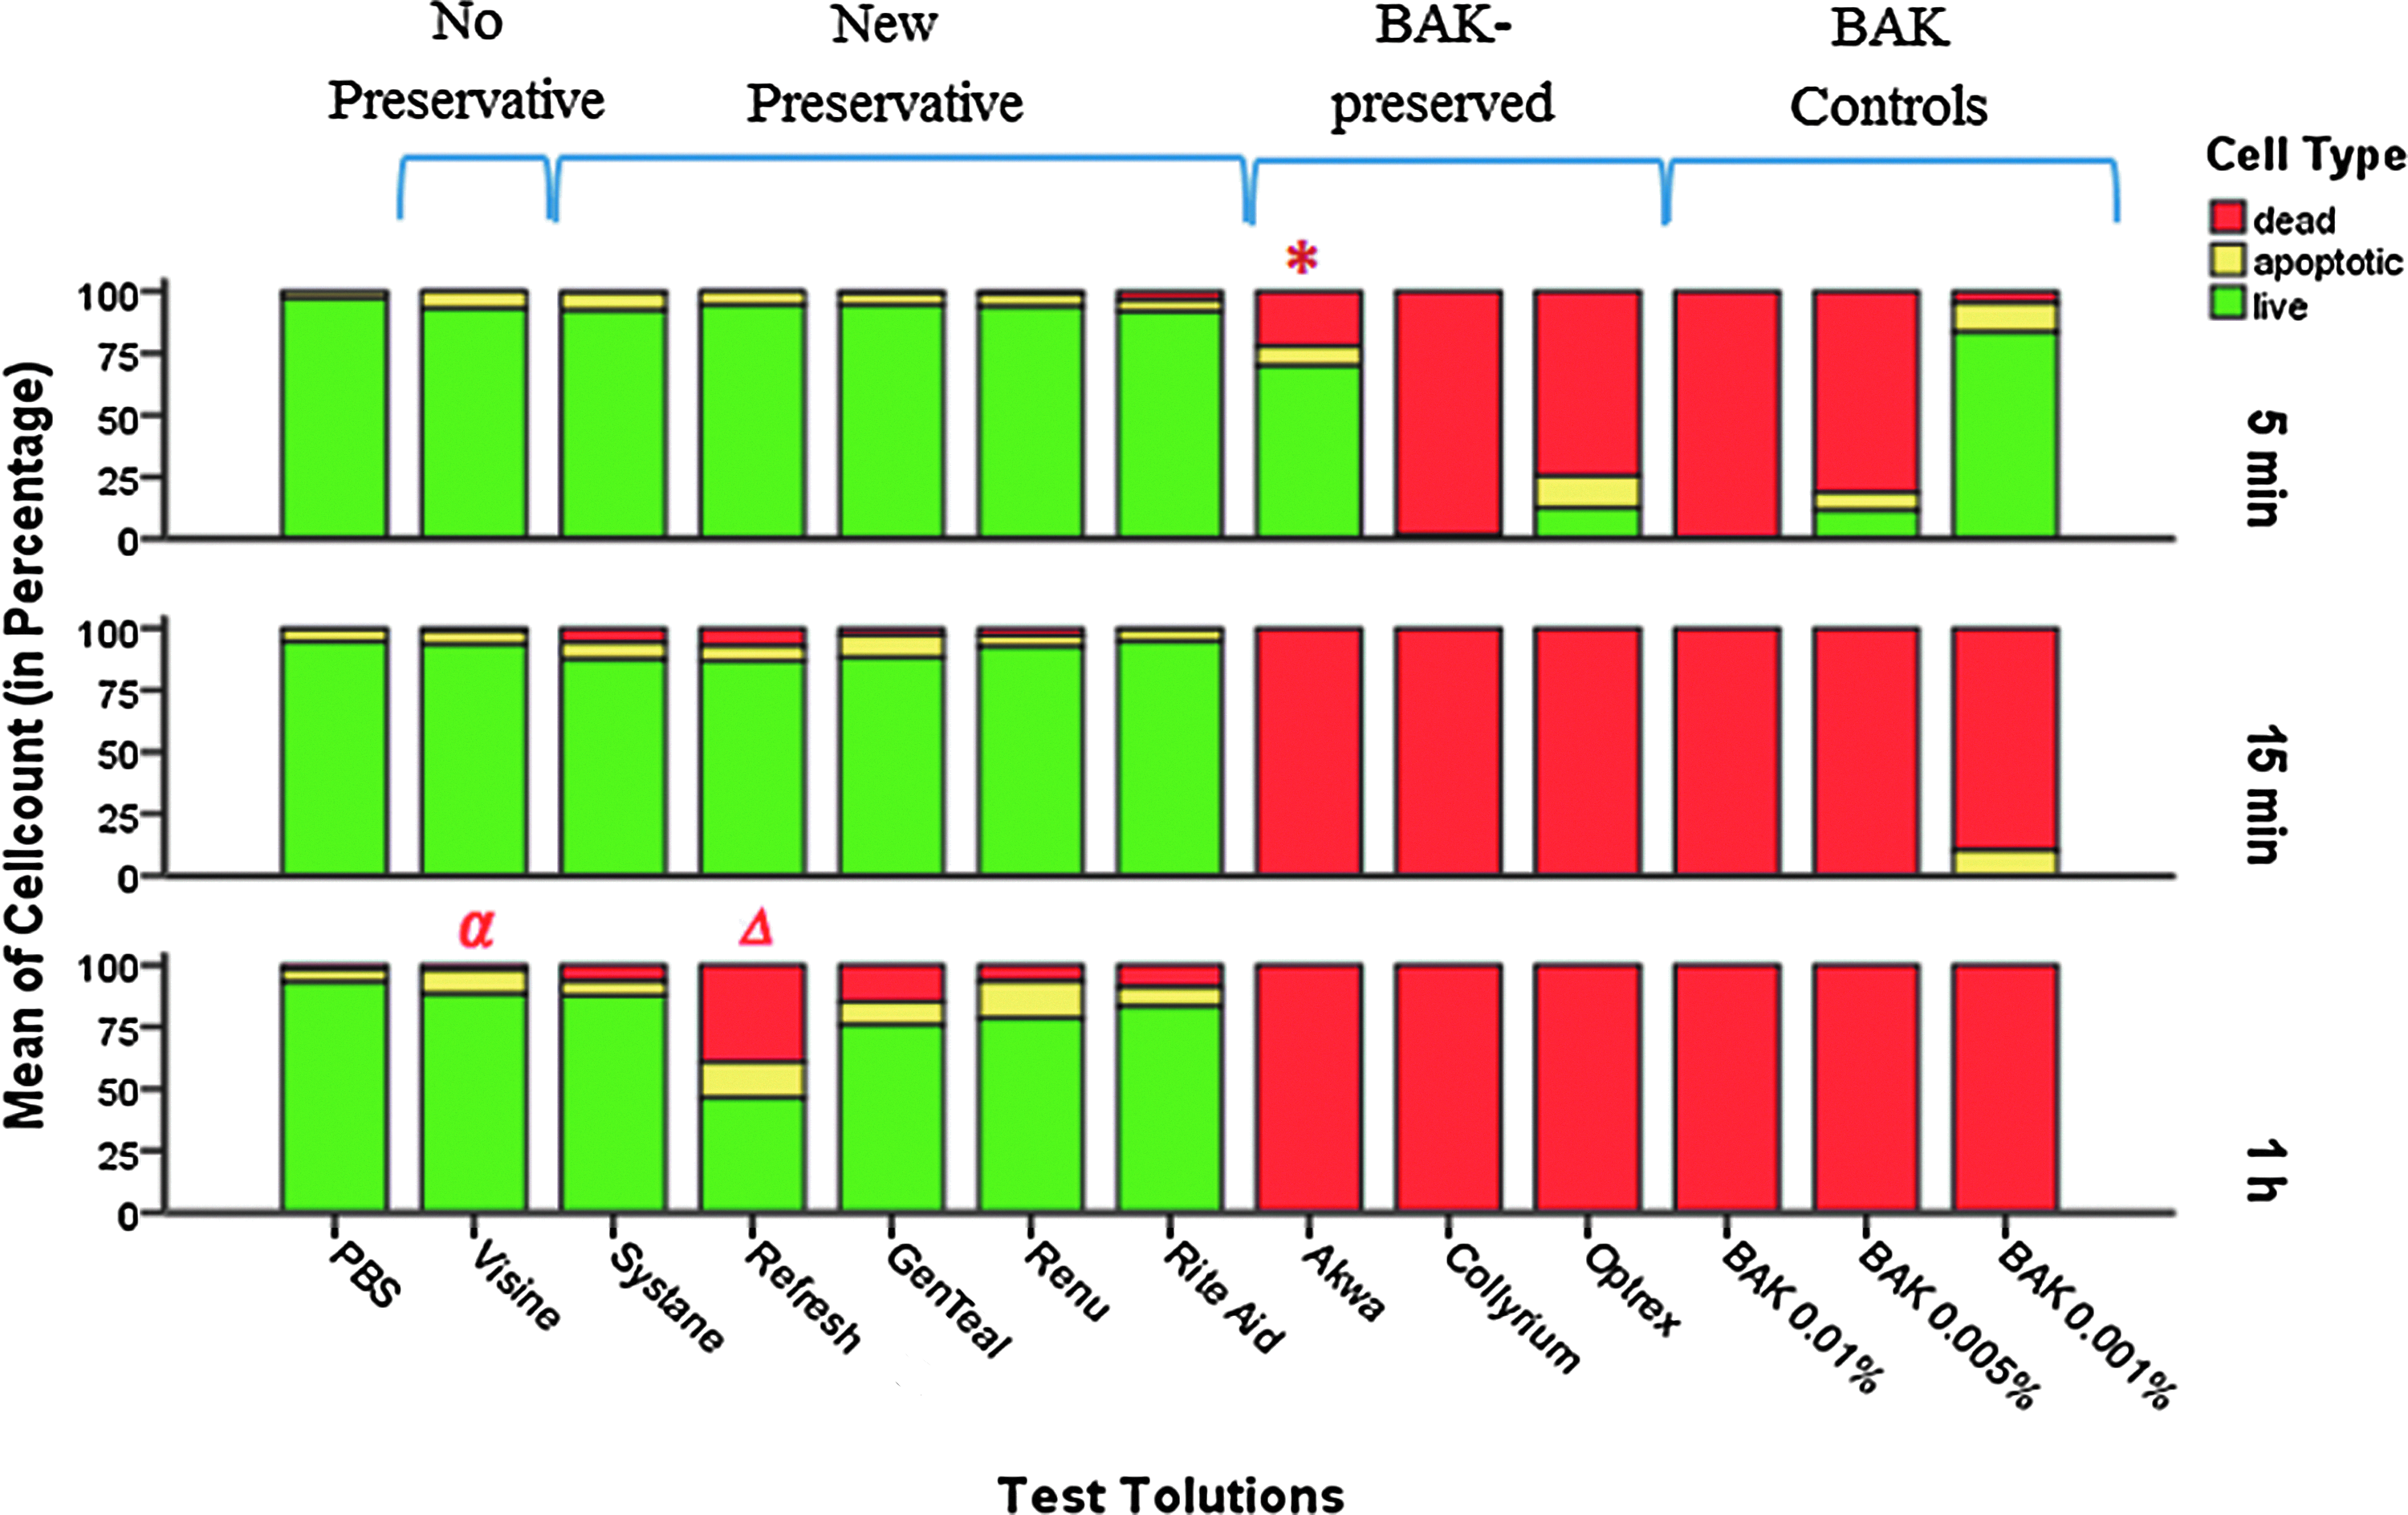
The counts of cells in the confocal laser scanning micrographs. The results are expressed as a percentage of the cells. The percentages of live cells in the BAK-preserved solutions were significantly lower than those in the BAK-free solutions after 5-min, 15-min, and 1-h exposures (P<0.05). *: significantly different from the other BAK-preserved solutions (P<0.05); α: significantly different from the BAK-preserved solutions and the solutions with new preservatives (P<0.05); △: significantly different from all the other solutions with new preservatives (P<0.05). Color images available online at www.liebertpub.com/jop
Assessment of barrier function
The effect of the test solutions on corneal tight junctional integrity was assessed using sodium fluorescein. Figure 6 shows the results for all the test solutions at 24 h after exposure. There was no significant difference in fluorescein permeability between PBS control and BAK-free ophthalmic solutions after 5-min, 15-min, and 1-h exposures. However, BAK-preserved solutions acted differently. Collyrium Eye Wash (contains BAK 0.01%) showed significantly greater fluorescein permeability than all the other products and the PBS control after a 15-min exposure (P<0.013). All BAK-preserved products showed a remarkably greater fluorescein permeability than the PBS control and all the BAK-free products after a 1-h exposure (P<0.001) (Fig. 6).
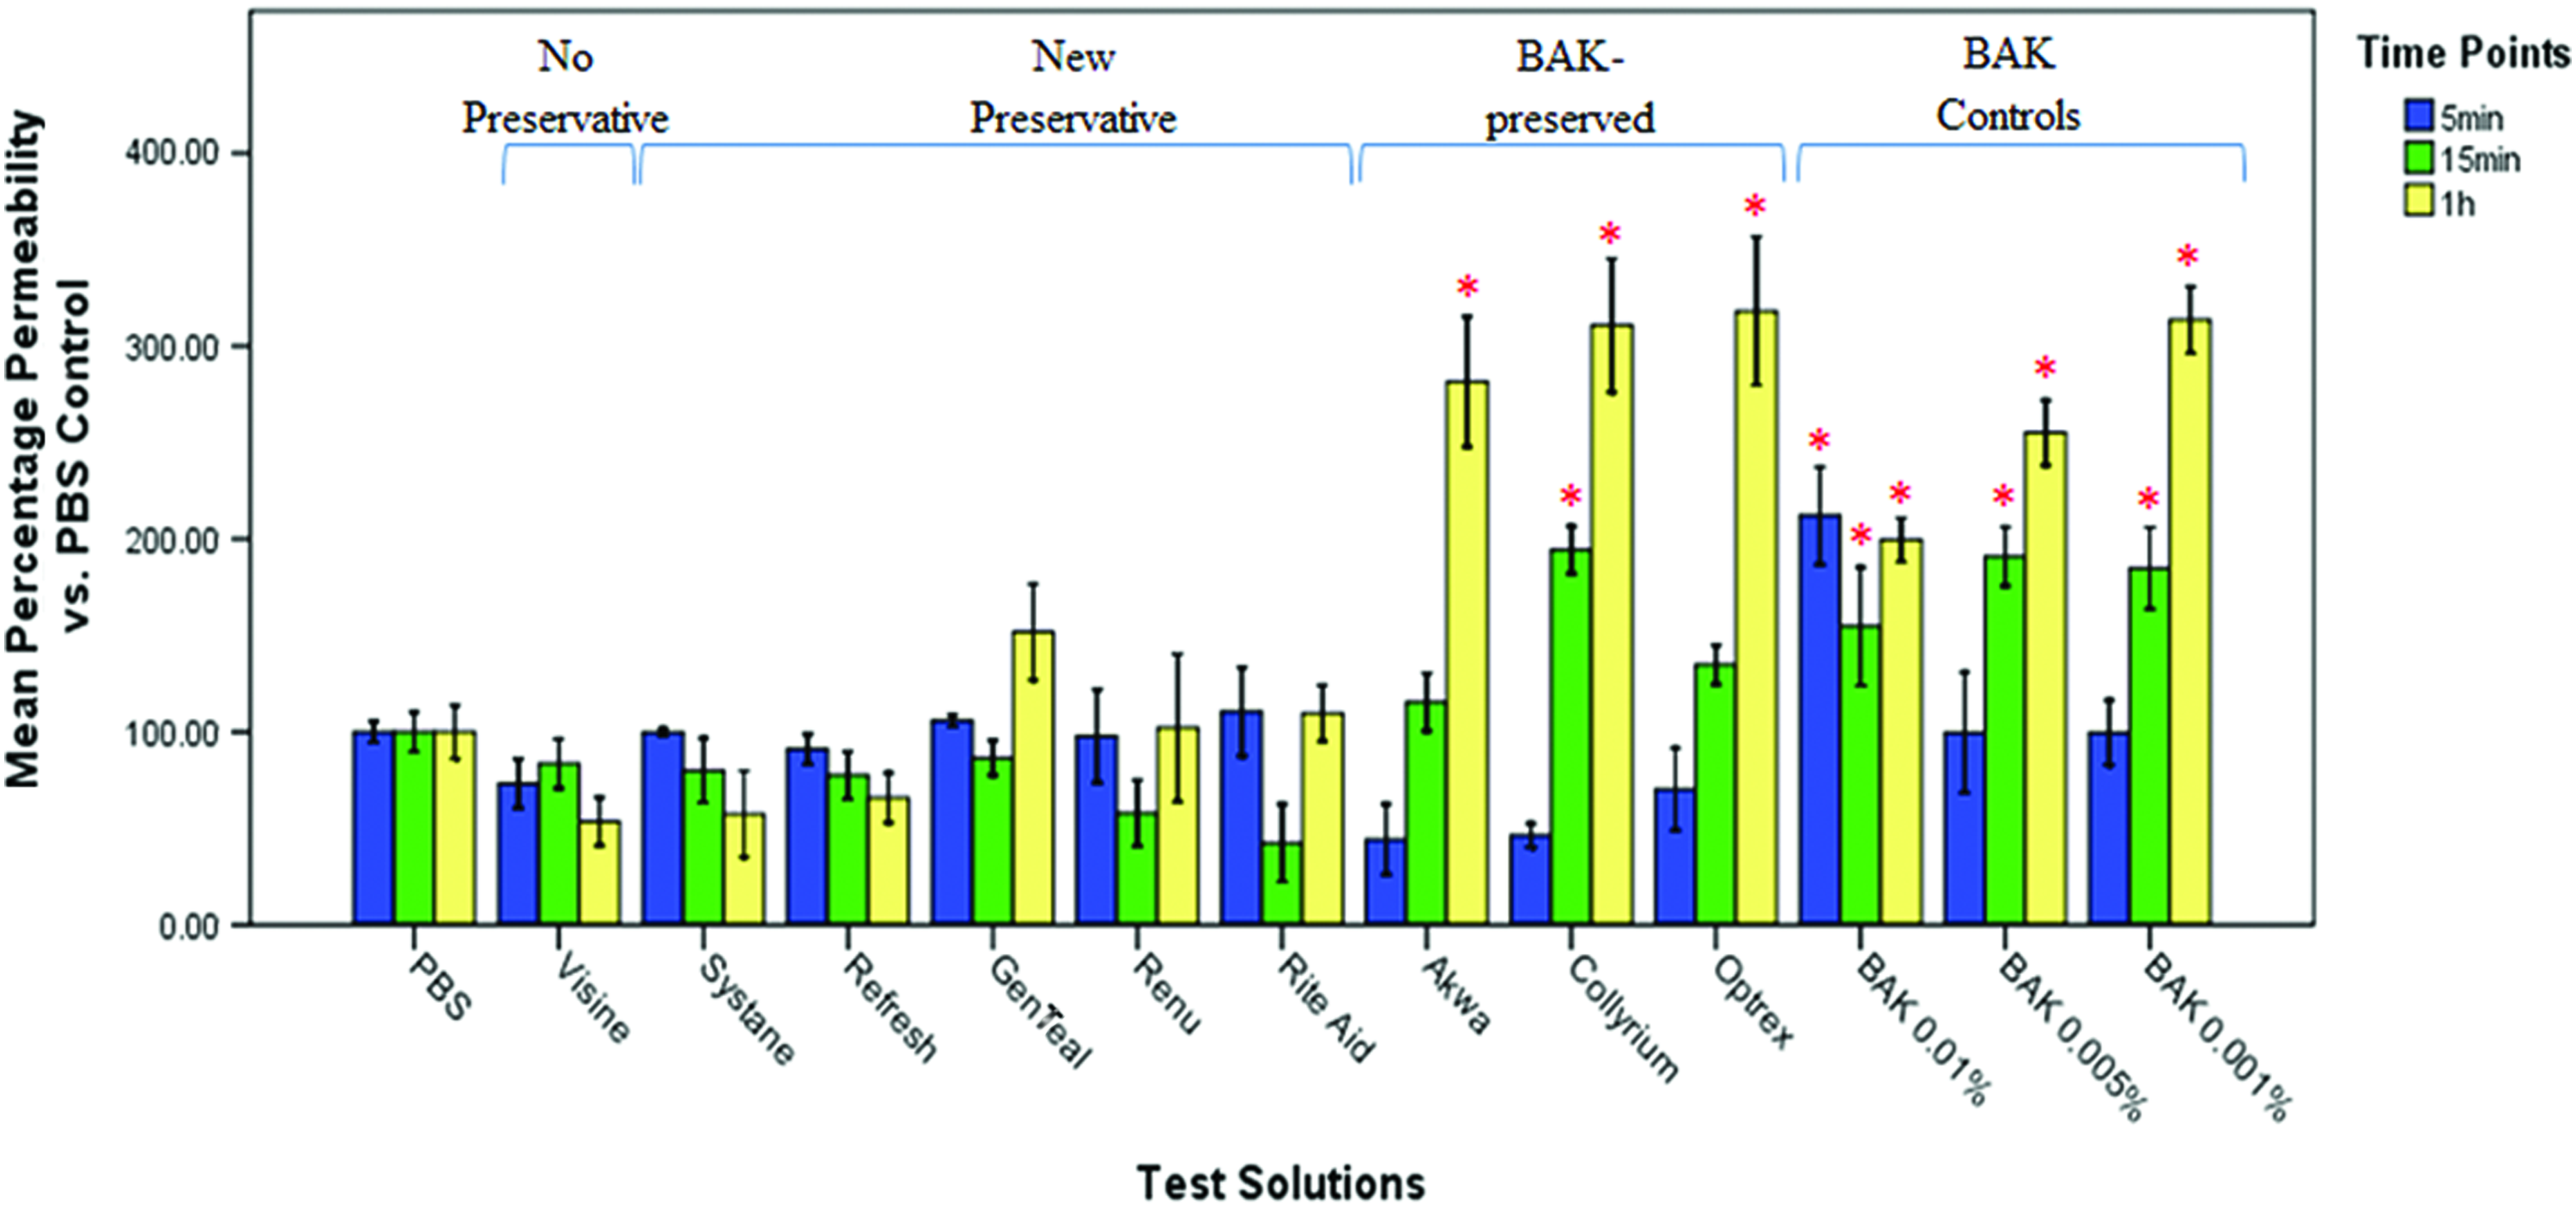
Barrier function of HCEC at 24 h after 5-min, 15-min, and 1-h exposures using the sodium fluorescein permeability measurement. The results are expressed as a percentage of the permeability of the PBS control. The greater percentage of permeability compared to the PBS control represents the more severe loss of integrity of the culture. Significantly greater than PBS control (P<0.05) is indicated by an asterisk (*). Error bars:±SD. Color images available online at www.liebertpub.com/jop
Discussion
The results of this study demonstrate that BAK-preserved solutions had significantly greater adverse effects on cell viability and tight junctions than the eye drops and eye washes that do not contain BAK. The in vitro test battery correlated well with in vivo studies and clinical studies, which showed that BAK-preserved eye drops caused ocular toxicity at 0.01% and 0.005% concentrations,3,5,7–10,12,13,17,25,26 and with in vivo comparison studies showing that the products without preservatives or with newer preservatives caused less damage to the ocular surface than BAK-preserved products.3,17
BAK has been the most commonly used preservative for topical ophthalmic medications used by clinicians. Its use is aimed at preventing contamination of multiple-dose containers. However, BAK does have adverse effects, which may be more apparent under conditions of long-term use. It has been consistently shown to be toxic to ocular tissue in clinical and experimental studies.1,3,7–13,27–34 To develop less toxic alternatives to BAK, new preservatives, such as polyquad, stabilized oxychloro complex (Purite), sodium perborate, and sorbic acid, have been proposed and are commercially available. A few studies have evaluated the cytotoxicity of these new preservatives.3,14,15,17,35 Our results show that the preservatives polyquad, Purite, sodium perborate and sorbic acid did not cause obvious cell toxicity after short exposures (5 and 15 min), and were significantly less toxic than the solutions with BAK, which is consistent with the previous in vivo and clinical studies.3,14,17 Nevertheless, we also found that the solutions with new preservatives had a time-dependent toxicity to cultured HCEC. They caused mild to moderate degrees of toxicity after 1-h exposures. This was not shown in the previous in vivo toxicity or clinical studies. In addition, compared to the products with BAK and new preservatives, the preservative-free solution consistently showed least toxicity in our study and in all the previous studies.7,8,27,34,36,37
AlamarBlue is designed to quantitatively measure the proliferation of various human and animal cell lines. It incorporates a fluorescent growth indicator based on the detection of the metabolic activity. The innate metabolic activity of the viable cells results in a chemical reduction of alamarBlue (also called resazurin), which causes it to change from an oxidized form (nonfluorescent, blue) to a reduced form (fluorescent, red). 38 AlamarBlue is nontoxic to cells. A decrease in the alamarBlue fluorescence readings indicates the decrease of metabolic activity (the viability) of the cultured cells. In the present study, cells exposed to BAK-preserved ophthalmic solutions showed a significant reduction in metabolic activity compared to the PBS-treated control, and the BAK-free solutions (Fig. 1). Preservative-free eye drops caused the least reduction of metabolic activity in the tested ophthalmic solutions. This suggests that among the ophthalmic solutions used in this study, the BAK-preserved solutions are the most, and the preservative-free solution is the least toxic to cultured HCEC. In addition, according to our results, the assessment of metabolic activity of HCEC with alamarBlue is very sensitive to the toxicity of preservatives. It showed remarkable cell toxicity of the BAK-preserved ophthalmic solutions after only a 5-min exposure, and showed the differences between the solutions with and without BAK, as well as with and without preservative after only a 15-min exposure.
Cell viability after exposure was also analyzed in this study using confocal microscopy with fluorescent viability dyes. The dyes are calcein AM, EthD-1, and annexin V for detecting live, dead, and apoptotic cells, respectively. Calcein AM can penetrate live cells. Because of the intracellular esterase activity of the live cells, the nonfluorescent calcein AM is then converted to the intensely fluorescent calcein, which stains the intracellular cytoplasm and produces an intense uniform green fluorescence in live cells. 39 EthD-1 is excluded by the intact plasma membrane of live cells. However, nonfluorescent EthD-1 enters cells with damaged membranes, and binds to the nucleic acids, which enhances the fluorescence and produces a bright red fluorescence in dead cells. 39 Annexin V is a phospholipid-binding protein, which has a high affinity for PS. In normal viable cells, PS is located on the cytoplasmic surface of the cell membrane. However, in apoptotic cells, PS is translocated from the inner to the outer leaflet of the plasma membrane. Annexin V can bind to PS exposed on the outer leaflet, and then the fluorescence can be detected.40,41 Annexin V can also penetrate the compromised membranes of dead cells and stain PS in the interior of the cell. The 3 fluorescent dyes calcein AM, EthD-1, and annexin V can be used together due to the nonoverlapping emission spectra and different binding sites of these molecules. Thus, we can show the distributions of live, dead, and apoptotic cells of the culture in the same micrograph of the culture. In the present study, the results were similar to the alamarBlue study. After a 5-min exposure to the BAK-preserved ophthalmic solutions, the cultures showed an obvious increase of apoptotic cells and dead cells as well as cell loss. On the contrary, the cultures of the BAK-free solutions looked similar to the PBS control after a 5-min exposure (Figs. 2 and 5). As the exposure time increased from 5 min to 1 h, the amount of apoptotic cells and dead cells increased in all the cultures except the PBS controls: the most in the solutions with BAK (100% cell death), and the least in the preservative-free solution (Figs. 3–5). This confirmed the result of the alamarBlue evaluation: BAK-preserved solutions are the most toxic to the cultured HCEC, followed by the solutions with new preservatives, and the preservative-free solution is the least toxic. In addition, the comparison of the cell counts in the confocal micrographs indicated that, among the 3 BAK-preserved solutions, Akaw was the least toxic at a 5-min exposure, and among the 5 solutions with new preservatives, Refresh was the most toxic at a 1-h exposure.
Tight junctions are an important characteristic of a healthy human corneal epithelium. Sodium fluorescein permeability can be used to detect the loss of tight junctions and defects of integrity in the corneal epithelium. It measures sodium fluorescein leakage. The more fluorescein leakage indicates the more loss of tight junctions and the more defects of integrity. This method has been used in many studies to measure damage to corneal tissue.42–45 Our study also used it to detect damage of the barrier function caused by ophthalmic solutions. Again, the BAK-preserved solutions were shown to cause the greatest loss of integrity of the culture, followed by the solutions with new preservatives. The preservative-free solution caused the least damage to the barrier function. This assay was not as sensitive as the alamarBlue assay and confocal microscopy study with fluorescent viability dyes. We did not find a significant difference in fluorescein permeability between PBS control and BAK-free ophthalmic solutions after 5-min, 15-min, and 1-h exposures (Fig. 6). This may be due to the age of the culture (1–2 days for the alamarBlue and confocal microscope study vs. 7 days in the fluorescein permeability assessment). In addition, because the cells in the fluorescein permeability assessment were grown for 7 days, the cells may have been more tightly opposed to each other, and therefore the surface area exposed to the chemical was less than the other 2 studies, where the cells were not as dense.
In order to see the potential toxicity of all the test solutions, we use 3 different time points. In our results, the difference between the solutions with and without BAK was shown after a 5-min exposure in the metabolic assay and confocal microscopy study with fluorescent viability dyes (Figs. 1, 2, and 5); and after a 1-h exposure in the measurement of barrier function (Fig. 6). The difference between the preservative-free product and those with new preservatives was shown after a 15-min exposure in the metabolic assay (Fig. 1) and after a 1-h exposure in the confocal microscopy study with fluorescent viability dyes (Figs. 4 and 5), but was not shown in the measurement of barrier function. The dis-concordance among the metabolic assay, confocal microscopy study, and measurement of barrier function indicates that the toxicity, which causes a reduction in the cell metabolic activity may not cause cell death; and the effect on cell viability may not cause the disruption of tight junctions at low toxicity levels. Therefore, to have a better understanding and obtain a better assessment of the toxicity of an agent, we need to combine several assays together, and analyze the toxic effect from different aspects.
One limitation of this study is that we evaluated the toxic effect of whole commercial ophthalmic solutions instead of their components. Typical formulations contain active components and additives such as preservatives and buffers. We could not identify the individual effects of the components in this study. We know the toxicity is mainly caused by the preservative, but the other components may increase or decrease the effect. Further investigations of individual components are necessary to fully understand the toxicity of the ophthalmic solutions.
Dry eye is a common disease that affects a patient's quality of life and may require long-term treatment with eye drops. BAK in eye drops may aggravate dry eye disease. It has been shown that BAK can cause goblet cell loss, meibomian gland disruption, and tear film instability.7,26 Symptoms of BAK toxicity that include irritation, dry eye, foreign body sensations, and blurred vision have been shown to decrease significantly by switching from a BAK-preserved formulation to a preservative-free one.7,8,37 Due to the increased sensitivity of corneal epithelial cells in dry eye patients from the reduced flow of tears, preservatives such as BAK in eye drops may present a considerable problem for long-term use by patients with dry eyes. We recommend that clinicians consider solutions without preservatives, or at least without BAK, especially for the patients who have compromised ocular surface, where damage of the corneal epithelium by preservatives is suspected. Because of single-dose packaging, it may be costly to use preservative-free ophthalmic solutions. However, it will provide significant benefits to patients, especially those with a compromised ocular surface and a need for the long-term use of topical medications.
In summary, the present study clearly revealed that the tested commercial ophthalmic solutions are less cytotoxic with new preservatives than with BAK, and without preservative than with new preservatives. Our study suggests that BAK-free and preservative-free ophthalmic solutions are safer alternatives to BAK-preserved ones. The results of this study also demonstrated that cytotoxicity of the ophthalmic solutions can be evaluated using cultured HCEC with 3 different assays: the metabolic assay using alamarBlue, confocal microscope study with fluorescent viability dyes, and measurement of barrier function using sodium fluorescein.
Footnotes
Acknowledgments
This study was funded by the Natural Sciences and Engineering Research Council of Canada (NSERC).
Author Disclosure Statement
No competing financial interests exist.