
Abstract
Abstract
Purpose:
To assess the usefulness of 0.0015% tafluprost and 0.5% timolol fixed-dose combination (TT-FDC) for glaucoma, the ocular hypotensive effect of TT-FDC and concentration of tafluprost and timolol in the aqueous humor were compared with those of the concomitant administration of 0.0015% tafluprost and 0.5% timolol with or without an appropriate administration interval.
Methods:
The ocular hypotensive effect was assessed by intraocular pressure (IOP) measurement in cynomolgus monkeys. Drug penetration into the aqueous humor was estimated by the concentrations of tafluprost acid (active metabolic form of tafluprost) and timolol, which were measured using liquid chromatography-tandem mass spectrometry after administration of tafluprost and timolol to Sprague Dawley rats.
Results:
The ocular hypotensive effect of TT-FDC was equivalent to that of the concomitant administration of timolol and tafluprost at a more than 5-min interval in monkeys. However, the ocular hypotensive effect of the concomitant administration of timolol and tafluprost without an interval (−2.8 ± 0.2 mmHg at peak IOP reduction) was significantly weaker compared with TT-FDC (−4.3 ± 0.5 mmHg at peak IOP reduction, P = 0.008 vs. concomitant administration of timolol and tafluprost) in monkeys. The aqueous humor concentration of the second administered drug (tafluprost) was not affected by the dosing conditions, whereas the concentration of the first instilled drug (timolol) without the interval was lower than that with a 5-min interval (1,200 ng · h/mL vs. 1,890 ng · h/mL in AUC0–4) in rats.
Conclusion:
TT-FDC demonstrates a clear benefit by preventing efficacy loss without an appropriate interval in experimental animal models.
Introduction
G
Glaucoma patients are initially treated with monotherapy such as prostaglandin analogs to reduce their IOP. However, when monotherapy is ineffective in reducing IOP, switching the drug is advocated. In contrast, when the patients are partially responsive, the Japan Glaucoma Society Guidelines for Glaucoma recommend the addition of a second agent. 5 Therefore, it is common for patients to use multiple ocular hypotensive agents to control their IOP. In fact, more than 40% of patients use more than one agent for glaucoma therapy.6–9
However, it has been reported that adding a second drug increases the complexity of the treatment regimen and the dosing error.10,11 In addition, it has been recommended that patients taking 2 medications at the same time of the day should separate their instillation by at least 5–10 min to avoid diluting and/or washing each other from the cul-de-sac. 12 This has also caused some level of inconvenience to patients; therefore, many patients take 2 medications without a time interval. 13 This approach has raised concerns regarding a reduction in the pharmacological effects of the instilled drugs.
Therefore, a reduction in the dosing frequency has been recommended, 14 and the use of a fixed-combination drug to prevent further deterioration in patient compliance. For these reasons, the fixed-combination drug that consists of a prostaglandin analog (administered once a day) and a beta-adrenergic antagonist (administered once or twice daily), which are the most common medications used in combination for the treatment of glaucoma,6,7,9 was developed.
Recently, 0.0015% tafluprost and 0.5% timolol fixed-dose combination (TT-FDC) preserved with low-concentration benzalkonium chloride (BAK)15,16 and preservative-free TT-FDC,17,18 new prostaglandin analogs, and beta-adrenergic antagonist FDCs were launched, and they were expected new choices for glaucoma treatment.
The purpose of the present study is to determine the usefulness of TT-FDC, which was administered once daily. We compared the ocular hypotensive effects of TT-FDC, preserved with low-concentration BAK, and the concomitant administration of the active components in monkeys using an interval of at least 5 min. We also assessed the ocular hypotensive effect of concomitantly administered timolol, preserved with 50 ppm BAK, and tafluprost, preserved with low-concentration BAK, without a time interval to examine the effect of patient compliance. We used a pharmacokinetic methodology to clarify the cause of efficacy change induced by concomitantly administered timolol and tafluprost using different time intervals, and we discussed the advantage of the drug penetration of a fixed-combination drug into the aqueous humor.
Methods
Drugs
TAPROS® ophthalmic solution 0.0015% (0.0015% tafluprost) preserved with low-concentration BAK, Timoptol® ophthalmic solution 0.5% (0.5% timolol) preserved with 50 ppm BAK, FDC of 0.0015% tafluprost and 0.5% timolol (TT-FDC) preserved with low-concentration BAK, and the vehicle of TT-FDC (Vehicle) were supplied by the Santen Pharmaceutical Co., Ltd. (Osaka, Japan).
Animals
Female Sprague Dawley rats (Charles River Laboratories Japan, Inc., Yokohama, Japan) weighing 143–173 g and male cynomolgus monkeys (Keari Co., Ltd., Osaka, Japan, and Shin Nippon Biomedical Laboratories, Ltd., Tokyo, Japan) weighing 5.8–10.1 kg were used in this study. These animals were housed under a 12-h light–12-h dark cycle. All animal care and experimental procedures were in accordance with the ARVO Statement for the Use of Animals in Ophthalmic and Vision Research and were approved and monitored by the Animal Care and Use Committee of Santen Pharmaceutical Co., Ltd.
IOP measurement
Ocular, normotensive male cynomolgus monkeys were included in all studies.
Before the experiment, all monkeys were trained for restraint in a monkey chair (CL-4535; Primate Products, Miami, FL) and for IOP measurements without any general anesthesia or sedation. For IOP measurements, each monkey was kept in a sitting position in the monkey chair, and IOP was measured with a pneumatonograph (Model 30 Classic™ Pneumatonometer; Reichert Technologies, Depew, NY) in a light phase. For local corneal anesthesia, 0.4% oxybuprocaine solution (Benoxil® ophthalmic solution 0.4%; Santen Pharmaceutical Co., Ltd.) was topically applied before IOP measurement.
In all IOP measurement experiments, none of the operators (1 person measuring monkey IOP and 1 person recording IOP measurement data) administered ophthalmic solutions to the animals. The operators were blinded to the bottles and labels of the 3 types of ophthalmic solution during this experiment.
Ocular hypotensive effect of TT-FDC versus single agent containing individual active ingredient
Twelve ocular normotensive male cynomolgus monkeys were used. These animals were assigned to 1 of 4 groups in such a way that the IOP values just before the initiation of this experiment were approximately the same among the 4 groups. A crossover design was applied to this study; each animal thus contributed to all groups (Table 1A).
(A) For the evaluation of the ocular hypotensive effect of TT-FDC versus single agent containing individual active ingredient. We conducted IOP study (3 animals/group) repeated 4 times. (B) For the evaluation of the ocular hypotensive effect of TT-FDC versus the concomitant administration of 0.5% timolol and 0.0015% tafluprost. We conducted IOP study (4 animals/group) repeated thrice. In both (A and B) experiments, 12 animals were assigned in each group. Monkeys were used at 7 days or more after last drug dosing in each turn, when the effects of last administered drugs were thought to disappear.
TT-FDC, 0.0015% tafluprost, and 0.5% timolol fixed-dose combination; IOP, intraocular pressure.
In 4 groups, 20 μL of 0.5% timolol, 0.0015% tafluprost, TT-FDC, or Vehicle was applied to 1 eye (right eye) between 9 AM and 11 AM in each monkey, with the contralateral eye remaining untreated. IOP was measured just before and 2, 4, 6, and 8 h after drug administration.
Ocular hypotensive effect of TT-FDC versus the concomitant administration of 0.5% timolol and 0.0015% tafluprost
For all studies 12 ocular, normotensive male cynomolgus monkeys were used, and these animals were assigned to 1 of 3 groups in such a way that the IOP values just before the initiation of this experiment were approximately the same among the 3 groups. A crossover design was applied to these studies; each animal thus contributed to all groups (Table 1B).
In all studies, the administration of TT-FDC (20 μL), administration of Vehicle (20 μL), or concomitant administration of 0.5% timolol (20 μL) and 0.0015% tafluprost (20 μL) to the right eye of each monkey were performed between 9 AM and 11 AM, with the contralateral eye remaining untreated.
For the concomitant administration in the succession study, timolol was administered first, followed by tafluprost. A few persons performed the administrations, administering 2 ophthalmic solutions within 10 s. In the study involving concomitant administration at intervals of more than 5 min, timolol was administered first, followed by tafluprost. A few persons performed the administration work and they administered 2 ophthalmic solutions with more than 5 min but less than 10-min intervals.
Distribution to the aqueous humor following the concomitant administration of 0.5% timolol and 0.0015% tafluprost
Thirty-six female rats were used for the ocular distribution study of the concomitant administration of 0.5% timolol and 0.0015% tafluprost. For the in succession group, 0.0015% tafluprost (5 μL) was administered after 0.5% timolol (5 μL) administration to both eyes. A few persons performed the administration work and they administered 2 ophthalmic solutions within 10 s. For the 5-min interval group, 0.0015% tafluprost (5 μL) was administered 5 min after 0.5% timolol (5 μL) instillation to both eyes. In both groups, aqueous humor was collected from the rats 7, 15, and 30 min and 1, 2, and 4 h after timolol (the first administered drug) administration (n = 6 eyes per time point). Tafluprost acid (active form of tafluprost) and timolol in the collected aqueous humor were quantified by liquid chromatography (Agilent 1100; Agilent Technologies, Inc., Santa Clara, CA) coupled with a tandem mass spectrometer (API5000; AB Sciex, Framingham, MA).
Maximum concentrations of tafluprost acid and timolol in the aqueous humor (Cmax) were obtained from the mean concentrations. Areas under the time-aqueous humor concentration curves up to 4 h postdose (AUC0–4 values) were calculated from the mean concentrations using the linear trapezoidal method. These parameters were determined using noncompartmental pharmacokinetic analysis (Phoenix WinNonlin Version 6.1; Pharsight Co., St. Louis, MO).
Statistical analyses
For the IOP study, changes in the IOP values at each time point and the maximal IOP reduction values were used for statistical analysis. For the ocular distribution study, aqueous humor concentrations of timolol at each time point were used for statistical analysis.
To confirm the ocular hypotensive effect of the drug solution, we compared the drug-treated and Vehicle-treated group using the F-test for equality of variance. When P > 0.05 was obtained, we compared the 2 groups using the Student's t-test, whereas when P ≤ 0.05 was obtained, we compared them using the Aspin–Welch's t-test.
To compare the ocular hypotensive effect between drug-treated groups, the F-test was used. When P > 0.05 was obtained, we compared the 2 groups using the Student's t-test, whereas when P ≤ 0.05 was obtained, we compared these using the Aspin–Welch's t-test.
To compare the aqueous humor concentrations of timolol, we compared in succession and 5 min interval group using the F-test for equality of variance. When P > 0.05 was obtained, we compared the 2 groups using the Student's t-test, whereas when P ≤ 0.05 was obtained, we compared these using the Aspin–Welch t-test.
Values of P ≤ 0.05 were considered to be statistically significant in all statistical analyses.
Results
Ocular hypotensive effect of TT-FDC versus single agent
Figure 1 shows the IOP changes induced by the topical administration of Vehicle, 0.5% timolol, 0.0015% tafluprost, and TT-FDC in ocular normotensive monkeys.
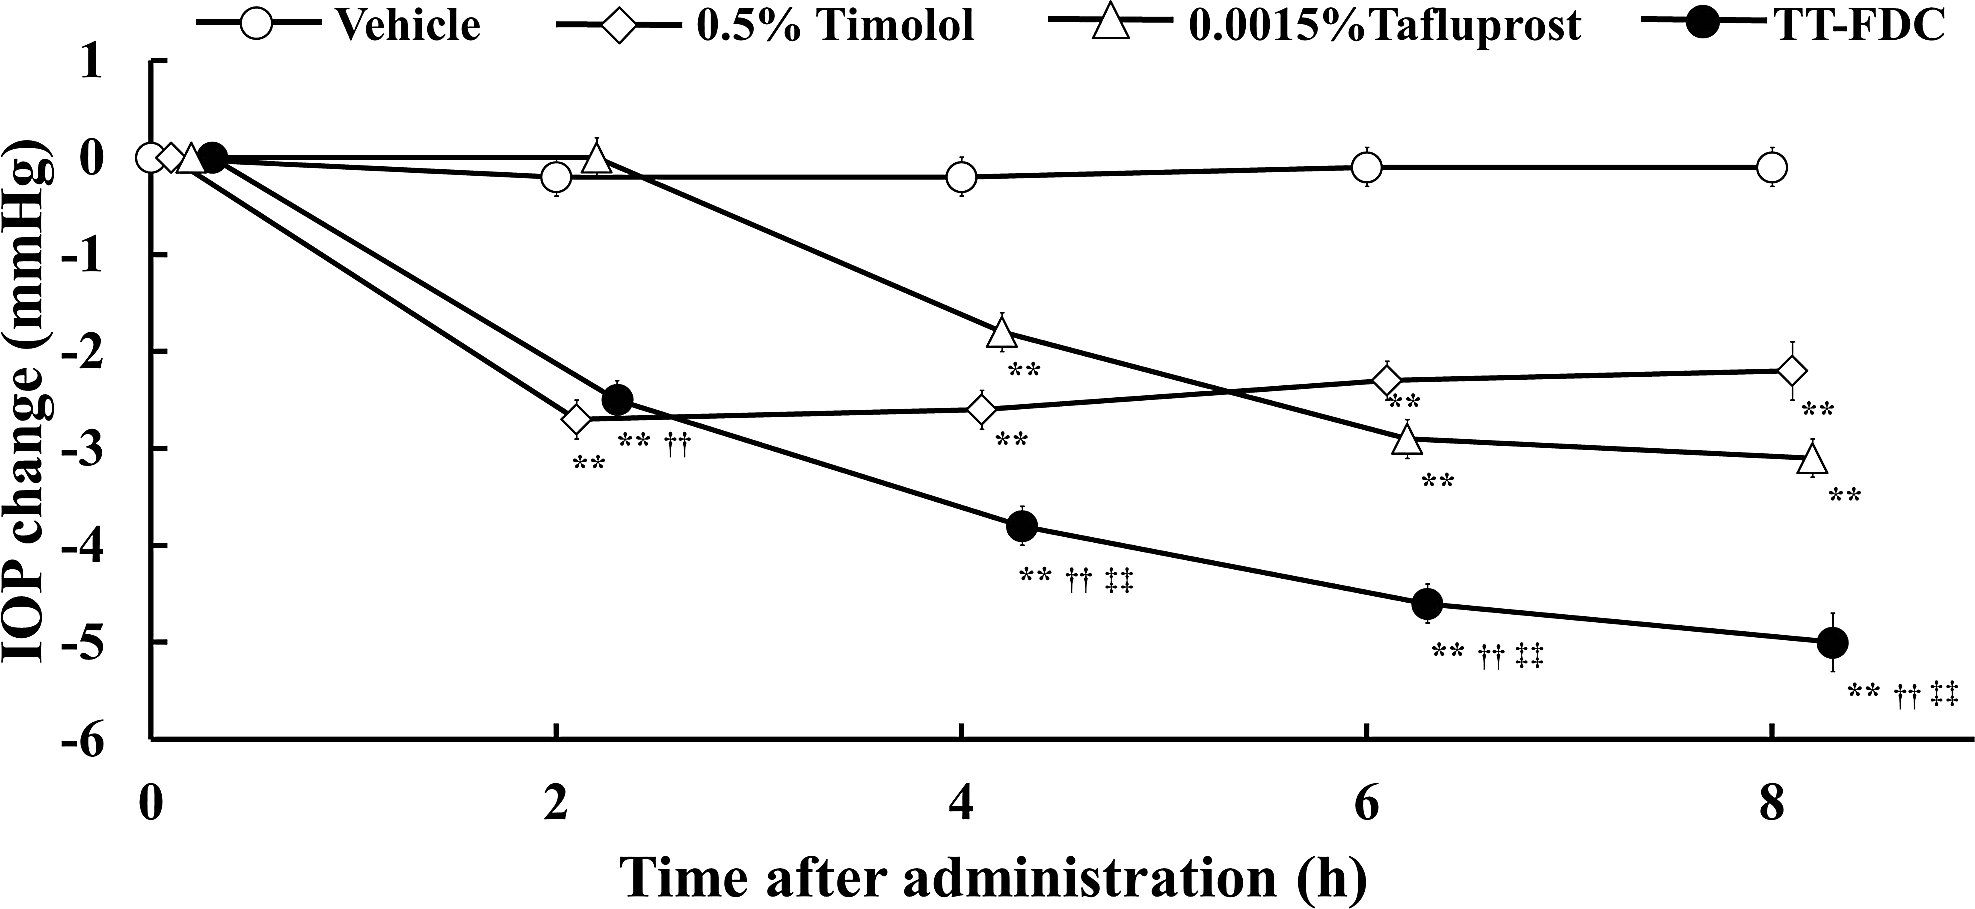
Comparative effects of topical administration of timolol, tafluprost, and 0.0015% tafluprost and 0.5% timolol fixed-dose combination (TT-FDC) on intraocular pressure (IOP) in ocular normotensive monkeys. Vehicle (vehicle of TT-FDC 20 μL), 0.5% timolol (20 μL), 0.0015% tafluprost (20 μL), or TT-FDC (20 μL) was topically administered to the right eyes. The left eyes remained untreated. IOPs were measured with a pneumatic tonometer. IOP changes were calculated as the difference from their predosing IOP values at the 0-h time point. Data represent the mean IOP change ± standard error of the mean (SEM) of 12 eyes. **P < 0.01 versus Vehicle by the Student's t-test. ††P < 0.01 versus 0.0015% tafluprost by the Student's t-test. ‡‡P < 0.01 versus 0.5% timolol by the Student's t-test.
The IOP value at the 0-h time point (just before administration) of the Vehicle group was 18.4 ± 0.6 mmHg, of the 0.5% timolol group was 18.3 ± 0.6 mmHg, of the 0.0015% tafluprost group was 18.4 ± 0.6 mmHg, and of the TT-FDC group was 18.5 ± 0.6 mmHg [mean ± standard error of the mean (SEM)]. No statistically significant differences among these initial IOP values were observed using the Tukey multiple comparison test.
In the analysis of the IOP change, TT-FDC significantly lowered IOP by − 2.5 ± 0.2 mmHg, −3.8 ± 0.2 mmHg, −4.6 ± 0.2 mmHg, and − 5.0 ± 0.3 mmHg at 2, 4, 6, and 8 h after the administration, respectively. Tafluprost also significantly lowered IOP by −1.8 ± 0.2 mmHg, −2.9 ± 0.2 mmHg, and −3.1 ± 0.2 mmHg at 4, 6, and 8 h after the administration, respectively. Likewise, timolol significantly lowered IOP by −2.7 ± 0.2 mmHg, −2.6 ± 0.2 mmHg, −2.3 ± 0.2 mmHg, and −2.2 ± 0.3 mmHg at 2, 4, 6, and 8 h after the administration, respectively. TT-FDC induced a significantly greater IOP reduction than 0.5% timolol and 0.0015% tafluprost at 4–8 h after the administration (P ≤ 0.001 at 4–8 h for both drugs) (Fig. 1).
Figure 2 shows the maximal IOP reductions induced by the topical administration of Vehicle, 0.5% timolol, 0.0015% tafluprost, and TT-FDC in ocular normotensive monkeys. The maximal IOP reduction of the Vehicle group, the 0.5% timolol group, the 0.0015% tafluprost group, and the TT-FDC group was 0.7 ± 0.1 mmHg, 2.9 ± 0.2 mmHg, 3.2 ± 0.2 mmHg, and 5.1 ± 0.3 mmHg (mean ± SEM), respectively.
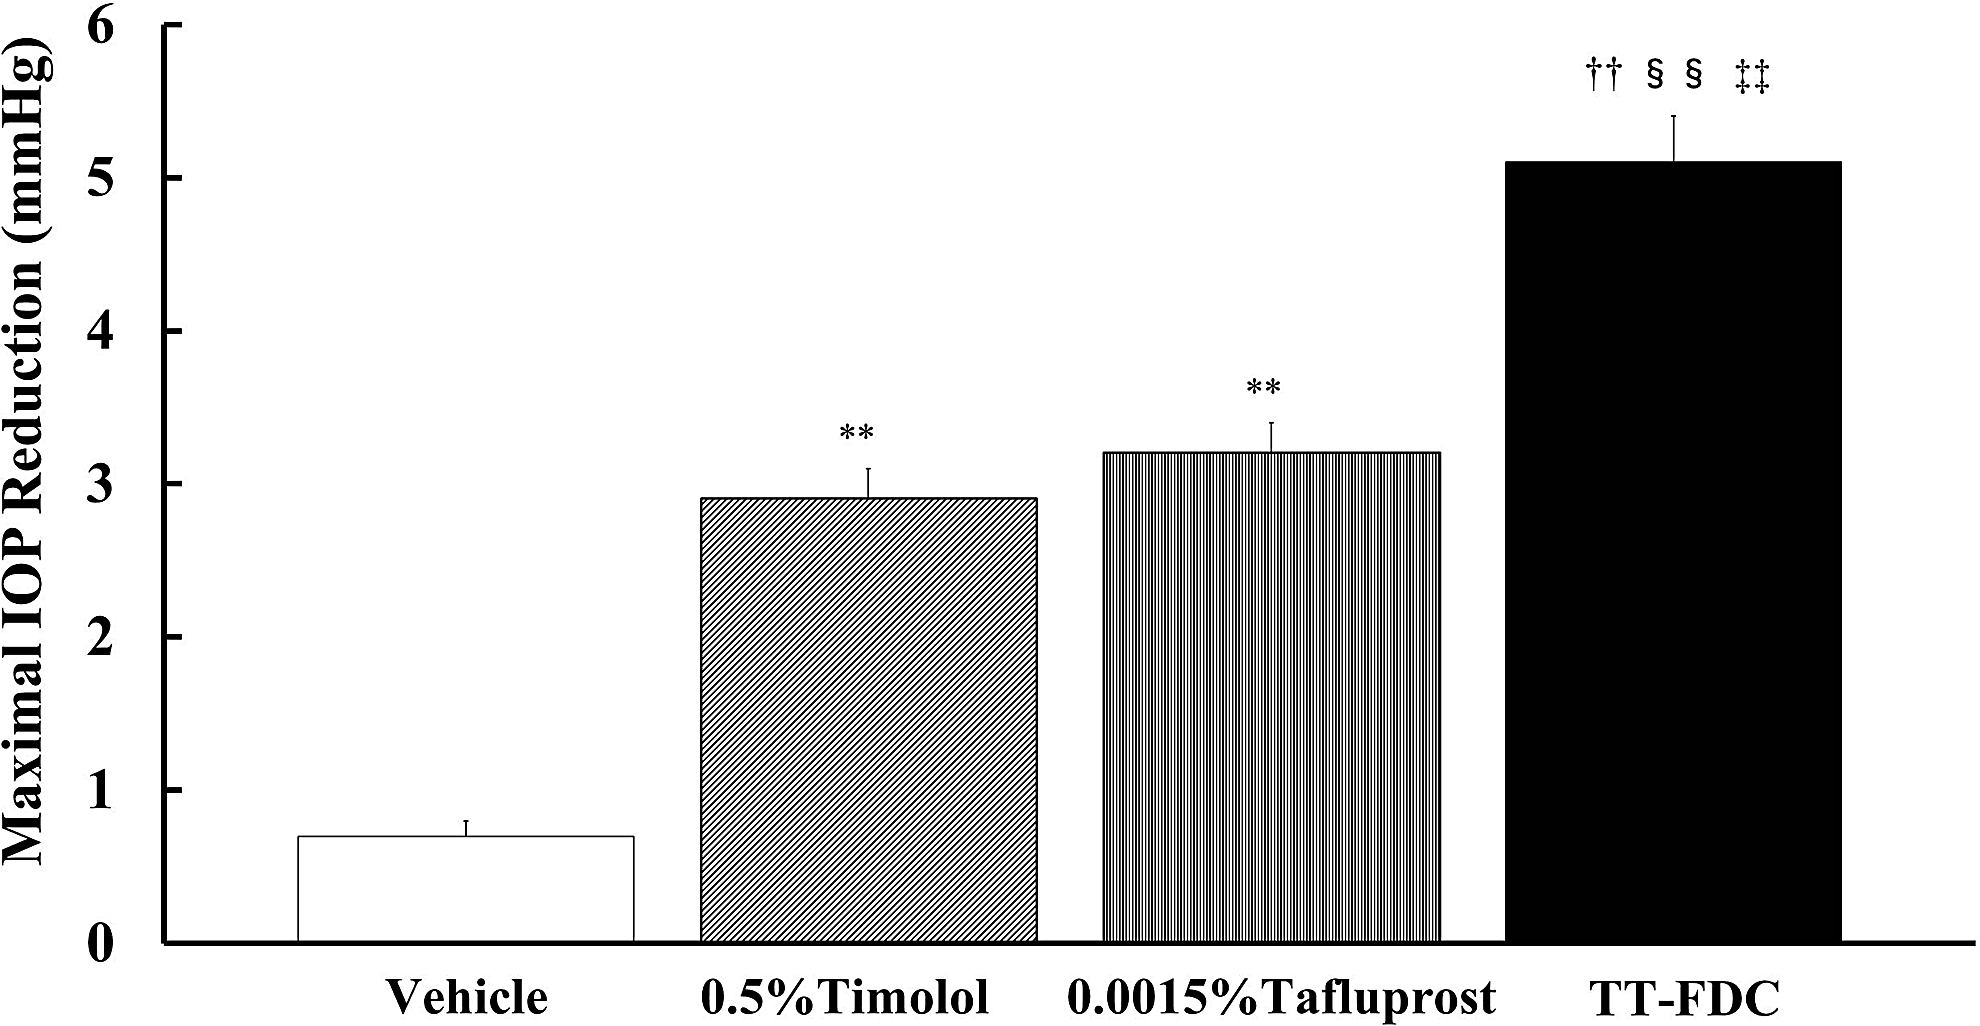
Comparative effects of topical administration of timolol, tafluprost, and TT-FDC on maximal IOP reduction in ocular normotensive monkeys. Vehicle (vehicle of TT-FDC 20 μL), 0.5% timolol (20 μL), 0.0015% tafluprost (20 μL), or TT-FDC (20 μL) was topically administered to the right eyes. The left eyes remained untreated. IOPs were measured with a pneumatic tonometer. Maximal IOP reductions were calculated as the maximal value of inverse numbers of IOP changes between 2 and 8 h in each monkey. Data represent the mean maximal IOP reduction + SEM of 12 eyes. **P < 0.01 versus Vehicle by the Student's t-test. §§P < 0.01 versus Vehicle by the Aspin–Welch t-test. ††P < 0.01 versus 0.0015% tafluprost by the Student's t-test. ‡‡P < 0.01 versus 0.5% timolol by the Student's t-test.
The maximal IOP reduction analysis, reductions in IOP of the 0.5% timolol group, the 0.0015% tafluprost group, and the TT-FDC group, was significantly greater than those of the Vehicle group (P ≤ 0.001). TT-FDC also showed a significantly greater maximal IOP reduction than 0.5% timolol (P ≤ 0.001) and 0.0015% tafluprost (P ≤ 0.001). No significant abnormalities in eyes and general health were observed during this experiment.
Thus, TT-FDC also showed a greater ocular hypotensive effect than 0.5% timolol and 0.0015% tafluprost.
Ocular hypotensive effect of TT-FDC versus the concomitant administration of 0.5% timolol and 0.0015% tafluprost using an interval of more than 5 min
The IOP changes induced by the single topical administration of TT-FDC and the concomitant administration of 0.5% timolol and 0.0015% tafluprost using an interval of more than 5 min in ocular normotensive monkeys are shown in Fig. 3A.
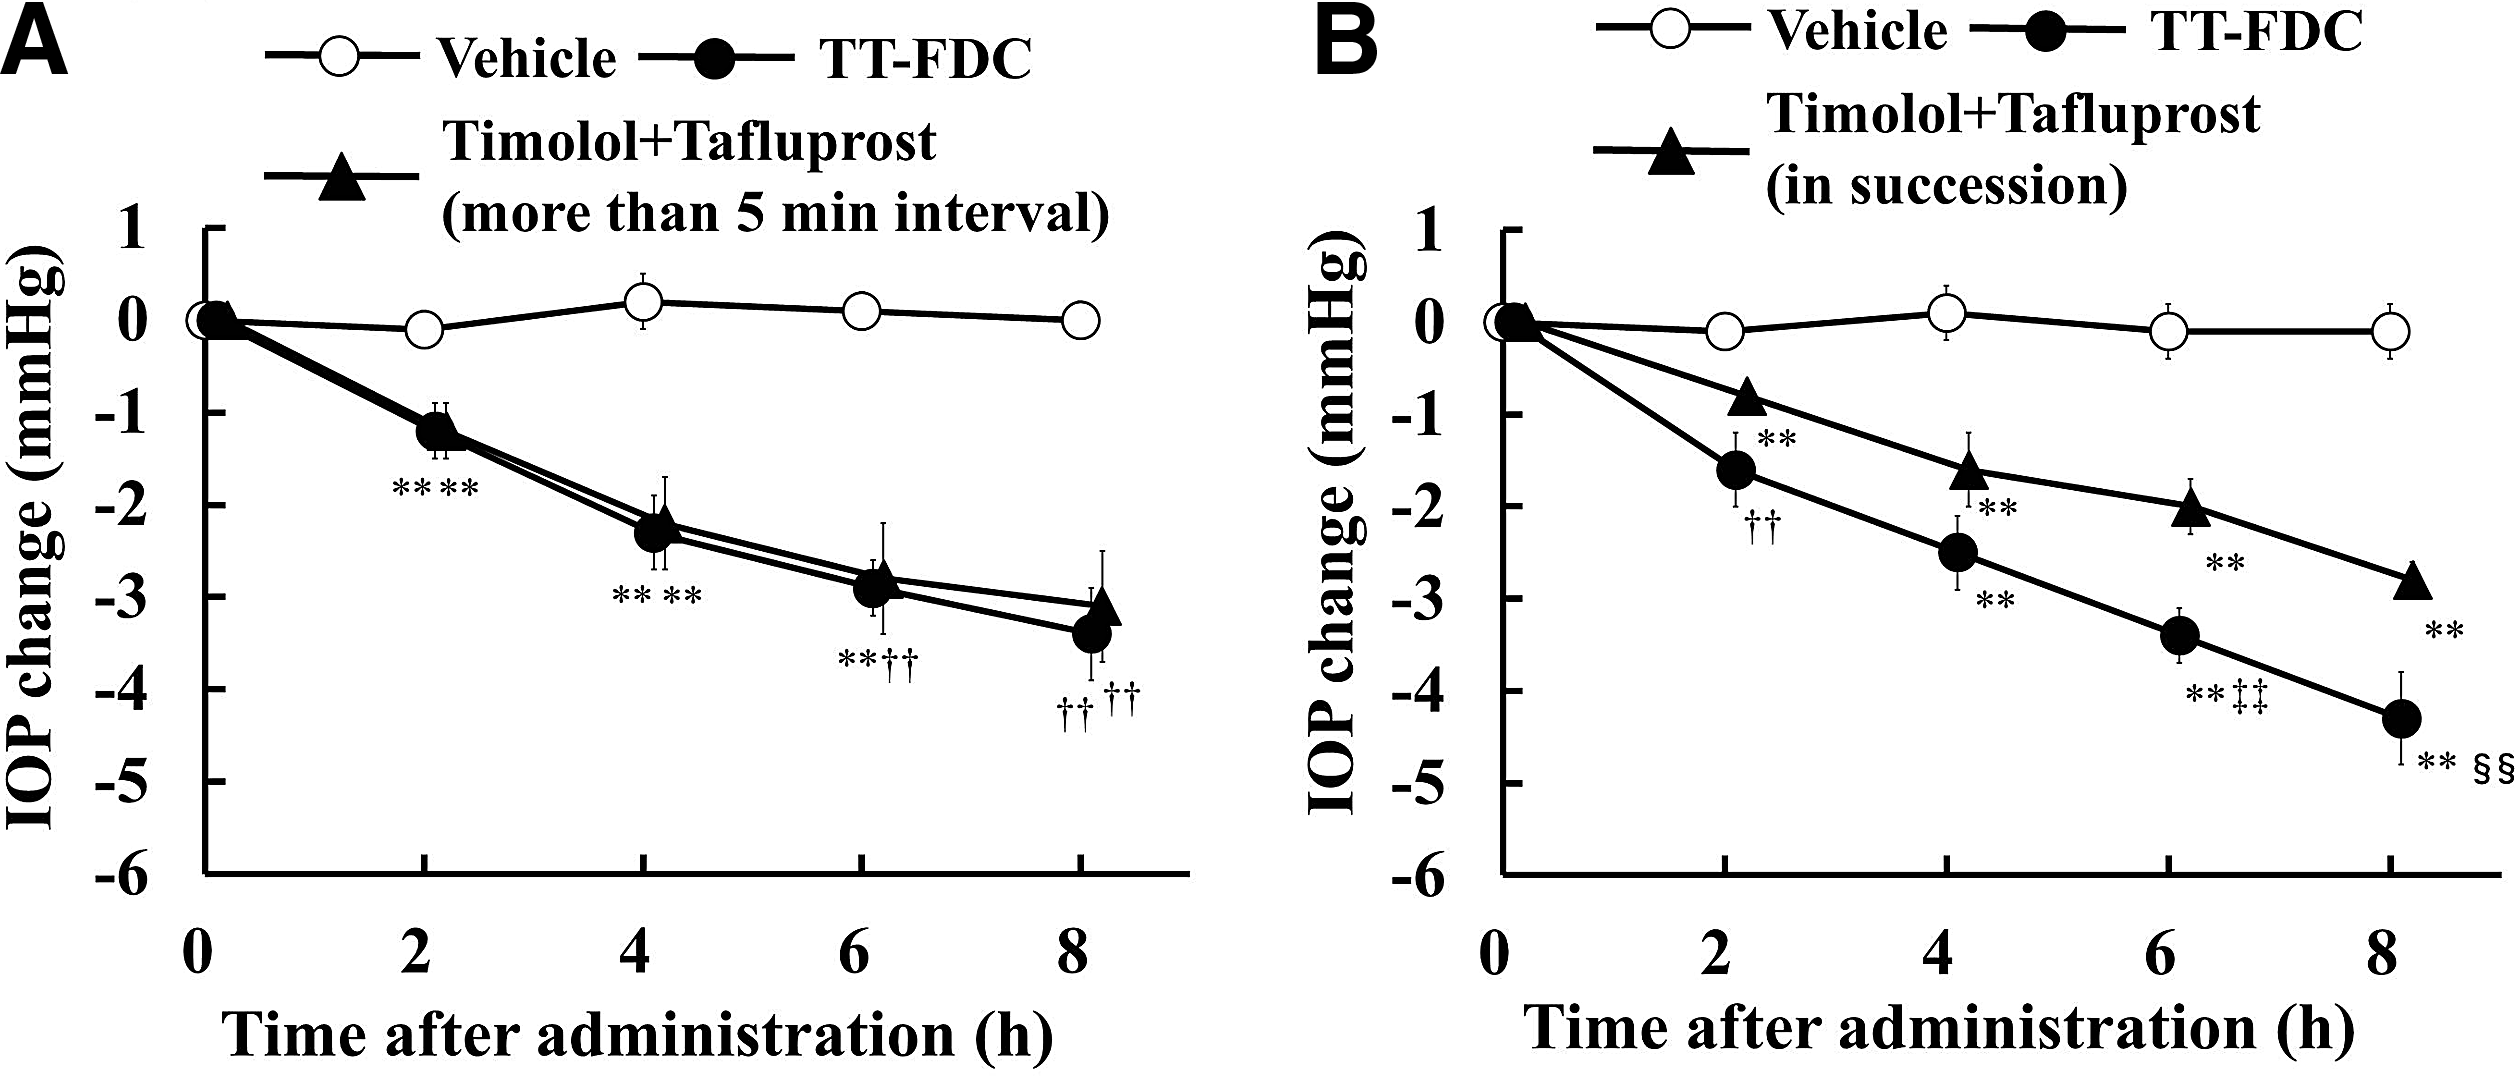
Comparative effects of topical concomitant administration of timolol and tafluprost and topical administration of TT-FDC on IOP in ocular normotensive monkeys. Vehicle (vehicle of TT-FDC, 20 μL), concomitant administration of timolol (0.5%, 20 μL), and tafluprost (0.0015%, 20 μL) or TT-FDC (20 μL) were topically administered to the right eye. The left eyes remained untreated. IOPs were measured with a pneumatic tonometer. IOP changes were calculated as the difference from their predosing IOP values at the 0-h time point. Data represent the mean IOP change ± SEM of 12 eyes.
The IOP value of the Vehicle group at the 0-h time point (just before administration) was 16.1 ± 0.9 mmHg, of the concomitant administration of 0.5% timolol and 0.0015% tafluprost group was 16.5 ± 0.9 mmHg, and of the TT-FDC group was 16.3 ± 0.8 mmHg (mean ± SEM). No statistically significant differences among initial IOP values were observed (Tukey multiple comparison test).
Analysis of the IOP changes; TT-FDC significantly lowered IOP by −1.2 ± 0.3 mmHg, −2.3 ± 0.4 mmHg, −2.9 ± 0.3 mmHg, and −3.4 ± 0.5 mmHg at 2, 4, 6, and 8 h after the administration, respectively. Concomitant administration of 0.5% timolol and 0.0015% tafluprost also significantly lowered IOP by −1.2 ± 0.3 mmHg, −2.2 ± 0.5 mmHg, −2.8 ± 0.6 mmHg, and −3.1 ± 0.6 mmHg at 2, 4, 6, and 8 h after the administration, respectively.
The changes in the IOP values of the TT-FDC group at all time points were comparable with the changes in the values of the concomitant administration of the 0.5% timolol and 0.0015% tafluprost group. Peak IOP reduction was detected 8 h after administration in both groups, and the peak IOP reduction value of the TT-FDC group and the concomitant administration of the 0.5% timolol and 0.0015% tafluprost group were −3.4 ± 0.5 mmHg (20% reduction from the 0-h time point) and −3.1 ± 0.6 mmHg (19% reduction from 0-h time point), respectively. During this experiment, no significant abnormalities in eyes and general health were observed.
These results indicate that the IOP-lowering effect of TT-FDC was equivalent to that of the concomitant administration of 0.5% timolol and 0.0015% tafluprost in ocular normotensive monkeys, when administered at an interval of more than 5 min.
Ocular hypotensive effect of TT-FDC versus the concomitant administration of 0.5% timolol and 0.0015% tafluprost in succession
The IOP changes induced by the single topical administration of TT-FDC and the concomitant administration of 0.5% timolol and 0.0015% tafluprost without an interval in ocular normotensive monkeys are shown in Fig. 3B.
The IOP value at the 0-h time point (just before administration) of the Vehicle group was 17.0 ± 0.9 mmHg, of the concomitant administration of the 0.5% timolol and 0.0015% tafluprost group was 17.0 ± 0.8 mmHg, and of the TT-FDC group was 17.0 ± 0.7 mmHg (mean ± SEM). No statistically significant differences in initial IOP values among treatment groups were observed (Tukey multiple comparison test).
Analysis of the IOP changes, TT-FDC significantly lowered IOP by −1.6 ± 0.4 mmHg, −2.5 ± 0.4 mmHg, −3.4 ± 0.3 mmHg, and −4.3 ± 0.5 mmHg at 2, 4, 6, and 8 h after the administration, respectively. Concomitant administration of 0.5% timolol and 0.0015% tafluprost also significantly lowered IOP by −0.8 ± 0.1 mmHg, −1.6 ± 0.4 mmHg, −2.0 ± 0.3 mmHg, and −2.8 ± 0.6 mmHg at 2, 4, 6, and 8 h after the administration, respectively.
The TT-FDC group showed lower IOP values than the concomitant administration of the 0.5% timolol and 0.0015% tafluprost group at all time points. TT-FDC induced a significantly greater IOP reduction than the concomitant administration of 0.5% timolol and 0.0015% tafluprost at the 6-h (P = 0.004) and 8-h (P = 0.008) time points. Peak IOP reduction was detected 8 h after administration in both groups, and the % of peak IOP reduction value of the TT-FDC group and the concomitant administration of 0.5% timolol and 0.0015% tafluprost group were 26% reduction from the 0-h time point and 16% reduction from the 0-h time point, respectively. No severe abnormalities in eyes and general health were observed throughout the study.
Hence, the ocular hypertensive effect of TT-FDC was greater compared with the concomitant administration of 0.5% timolol and 0.0015% tafluprost in ocular normotensive monkeys in succession in monkeys.
Drug distribution in the aqueous humor after the concomitant administration of 0.5% timolol and 0.0015% tafluprost
Figure 4A represents the aqueous humor concentration profiles of timolol in rats after the concomitant administration of tafluprost and timolol at different time intervals (ie, administered in succession or at a 5-min interval). In both groups, the aqueous humor concentrations of timolol attained peak values within 0.5 h after administration and rapidly decreased thereafter. However, the timolol concentration of the aqueous humor in the succession group is significantly lower than those in the 5-min interval group at 30 min after timolol administration in rats (P = 0.009). In addition, both Cmax and AUC0–4 values of timolol in the succession group were lower than those observed in the 5-min interval group in rats (Table 2A).
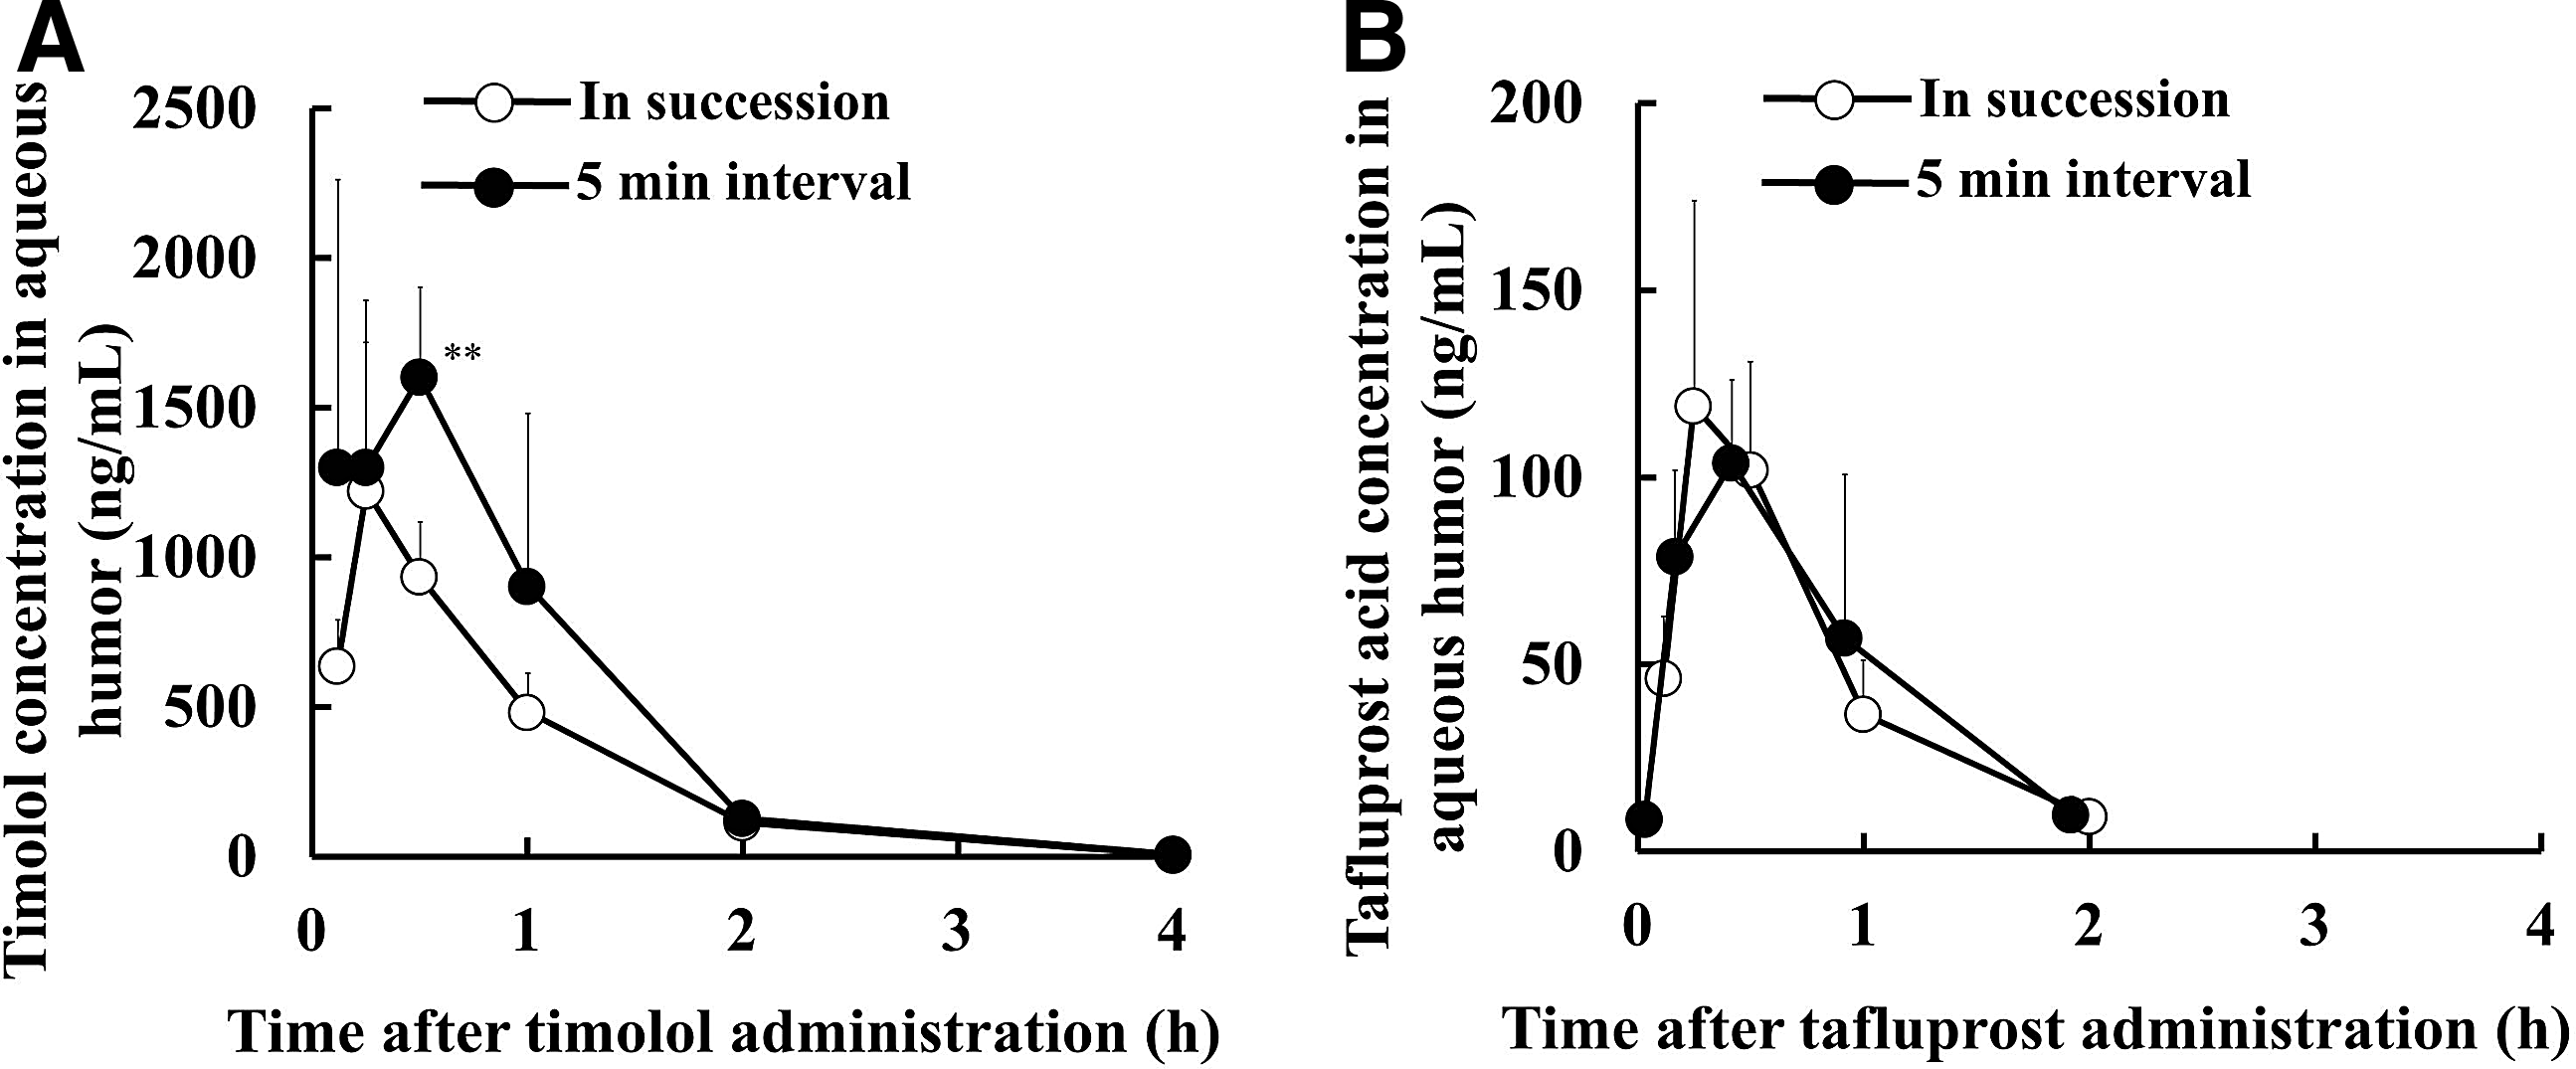
Timolol and tafluprost acid concentrations in the aqueous humor after the concomitant administration of timolol and tafluprost to female rats. Tafluprost (0.0015%, 5 μL) was successively administered after timolol (0.5%, 5 μL) administration in both eyes in the succession group. Tafluprost (0.0015%, 5 μL) was administered 5 min after timolol (0.5%, 5 μL) instillation in both eyes in the 5-min interval group. Timolol concentration and tafluprost acid concentration were measured using a liquid chromatography–tandem mass spectrometer. Data represent the mean concentration + standard deviation of 6 eyes.
Tafluprost (0.0015%, 5 μL) was successively administered after timolol (0.5%, 5 μL) instillation in both eyes in the succession group. In the 5-min interval group, tafluprost (0.0015%, 5 μL) was administered 5 min after timolol (0.5%, 5 μL) instillation in both eyes. Timolol and tafluprost acid concentration was measured using a liquid chromatography–tandem mass spectrometer. Data represent the value calculated from the mean concentration values of 6 eyes. (A) The pharmacokinetic parameters of timolol in the aqueous humor and (B) the pharmacokinetic parameters of tafluprost acid in the aqueous humor.
This value represents the AUC0–3.92.
Figure 4B represents the aqueous humor concentration profiles of tafluprost acid in rats after the concomitant administration of tafluprost and timolol at different time intervals (ie, administered in succession or at a 5-min interval). In both groups, the aqueous humor concentrations of tafluprost attained peak values within 0.5 h after administration and decreased below the detection limit value 4 h after administration. No differences in Cmax and AUC0–4 values were observed between the 2 groups in rats (Table 2B).
Discussion
This study demonstrated that TT-FDC showed a greater ocular hypotensive effect than 0.5% timolol and 0.0015% tafluprost in monkeys (Figs. 1 and 2). The active ingredients of TT-FDC are tafluprost and timolol. Tafluprost is metabolized to tafluprost acid and acts as a prostaglandin FP receptor agonist in ocular tissues. Timolol acts as a nonselective a beta-adrenergic antagonist. Both of them demonstrate a decrease in IOP, although using different mechanisms of action to decrease the aqueous humor formulation and increase the uveoscleral outflow.19,20 The combination of the 2 drugs has been thought to be effective in IOP reduction using their complementary pharmacological actions. Therefore, the fixed combination of timolol and tafluprost in the form of TT-FDC is a reasonable combination.
The IOP-lowering effect of TT-FDC was equivalent to that of the concomitant administration of 0.5% timolol and 0.0015% tafluprost when these were administered at an interval of more than 5 min in monkeys (Fig. 3A). TT-FDC also showed an ocular hypotensive effect comparable with that induced by the concomitant administration of 0.5% timolol and 0.0015% tafluprost in a clinical trial. 15 TT-FDC has been developed not to reduce the timolol penetration into the aqueous humor from that of 0.5% timolol. In fact, the penetration of timolol and tafluprost acid into the aqueous humor by TT-FDC instillation was not lower compared with the concomitant administration of the same volume of 0.5% timolol and 0.0015% tafluprost in rats. 21 Therefore, it has been thought that TT-FDC showed an IOP-lowering effect comparable with that of concomitantly administered timolol and tafluprost in monkeys.
Regarding concomitant administration, it has been reported that adding a second drug increases the complexity of the treatment regimen, often leading to a decrease in the usage of both drugs and an increase in the dosing error.10,11 In addition, many glaucoma patients are administered 2 medications without a time interval, 13 which has raised concerns regarding a decrease in the efficacy of medications.22,23 Hence, a reduction of dosing frequency has been recommended, 14 and the application of fixed-combination drugs is expected to prevent further deterioration in patient compliance by reducing the dosing frequency.
Based on this perspective, we compared and confirmed that the ocular hypotensive effect of TT-FDC was greater compared with the concomitant administration of 0.5% timolol and 0.0015% tafluprost in succession in monkeys (Fig. 3B). This result differs from the ocular hypotensive effect of TT-FDC when compared with the concomitant administration of 0.5% timolol and 0.0015% tafluprost at an interval of more than 5 min in monkeys (Fig. 3A). These 2 results indicate that the ocular hypotensive effect is reduced by concomitant instillation at a short time interval. In addition, the use of a fixed-combination drug showed no risk of decrease in efficacy because it does not involve the administration of drugs in succession.
Several reports have shown that the concomitant instillation of drugs within a short time interval induced a loss of penetration to the aqueous humor.22,23 There were concerns regarding the reduction in efficacy induced by the decrease in the aqueous humor drug concentration when 2 drugs were concomitantly instilled within a short period. The present study confirmed the reduced pharmacokinetic effect of timolol and tafluprost when administered without an interval in animal models. In our experiment, the aqueous humor concentration of timolol (the first administered drug) decreased with shorter time intervals between administrations in rats (Fig. 4A; Table 2A). In contrast, the aqueous humor concentration of tafluprost acid (the second administered drug) did not change with shorter time intervals between administrations in rats (Fig. 4B; Table 2B). We did not examine the reverse order of drug administration; however, our findings are consistent with those of a previous report, in which only the first administered agent resulted in a loss of penetration to the aqueous humor by the wash out of the first administered ophthalmic solution, that is, postinstillation rinsing, after the concomitant administration of 2 ophthalmic agents within a short time interval. 22 At least these results suggest that a shorter time interval for the concomitant administration of 2 drugs (firstly administered timolol and secondly administered tafluprost) may cause a loss of the penetration of the first administered drug (timolol in this case) into the aqueous humor. The aqueous humor concentration of timolol was strongly correlated with the administered concentration, 24 which showed the IOP reduction in a concentration-dependent manner. 25 Therefore, it is conceivable that the loss of the penetration of timolol into the aqueous humor induces the reduction in timolol concentration in the aqueous humor, subsequently causing the reduction in the ocular hypotensive effect with the timolol origin.
However, in the case of TT-FDC administration, the aqueous humor concentrations of timolol and tafluprost were equivalent to those of the concomitant administration of timolol and tafluprost within a 5-min interval in rats. 21 Therefore, from a pharmacokinetic perspective, TT-FDC is thought to show the full ocular hypotensive effect of timolol and tafluprost through its instillation at an interval of at least 5 min.
In conclusion, the ocular hypotensive effect of TT-FDC was equivalent to that of the concomitant administration of 0.5% timolol and 0.0015% tafluprost at the appropriate time interval in monkeys. This study also clearly showed that the concomitant administration without the appropriate time interval reduced the ocular hypotensive effect in monkeys and penetration of the drug into the aqueous humor in rats. The use of TT-FDC reduces the number of daily doses (timolol and tafluprost are administered twice or thrice a day, whereas TT-FDC is administered once a day) and is thought to have fewer risks for reducing the IOP-lowering potency of 0.5% timolol and 0.0015% tafluprost.
Footnotes
Acknowledgments
The authors thank Mr. Masafumi Mieda and Mr. Isao Matsuoka for their excellent technical assistance.
Author Disclosure Statement
No competing financial interests exist.