
Abstract
Purpose:
To evaluate effects of insulin on ocular parameters in patients with type 2 diabetes mellitus who start insulin therapy.
Methods:
In this prospective study, ocular biometric parameters were obtained using optical biometer (Lenstar LS900®; Haag-Streit AG) and refraction test (ARK-510A Auto refracto-keratometer; Nidek Co. Ltd, Aichi, Japan) before and at 3 months after initiating insulin therapy. In addition, patients' fasting blood glucose (FBG), glycosylated hemoglobin (HbA1C), and blood lipid levels were measured at the same time points. Pretreatment and post-treatment results were compared. In addition, associations between ocular parameters with initial dose and type of insulin treatment regimen, HbA1C, and FBG levels were evaluated.
Results:
The patients' mean age was 51.2 ± 12.9 (18–73) years. Post-treatment HbA1C and FBG levels (8.5% ± 2.5% and 188.1 ± 111.2 mg/dL, respectively) were significantly lower than pretreatment values (12% ± 1.4% and 325.3 ± 95.7 mg/dL, respectively; P < 0.001 for both). There was a significant positive correlation between the change in HbA1C and the change in lens thickness (P = 0.03), and a significant negative correlation between the change in FBG and the change in the spherical equivalent refraction (P = 0.045). Insulin dose and treatment regimen type were not significantly correlated with ocular parameters (P > 0.05).
Conclusion:
HbA1C-lowering glycemic effect of insulin was correlated with a small decrease in lens thickness. Long-term, randomized controlled trials including larger patient numbers are needed to shed light on the long-term effects of insulin use and glycemic control on ocular parameters.
Introduction
Diabetes mellitus (DM) is a metabolic disease characterized by hyperglycemia because of impaired insulin production or function. Long-term damage resulting from chronic hyperglycemia in DM affects various organs such as the eyes, kidneys, nerves, heart, and blood vessels. 1 The disease burden associated with DM is high and rising in every country, fueled by the global rise in the prevalence of obesity and unhealthy lifestyles. According to the latest estimates, the global population of diabetes patients was 382 million in 2013 and is expected to rise to 592 million by the year 2035. 2 Diabetic retinopathy is one of the microvascular complications of diabetes.
Aldose reductase catalyzes the reduction of glucose to sorbitol. An increase in intracellular glucose leads to an increase in sorbitol, which in turn leads to the competitive inhibition of both glomerular and neural synthesis of myoinositol. This decrease in myoinositol synthesis suppresses the phosphoinositide mechanism, resulting in reduced Na,K-ATPase activity. This is the main mechanism in the development of diabetes complications; however, formation of advanced glycosylation end products because of hyperglycemia has been proposed as another mechanism. 3
Studies have shown that DM is associated with cataract development, with a 5-fold higher incidence of cataract among diabetic patients than in controls.4–6 There are also studies demonstrating that DM affects corneal biomechanics.7,8 Greater central corneal thickness was reported in diabetic patients than in normal individuals.9–11 Many studies have also revealed that changes in axial length and refraction may occur in the eyes in patients with diabetes or hyperglycemia.12–15
Recent studies have shown that diabetic individuals have increased lens thickness, smaller anterior chamber depth, more curved lens, and lower lens equivalent refractive index than in normal subjects of similar age.16,17 Adnan et al. have shown that diabetic patients have greater light scattering, greater lens yellowing, and differences in some higher-order aberrations than in normal subjects of similar age.18,19 They found that individuals with type 1 DM had lower accommodation amplitude than in age-matched controls. 20
Evidence suggests that insulin stimulates axial myopia and increases Na,K-ATPase activity, which enables the corneal endothelial pump function.21,22
In this study, we aimed to determine whether treatment has an effect on biometric parameters and refraction of the eye in patients with type 2 DM who start insulin therapy.
Methods
This prospective study included patients who were being followed for diabetes mellitus (DM) in the endocrinology outpatient clinic of the Yüzüncü Yıl University Faculty of Medicine and were planned to start insulin therapy between August 2016 and June 2018. Eighty eyes of 40 patients were included in the study.
Refraction measurements were obtained using an autorefractometer (ARK-510A; Nidek Co. Ltd., Aichi, Japan) in the ophthalmology outpatient clinic before and after 3 months of insulin therapy. Spherical equivalent (SE) refraction was used in eyes with astigmatism. Measurements were taken without cycloplegia and refraction assessment was repeated until at least 3 consistent measurements were made. The average of these 3 measurements was used in analyses.
Biometric measurements [axial length, central corneal thickness, anterior chamber depth, lens thickness, vitreous chamber depth, corneal radius of curvature, average keratometric value, and predicted intraocular lens (IOL power)] were obtained using an optical biometer (Lenstar LS900®; Haag-Streit AG). As 2 patients were pseudophakic, anterior chamber depth, lens thickness, and vitreous chamber depth could not be measured in these patients. The same lens (Acrysof SA60-AT; Alcon, Forth Worth, TX) and SRK-T formula were used for the biometric calculation of IOL power.
The patients underwent anterior and posterior segment examination and intraocular pressure (IOP) was measured using Goldmann applanation tonometry. IOP measurement was performed last to avoid possible effects on refraction and biometric measurements. Color fundus photography was used in all patients for diabetic retinopathy evaluation. Measurements were made at the same time of the day (between 8 and 10 a.m.) to avoid the influence of diurnal variations.
Patients who had systemic diseases other than diabetes, used systemic or topical drugs, were pregnant, were smokers, or had ocular disorders such as glaucoma, corneal pathology, and retinal disease other than diabetic retinopathy were excluded from the study. None of the patients exhibited macular edema in macular optical coherence tomography examinations conducted before and during treatment. Six patients were excluded from the study because they did not attend follow-up appointments regularly and suitable measurements could not be obtained. Therefore, a total of 34 right eyes of 34 patients diagnosed with type 2 DM were evaluated in the study.
Body mass index (BMI) and fasting blood glucose (FBG), triglyceride, low-density lipoprotein (LDL), and high-density lipoprotein (HDL) levels were measured in the endocrinology outpatient clinic. The patients were started on 4 different regimens of insulin therapy. Complete ophthalmologic examination and optical biometry, FBG, glycosylated hemoglobin (HbA1C), LDL, HDL, and triglyceride measurements were repeated after 3 months of treatment. Values obtained in both eyes were used to compare patients' ocular parameters before and after 3 months of treatment, whereas only data from the right eyes were used to compare ocular and blood parameters.
The study was approved by the ethics committee of Yüzüncü Yıl University Faculty of Medicine. The study was conducted in compliance with the Declaration of Helsinki.
Statistical analysis
All statistical analyses were carried out using SPSS 23.0 statistical analysis software. The Kolmogorov–Smirnov test was used to determine whether the data conformed to normal distribution. According to distribution, paired t-tests or Wilcoxon tests were used to compare pretreatment and post-treatment ocular parameters and blood values. Pearson correlation analysis was used to evaluate relationships between ocular parameters, HbA1C level, FBG, and the dose of insulin therapy. A multinomial logistic regression analysis was used to evaluate relationships between insulin therapy and biometric parameters. A value of P < 0.05 was considered as significant.
Results
The patients' mean age was 51.2 ± 12.9 (18–73) years. Twenty-two (64.7%) patients were men and 12 (35.3%) were women. Anterior segment examination was normal in 25 eyes (73.5%), 2 eyes were pseudophakic (5.9%), and 7 eyes had cataract (20.6%). The mean duration of diabetes was 39.4 ± 55 (0–182) months. Fundus examination findings were normal in 32 eyes (94.1%), whereas nonproliferative diabetic retinopathy was observed in the other 2 eyes (5.9%).
Mean pretreatment BMI was 28.4 ± 4.6 (19.7–38). There were no significant correlations between diabetes duration and ocular parameters (P > 0.05). Before insulin therapy, 21 (62%) patients had used oral antidiabetic drugs, whereas 13 (38%) had not been using any medication. Fourteen patients were started on mixed insulin aspart protamine/insulin aspart, 12 on insulin glargine/aspart, 7 on insulin detemir/aspart, and 1 on insulin glargine. Mean insulin dose was 43.3 ± 11.9 (15–72) IU.
The patients' pretreatment and post-treatment ocular parameters are given in Table 1 and their blood values in Table 2. Changes between pre- and post-treatment ocular parameters and blood values and the correlations between them are given in Table 3.
Patients' Ocular Parameters Before and 3 Months After Starting Insulin Therapy
ACD, anterior chamber depth; AL, axial length; BCVA, best-corrected visual acuity; CC, corneal radius of curvature; CCT, central corneal thickness; IOL, intraocular lens; IOP, intraocular pressure; Kavg, average of maximum and minimum keratometric values; LT, lens thickness; SE, spherical equivalent; VCD, vitreous chamber depth.
Patients' Blood Analysis Results Before and 3 Months After Starting Insulin Therapy
Statistically significant (p < 0.05).
FBG, fasting blood glucose; HbA1C, glycosylated hemoglobin; HDL, high-density lipoprotein; LDL, low-density lipoprotein.
Correlations Between Changes in Blood Values and Ocular Parameters Before and After Treatment
Statistically significant (p < 0.05).
There was a significant positive correlation between mean change in HbA1C and mean change in FBG (P = 0.001) (Fig. 1) and between mean change in HbA1C change and mean change in lens thickness (P = 0.03) (Fig. 2). There was a significant negative correlation between the mean change in FBG and mean change in SE (P = 0.045). Although these last 2 correlations were statistically significant, these effects was modest. Changes in FBG and HbA1C were not significantly correlated with any of the other ocular or blood parameters (P > 0.05).
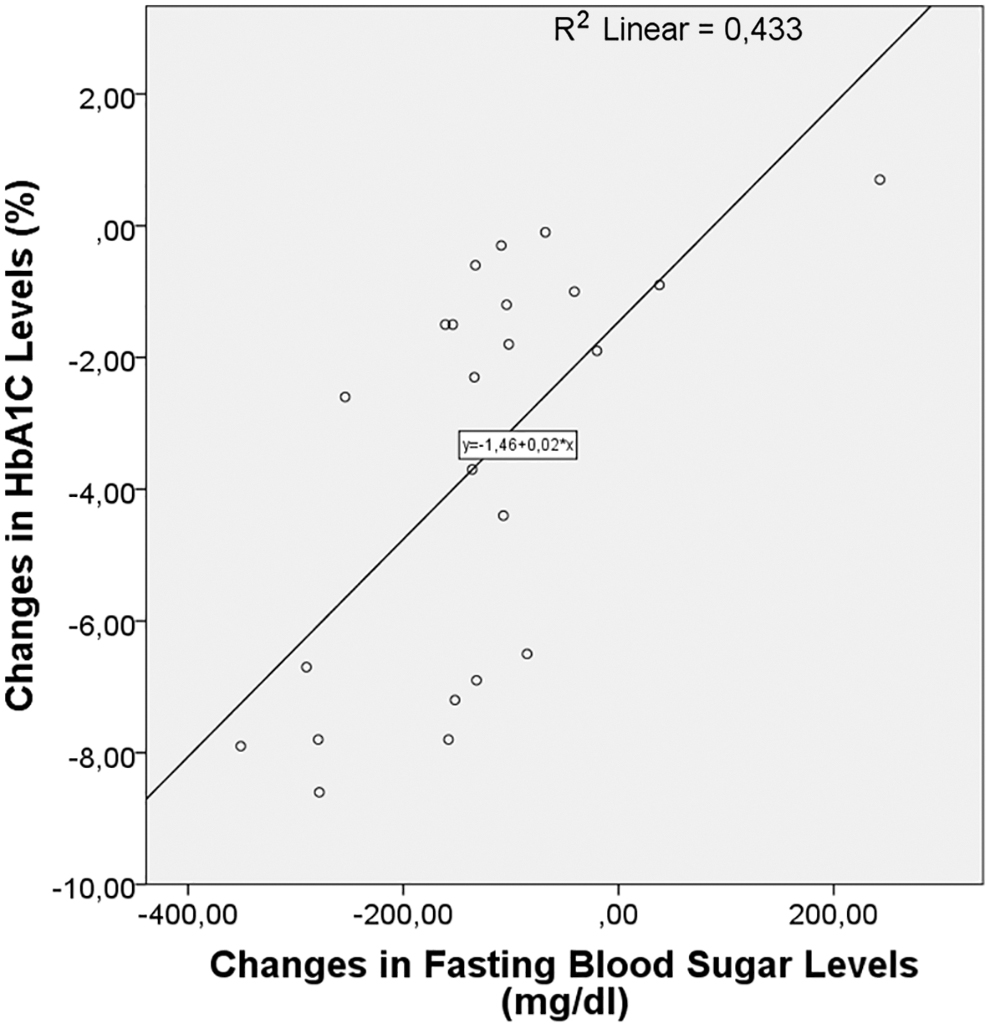
The correlation between change in HbA1C and change in fasting blood sugar levels. HbA1C, glycosylated hemoglobin.
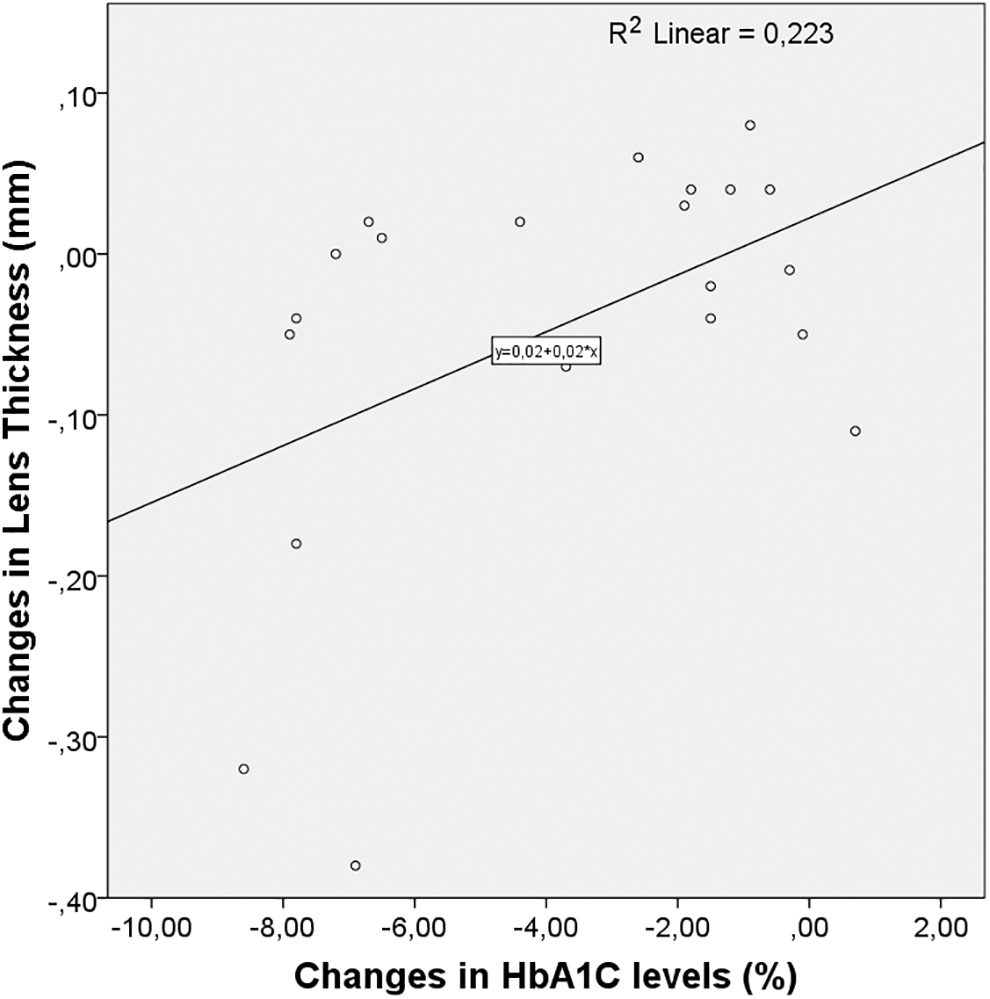
The correlation between change in HbA1C and change in lens thickness.
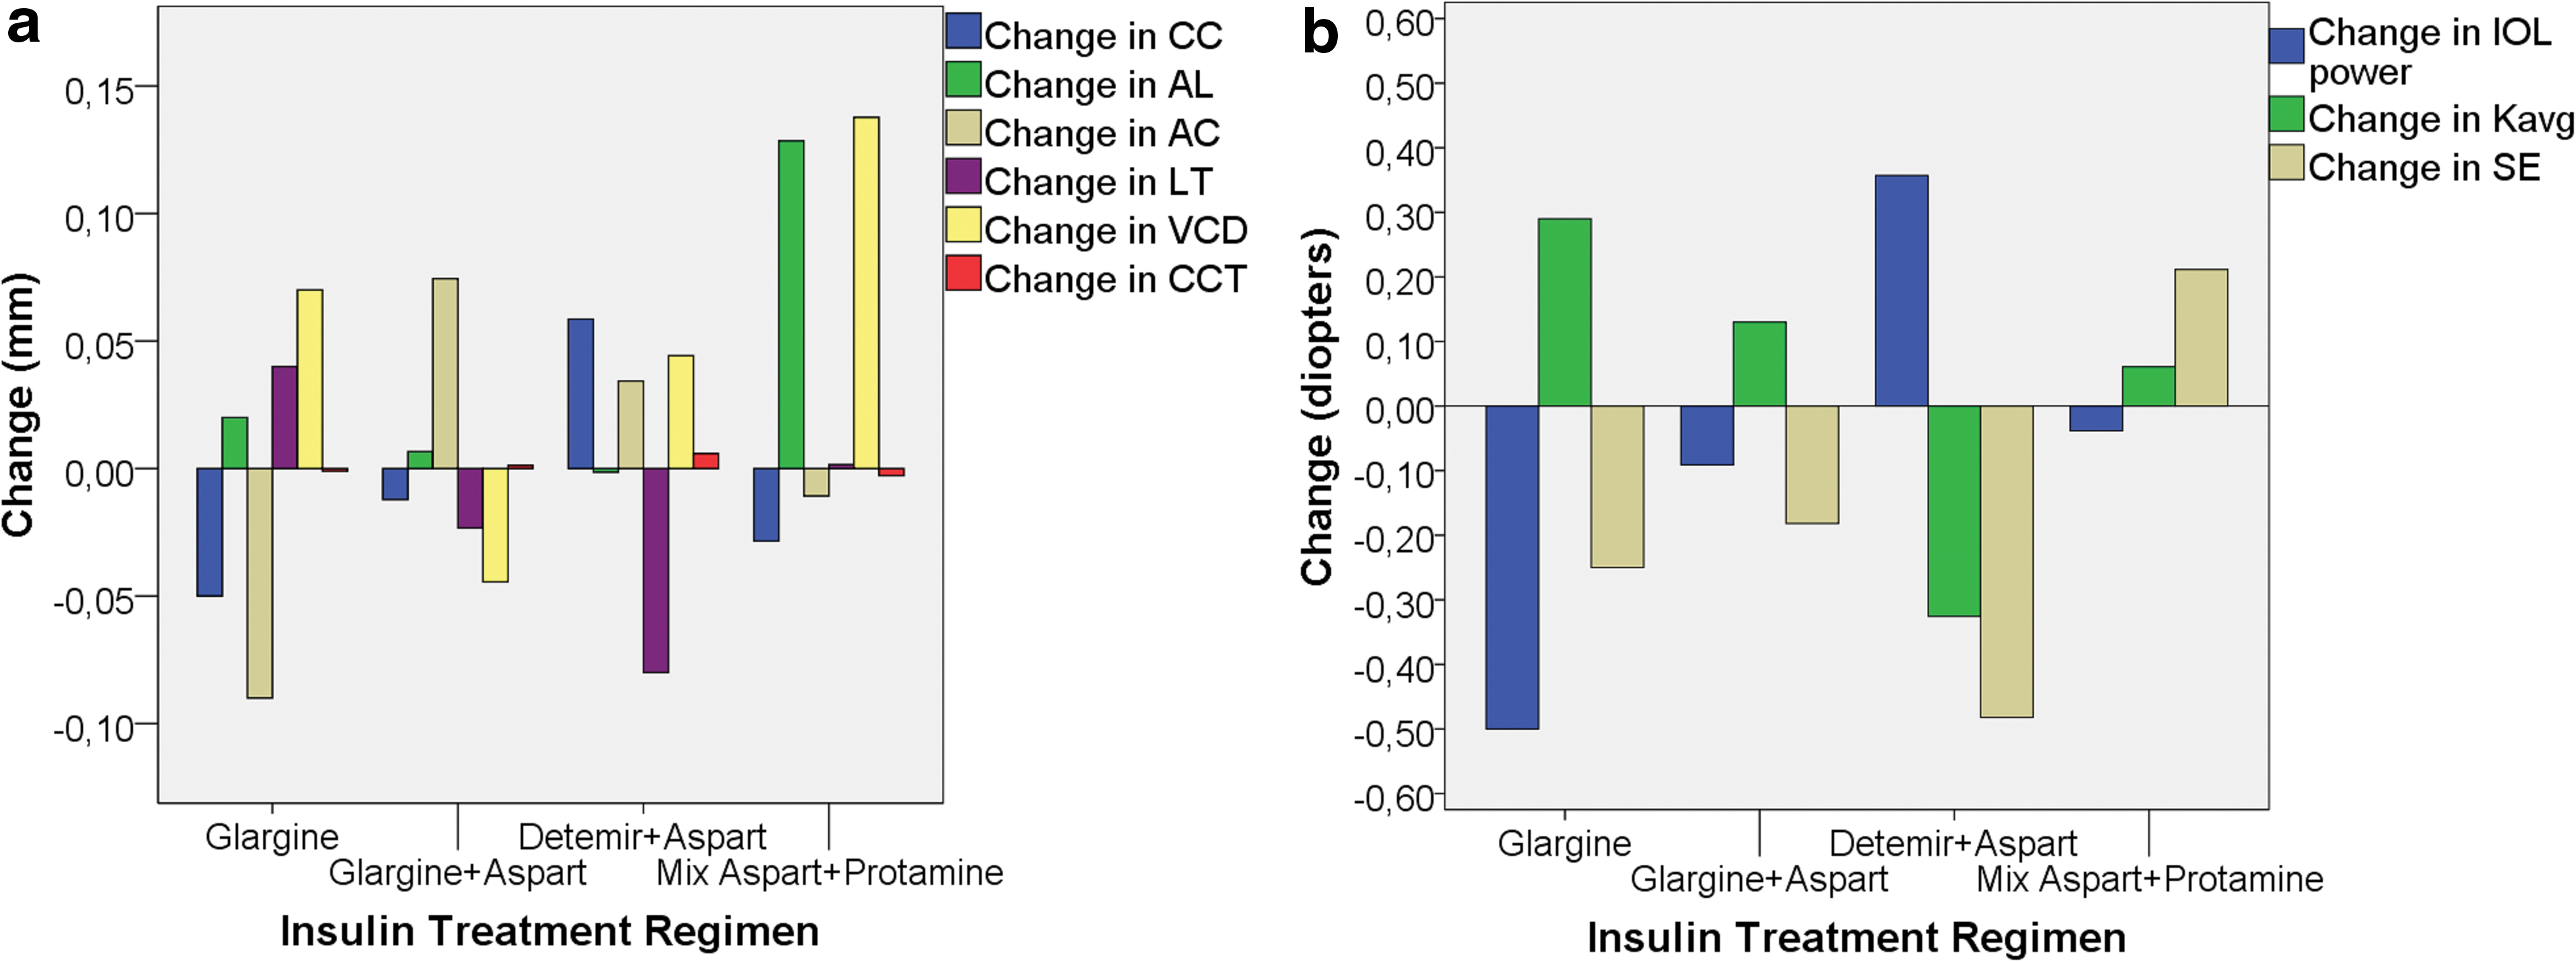
There were also no significant relationships between ocular biometry, SE, predicted IOL power, and the type of insulin therapy initiated (P > 0.05). Changes in the patients' mean ocular values based on the type of insulin therapy they received are given in Fig. 3.
Discussion
In this study, we investigated whether insulin has a direct or indirect effect on ocular parameters. A significant positive correlation was found between change in HbA1C and change in lens thickness, whereas ocular parameters were not significantly associated with dose or type of insulin therapy. There was also a significant negative correlation between change in FBG and change in the SE. There was a significant positive correlation between change in HbA1C and change in FBG.
Contradictory results have been reported regarding the relationship between changes in refraction and blood glucose levels and changes in blood sugar. Duke-Elder 23 demonstrated a tendency toward hypermetropia with decreased blood sugar and a tendency toward myopia with increased blood sugar. Other studies showed that a hypermetropic change occurs with the rapid treatment of hyperglycemia in patients with DM.12,14,15,24,25
However, Tai et al. 26 reported that acute hyperglycemia resulted in hypermetropia, whereas Furushima et al. 27 observed a myopic change after glucose loading. Jacobsen et al. 28 showed that long-term hyperglycemia and poor metabolic control lead to myopia, whereas Fledelius 14 observed myopia and hypermetropia at the same rate and Agardh et al. 29 detected no change in refraction. In our study, there was a significant decrease in FBG and HbA1C levels after 3 months of insulin therapy (P < 0.001), whereas there was no significant change in refraction (P = 0.23). However, a significant negative correlation was found between the change in FBG and change in SE (P = 0.045). This may be a result of a decrease in lens refractivity because of the decrease in blood sugar.
Previous studies evaluating changes in axial length after glycemic control in patients with DM have demonstrated no significant change in axial length.12,15,25,26,30 Similarly, we also observed no significant change in axial length in this study.
Central corneal thickness was shown to be significantly greater in the eyes of patients with DM than in people without diabetes.9,31,32 However, no significant changes in central corneal thickness were observed after glycemic control.26,33 Consistent with the literature, we observed no significant change in central corneal thickness after insulin therapy, but we could not make a comparison with the normal population as our study did not include a control group.
Some studies have shown that glycemic control has no effect on lens thickness, vitreous chamber depth, or anterior chamber depth.12,25,26,30,33 A study by Kocaturk et al. 34 showed that the eyes of patients with DM have thicker lenses and narrower anterior chambers compared with nondiabetic people. Similarly, Logstrup et al. 35 reported that longer DM duration was associated with increased lens thickness and decreased anterior chamber depth.
In a study including 10 eyes of 5 patients with DM, Saito et al. 15 detected a significant increase in lens thickness and a significant decrease in anterior chamber depth after glycemic control. Adnan et al. demonstrated that individuals with type 1 DM have increased lens thickness, smaller anterior chamber depth, more curved lens, and lower lens equivalent refractive index than in age-matched subjects.16,17 They have shown that patients with type 1 DM have greater light scattering, greater lens yellowing, and differences in root-mean-square higher-order aberrations in some higher-order aberration coefficients without significant increase. 19
In a study by Kato et al. 36 involving DM patients with rapid and slow glycemic control, a significant increase in lens thickness was detected in the rapid glycemic control group 1 week after initiating treatment, but no significant change was observed in later follow-up. The slow glycemic control group showed no significant change in lens thickness. In this study, there was no significant change in lens thickness, vitreous chamber depth, or anterior chamber depth at 3 months after initiating treatment compared with before treatment, whereas a significant positive correlation was found between change in HbA1C and change in lens thickness (P = 0.03). This correlation may have occurred as a result of a decrease in the water content of the lens because of the reduction in blood sugar.
Sonmez et al. 33 found that glycemic control had no significant effect on predicted IOL power values. We also detected no significant change in predicted IOL power after initiation of treatment in our study. In addition, we found that changes in HbA1C and FBG level were not associated with change in predicted IOL power.
Significant change in corneal curvature radius was not detected after DM treatment in previous studies.12,15,25 Consistent with these findings, we found no significant change in corneal curvature diameter or average keratometric value in our patients.
Luo et al. 37 examined the relationship between DM and IOP and demonstrated that high serum glucose or HbA1C level was associated with elevated IOP. They determined that only 11% of the effect of DM on IOP occurred through an increase in central corneal thickness Another study also showed a correlation between high HbA1C level and high IOP. 38 In a study by Li et al., 25 there was no significant change in IOP after glycemic control compared with before treatment. Similarly, in our study, there was no significant change in mean IOP at 3 months after starting insulin therapy compared with before treatment.
Schmetterer et al. 39 showed that vasodilatation after insulin administration resulted in an increase in ocular blood flow. They demonstrated that insulin has a role in the regulation of ocular blood flow through this effect. Hatou et al. 21 showed that insulin increases Na,K-ATPase and pump activity in corneal endothelial cell cultures. In their experimental study on chickens, Feldkaemper et al. 22 showed that intravitreal insulin injection stimulated axial myopia. They found that this axial elongation was mostly because of increased anterior chamber depth and crystalline lens thickness. In this study, we found that insulin dose and treatment regimen had no significant effects on ocular parameters.
Limitations of this study were the relatively small patient number and short follow-up period. In addition, blood insulin levels were not measured before and after treatment and that some patients were on oral antidiabetic medication before initiating insulin therapy.
In conclusion, the results of our study show that HbA1C-lowering glycemic effect of insulin was correlated with a small decrease in crystalline lens thickness. Long-term, randomized controlled trials including larger patient numbers are needed to shed light on the long-term effects of insulin use and glycemic control on ocular parameters. In addition, experimental studies conducted in subjects with DM may help reveal the effect of insulin on ocular parameters.
Footnotes
Author Disclosure Statement
No competing financial interests exist.
Funding Information
No funding was received for this article.