
Abstract
Background:
The objective prognostic score (OPS) needs to be modified to reflect practical palliative care circumstances.
Objectives:
We aimed to validate modified models of OPS with few or no laboratory tests for patients with advanced cancer.
Design:
An observational study was performed.
Setting/Subjects:
A secondary analysis of an international, multicenter cohort study of patients in East Asia was performed. The subjects were inpatients with advanced cancer in the palliative care unit.
Measurements:
We developed two modified OPS (mOPS) models to predict two-week survival: mOPS-A consisted of two symptoms, two objective signs, and three laboratory results, while mOPS-B consisted of three symptoms, two signs, and no laboratory data. We compared the accuracy of the prognostic models using sensitivity, specificity, and area under the receiver operating characteristic curve (AUROC). Calibration plots for two-week survival and net reclassification indices (NRIs) were compared for the two models. Survival differences between higher and lower score groups of each model were identified by the log-rank test.
Results:
We included a total of 1796 subjects having median survival of 19.0 days. We found that mOPS-A had higher specificity (0.805–0.836) and higher AUROCs (0.791–0.797). In contrast, mOPS-B showed higher sensitivity (0.721–0.725) and acceptable AUROCs (0.740–0.751) for prediction of two-week survival. Two mOPSs showed good concordance in calibration plots. Considering NRIs, replacing the original OPS with mOPSs improved overall reclassification (absolute NRI: 0.47–4.15%). Higher score groups of mOPS-A and mOPS-B showed poorer survival than those of lower score groups (p < 0.001).
Conclusions:
mOPSs used reduced laboratory data and had relatively good accuracy for predicting survival in advanced cancer patients receiving palliative care.
Introduction
Prognostication is the foundation of goal-concordant care in palliative care. 1 Palliative care teams require accurate prediction as it is a vital parameter for optimal decision making. Palliative patients and families need the prognostic information to arrange and reallocate their resources according to their wishes. However, prognostication is an inherently challenging task even for experts.2,3
Clinicians' prediction of survival (CPS) has been the most widely used approach in the field of prognostication since CPS is available at any stage of the disease. Clinicians can recognize the pattern of functional decline in patients 4 ; however, CPS accuracy varied from 23% to 78%.3,5,6 Moreover, the optimistic tendency of CPS is well known through previous studies.3,7,8 In addition, CPS is prone to subjective variation and limited reproducibility. Therefore, the European steering committee for evidence-based prognostication has recommended the use of a prognostic tool combined with CPS. 9
To date, many prognostic models have been developed and validated in palliative care.10,11 Investigators have built prognostic scores integrating multidimensional parameters to aid clinicians in survival prediction. 12 The palliative prognostic score (PaP) is one of the most well-validated tools for this purpose.13–19 It has advantages that apply to cancer and noncancer populations in diverse settings. However, PaP requires CPS as the largest component of the scoring system. Thus, the disadvantage of PaP can be the limited use for inexperienced clinicians because they may hesitate to formulate CPS. 20
The objective prognostic score (OPS) was developed as an easy and simple prognostic tool without CPS in Korea. 21 OPS comprises two symptoms (anorexia and dyspnea), one performance status (Eastern Cooperative Oncology Group Performance Status [ECOG PS]), and four laboratory test results (leukocyte count and serum total bilirubin, creatinine, and lactate dehydrogenase [LDH] levels). OPS ranged from 0.0 to 8.0 points. OPS aimed to predict three-week survival in two risk groups using 3.0 as a cutoff score. It has been validated several times in different settings of palliative care in Japan and Korea.22–26
At the beginning, we integrated four laboratory values into OPS since they were objective and accurate with high hazard ratios (HRs) for mortality. However, there is the inevitable possibility of missing data among any of the four laboratory test results. In addition, a wide range of laboratory tests may not be available in palliative settings in countries other than Japan and Korea. A decade has passed since the development of the original OPS, and the Korean medical environment has changed according to the passage of time.
Attributed to the legislation of advance care planning in Korea, hospice palliative care services have been propagated from 2016. 27 Palliative patients and families need the prognostic information to arrange their resources as death nears. Thus, we thought that adjusting the time frame and reducing laboratory variables would be required to reflect practical situations in Korea. Therefore, we aimed to validate modified models of OPS with fewer laboratory tests for patients with advanced cancer in Japan and Korea.
Methods
Study participants
This study was a secondary analysis of an international, multicenter cohort study. The parent study, the East Asian Collaborative Cross-Cultural Study to Elucidate the Dying Process (EASED), investigated the dying process and end-of-life care of inpatients with far advanced cancer in palliative care units (PCUs) in Japan, Korea, and Taiwan. This study included Japanese and Korean patients only because of lack of laboratory test results required to calculate OPSs in Taiwanese patients.
Eligible newly admitted inpatients in the participating PCUs during the study period were consecutively enrolled in the study. The inclusion criteria were as follows: (1) adult (age ≥18 years), (2) suffering from locally extensive or metastatic cancer, and (3) admitted to a participating PCU. The exclusion criteria were (1) scheduled discharge within one week and (2) patients' or their families' refusal to enroll.
Data collection
The palliative physicians evaluated patients' symptoms by direct observation at admission. All observations were made in the course of routine clinical practice. We followed up discharged patients for six months from admission to PCUs in Japan and six months from discharge from PCUs in Korea. Therefore, we defined survival time as mortality in and outside of hospitals, calculated by subtracting the admission date from the death date.
We collected data on anorexia, dyspnea, ECOG PS, leukocyte counts, and serum total bilirubin, creatinine, and LDH levels for calculating OPS. 21 Additionally, we obtained and analyzed the patient demographics and clinical characteristics on admission: age, sex, primary cancer site and its metastasis, leg edema, and drowsiness.
As for leg edema, it is reported to be associated with survival time in the Palliative Prognostic Index (PPI). 28 Leg edema was categorized as being absent or present. Regarding drowsiness, we assumed that the symptom was associated with the consciousness level, which is the component of several prognostic tools such as the PPI and Palliative Performance Scale. 29 We objectively evaluated drowsiness by using the Integrated Palliative care Outcome Scale (IPOS). 30 The response scale consists of 5 options: 0, not at all; 1, slightly; 2, moderately; 3, severely; 4, overwhelmingly; and 5, cannot assess because of unconsciousness.
We divided drowsiness into two groups of absence and presence (0; not at all vs. 2 – 4, slightly to overwhelmingly). Patients having an IPOS score of 5 (unconsciousness) were excluded due to patient unavailability for assessment. The Japanese version of IPOS has been used as a valid and reliable tool for assessing physical, psychological, social, and spiritual symptoms and measuring the outcomes of adult cancer patients in Japan. 31 Meanwhile, the IPOS is currently undergoing validation in Korea.
We aimed to develop the modified OPS (mOPS) model to predict two-week survival, while OPS had been developed to predict three-week survival. We considered clinical implications of two-week survival as follows. Palliative clinicians meet patients and families who want prognostic information on the shorter time frame to prepare themselves. Most workplaces allow maximum leave of one to two weeks in Korea.
According to wider utilization of hospice services in Korea after legislation, some popular institutes restrict PCU stay to three weeks. Therefore, families and caregivers need information to prepare in advance. In addition, a previous study reported that the median time of terminal delirium was two weeks. 32
We aimed to develop two versions of the mOPS model; mOPS-A and mOPS-B. We aimed to produce mOPS-A with few laboratory tests and mOPS-B without any blood work. Thus, the model can be chosen according to users' circumstances. A statistically significant interaction (p < 0.001) was found between ECOG PS and elevated serum creatinine (s-creatinine), therefore we excluded the s-creatinine level in the mOPS-A version.
Instead of removing s-creatinine, we added leg edema as a new variable to reflect renal function and/or cachexia. As for mOPS-B, we removed all four laboratory values. We selected the drowsiness item from IPOS to complement laboratory test results. Drowsiness was reported to be associated with the prevalence of delirium in advanced cancer patients.33,34 Other variables were categorized according to definitions of components of the original OPS.
Statistical analyses
First, we randomly selected 70% of the total subjects, using the statistical function of SPSS. These subjects composed the training set to develop mOPS models.
Second, we tested the performance of two mOPS versions in the training set. We calculated areas under receiver operating characteristic curves (AUROCs) to assess the discriminative ability of the two mOPSs. Cutoff values were determined to maximize the true-positive rate and minimize the false-negative rate in mOPSs. Using cutoff values, we compared the accuracy of two-week survival prediction in mOPSs. We calculated overall accuracy (OA) by dividing the summation of true-positive and true-negative rates by total numbers.
In addition, we drew calibration plots of two mOPSs for observed and predicted probability of two-week survival using a logistic regression model. We calculated additive and absolute net reclassification indices (NRIs), replacing mOPS-A with mOPS-B, for two-week survival. 35 The additive NRI was calculated by summation of the percentage of patients experiencing an event and who are correctly reclassified and the percentage of patients who do not experience an event and who are correctly reclassified.
A positive value of the additive NRI indicates better reclassification of patients experiencing an event using newer prediction models and a negative value indicates worse reclassification. The absolute NRI calculates the absolute number of patients who were correctly reclassified: (net reclassification of patients with an event + net reclassification of patients without an event)/total number of patients. A major limitation of the additive NRI is that it does not consider the prevalence of events and nonevents in the population.
Therefore, if a prediction model does better among patients who experienced an event in a sample in which the number of patients with events is small, but worse in a sample in which the number of patients without events is large, the results could be misleading. The absolute NRI avoids this problem. 35 The absolute NRI can range from −100% to 100%, representing the proportion of patients who are incorrectly or correctly reclassified. A positive value of the absolute NRI indicates better overall reclassification and negative value indicates the worse one.
Third, validations of the mOPS models were performed in the testing set, that is, 30% of the total subjects who remained after random selection of the training set. AUROC, sensitivity, specificity, PPV, NPV, and OA were calculated for the two modified versions using the same cutoff values in the previous step. Calibration plots for two-week survival were drawn and NRIs were also calculated.
Fourth, we compared the accuracy of mOPS models with original OPSs in both training and testing sets. The original OPS was developed to predict three-week survival. Therefore, we compared the accuracy of three-week survival prediction using the original OPS and modified models. NRIs were yielded also with the assumption of replacement of the original OPS with mOPSs for three-week survival prediction.
Fifth, we compared the overall accuracy and discriminative ability of two mOPSs in patients with lung and digestive tract cancers in the training set because symptoms, signs, laboratory data, and survival can be dependent on their primary cancer.
Last, we compared survival time among higher score groups (poor survival) and lower score groups (better survival) using the original OPS and modified models using the log-rank test. All statistical analyses were performed using SPSS, version 26 (IBM Corp., Armonk, NY); p value below 0.05 was considered statistically significant.
Ethical statement
All study procedures for the EASED study were approved by the local Institutional Review Boards of all participating institutions. In accordance with the ethical guidelines for human research of the Ministry of Health, Labor, and Welfare in Japan, informed consent from patients was waived in Japan because of the completely observational nature of the study. In Korea, informed consent was obtained from patients or their families (in cases where the patient lacked the capacity to consent).
Results
Patient characteristics
A total of 2638 patients were enrolled across 38 PCUs (23 in Japan, 11 in South Korea, and 4 in Taiwan). The patients were enrolled from January 2017 to September 2018. We excluded 407 Taiwanese patients because the feasibility of OPS was quite low. There were many patients lacking laboratory test results, for instance, only 0.04% had serum LDH values and 37% had serum bilirubin data.
Among 2231 Japanese and Korean patients, 435 patients were excluded because of missing data on items of the OPS. Thus, a total of 1796 patients (Japan: 1529, and Korea: 267) were analyzed. Table 1 shows general characteristics of the total patients. Mean age of patients was 72 years and 51% were male. The most prevalent primary site of cancer was the lung (16%), colon/rectum (13%), stomach (11%), and pancreas (11%), prevalent in descending order.
General Characteristics of the Total Subjects (n = 1796)
Data are expressed as mean (standard deviation).
Reduced oral intake was defined as a few mouthfuls or less.
Drowsiness was evaluated using IPOS. Responses for drowsiness were divided into two categories: absence and presence (0; not at all vs. 2–4, slightly to overwhelmingly). An IPOS score of 5 (unconsciousness) was dealt as missing data.
Data are expressed as median value (interquartile range).
ECOG, Eastern Cooperative Oncology Group Performance Status; IPOS, Integrated Palliative care Outcome Scale; LDH, lactate dehydrogenase; OPS, objective prognostic score.
Most patients (88%) were confined to the bed for more than half a day according to ECOG PS. Subjects' median survival time was 19 (interquartile range, 8–45) days (Table 1).
Differences between the original OPS and mOPSs are presented in Table 2. Each item in the models has been allotted a score based on HRs derived from Cox's proportional hazards analysis.
Original Objective Prognostic Score and Modified Objective Prognostic Scores in the Training Set (Randomly Selected, 70% of the Total Sample, n = 1290)
Hazard ratio was derived from Cox regression analysis.
Reduced oral intake was defined as a few mouthfuls or less.
Drowsiness was evaluated by IPOS. We considered that patients showed drowsiness when the response of IPOS drowsiness was more severe than “slightly.” Unconsciousness response was excluded.
CI, confidence interval; HR, hazard ratio; LDH, lactate dehydrogenase; mOPS, modified objective prognostic score.
Comparison between mOPS-A and mOPS-B to predict two-week survival is presented in Table 3. Relatively good sensitivity, specificity, OA, and AUROC were shown in all modified models of training and testing sets. mOPS-B showed better sensitivity (0.721–0.725) compared with mOPS-A. On replacing mOPS-A with mOPS-B, the additive NRIs were −8.9 and −8.34 and absolute NRIs were −6.82% and −6.32% in training and testing sets, respectively.
Two-Week Survival Prediction Performance of Modified Objective Prognostic Scores in the Training Set and Testing Set
Original OPS: reduced oral intake+dyspnea at rest+ECOG 4+leukocytosis+elevated serum bilirubin+elevated serum LDH+elevated serum creatinine (range: 0–8 points).
Modified OPS-A: reduced oral intake+dyspnea at rest+ECOG 4+leg edema+leukocytosis+elevated serum bilirubin+elevated serum LDH (range: 0–6.5 points).
Modified OPS-B: reduced oral intake+dyspnea at rest+ECOG 4+leg edema+drowsiness (range: 0 − 4.0 points).
Reduced oral intake was defined as a few mouthfuls or less.
Drowsiness was evaluated by IPOS. We considered that patients showed drowsiness when the response of IPOS drowsiness was more severe than “slightly.” Unconsciousness response was excluded.
AUROC, area under receiver operating characteristic curve; NPV, negative predictive value; OA, overall accuracy; PPV, positive predictive value.
A negative value of additive NRI indicates worse reclassification ratio of patients using criteria of surviving for two weeks. Meanwhile, a negative absolute NRI value indicates overall worse reclassification, which is adjusted by the total number of patients. Namely, absolute NRI is a compensatory value of additive NRI just in case death events were small.
On substituting mOPS-A for the original OPS, additive NRIs were 5.77 and 7.46 and absolute NRIs were 3.26% and 4.15% in training and testing sets, respectively. In case of mOPS-B instead of the original OPS, additive NRIs were −1.28 and −0.36 and absolute NRIs were 0.47% and 1.78%, respectively. A positive additive NRI value indicated better reclassification and positive absolute NRI value showed better overall reclassification of patients using the new prediction models (Table 4).
Net Reclassification Indices of Modified Objective Prognostic Score and Original Objective Prognostic Score
Original OPS: reduced oral intake+dyspnea at rest+ECOG 4+leukocytosis+elevated serum bilirubin+elevated serum LDH+elevated serum creatinine (range: 0–8 points).
Modified OPS-A: reduced oral intake+dyspnea at rest+ECOG 4+leg edema+leukocytosis+elevated serum bilirubin+elevated serum LDH (range: 0–6.5 points).
Modified OPS-B: reduced oral intake+dyspnea at rest+ECOG 4+leg edema+drowsiness (range: 0 − 4.0 points).
Additive NRI: (net reclassification/total number of patients with an event) × 100 + (net reclassification/total number of patients without an event) × 100.
Absolute NRI: (net reclassification of patients with an event + net reclassification of patients without an event)/total number of patients × 100.
NRI, net reclassification index.
Figure 1 shows calibration plots. Observed and predicted probability values for less than two-week survival were approximately concordant across all score ranges of mOPSs in both training and testing sets.
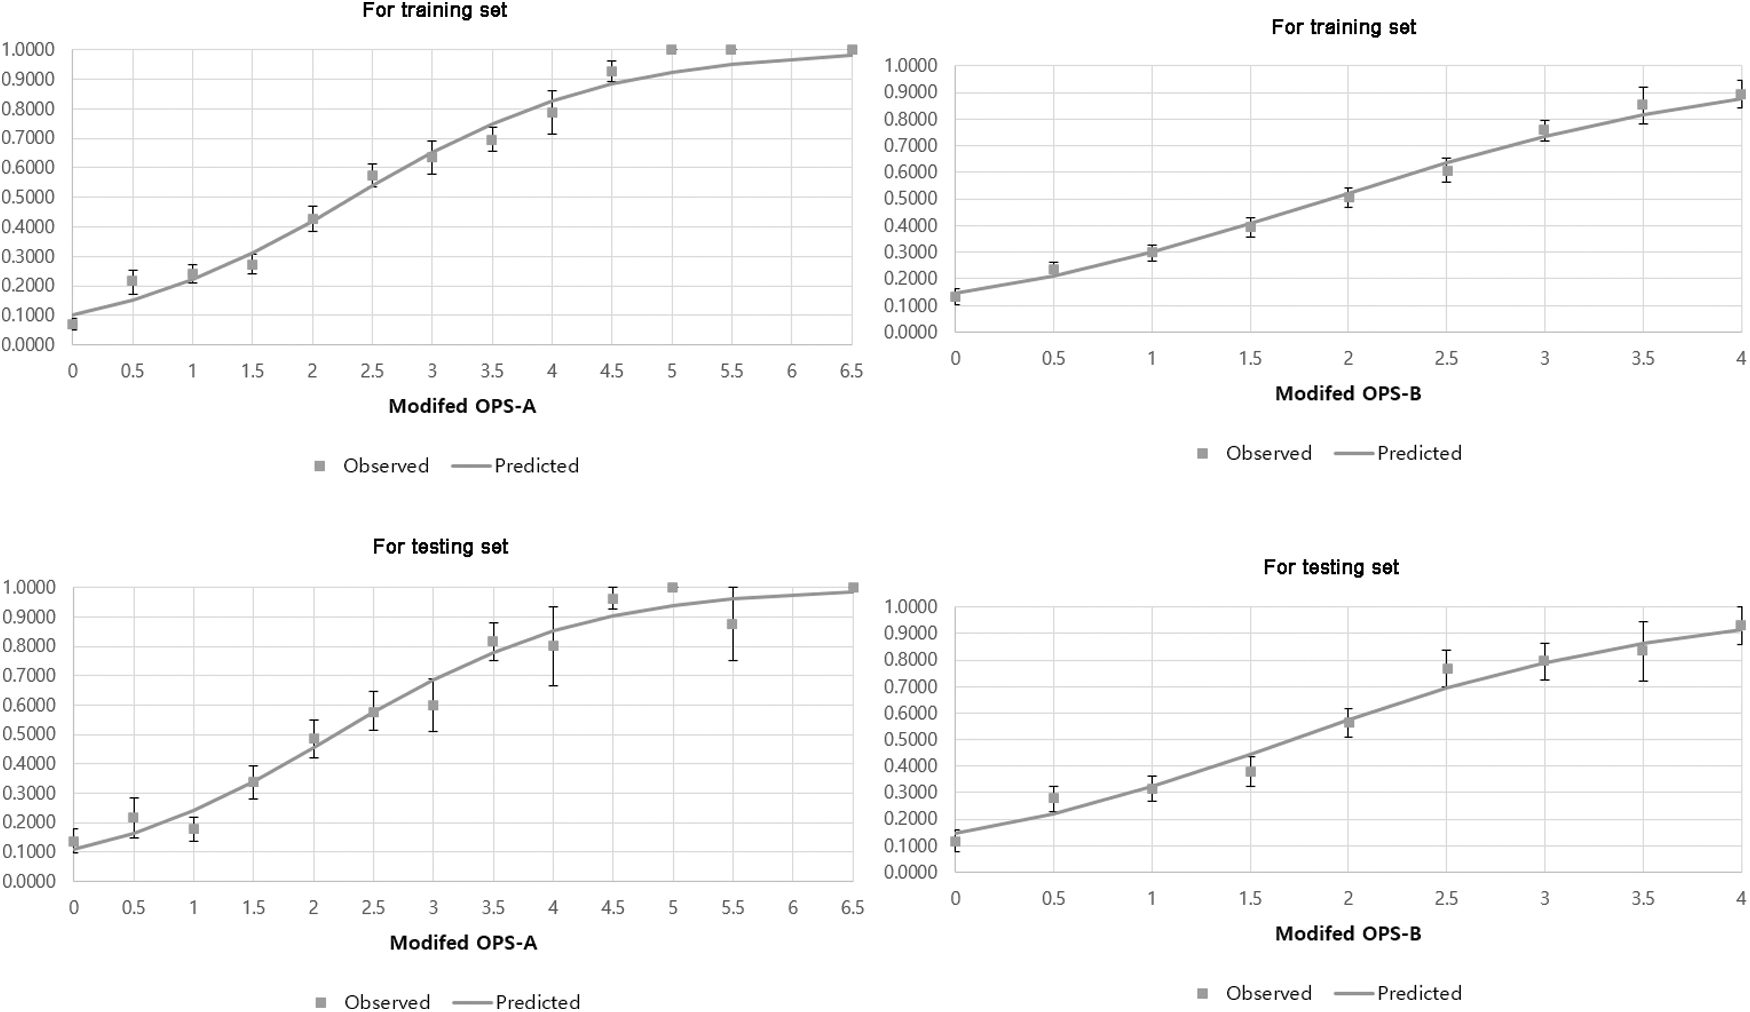
Calibration plots of modified OPSs in training and testing sets. The x axis indicates the total score of each prognostic score and y axis indicates the probability of survival of <2 weeks. mOPS-A: reduced oral intake+dyspnea at rest+ECOG 4+leg edema+leukocytosis+elevated serum bilirubin+elevated serum LDH mOPS-B: reduced oral intake+dyspnea at rest+ECOG 4+leg edema+drowsiness. Training set: randomly selected, 70% of the total sample, n = 1290. Testing set: 30% of the total subjects who remained after random selection of the training set, n = 506. ECOG, Eastern Cooperative Oncology Group Performance Status; LDH, lactate dehydrogenase; mOPS-A, modified objective prognostic score-A.
In Figure 2, higher and lower score groups of all original OPS and modified models show significantly different survival times in both training and testing sets (p < 0.001). Two-week survival probabilities of higher score groups of mOPS-A (≥2.5) and mOPS-B (≥1.5) were 0.309 and 0.428, respectively, in the training set. In addition, those probabilities were similar (0.270 and 0.406, respectively) for higher score groups in mOPS-A and mOPS-B in the testing set.
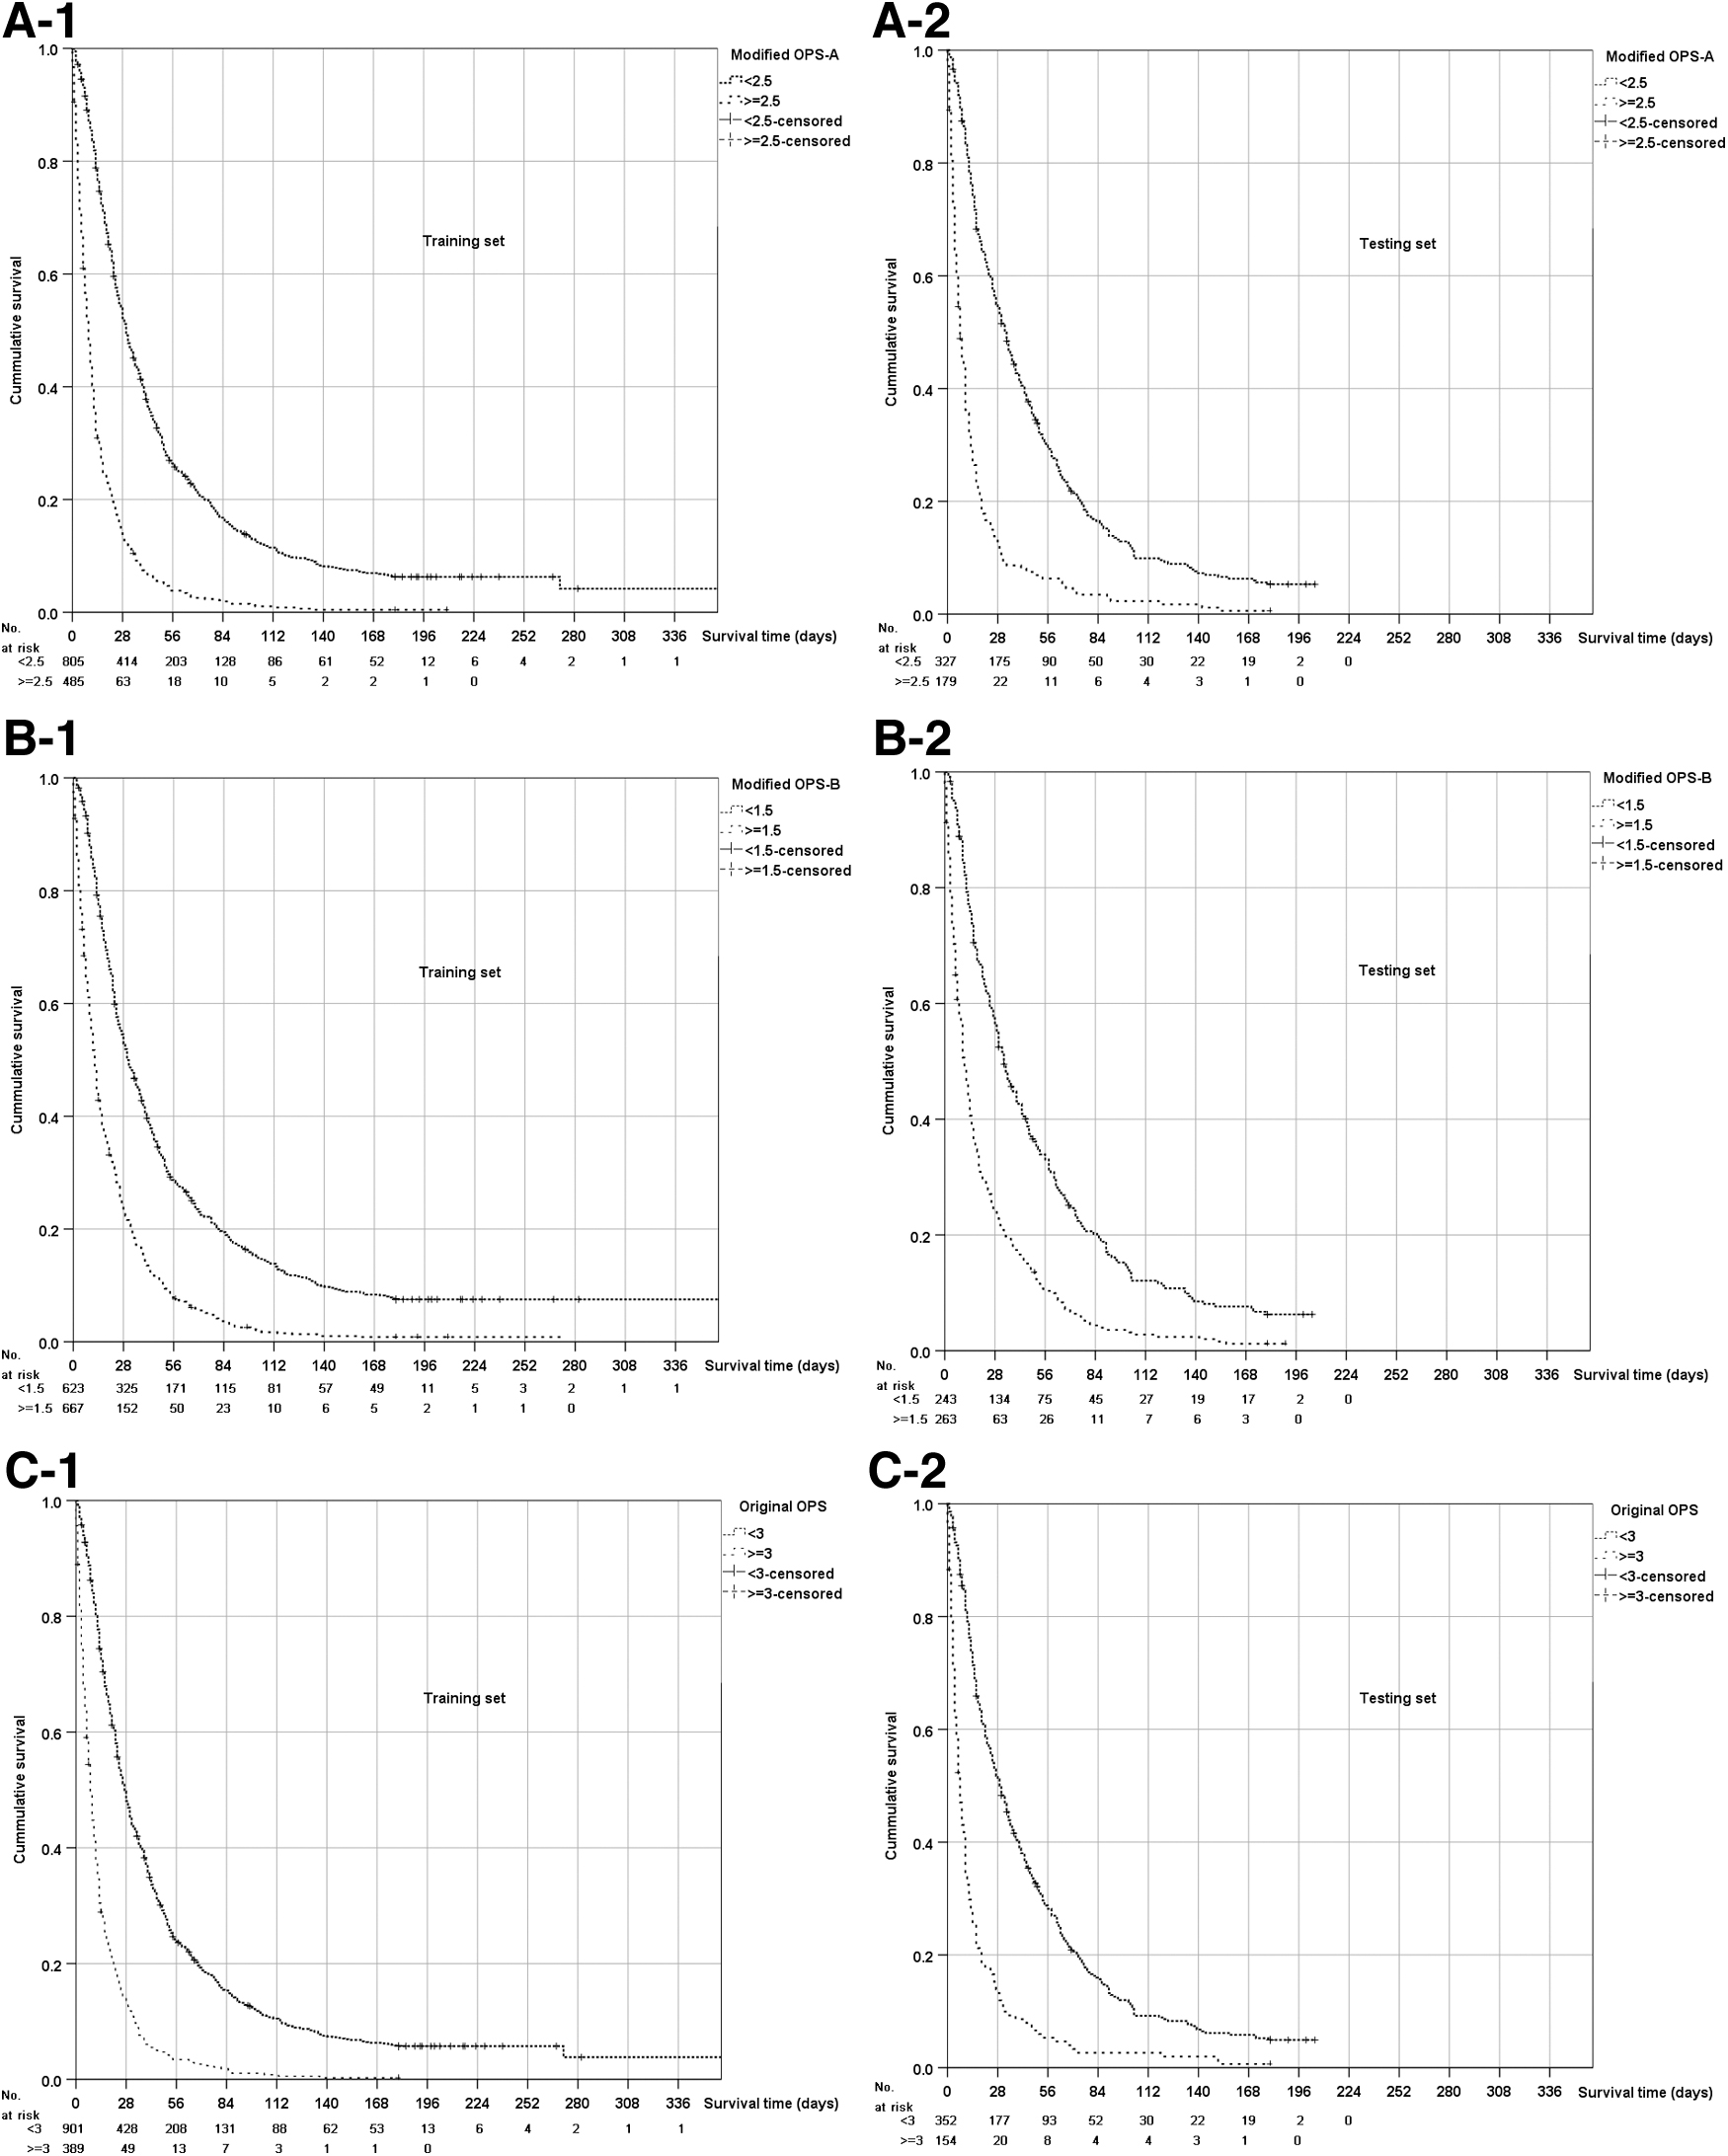
Comparisons of survival times between the higher score group and lower score group of the original OPS and mOPSs.
Supplementary Table S1 shows a comparison of accuracy of three-week survival prediction using original OPS and modified models in training and testing sets.
Two-week survival prediction performance of mOPSs according to primary cancer is shown in Supplementary Table S2. mOPSs showed relatively good OA and AUROCs for lung and digestive tract cancers. mOPS-B showed better sensitivity and mOPS-A showed better specificity in subgroups, which are similar to the total study population findings. mOPS-A and B performed relatively better in patients with lung cancer compared with patients with digestive tract cancer.
Discussion
We successfully developed and validated two versions of mOPS in Japan and Korea. Both the modified models showed good accuracy for predicting two-week survival in inpatients with advanced cancer at PCUs. We found that mOPS-A (with three laboratory test results) showed higher specificity and higher AUROCs.
In contrast, mOPS-B (without any laboratory values) showed higher sensitivities and acceptable AUROCs. We reduced the laboratory variables of mOPS-A to three, compared with the original OPS with four laboratory values. To account for the reduction in laboratory data, leg edema was added in the mOPS-A version.
On the other hand, mOPS-B was developed without any blood work to make it more easy to use. Two mOPSs showed good concordance in calibration plots. Considering NRIs, replacing the original OPS with mOPSs improved overall reclassification of patients. Therefore, we recommend that clinicians choose mOPS-A or mOPS-B according to patients' situations.
If patients and families have a keen interest in prognostic information and there are available laboratory data, then clinicians can make use of mOPS-A. mOPS-B would be useful when palliative patients with advanced cancer become too emaciated to draw blood samples.
Surprisingly, both mOPS-A and mOPS-B had similar accuracy (around 75% of AUROCs in the three-week time frame) to that of the original OPS (Supplementary Table S1) and also improved overall reclassification. Considering that they had limited or no laboratory data, our findings were beyond expectations. Possible explanations are as follows.
First, all mOPS models have items representing progression of the cancer anorexia–cachexia syndrome (CACS) and dyspnea. CACS and dyspnea are known to be closely related with poor survival.36–38 Therefore, mOPS models may show good prognostic performance, which is partly attributed to the symptoms and functional status. However, specificity of mOPS models was lower than that of the original OPS.
Second, leg edema was added in both mOPS-A and mOPS-B. Edema of lower extremities was one of the most prevalent symptoms associated with digestive tract cancer in palliative inpatients in East Asia. 39 Thus, we assumed that leg edema provided additional prognostic accuracy to mOPSs. As for mOPS-B, drowsiness was added to complement the absence of laboratory results. A relatively high proportion of our advanced cancer patients admitted to PCUs had drowsiness (64.8%).
Considering its acceptable accuracy and good sensitivity, we think that adding these symptoms exerted a screening role in mOPS-B. One may raise questions about whether mOPSs can perform differently according to the type of primary cancer in patients. However, our subanalyses showed that the accuracy of mOPSs is acceptable across different categories of primary cancers (Supplementary Table S2).
mOPS-A still requires laboratory values such as bilirubin, LDH, and leukocytosis. The prognostic role of bilirubin and LDH has been repeatedly demonstrated in several publications.40–42 Leukocytosis is evaluated with PaP and the Barretos Prognostic Nomogram, 43 both prognostic scores cover various ranges of survival in patients with advanced cancer. Thus, mOPS-A could show acceptable accuracy in estimating a few weeks of survival in patients with advanced cancer.
Notably, higher specificity was one of the characteristics of mOPS-A with laboratory data. Meanwhile, sensitivity was lower in mOPS-A compared with mOPS-B. However, discriminative accuracy represented by AUROCs showed similar ranges in both mOPS-A and mOPS-B. mOPS-A showed >80% specificity in predicting two-week survival (Table 3), namely a higher OPS-A would be useful for predicting death within two weeks.
Patients and families may need this timing information to arrange their business affairs or avail leave from their jobs to be with their loved ones at the very end of life. Two weeks may be an important time frame in terms of being cognitively competent to say goodbye to families since there is a study that reported two weeks as the median time of terminal delirium in Korea. 32 Inpatients of PCUs usually undergo blood tests at admission as a part of routine care.
Worse laboratory results indicate organ failure. Therefore, if laboratory data are available, it would be helpful for clinicians to communicate with patients and their families about the remaining time. The original OPS also showed good specificity for predicting three-week survival. Thus, both the original OPS and mOPS-A could be good prognostic tools to predict death within a very short time.
As for mOPS-B, it has the advantages of not requiring any laboratory value. mOPS-B showed higher sensitivity than that of mOPS-A. Therefore, a lower mOPS-B score would help to predict survival (patient is likely to be alive in 2 weeks), whereas higher scores of mOPS-A would be useful to predict death within two weeks (patient is likely to die within 2 weeks).
We suggest using mOPS-B as a screening tool for clinicians to decide when to admit PCUs or start end-of-life discussions before it is too late. It consists of mostly clinical signs and symptoms, thus making it easier to use in the palliative care field. Another simple clinical implication is using survival probability. Each higher score group of mOPS-A and mOPS-B has approximately 30% and 40% of two-week survival probability, respectively (Fig. 2). In the near future, we plan to incorporate mOPSs into a web-based prognosticator to increase clinical applicability of our indices.
This study has some limitations. First, enrolled patients were admitted in PCUs in Japan and Korea. Thus, our findings may not be applicable to other settings of palliative care or other countries with different medical circumstances.
Second, the median survival time of enrolled patients was relatively short [19.0 (17.53–2.47) days]. mOPSs need further evaluation in patients with advanced cancer having longer survival.
Third, mOPSs are made using cohorts of two Far East Asian populations. Therefore, further validation of mOPSs in other regions will be needed.
Our study's strength is that it is based on a large-scale, prospective cohort study across two countries. mOPS models have undergone two-step validation (development and validation in training and testing sets, respectively) using this study population. Our results highlighted higher specificity of the prognostic score with more laboratory data and higher sensitivity of the prognostic score with reduced laboratory data. The two models had similar discriminative accuracy.
A comparison of mOPSs with other established prognostic indices is needed in the near future. For instance, the PaP can be a good comparison target because PaP includes CPS. Other well-validated indices such as PPI and/or performance status PPI (PS-PPI) 44 can also be good comparison candidates. One may raise questions in terms of the similarity of components of mOPS-B to PS-PPI. However, the drowsiness item of mOPS-B is easier to evaluate than the communication capacity scale of PS-PPI.
Another notable distinction is the time frame. mOPS-B aims to predict two-week survival, meanwhile PS-PPI predicts survival of three weeks. To the best of our knowledge, predictive models for two-week survival are scarce. We suggest investigating each mOPS version in terms of clinical outcomes. In particular, future studies can demonstrate whether prognostic disclosure using mOPSs will enhance understanding and satisfaction of patients and families.
In conclusion, we reduced the laboratory data and added clinical symptoms/signs for mOPSs, which had relatively good accuracy for predicting survival in advanced cancer patients receiving palliative care. The mOPS-A with three laboratory results had higher specificity, and mOPS-B without laboratory results showed higher sensitivity.
Therefore, we recommend that clinicians choose mOPS-A or mOPS-B according to their clinical situation.
Key Message
Our results indicated that the new prognostic score without laboratory data has higher sensitivity and the prognostic score with more laboratory data has higher specificity through the modification process of the objective prognostic score (OPS). Clinicians can choose modified OPS-A or modified OPS-B according to their clinical situation.
Footnotes
Authors' Contributions
S.J.Y., S.Y.S., S.Y.C., M.M., and T.M. were involved in conceptualization. S.J.Y., S.Y.S., Y.H., S.E.C., and H.Y.A. were involved in methodology. S.E.C. and H.Y.A. were involved in validation. S.H.K., S.J.K., S.A.P., J.Y.S., J.H.K., J.P., Y.P., S.W.H., E.S.L., S.Y.C., P.J.C., T.Y., S.T., and M.M. were involved in investigation. S.J.Y. was involved in writing—original draft. S.Y.S., Y.H., and M.M. were involved in writing—review and editing. S.Y.S. and T.M. were involved in supervision.
Funding Information
This work was supported, in part, by a grant-in-aid from the Japanese Hospice Palliative Care Foundation (grant nos. 16H05212 and 16KT0007).
Author Disclosure Statement
No competing financial interests exist.
References
Supplementary Material
Please find the following supplemental material available below.
For Open Access articles published under a Creative Commons License, all supplemental material carries the same license as the article it is associated with.
For non-Open Access articles published, all supplemental material carries a non-exclusive license, and permission requests for re-use of supplemental material or any part of supplemental material shall be sent directly to the copyright owner as specified in the copyright notice associated with the article.